Download - Investor Presentation - American Axle

Investor Presentation
December 20201
This presentation contains forward-looking statements within the meaning of the Private Securities Litigation Reform Act of 1995. These forward-
looking statements involve certain risks and uncertainties that could cause actual results to differ materially from those expressed or implied by these
statements. These risks and uncertainties include uncertainty around the duration and effects of the COVID-19 pandemic, and include factors detailed
in the reports we file with the SEC, including those described under “Risk Factors” in our most recent Annual Report on Form 10-K and our Quarterly
Reports on Form 10-Q. These forward-looking statements speak only as of the date of this communication. We expressly disclaim any obligation or
undertaking to disseminate any updates or revisions to any forward-looking statement contained herein to reflect any change in our expectations with
regard thereto or any change in events, conditions or circumstances on which any such statement is based.
It should also be noted that this presentation contains certain financial measures, including Adjusted EBITDA, Adjusted Earnings per Share, Adjusted
Free Cash Flow, Net Leverage Ratio and Liquidity that are not required by, or presented in accordance with, accounting principles generally accepted in
the United States, or GAAP. These measures are presented here to provide additional useful measurements to review our operations, provide
transparency to investors and enable period-to-period comparability of financial performance. A description of non-GAAP financial measures that we
use to evaluate our operations and financial performance, and reconciliation of these non-GAAP financial measures to the most directly comparable
financial measures calculated and reported in accordance with GAAP, can be found in the appendix under “Reconciliation of Non-GAAP Measures”.
Forward Looking Statements
2

Agenda
3
▪ AAM Overview
▪ Growth Opportunities in Electrification
▪ Financial Highlights
▪ ESG Update

AAM Overview

About AAM
As a leading, global tier 1 automotive supplier,
AAM designs, engineers and manufactures
driveline and metal forming technologies that are
making the next generation of vehicles smarter,
lighter, safer and more efficient
AAM delivers POWER that moves the world
through world-class quality, technology leadership
and operational excellence16
ENGINEERING CENTERS
Over
60MANUFACTURING
FACILITIES
5
17COUNTRIES
2019 SALES
$6.5B
Approximately
20,000ASSOCIATES
Nearly
80LOCATIONS

Business Units and Market Leadership
DRIVELINE METAL FORMING
• 2019 Sales - $4.6B
• A Global Leader in
• Full-size pickup truck and SUV
driveline systems
• AWD systems for crossover
vehicles
• Damped gears, viscous dampers
and rubber isolation pulleys
• Pioneer of disconnecting AWD
Systems
• One of the leaders in hybrid and
electric driveline solutions
• 2019 Sales - $1.8B
• Largest automotive forger in the
world
• A Global Leader in
• Powdered metal connecting rods
• Differential gears
• Axle shafts
• Hypoid pinions
• Ring gears
• Transmission gears
• CVT pulleys
• Aluminum valve bodies
*Note: Market leadership based on company estimates as compared to other independent supplier., business unit sales before eliminations of intercompany sales of approximately $0.5 billion. 6
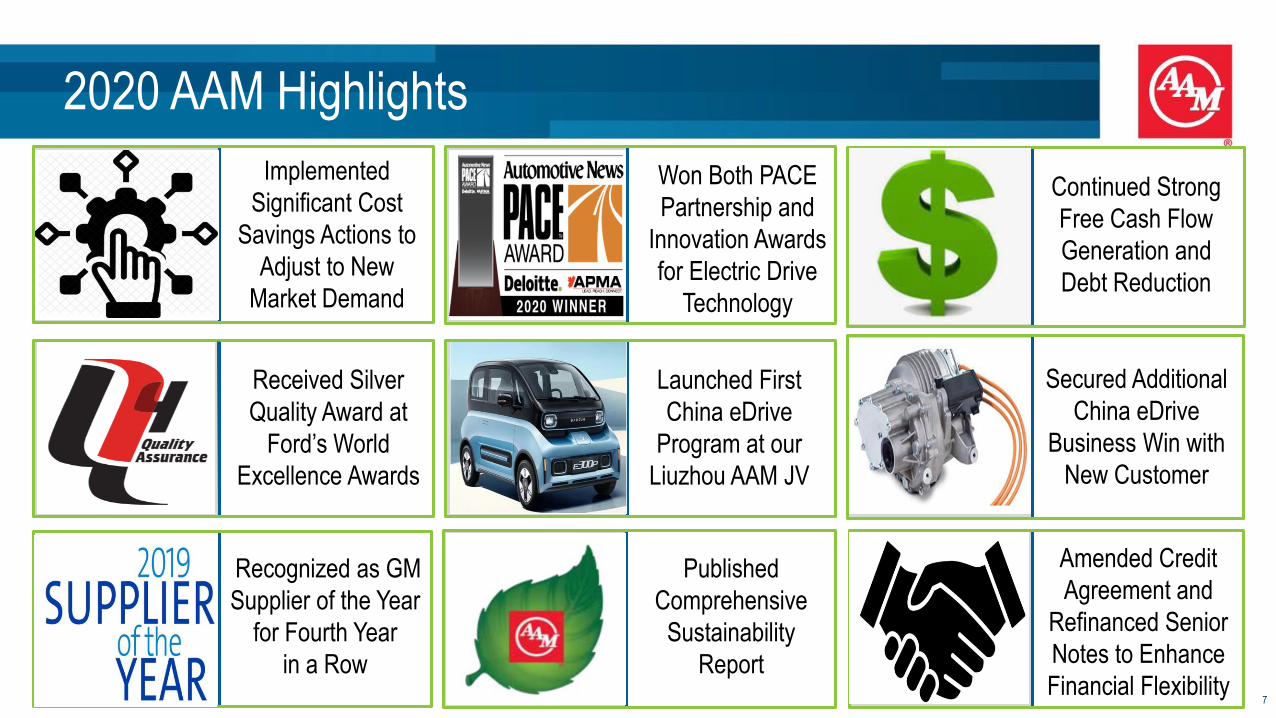
2020 AAM Highlights
7
Recognized as GM
Supplier of the Year
for Fourth Year
in a Row
BITDA*
Continued Strong
Free Cash Flow
Generation and
Debt Reduction
Secured Additional
China eDrive
Business Win with
New Customer
Published
Comprehensive
Sustainability
Report
Amended Credit
Agreement and
Refinanced Senior
Notes to Enhance
Financial Flexibility
Launched First
China eDrive
Program at our
Liuzhou AAM JV
Received Silver
Quality Award at
Ford’s World
Excellence Awards
Won Both PACE
Partnership and
Innovation Awards
for Electric Drive
Technology
Implemented
Significant Cost
Savings Actions to
Adjust to New
Market Demand
7

Growth Opportunities in Electrification

Electrification Opportunities
Electrification Is A Growing Portion Of Our Quoting and Emerging New Business Opportunities
We Are Well Positioned To Meet Our Customers’ Needs
OEM E-Drive Outsourcing
AAM CPV: Up to $2,500+
Vehicle Integration Electric Drive Units
OEM E-Drive In-Sourcing
AAM CPV: Up to $500
Gear BoxesePowertrain Components
9

Electrification Opportunities
10
Passenger Car* Light Truck*
Vehicle Small Mid-Size Luxury Crossover Large SUV/Truck
Current Booked
Business
Baojun (E300 Plus) Multiple Chinese
OEMs
Premium European
OEM
Jaguar (I-PACE) North American
OEM
Platform P4 (E-Drive) P4 (E-Drive) P3 Hybrid (E-Drive) P4 (E-Drive) P4 (Sub-Assembly)
* AAM supplies EDUs, gearboxes, sub-assemblies, and gear components for electric vehicles. Chart shows current wins and targeted segments.
AAM Serves All Key Electrification Markets

AAM eDrive Next Gen Product Summary
11
▪ AAM is designing highly integrated advanced technology high speed eDrive units
to deliver substantial improvements over currently available units
▪ Targeted Benefits:
– >20% improvement in volume*
– >20% improvement in mass*
– World class efficiency and NVH
*For comparable power levels.
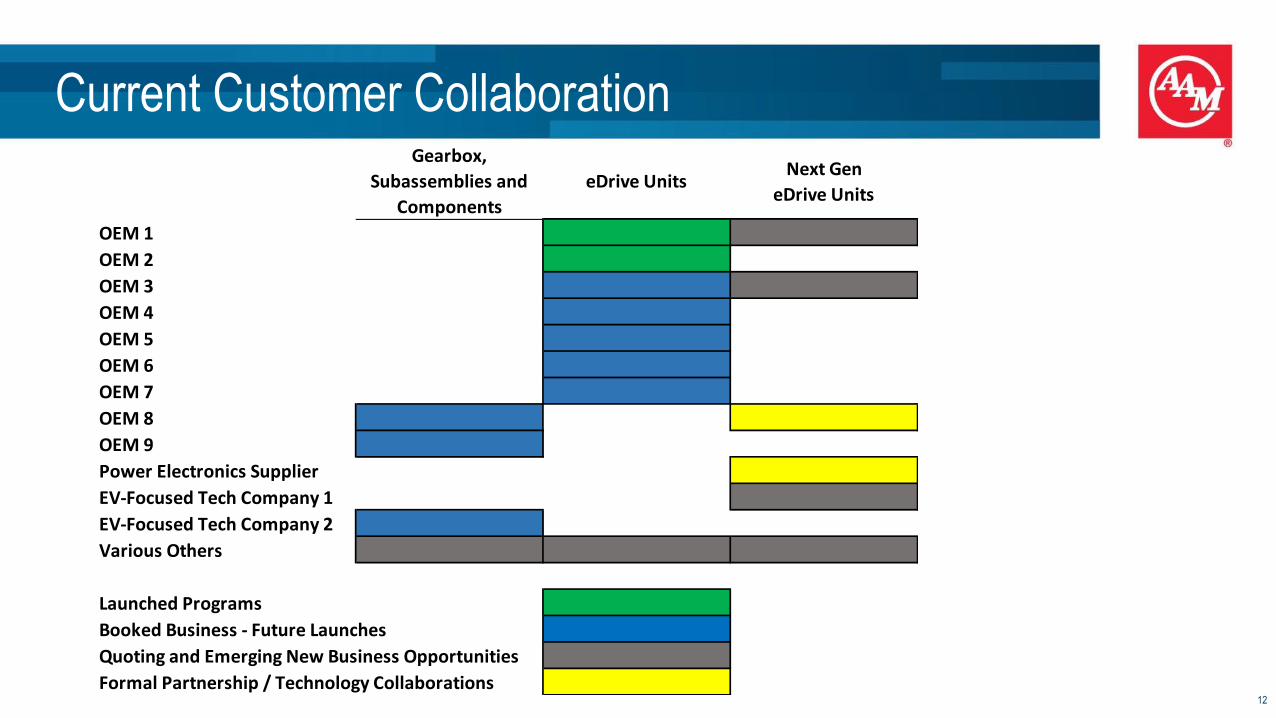
Current Customer Collaboration
12
Gearbox,
Subassemblies and
Components
eDrive UnitsNext Gen
eDrive Units
OEM 1
OEM 2
OEM 3
OEM 4
OEM 5
OEM 6
OEM 7
OEM 8
OEM 9
Power Electronics Supplier
EV-Focused Tech Company 1
EV-Focused Tech Company 2
Various Others
Launched Programs
Booked Business - Future Launches
Quoting and Emerging New Business Opportunities
Formal Partnership / Technology Collaborations

3Q 2020 Highlights and Updated 2020 Targets
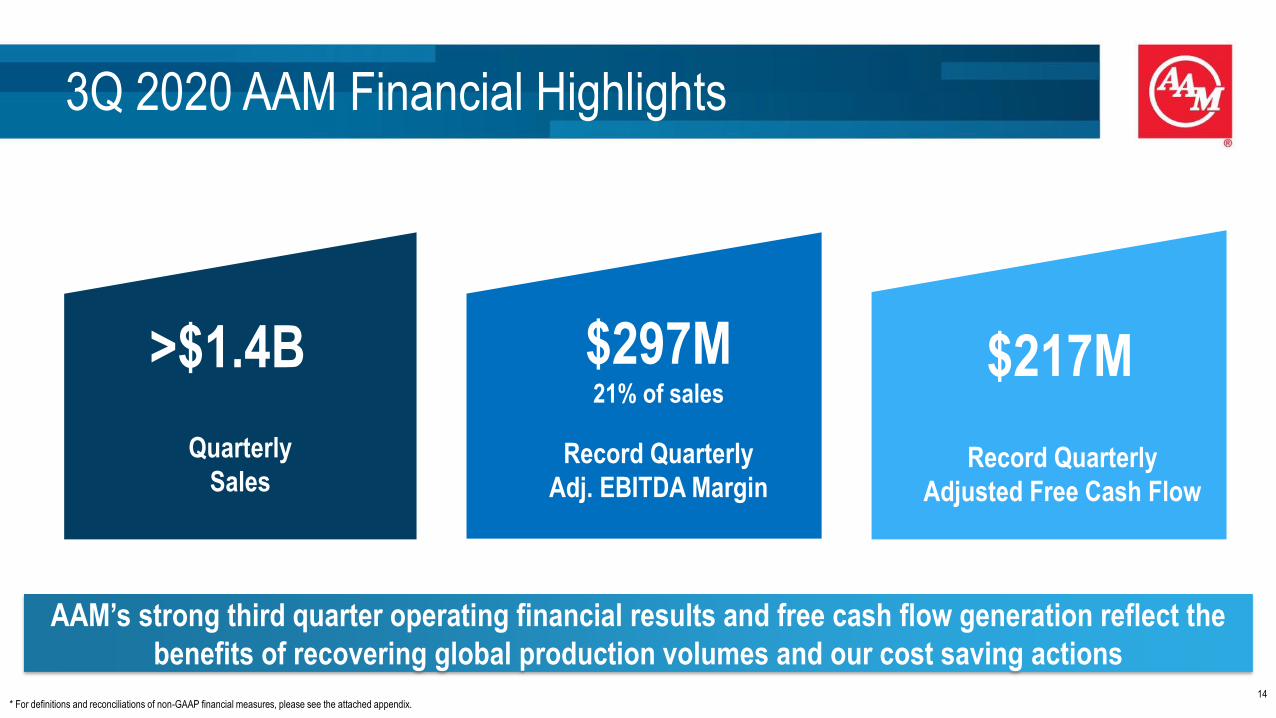
3Q 2020 AAM Financial Highlights
* For definitions and reconciliations of non-GAAP financial measures, please see the attached appendix. 14
Quarterly
Sales
>$1.4B $217M
Record Quarterly
Adjusted Free Cash Flow
$297M21% of sales
Record Quarterly
Adj. EBITDA Margin
AAM’s strong third quarter operating financial results and free cash flow generation reflect the
benefits of recovering global production volumes and our cost saving actions

Revised 2020 Financial Outlook as disclosed on October 30, 2020
Revised 2020 Financial Targets
Full Year Sales ≈ $4.6 billion
Adjusted EBITDA $665 - $680 million
Adjusted Free Cash Flow $220 - $235 million
* For definitions of Adjusted EBITDA and Adjusted Free Cash Flow and Non-GAAP reconciliations, please see the attached appendix
• AAM’s updated 2020 full year financial targets are based on current customer
schedules and assume that there are no significant impacts to our expected
production or costs related to COVID-19 or the recent fire at our Malvern
Manufacturing Facility through the remainder of 2020
• AAM expects restructuring and acquisition-related cash payments to be between
$55 and $70 million15

Adjusted Free Cash Flow and Credit Profile
16
Cash Flow and Debt Metrics 3Q 2020
Adjusted Free Cash Flow $217.2 million
Net Debt $3.0 billion
Net Leverage Ratio 4.7x
Liquidity $1.48 billion
* For definitions and reconciliations of non-GAAP financial measures, please see the attached appendix.
In 3Q 2020, AAM prepaid $350 million of Senior Notes due 2022

Downside Protection Playbook
17
Sales Decline
Duration Expected
0% 25%+
Short LongerReduce Variable Costs
• Direct Material (≈60% of COGS)
• Hourly Headcount
• Variable Overhead
Reduce Semi-fixed Costs
• Salaried headcount, merit and incentive compensation adjustments/deferrals
• Formal spending reduction programs (ex. travel)
• Align future R&D, project and capital expenses to lower sales levels
Select Recapacitating of Facilities
• Align capacity with customers
• Plant loading adjustments to optimize capacity
Structural Capacity and Overhead Reduction
• Global footprint consolidations
• Significant Salaried Reduction in Force programs
Restructuring Costs
Required?
No
Limited
Moderate
Higher
AAM is analyzing its full playbook and in process with many actions across its global operations
Potential Actions
Note: This list includes examples for illustrative purposes and does not include all potential actions
AND / OR

Debt Maturity Profile
18
Average life of Senior Debt
nearly 5 years
Next maturity in 2024
Options for cost-efficient
prepayments

ESG Update

Sustainability Update
20
In 2020, AAM published a comprehensive sustainability report (available on www.aam.com/sustainability)
In a survey conducted
by Institutional
Investor, our
Financially Material
ESG Disclosures were
ranked 1st out of 80+
nominated Small-cap
Consumer companies

Sustainability Leadership and Oversight
21
AAM's sustainability program is managed within a well-defined governance structure, through clearly-
established ownership and responsibilities at multiple levels in the organization.

Sustainability: Key Areas of Focus
22
Our cross-functional team of subject matter experts considered Global Reporting Initiative (GRI) standards,
industry-specific standards of the Sustainability Accounting Standards Board (SASB) and the United Nations
Sustainable Development Goals to prioritize sustainability topics and develop performance indicators

Why AAM?
23
▪ Experienced and proven management team
▪ Strong core business focused on high demand products, complimented by global profitable growth opportunities
▪ Flexible and variable cost structure with a proven track record of effectively adjusting our business to current market demand
▪ Superior profit margin and strong free cash flow yield driven by AAM’s operating system and the benefit of vertical integration
▪ Highly innovative and scalable electrification propulsion technologies designed to accelerate growth and serve multiple regions, customers and vehicle segments


Supplemental Data

Reconciliation of Non-GAAP Measures
26
In addition to the results reported in accordance with accounting principles generally accepted in the United States of America (GAAP) included within this presentation, we have provided certain information, which includes non-GAAP financial measures. Such information is reconciled to its closest GAAP measure in accordance with Securities and Exchange Commission rules and is included in the following slides.
Certain of the forward-looking financial measures included in this earnings release are provided on a non-GAAP basis. A reconciliation of non-GAAP forward-looking financial measures to the most directly comparable forward-looking financial measures calculated and presented in accordance with GAAP has been provided. The amounts in these reconciliations are based on our current estimates and actual results may differ materially from these forward-looking estimates for many reasons, including potential event driven transactional and other non-core operating items and their related effects in any future period, the magnitude of which may be significant.

3Q 2020 Year-Over-Year Sales Walk(in millions)
27
$1,677
$1,522
$1,414($155)
$57
($87) ($15)($55)
$17
($10) ($15)
3Q 2019 Sales Sale of U.S.Casting
3Q 2019 SalesPro forma for
U.S. Casting Sale
3Q 2019 GMWork Stoppage
COVID-19Related
GM Thailand Exit Transition toIRDA's for GM'sNew Full-Size
SUV
Other Volume &Mix
Pricing Metal Market &Fx
3Q 2020 Sales

3Q 2020 Year-over-Year Adjusted EBITDA Walk(in millions)
28* For definitions and reconciliations of non-GAAP financial measures, please see the attached appendix.
$266 $260
$297
($6)
$18
($16)
($10)($10)
$8
$22
($3)
$24 $4
3Q 2019Adjusted EBITDA
3Q 2019 U.S.Casting EBITDA
3Q 2019 Adj.EBITDA Pro
forma for U.S.Casting Sale
3Q 2019 GM WorkStoppage
Lower SalesRelated toCOVID-19
Other Volume &Mix
Pricing Metal Market & Fx Customer ED&DReimbursementand Commercial
SettlementTiming
COVID-19 costs Cost ReductionActions
Performanceand Other
3Q 2020Adjusted EBITDA
Supplemental Data
29
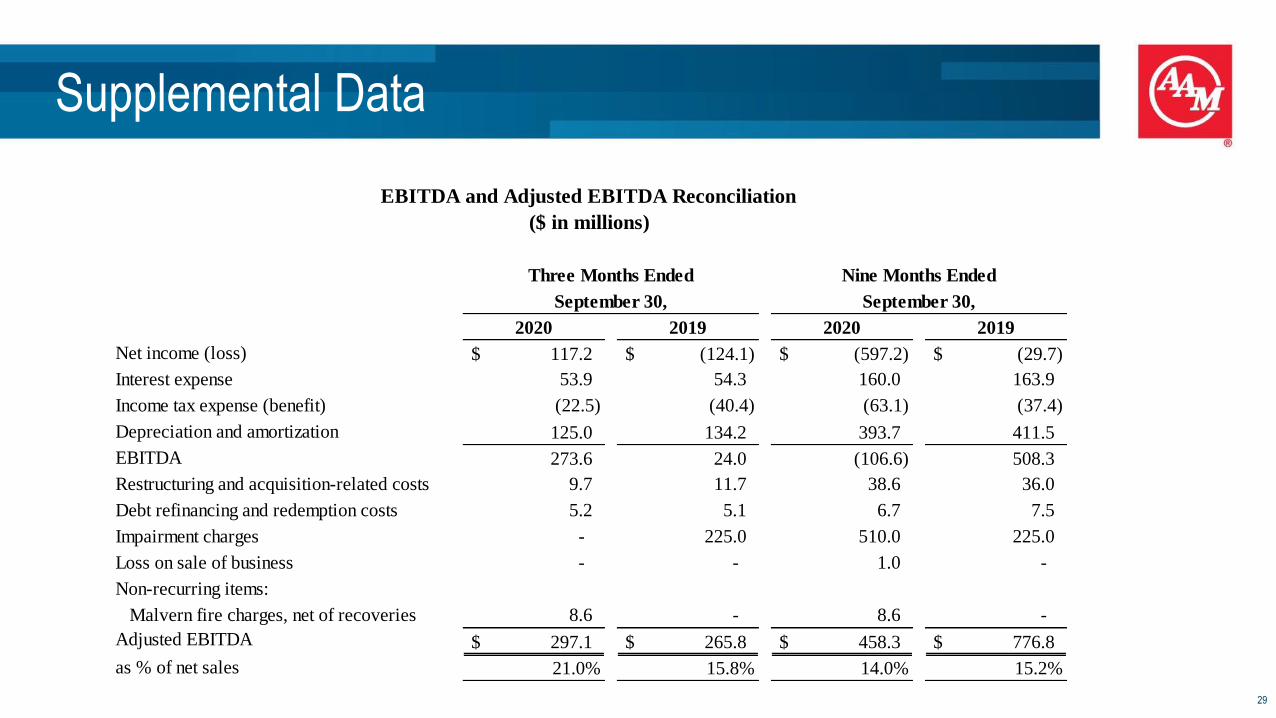
2020 2019 2020 2019
Net income (loss) $ 117.2 $ (124.1) $ (597.2) $ (29.7)
Interest expense 53.9 54.3 160.0 163.9
Income tax expense (benefit) (22.5) (40.4) (63.1) (37.4)
Depreciation and amortization 125.0 134.2 393.7 411.5
EBITDA 273.6 24.0 (106.6) 508.3
Restructuring and acquisition-related costs 9.7 11.7 38.6 36.0
Debt refinancing and redemption costs 5.2 5.1 6.7 7.5
Impairment charges - 225.0 510.0 225.0
Loss on sale of business - - 1.0 -
Non-recurring items:
Malvern fire charges, net of recoveries 8.6 - 8.6 -
Adjusted EBITDA $ 297.1 $ 265.8 $ 458.3 $ 776.8
as % of net sales 21.0% 15.8% 14.0% 15.2%
September 30, September 30,
Three Months Ended Nine Months Ended
EBITDA and Adjusted EBITDA Reconciliation
($ in millions)

Supplemental Data
30
Trailing
Twelve
Months Ended
December 31, March 31, June 30, September 30, September 30,
2019 2020 2020 2020 2020
Net income (loss) $ (454.4) $ (501.2) $ (213.2) $ 117.2 $ (1,051.6)
Interest expense 53.4 51.5 54.6 53.9 213.4
Income tax expense (benefit) (11.5) 3.3 (43.9) (22.5) (74.6)
Depreciation and amortization 125.4 129.6 139.1 125.0 519.1
EBITDA (287.1) (316.8) (63.4) 273.6 (393.7)
Restructuring and acquisition-related costs 21.8 17.6 11.3 9.7 60.4
Debt refinancing and redemption costs 0.9 1.5 - 5.2 7.6
Impairment charges 440.0 510.0 - - 950.0
Pension settlement 9.8 - - - 9.8
Loss on sale of business 21.3 1.0 - - 22.3
Non-recurring items:
Gain on bargain purchase of business (10.8) - - - (10.8)
Malvern fire charges, net of recoveries - - - 8.6 8.6
Other (2.4) - - - (2.4)
Adjusted EBITDA $ 193.5 $ 213.3 $ (52.1) $ 297.1 $ 651.8
as % of net sales 13.5% 15.9% -10.1% 21.0% 13.9%
($ in millions)
EBITDA and Adjusted EBITDA for the Trailing Twelve Months Ended September 30, 2020
Quarter Ended

Supplemental Data
31
Adjusted earnings (loss) per share are based on weighted average diluted shares outstanding of 118.4 million and 115.8 million for the three months ended on September 30, 2020 and 2019,
respectively, and 113.0 million and 115.6 million for the nine months ended on September 30, 2020 and 2019, respectively.
2020 2019 2020 2019
Diluted earnings (loss) per share $ 0.99 $ (1.10) $ (5.28) $ (0.27)
Restructuring and acquisition-related costs 0.08 0.10 0.34 0.32
Debt refinancing and redemption costs 0.05 0.05 0.06 0.07
Impairment charges - 2.00 4.51 2.00
Loss on sale of business - - 0.01 -
Non-recurring items:
Malvern fire, net of recoveries 0.07 - 0.08 -
Adjustment to liability for unrecognized tax benefits - - (0.06) -
Tax adjustments related to the CARES Act and Tax Cuts and Jobs Act - - (0.07) (0.08)
Other - - 0.14 -
Tax effect of adjustments (0.04) (0.45) (0.12) (0.50)
Adjustment for anti-dilutive effect - (0.02) - (0.05)
Adjusted earnings (loss) per share $ 1.15 $ 0.58 $ (0.39) $ 1.49
Three Months Ended
September 30,
Nine Months Ended
September 30,
Adjusted Earnings (Loss) Per Share Reconciliation

Supplemental Data
32
2020 2019 2020 2019
Net cash provided by operating activities $ 249.5 $ 241.7 $ 246.4 $ 378.6
Less: Capital expenditures net of proceeds from sale of property,
plant and equipment (40.5) (97.5) (144.7) (333.3)
Free cash flow 209.0 144.2 101.7 45.3
Cash payments for restructuring and acquisition-related costs 8.2 16.3 37.0 46.0
Adjusted Free Cash Flow $ 217.2 $ 160.5 $ 138.7 $ 91.3
Free Cash Flow and Adjusted Free Cash Flow Reconciliation
September 30,
Three Months Ended Nine Months Ended
September 30,
($ in millions)

Supplemental Data
33
September 30,
2020
Current portion of long-term debt $ 26.5
Long-term debt, net 3,555.4
Total debt, net 3,581.9
Less: Cash and cash equivalents 537.3
Net debt at end of period 3,044.6
Adjusted LTM EBITDA $ 651.8
Net Leverage Ratio 4.7
Net Debt and Net Leverage Ratio
($ in millions)

Supplemental Data
34
Low End High End
Net loss (617) (602)
Income tax benefit (70) (70)
Interest expense 215 215
Depreciation and amortization 525 525
Full year 2020 targeted EBITDA 53 68
Impairment charges 510 510
Restructuring and acquisition-related costs 85 85
Debt refinancing and redemption costs 7 7
Non-recurring charges and other 10 10
Full year 2020 targeted Adjusted EBITDA $ 665 $ 680
Adjusted EBITDA
Full Year 2020 Outlook
($ in millions)
Supplemental Data
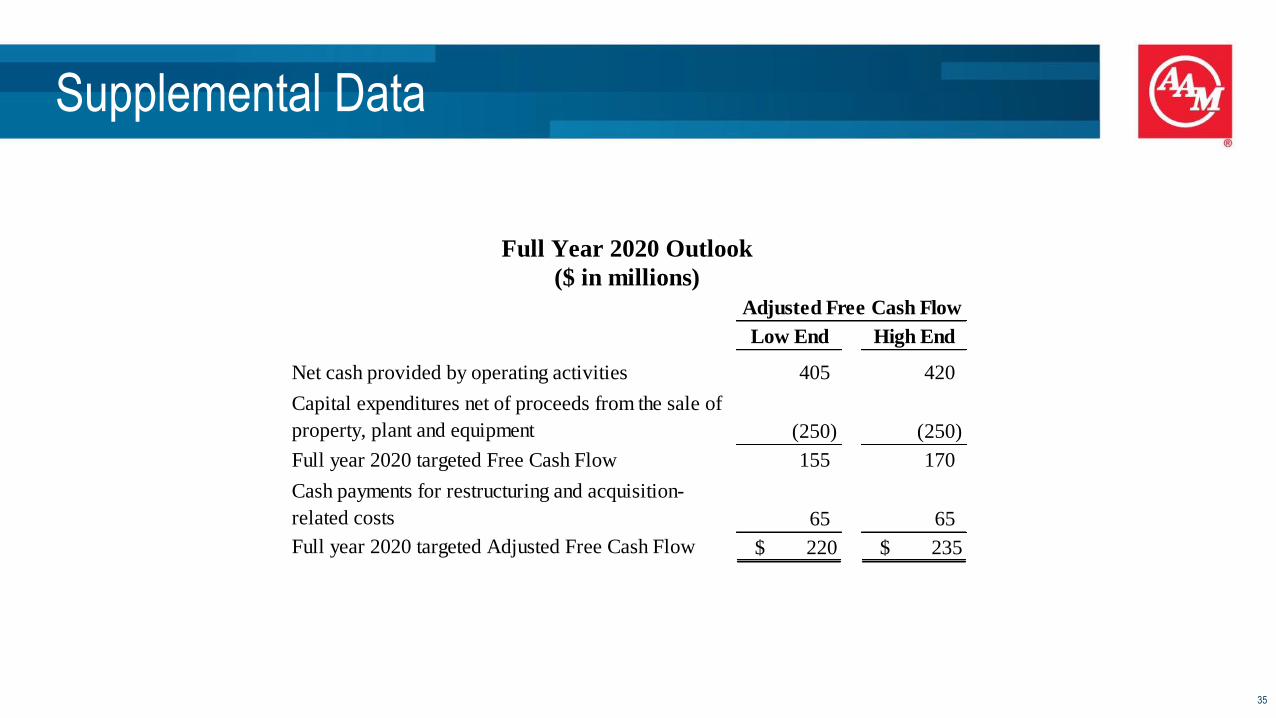
35
Low End High End
Net cash provided by operating activities 405 420
Capital expenditures net of proceeds from the sale of
property, plant and equipment (250) (250)
Full year 2020 targeted Free Cash Flow 155 170
Cash payments for restructuring and acquisition-
related costs 65 65
Full year 2020 targeted Adjusted Free Cash Flow $ 220 $ 235
Adjusted Free Cash Flow
Full Year 2020 Outlook
($ in millions)

Definition of Non-GAAP Measures
36
EBITDA and Adjusted EBITDA
We define EBITDA to be earnings before interest expense, income taxes, depreciation and amortization. Adjusted EBITDA is defined as EBITDA excluding the impact of restructuring and acquisition-
related costs, debt refinancing and redemption costs, loss on sale of a business, impairment charges, pension settlements and non-recurring items. We believe that EBITDA and Adjusted EBITDA are
meaningful measures of performance as they are commonly utilized by management and investors to analyze operating performance and entity valuation. Our management, the investment community and
the banking institutions routinely use EBITDA and Adjusted EBITDA, together with other measures, to measure our operating performance relative to other Tier 1 automotive suppliers. We also use
Segment Adjusted EBITDA as the measure of earnings to assess the performance of each segment and determine the resources to be allocated to the segments. EBITDA and Adjusted EBITDA should not
be construed as income from operations, net income or cash flow from operating activities as determined under GAAP. Other companies may calculate EBITDA and Adjusted EBITDA differently.
Adjusted Earnings (Loss) Per Share
We define Adjusted earnings (loss) per share to be diluted earnings per share excluding the impact of restructuring and acquisition related costs, debt refinancing and redemption costs, loss on sale of a
business, impairment charges, and non-recurring items, including the tax effect thereon. We believe Adjusted earnings (loss) per share is a meaningful measure as it is commonly utilized by management
and investors in assessing ongoing financial performance that provides improved comparability between periods through the exclusion of certain items that management believes are not indicative of core
operating performance and which may obscure underlying business results and trends. Other companies may calculate Adjusted earnings (loss) per share differently.
Free Cash Flow and Adjusted Free Cash Flow
We define free cash flow to be net cash provided by (used in) operating activities less capital expenditures net of proceeds from the sale of property, plant and equipment. Adjusted free cash flow is
defined as free cash flow excluding the impact of cash payments for restructuring and acquisition-related costs. We believe free cash flow and Adjusted free cash flow are meaningful measures as they are
commonly utilized by management and investors to assess our ability to generate cash flow from business operations to repay debt and return capital to our stockholders. Free cash flow and Adjusted free
cash flow are also key metrics used in our calculation of incentive compensation. Other companies may calculate free cash flow and Adjusted free cash flow differently.
Net Debt and Net Leverage Ratio
We define net debt to be total debt, net less cash and cash equivalents. We define Net Leverage Ratio to be net debt divided by the trailing 12 months of Adjusted EBITDA. We believe that Net Leverage
Ratio is a meaningful measure of financial condition as it is commonly used by management, investors and creditors to assess capital structure risk. Other companies may calculate Net Leverage Ratio
differently.
Liquidity
We define Liquidity as cash on hand plus amounts available on our revolving credit facility and foreign credit facilities.
US SAAR
We define US SAAR as the seasonally adjusted annual rate of light vehicle sales in the United States.
Other
Other includes the accelerated depreciation for certain assets that will be idled as a result of our largest customer exiting their operations in Thailand, which they announced in 2020.


