INVESTOR’S GUIDE: THE NEW ZEALAND FOOD & BEVERAGE INDUSTRY 2014February 2014
1
AN INVESTOR’S GUIDE TO THE NEW ZEALAND FOOD & BEVERAGE INDUSTRY
Part of the New Zealand Government’s Food & Beverage Information Project; Feb 2014
www.foodandbeverage.govt.nz
iFAB 2014Photo credit: New Zealand Story
iFAB 2014
The objective of this document is to make a strong, factual case for investment in the New Zealand food and beverage industry
- This investment can come from existing investors or those new to the sector
- This investment can come from global sources or New Zealand
The document acts as an “entry portal” to the wealth of further information available in on the sector in the New Zealand Government’s Food & Beverage Information Project
www.foodandbeverage.govt.nz
iFAB 2014
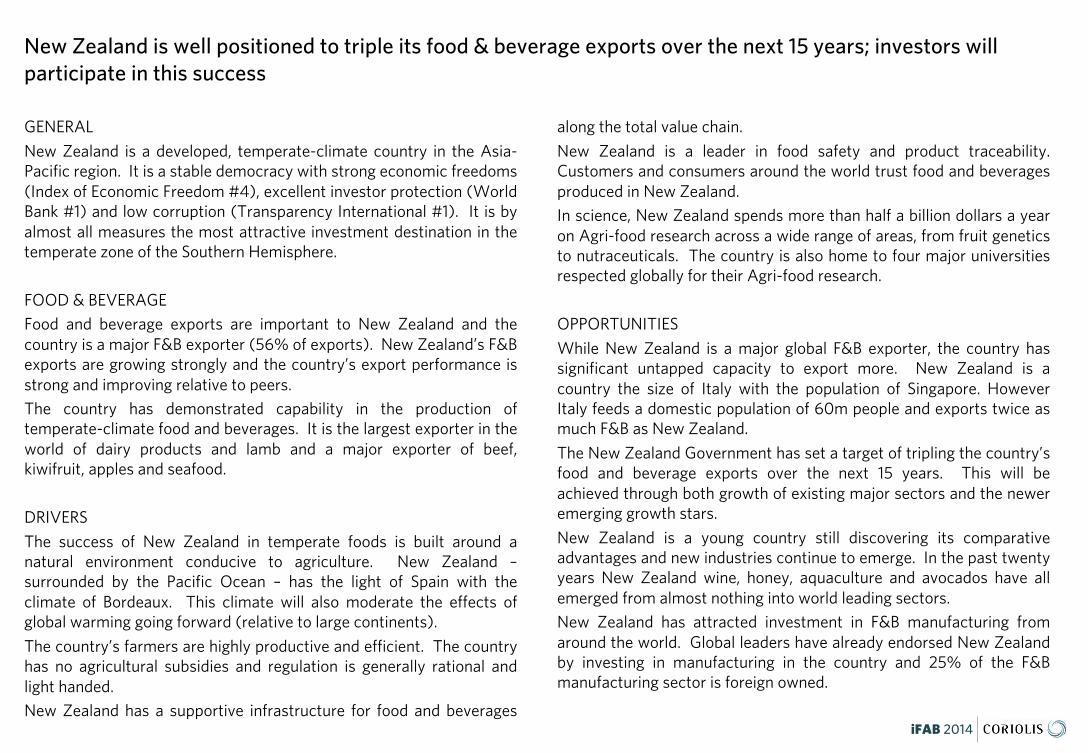
New Zealand is well positioned to triple its food & beverage exports over the next 15 years; investors will participate in this success
GENERAL
New Zealand is a developed, temperate-climate country in the Asia-Pacific region. It is a stable democracy with strong economic freedoms(Index of Economic Freedom #4), excellent investor protection (WorldBank #1) and low corruption (Transparency International #1). It is byalmost all measures the most attractive investment destination in thetemperate zone of the Southern Hemisphere.
FOOD & BEVERAGEFood and beverage exports are important to New Zealand and thecountry is a major F&B exporter (56% of exports). New Zealand’s F&Bexports are growing strongly and the country’s export performance isstrong and improving relative to peers.The country has demonstrated capability in the production oftemperate-climate food and beverages. It is the largest exporter in theworld of dairy products and lamb and a major exporter of beef,kiwifruit, apples and seafood.
DRIVERS
The success of New Zealand in temperate foods is built around anatural environment conducive to agriculture. New Zealand –surrounded by the Pacific Ocean – has the light of Spain with theclimate of Bordeaux. This climate will also moderate the effects ofglobal warming going forward (relative to large continents).
The country’s farmers are highly productive and efficient. The countryhas no agricultural subsidies and regulation is generally rational andlight handed.New Zealand has a supportive infrastructure for food and beverages
along the total value chain.
New Zealand is a leader in food safety and product traceability.Customers and consumers around the world trust food and beveragesproduced in New Zealand.In science, New Zealand spends more than half a billion dollars a yearon Agri-food research across a wide range of areas, from fruit geneticsto nutraceuticals. The country is also home to four major universitiesrespected globally for their Agri-food research.
OPPORTUNITIES
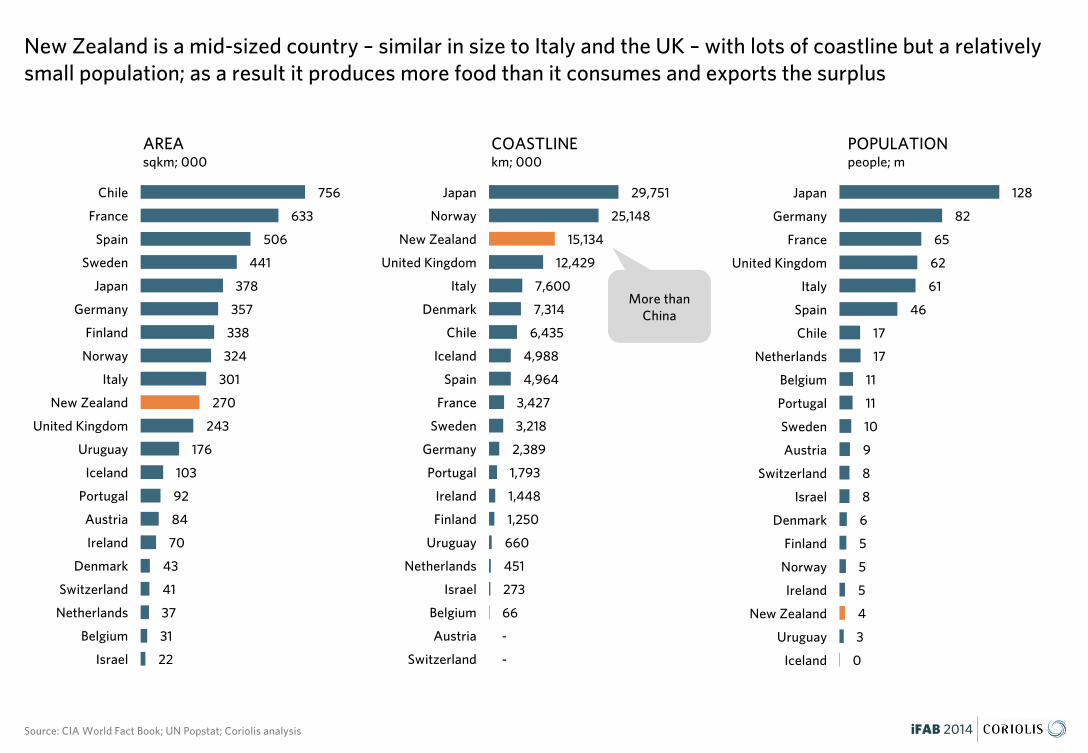
While New Zealand is a major global F&B exporter, the country hassignificant untapped capacity to export more. New Zealand is acountry the size of Italy with the population of Singapore. HoweverItaly feeds a domestic population of 60m people and exports twice asmuch F&B as New Zealand.
The New Zealand Government has set a target of tripling the country’sfood and beverage exports over the next 15 years. This will beachieved through both growth of existing major sectors and the neweremerging growth stars.
New Zealand is a young country still discovering its comparativeadvantages and new industries continue to emerge. In the past twentyyears New Zealand wine, honey, aquaculture and avocados have allemerged from almost nothing into world leading sectors.New Zealand has attracted investment in F&B manufacturing fromaround the world. Global leaders have already endorsed New Zealandby investing in manufacturing in the country and 25% of the F&Bmanufacturing sector is foreign owned.

iFAB 2014
4.5m people 0.06% of the world
267,710km2 in area Similar to Italy
15,134km coastline More than China
16.6 people/km2500x less than Singapore
US$171b GDP Similar to Kuwait
$38,255 GDP/capita Similar to Hong Kong
NZ$1 dollar US$0.83
Index of Economic Freedom #4 Above Switzerland
Corruption Perceptions Index #1 Tied with Denmark
World Bank Investor Protection #1 Above Singapore
New Zealand is a developed, temperate-climate country in the Asia-Pacific region that is an attractive investment destination
BIGGER… than you think
iFAB 2014
iFAB 2014
New Zealand is a mid-sized country – similar in size to Italy and the UK – with lots of coastline but a relatively small population; as a result it produces more food than it consumes and exports the surplus
Source: CIA World Fact Book; UN Popstat; Coriolis analysis
756
633
506
441
378
357
338
324
301
270
243
176
103
92
84
70
43
41
37
31
22
Chile
France
Spain
Sweden
Japan
Germany
Finland
Norway
Italy
New Zealand
United Kingdom
Uruguay
Iceland
Portugal
Austria
Ireland
Denmark
Switzerland
Netherlands
Belgium
Israel
POPULATIONpeople; m
128
82
65
62
61
46
17
17
11
11
10
9
8
8
6
5
5
5
4
3
0
Japan
Germany
France
United Kingdom
Italy
Spain
Chile
Netherlands
Belgium
Portugal
Sweden
Austria
Switzerland
Israel
Denmark
Finland
Norway
Ireland
New Zealand
Uruguay
Iceland
AREAsqkm; 000
29,751
25,148
15,134
12,429
7,600
7,314
6,435
4,988
4,964
3,427
3,218
2,389
1,793
1,448
1,250
660
451
273
66
-
-
Japan
Norway
New Zealand
United Kingdom
Italy
Denmark
Chile
Iceland
Spain
France
Sweden
Germany
Portugal
Ireland
Finland
Uruguay
Netherlands
Israel
Belgium
Austria
Switzerland
COASTLINEkm; 000
More than China
iFAB 2014
Food & Beverage
56%
Other44%
TOTAL NZ MERCHANDISE EXPORT VALUE%; 2012
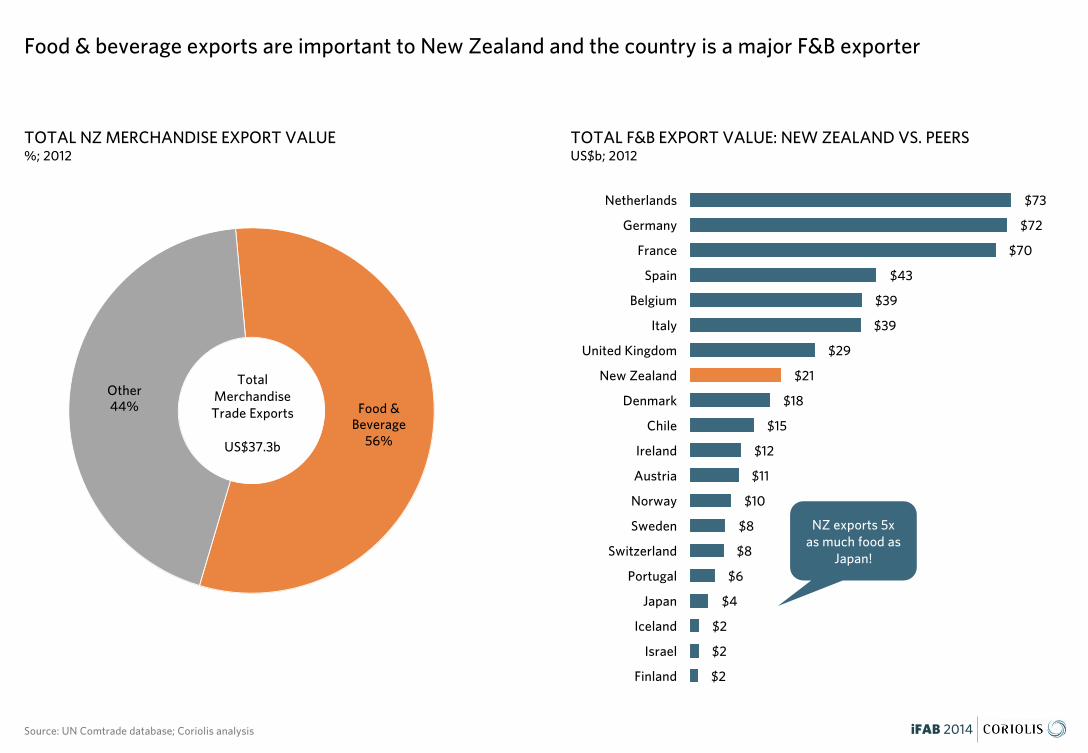
Food & beverage exports are important to New Zealand and the country is a major F&B exporter
Source: UN Comtrade database; Coriolis analysis
TOTAL F&B EXPORT VALUE: NEW ZEALAND VS. PEERS US$b; 2012
NZ exports 5x as much food as
Japan!
Total Merchandise Trade Exports
US$37.3b
$73
$72
$70
$43
$39
$39
$29
$21
$18
$15
$12
$11
$10
$8
$8
$6
$4
$2
$2
$2
Netherlands
Germany
France
Spain
Belgium
Italy
United Kingdom
New Zealand
Denmark
Chile
Ireland
Austria
Norway
Sweden
Switzerland
Portugal
Japan
Iceland
Israel
Finland
iFAB 2014
$3.0
$10.2
$2.1
$4.4
$0.7
$1.2
$0.7
$1.6
$0.0
$0.2
$0.4
$1.7
$0.1
$0.3
$0.2
$1.3
2002 2012
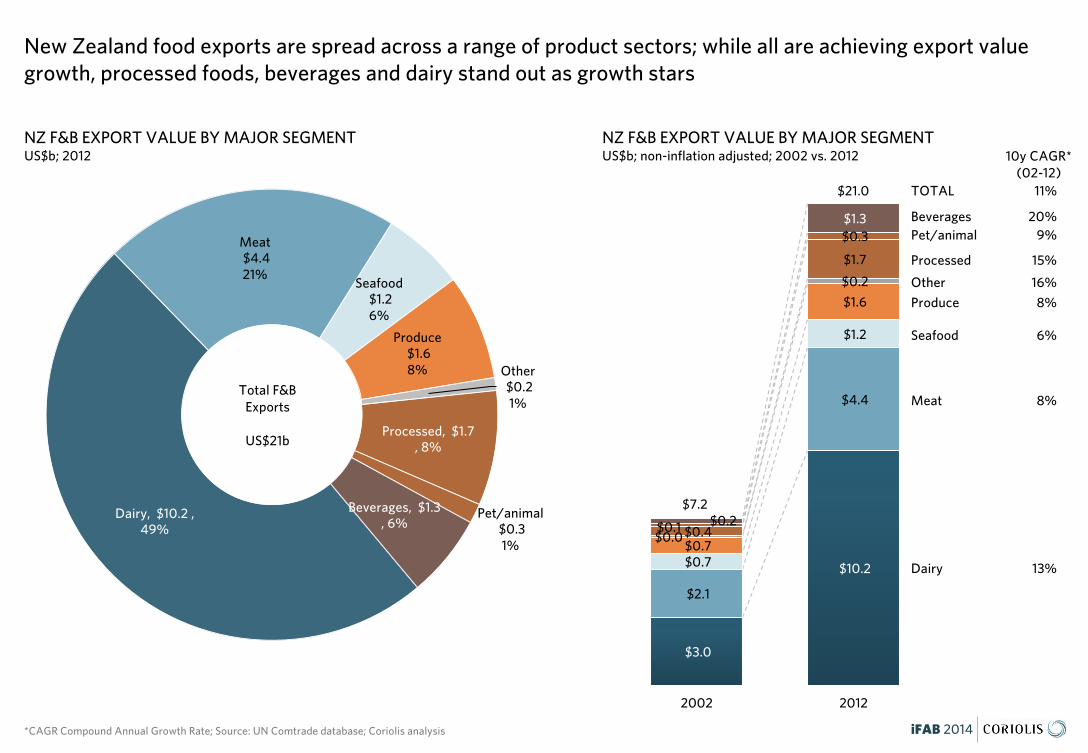
NZ F&B EXPORT VALUE BY MAJOR SEGMENTUS$b; 2012
New Zealand food exports are spread across a range of product sectors; while all are achieving export value growth, processed foods, beverages and dairy stand out as growth stars
*CAGR Compound Annual Growth Rate; Source: UN Comtrade database; Coriolis analysis
Dairy
NZ F&B EXPORT VALUE BY MAJOR SEGMENTUS$b; non-inflation adjusted; 2002 vs. 2012
Meat
Seafood
Produce
Other
Processed
Beverages
$21.0
$7.2
13%
8%
6%
8%
16%
15%
9%
10y CAGR*(02-12)
20%
Dairy, $10.2 , 49%
Meat$4.4 21%
Seafood$1.2 6%
Produce$1.6 8% Other
$0.2 1%
Processed, $1.7 , 8%
Pet/animal$0.3 1%
Beverages, $1.3 , 6%
Total F&B Exports
US$21b
Pet/animal
TOTAL 11%
iFAB 2014
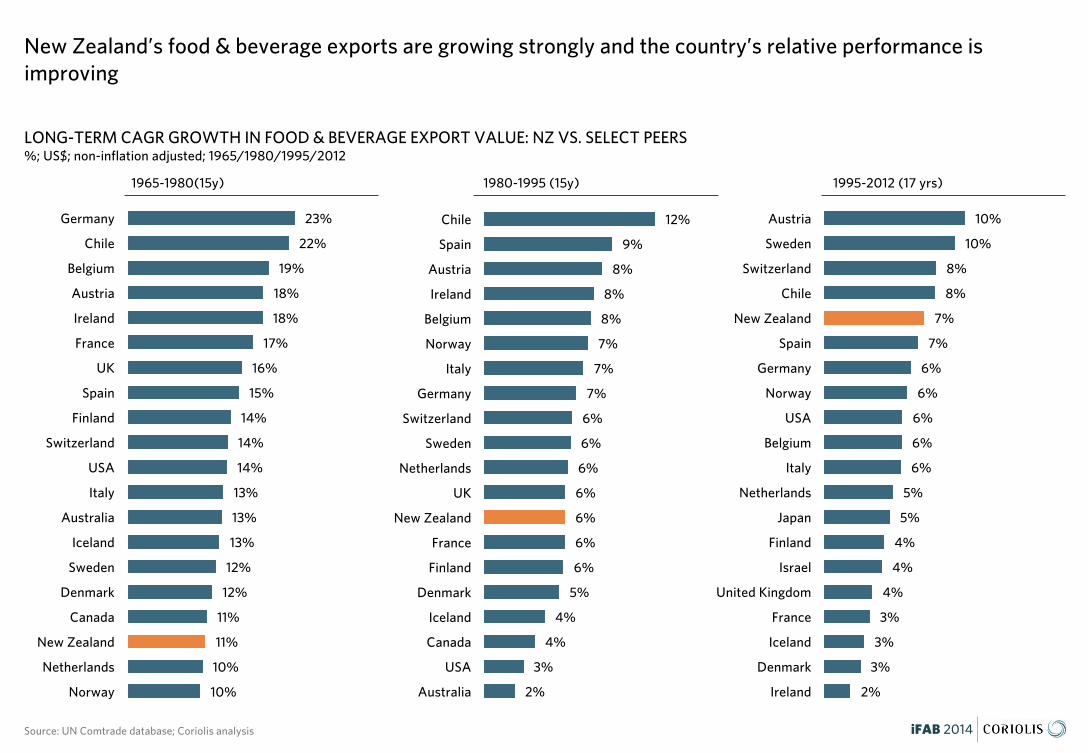
LONG-TERM CAGR GROWTH IN FOOD & BEVERAGE EXPORT VALUE: NZ VS. SELECT PEERS%; US$; non-inflation adjusted; 1965/1980/1995/2012
New Zealand’s food & beverage exports are growing strongly and the country’s relative performance is improving
Source: UN Comtrade database; Coriolis analysis
1965-1980(15y) 1980-1995 (15y) 1995-2012 (17 yrs)
23%
22%
19%
18%
18%
17%
16%
15%
14%
14%
14%
13%
13%
13%
12%
12%
11%
11%
10%
10%
Germany
Chile
Belgium
Austria
Ireland
France
UK
Spain
Finland
Switzerland
USA
Italy
Australia
Iceland
Sweden
Denmark
Canada
New Zealand
Netherlands
Norway
12%
9%
8%
8%
8%
7%
7%
7%
6%
6%
6%
6%
6%
6%
6%
5%
4%
4%
3%
2%
Chile
Spain
Austria
Ireland
Belgium
Norway
Italy
Germany
Switzerland
Sweden
Netherlands
UK
New Zealand
France
Finland
Denmark
Iceland
Canada
USA
Australia
10%
10%
8%
8%
7%
7%
6%
6%
6%
6%
6%
5%
5%
4%
4%
4%
3%
3%
3%
2%
Austria
Sweden
Switzerland
Chile
New Zealand
Spain
Germany
Norway
USA
Belgium
Italy
Netherlands
Japan
Finland
Israel
United Kingdom
France
Iceland
Denmark
Ireland
iFAB 2014
$1,746 $2,019 $2,468 $2,591 $2,549 $2,876 $3,220 $2,834 $2,842 $3,407 $2,891
$1,543 $1,672
$1,950 $2,082 $2,003 $2,130
$2,265 $1,941 $2,026
$2,443 $2,652
$703 $884
$1,135 $1,245 $1,319
$1,661 $1,878
$1,727 $2,175
$2,560 $2,609
$439 $482
$509 $568 $580
$1,001 $1,098
$643 $869
$1,059 $944
$48 $83
$123 $155 $226
$322
$384
$319
$430
$587 $543
$412 $476
$596 $746 $888
$1,192
$1,537
$1,233
$1,584
$2,226 $2,299
$85 $102
$121 $152 $184
$246
$292
$247
$421
$516 $411
$770
$925
$1,078 $1,182 $1,256
$1,933
$2,217
$1,622
$2,272
$2,633 $2,527
$1,483
$1,712
$2,378
$2,557 $2,475
$2,802
$3,220
$3,150
$4,358
$5,434 $6,071
$7,238
$8,364
$10,370
$11,288 $11,497
$14,180
$16,133
$13,736
$16,993
$20,888 $20,955
2002 2003 2004 2005 2006 2007 2008 2009 2010 2011 2012
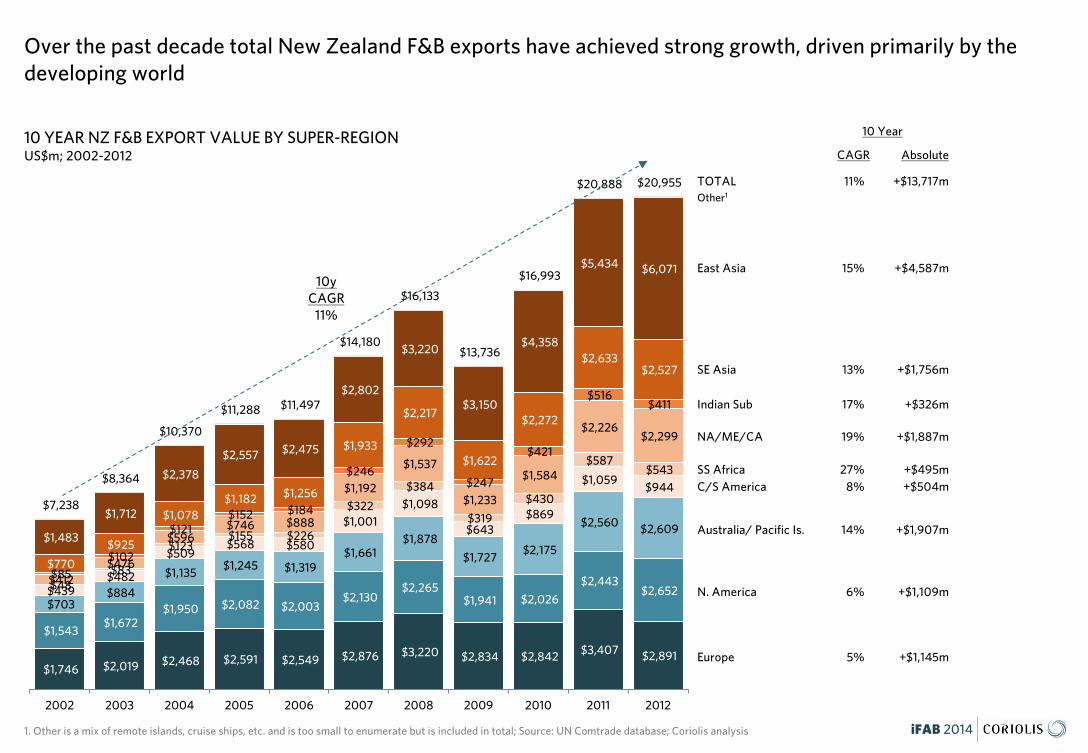
10 YEAR NZ F&B EXPORT VALUE BY SUPER-REGIONUS$m; 2002-2012
Over the past decade total New Zealand F&B exports have achieved strong growth, driven primarily by the developing world
1. Other is a mix of remote islands, cruise ships, etc. and is too small to enumerate but is included in total; Source: UN Comtrade database; Coriolis analysis
Europe 5% +$1,145m
N. America 6% +$1,109m
Australia/ Pacific Is. 14% +$1,907m
NA/ME/CA 19% +$1,887m
Indian Sub 17% +$326m
SE Asia 13% +$1,756m
East Asia 15% +$4,587m
TOTAL 11% +$13,717m
C/S America 8% +$504mSS Africa 27% +$495m
CAGR Absolute
10 Year
10yCAGR
11%
Other1
EMERGING… food bowl of Asia-Pacific
iFAB 2014
iFAB 2014
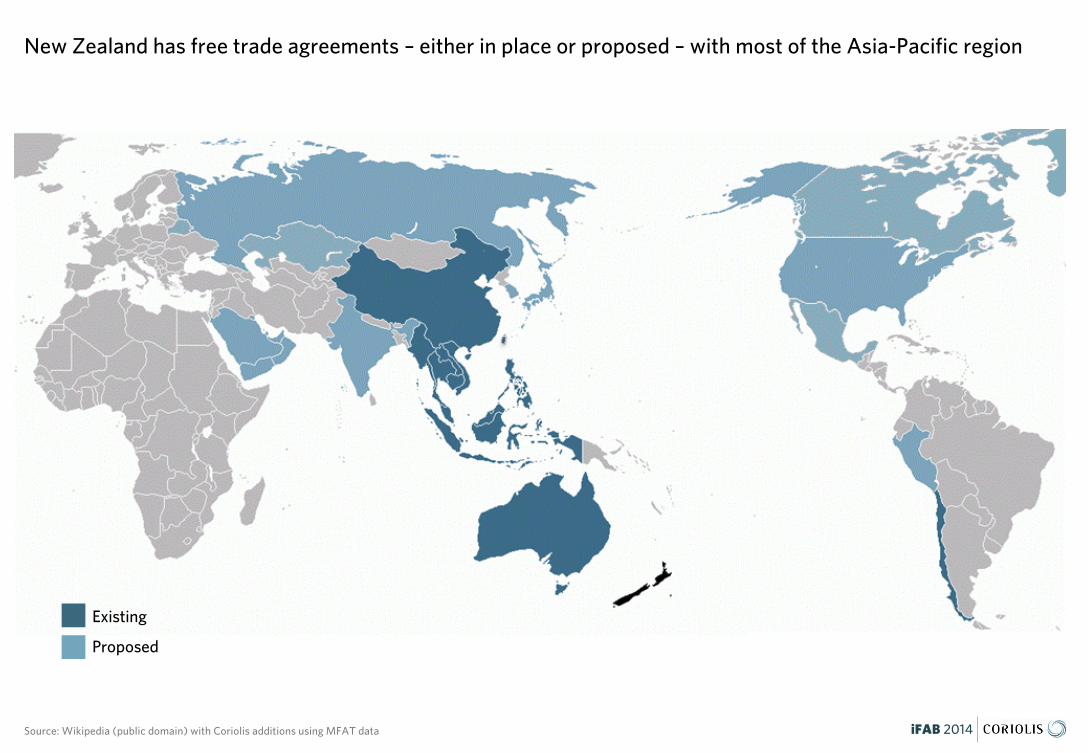
New Zealand has free trade agreements – either in place or proposed – with most of the Asia-Pacific region
Source: Wikipedia (public domain) with Coriolis additions using MFAT data
Existing
Proposed
iFAB 2014
Europe, $2,891 , 14%
N America$2,652 13%
Australia/Pacific $2,609 12%
C/S America$944 4%
SS Africa $543 3%
Indian Sub. $411 2%
NA/ME/CA$2,299 11%
SE Asia, $2,527 , 12%
E Asia, $6,071 , 29%
Total F&B Exports
US$21b
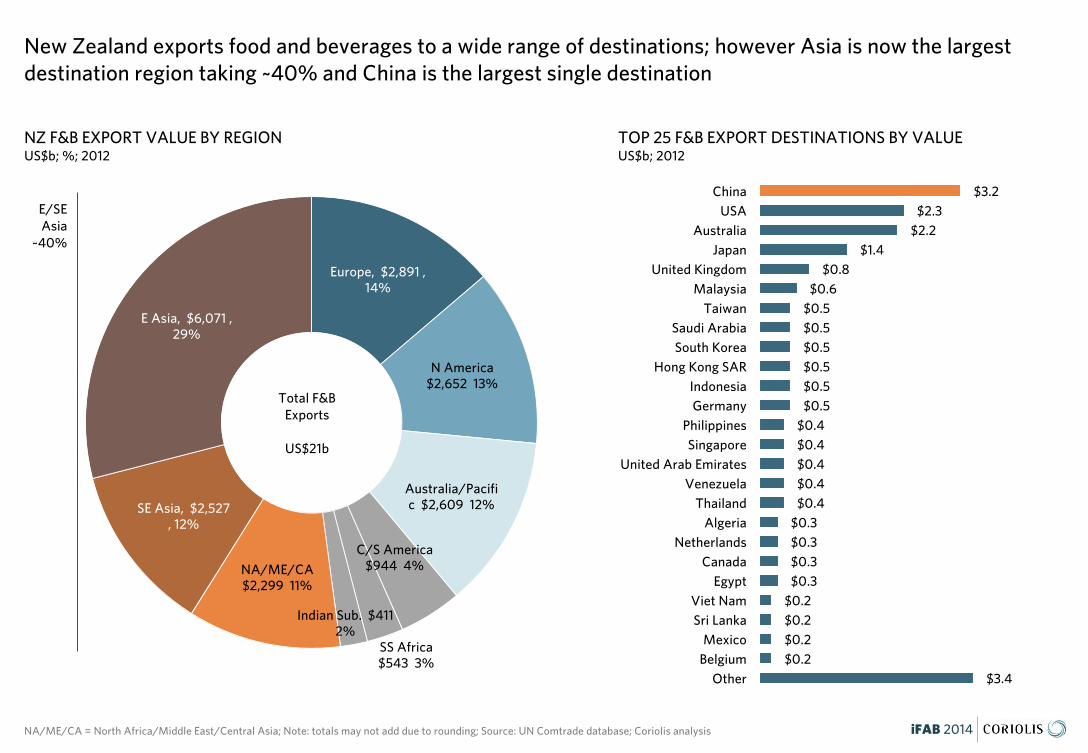
NZ F&B EXPORT VALUE BY REGIONUS$b; %; 2012
New Zealand exports food and beverages to a wide range of destinations; however Asia is now the largest destination region taking ~40% and China is the largest single destination
NA/ME/CA = North Africa/Middle East/Central Asia; Note: totals may not add due to rounding; Source: UN Comtrade database; Coriolis analysis
E/SEAsia
~40%
TOP 25 F&B EXPORT DESTINATIONS BY VALUEUS$b; 2012
$3.2 $2.3
$2.2 $1.4
$0.8 $0.6
$0.5 $0.5 $0.5 $0.5 $0.5 $0.5
$0.4 $0.4 $0.4 $0.4 $0.4
$0.3 $0.3 $0.3 $0.3
$0.2 $0.2 $0.2 $0.2
$3.4
ChinaUSA
AustraliaJapan
United KingdomMalaysia
TaiwanSaudi ArabiaSouth Korea
Hong Kong SARIndonesiaGermany
PhilippinesSingapore
United Arab EmiratesVenezuela
ThailandAlgeria
NetherlandsCanada
EgyptViet NamSri Lanka
MexicoBelgium
Other
iFAB 2014
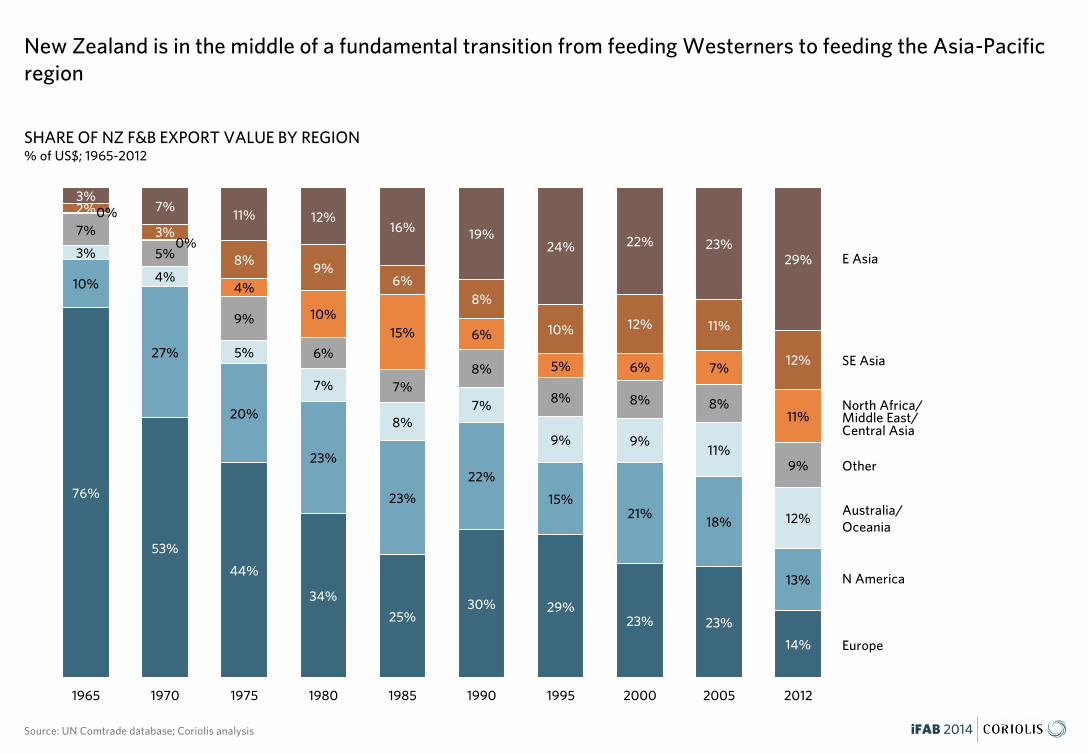
SHARE OF NZ F&B EXPORT VALUE BY REGION% of US$; 1965-2012
New Zealand is in the middle of a fundamental transition from feeding Westerners to feeding the Asia-Pacific region
Source: UN Comtrade database; Coriolis analysis
Europe
Other
Australia/ Oceania
E Asia
SE Asia
N America
North Africa/Middle East/Central Asia
76%
53%
44%
34%
25%30% 29%
23% 23%
14%
10%
27%
20%
23%
23%
22%
15%21%
18%
13%
3%
4%
5%
7%
8%7%
9% 9%11%
12%
7%
5%
9%
6%
7%8%
8% 8% 8%
9%
0%
0%
4%
10%15% 6%
5% 6% 7%
11%
2%
3%
8%9%
6%8%
10% 12% 11%
12%
3%7%
11% 12%16% 19%
24% 22% 23%29%
1965 1970 1975 1980 1985 1990 1995 2000 2005 2012
UPSIDE… capacity to produce much more
iFAB 2014

iFAB 2014
Peers suggest ample capacity to increase or intensify food production volume for the foreseeable future, though this will likely require land use change and more irrigation
AG LAND USE BY TYPE% of ag area; km2; 2012 or as available
TOTAL FOOD PRODUCTION VOLUMETonnes; 000; 1961-2011
1. available data is consented to irrigate not actually irrigated; Source: World Bank; CIA World Fact Book; UN AgStat database; Coriolis analysis
-
10,000
20,000
30,000
40,000
50,000
60,000
70,000
80,000
196119641967197019731976197919821985198819911994199720
00
200
320
06
200
9
Switzerland
Ireland
Denmark
New Zealand
Netherlands
Japan
United Kingdom
Italy
93%
83%
73%
62%
60%
54%
49%
39%
33%
26%
25%
13%
7%
0%
7%
2%
4%
19%
18%
1%
0%
2%
0%
16%
17%
20%
36%
37%
27%
34%
60%
67%
72%
75%
71%
Japan
Denmark
Slovakia
Belgium
France
Italy
Spain
Netherlands
UK
Switzerland
Ireland
New ZealandArable
landFruit/perm.
cropsPasture/other
agricultural land
AREA IRRIGATEDkm2; 000; 2012 or as available
37,800
27,500
26,000
25,920
10,770
5,650
4,490
1,830
1,700
400
250
-
Spain
Italy
France
Japan
New Zealand
Netherlands
Denmark
Slovakia
UK
Belgium
Switzerland
Ireland
1
377,930
301,336
270,467
242,900
70,273
43,094
41,284
37,354
Japan
Italy
New Zealand
United Kingdom
Ireland
Denmark
Switzerland
Netherlands
COUNTRY AREAkm2; 2013

iFAB 2014
760,805
204,000
179,500
99,584
43,615
34,605
29,300
24,708
14,920
7,362
3,237
France
Chile
Portugal
Germany
Austria
New Zealand
Croatia
Washington
Switzerland
Oregon
British Columbia
AQUACULTURE PRODUCTION VALUEUS$m; 2011
Peers suggest many food & beverages categories have strong growth upside
Source: UN FAO AgStat; UN FAO FishStat FIGIS database; USDA Census of Agriculture; Wine BC; Coriolis analysis
HECTARES IN FRUIT & VEGETABLESha; 000; 2012
GRAPE AREA BY COUNTRY/REGIONha; actual; 2012
3-10x
319 450
39
1,539 1,126
71
319
160
1
Spain Italy New Zealand
Fruit
Nuts
Vegetables
2,177
1,736
110
$6,340
$5,240
$1,102
$987
$923
$846
$770
$572
$414
$279
$174
$148
$120
$81
$60
$59
$53
Chile
Norway
USA
United Kingdom
France
Canada
Australia
Spain
Faroe Islands
New Zealand
Ireland
Denmark
Germany
Portugal
Finland
Sweden
South Africa
3-10x
3-10x
iFAB 2014
378
301
275
243
70
49
43
41
37
31
Japan
Italy
New Zealand
UK
Ireland
Slovakia
Denmark
Switzerland
Netherlands
Belgium
111
231
85
215
144
121
444
176
824
466
Japan
Italy
New Zealand
UK
Ireland
Slovakia
Denmark
Switzerland
Netherlands
Belgium
AREAkm2; 000; 2013
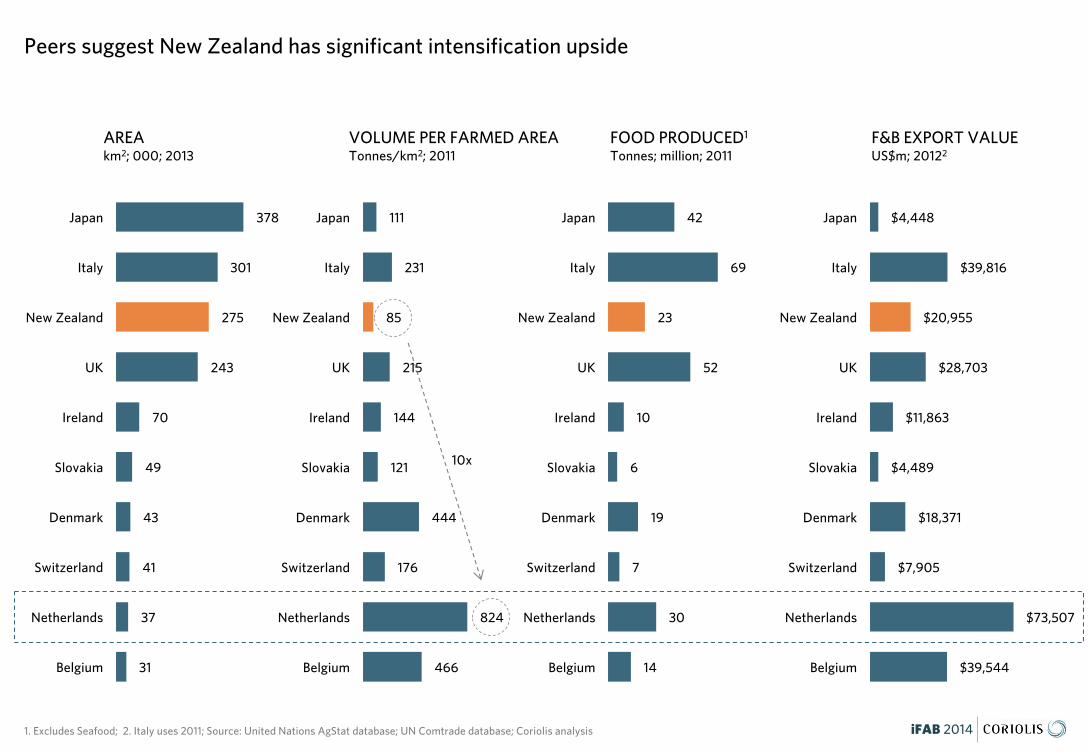
Peers suggest New Zealand has significant intensification upside
1. Excludes Seafood; 2. Italy uses 2011; Source: United Nations AgStat database; UN Comtrade database; Coriolis analysis
42
69
23
52
10
6
19
7
30
14
Japan
Italy
New Zealand
UK
Ireland
Slovakia
Denmark
Switzerland
Netherlands
Belgium
$4,448
$39,816
$20,955
$28,703
$11,863
$4,489
$18,371
$7,905
$73,507
$39,544
Japan
Italy
New Zealand
UK
Ireland
Slovakia
Denmark
Switzerland
Netherlands
Belgium
FOOD PRODUCED1
Tonnes; million; 2011F&B EXPORT VALUEUS$m; 20122
VOLUME PER FARMED AREATonnes/km2; 2011
10x
iFAB 2014
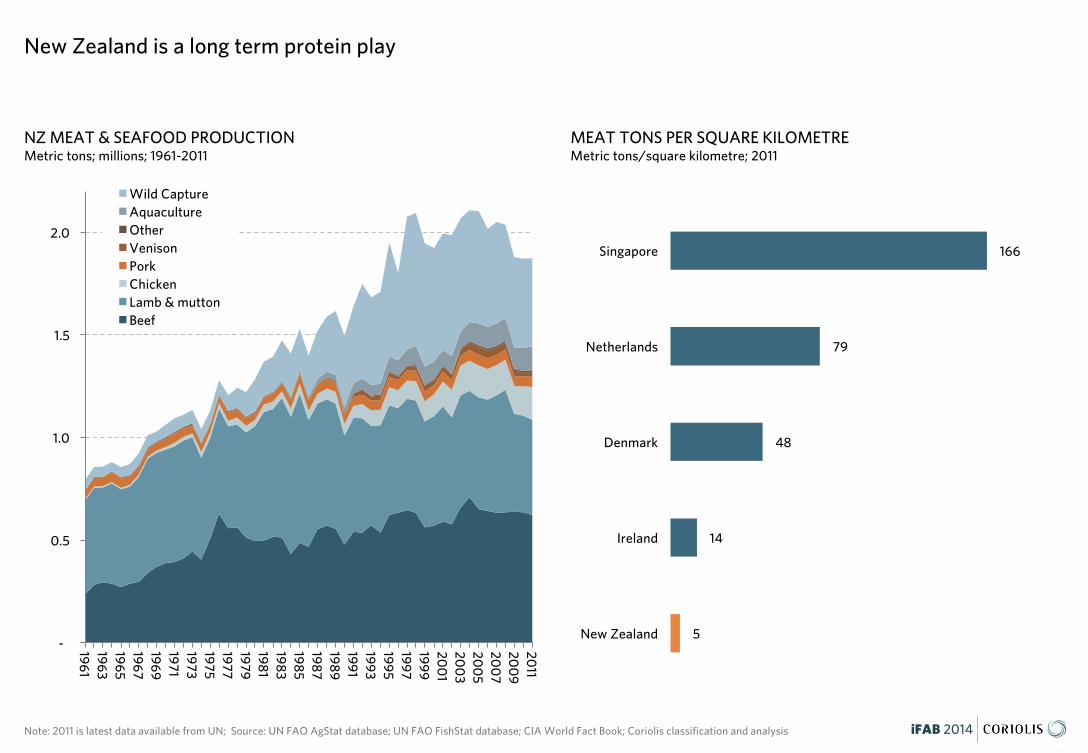
NZ MEAT & SEAFOOD PRODUCTION Metric tons; millions; 1961-2011
New Zealand is a long term protein play
Note: 2011 is latest data available from UN; Source: UN FAO AgStat database; UN FAO FishStat database; CIA World Fact Book; Coriolis classification and analysis
-
0.5
1.0
1.5
2.0
1961196319651967196919711973197519771979198
1198
3198
5198
7198
91991199319951997199920
01
200
320
05
200
720
09
2011
Wild CaptureAquacultureOtherVenisonPorkChickenLamb & muttonBeef
MEAT TONS PER SQUARE KILOMETREMetric tons/square kilometre; 2011
166
79
48
14
5
Singapore
Netherlands
Denmark
Ireland
New Zealand
GREAT… at producing food and beverages
iFAB 2014
iFAB 2014
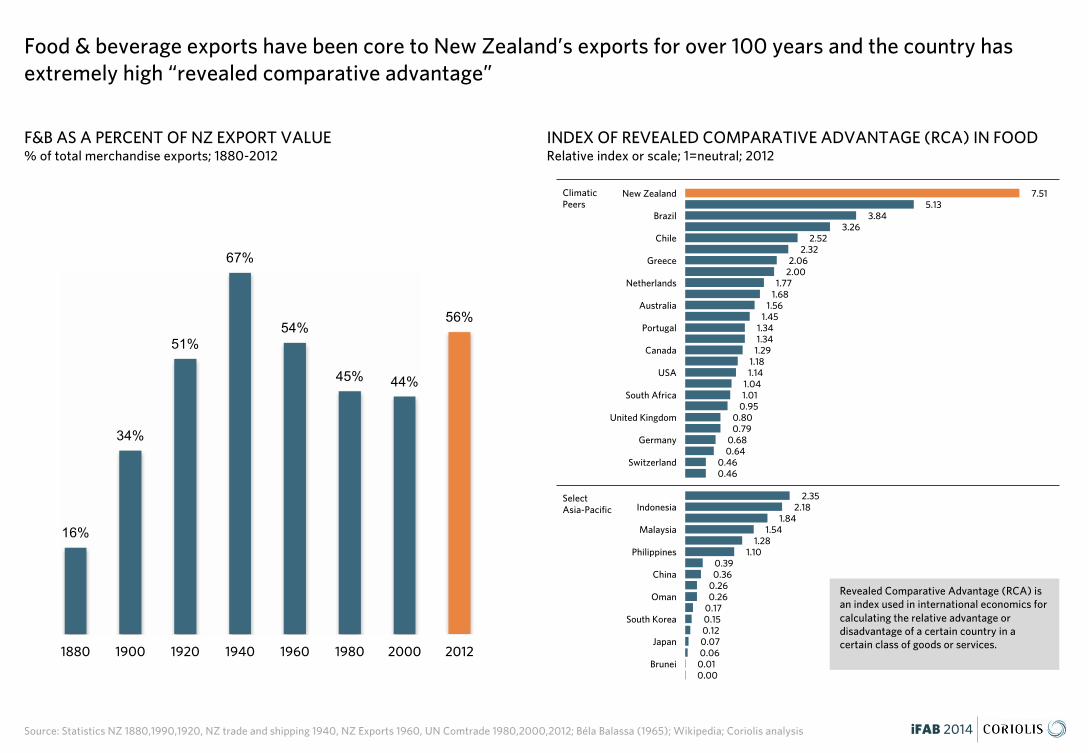
F&B AS A PERCENT OF NZ EXPORT VALUE% of total merchandise exports; 1880-2012
Food & beverage exports have been core to New Zealand’s exports for over 100 years and the country has extremely high “revealed comparative advantage”
Source: Statistics NZ 1880,1990,1920, NZ trade and shipping 1940, NZ Exports 1960, UN Comtrade 1980,2000,2012; Béla Balassa (1965); Wikipedia; Coriolis analysis
16%
34%
51%
67%
54%
45% 44%
56%
1880 1900 1920 1940 1960 1980 2000 2012
7.51 5.13
3.84 3.26
2.52 2.32
2.06 2.00
1.77 1.68
1.56 1.45
1.34 1.34 1.29
1.18 1.14
1.04 1.01
0.95 0.80 0.79
0.68 0.64
0.46 0.46
2.35 2.18
1.84 1.54
1.28 1.10
0.39 0.36
0.26 0.26
0.17 0.15 0.12 0.07 0.06
0.01 0.00
New Zealand
Brazil
Chile
Greece
Netherlands
Australia
Portugal
Canada
USA
South Africa
United Kingdom
Germany
Switzerland
Indonesia
Malaysia
Philippines
China
Oman
South Korea
Japan
Brunei
INDEX OF REVEALED COMPARATIVE ADVANTAGE (RCA) IN FOODRelative index or scale; 1=neutral; 2012
Revealed Comparative Advantage (RCA) is an index used in international economics for calculating the relative advantage or disadvantage of a certain country in a certain class of goods or services.
ClimaticPeers
Select Asia-Pacific
iFAB 2014
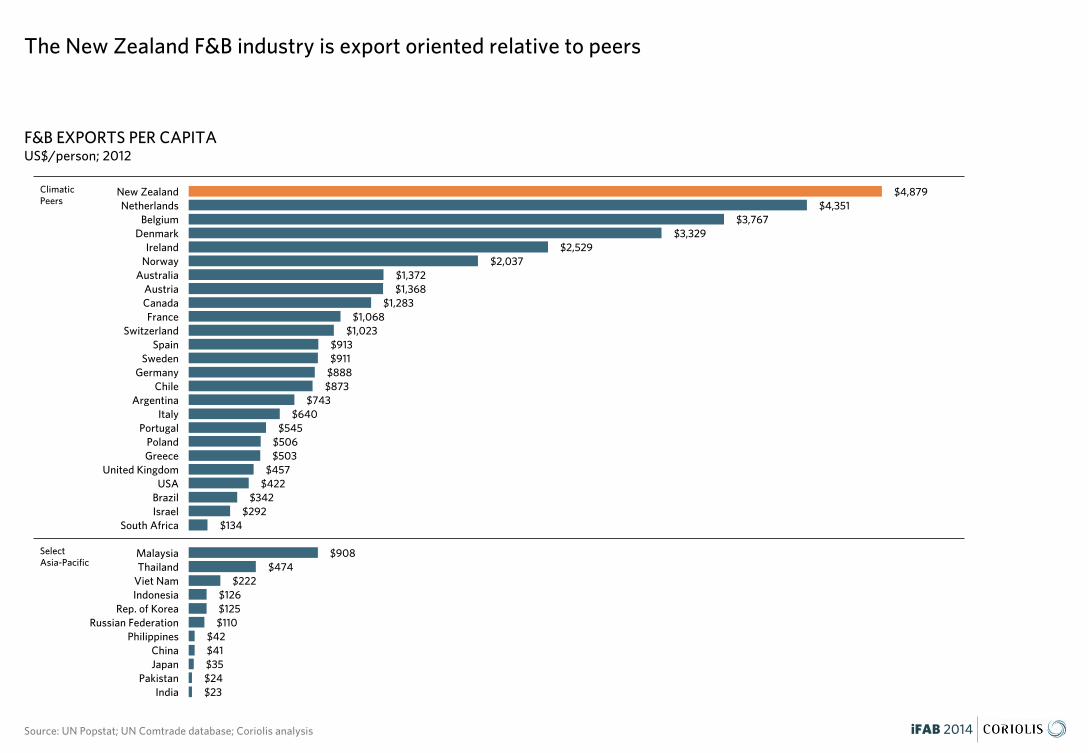
F&B EXPORTS PER CAPITAUS$/person; 2012
The New Zealand F&B industry is export oriented relative to peers
Source: UN Popstat; UN Comtrade database; Coriolis analysis
$4,879 $4,351
$3,767 $3,329
$2,529 $2,037
$1,372 $1,368
$1,283 $1,068
$1,023 $913 $911
$888 $873
$743 $640
$545 $506 $503
$457 $422
$342 $292
$134
$908 $474
$222 $126 $125 $110
$42 $41 $35 $24 $23
New ZealandNetherlands
BelgiumDenmark
IrelandNorway
AustraliaAustriaCanadaFrance
SwitzerlandSpain
SwedenGermany
ChileArgentina
ItalyPortugal
PolandGreece
United KingdomUSA
BrazilIsrael
South Africa
MalaysiaThailand
Viet NamIndonesia
Rep. of KoreaRussian Federation
PhilippinesChinaJapan
PakistanIndia
ClimaticPeers
Select Asia-Pacific
iFAB 2014
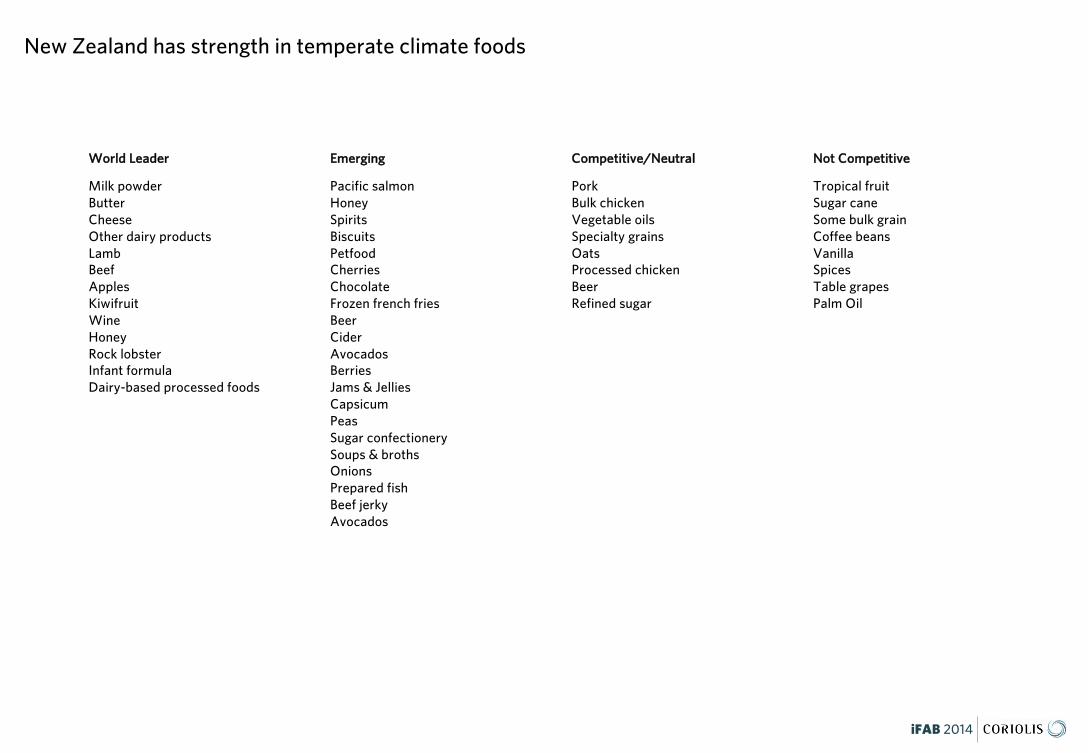
WWoorrlldd LLeeaaddeerr EEmmeerrggiinngg CCoommppeettiittiivvee//NNeeuuttrraall NNoott CCoommppeettiittiivvee
Milk powderButterCheeseOther dairy productsLambBeefApplesKiwifruitWineHoneyRock lobsterInfant formulaDairy-based processed foods
Pacific salmonHoneySpiritsBiscuitsPetfoodCherriesChocolateFrozen french friesBeerCiderAvocadosBerriesJams & JelliesCapsicumPeasSugar confectionerySoups & brothsOnionsPrepared fishBeef jerkyAvocados
PorkBulk chickenVegetable oilsSpecialty grainsOatsProcessed chickenBeerRefined sugar
Tropical fruitSugar caneSome bulk grainCoffee beansVanillaSpicesTable grapesPalm Oil
New Zealand has strength in temperate climate foods
iFAB 2014
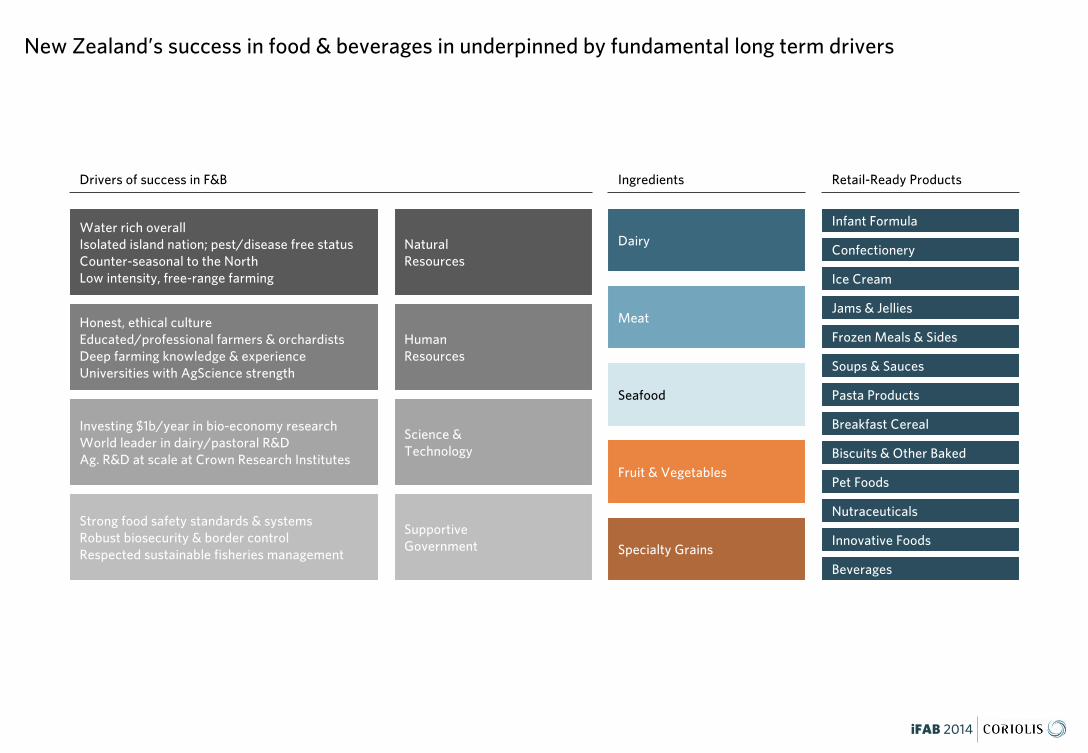
New Zealand’s success in food & beverages in underpinned by fundamental long term drivers
Water rich overallIsolated island nation; pest/disease free statusCounter-seasonal to the NorthLow intensity, free-range farming
Honest, ethical cultureEducated/professional farmers & orchardistsDeep farming knowledge & experience Universities with AgScience strength
Investing $1b/year in bio-economy researchWorld leader in dairy/pastoral R&DAg. R&D at scale at Crown Research Institutes
Strong food safety standards & systemsRobust biosecurity & border controlRespected sustainable fisheries management
Natural Resources
HumanResources
Science & Technology
SupportiveGovernment
Dairy
Meat
Seafood
Fruit & Vegetables
Specialty Grains
Infant Formula
Confectionery
Ice Cream
Jams & Jellies
Frozen Meals & Sides
Soups & Sauces
Pasta Products
Breakfast Cereal
Biscuits & Other Baked
Pet Foods
Nutraceuticals
Innovative Foods
Beverages
Ingredients Retail-Ready ProductsDrivers of success in F&B
iFAB 2014
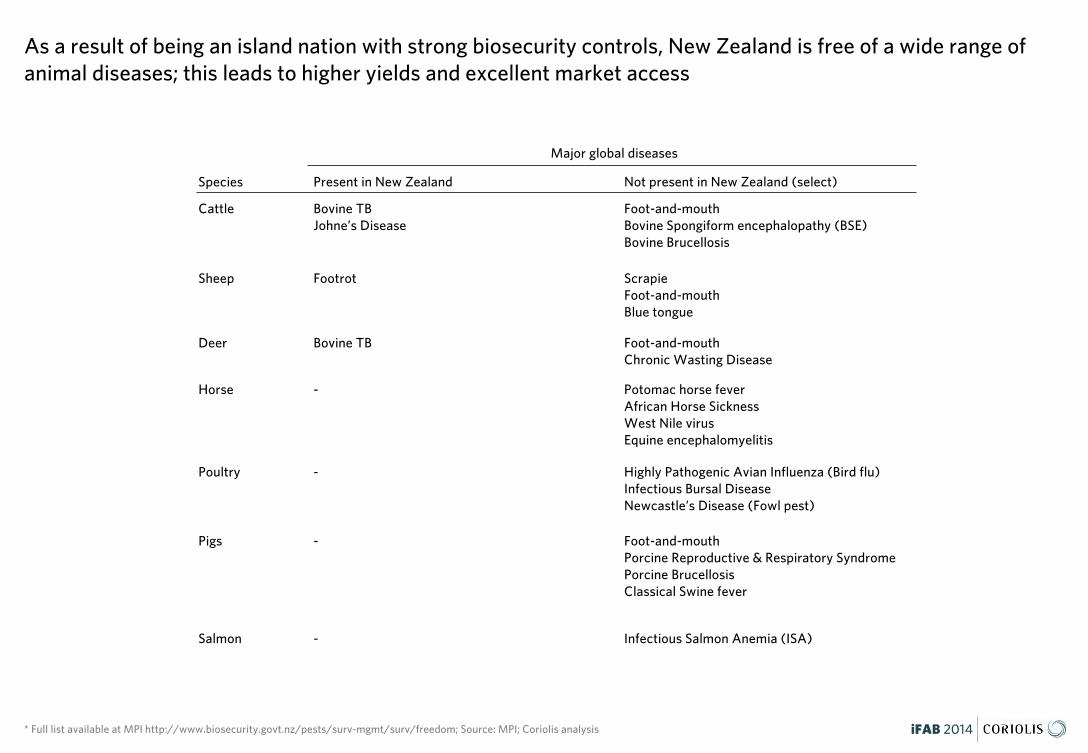
As a result of being an island nation with strong biosecurity controls, New Zealand is free of a wide range of animal diseases; this leads to higher yields and excellent market access
* Full list available at MPI http://www.biosecurity.govt.nz/pests/surv-mgmt/surv/freedom; Source: MPI; Coriolis analysis
Species
Major global diseases
Present in New Zealand Not present in New Zealand (select)
Cattle Bovine TBJohne’s Disease
Foot-and-mouthBovine Spongiform encephalopathy (BSE)Bovine Brucellosis
Sheep Footrot ScrapieFoot-and-mouthBlue tongue
Deer Bovine TB Foot-and-mouthChronic Wasting Disease
Horse - Potomac horse feverAfrican Horse Sickness West Nile virusEquine encephalomyelitis
Poultry - Highly Pathogenic Avian Influenza (Bird flu)Infectious Bursal Disease Newcastle’s Disease (Fowl pest)
Pigs - Foot-and-mouthPorcine Reproductive & Respiratory SyndromePorcine BrucellosisClassical Swine fever
Salmon - Infectious Salmon Anemia (ISA)
iFAB 2014
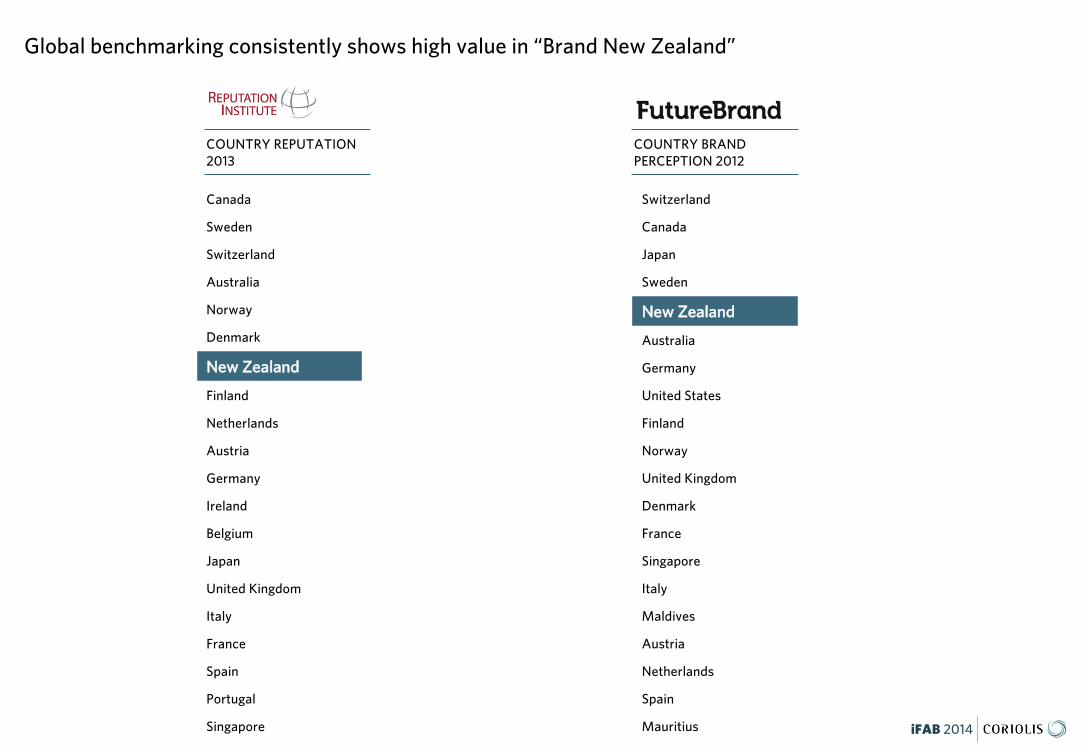
Canada
Sweden
Switzerland
Australia
Norway
Denmark
NNeeww ZZeeaallaanndd
Finland
Netherlands
Austria
Germany
Ireland
Belgium
Japan
United Kingdom
Italy
France
Spain
Portugal
Singapore
Global benchmarking consistently shows high value in “Brand New Zealand”
Switzerland
Canada
Japan
Sweden
NNeeww ZZeeaallaanndd
Australia
Germany
United States
Finland
Norway
United Kingdom
Denmark
France
Singapore
Italy
Maldives
Austria
Netherlands
Spain
Mauritius
COUNTRY REPUTATION 2013
COUNTRY BRAND PERCEPTION 2012

iFAB 2014
Consumers in key markets – particularly Asia – trust New Zealand food and beverages
Source: Gain report JA8713; Coriolis
-100
-80
-60
-40
-20
0
20
40
60
80
100
-100 -80 -60 -40 -20 0 20 40 60 80 100
EUScandinavia
Japan
USA
Asia (excl. China)
China
Lower cost & trusted
NEW ZEALAND& Australia
SAFE
UNSAFE
EXPENSIVECHEAP
JAPANESE PUBLIC IMAGE OF FOREIGN PRODUCTS 2009
iFAB 2014
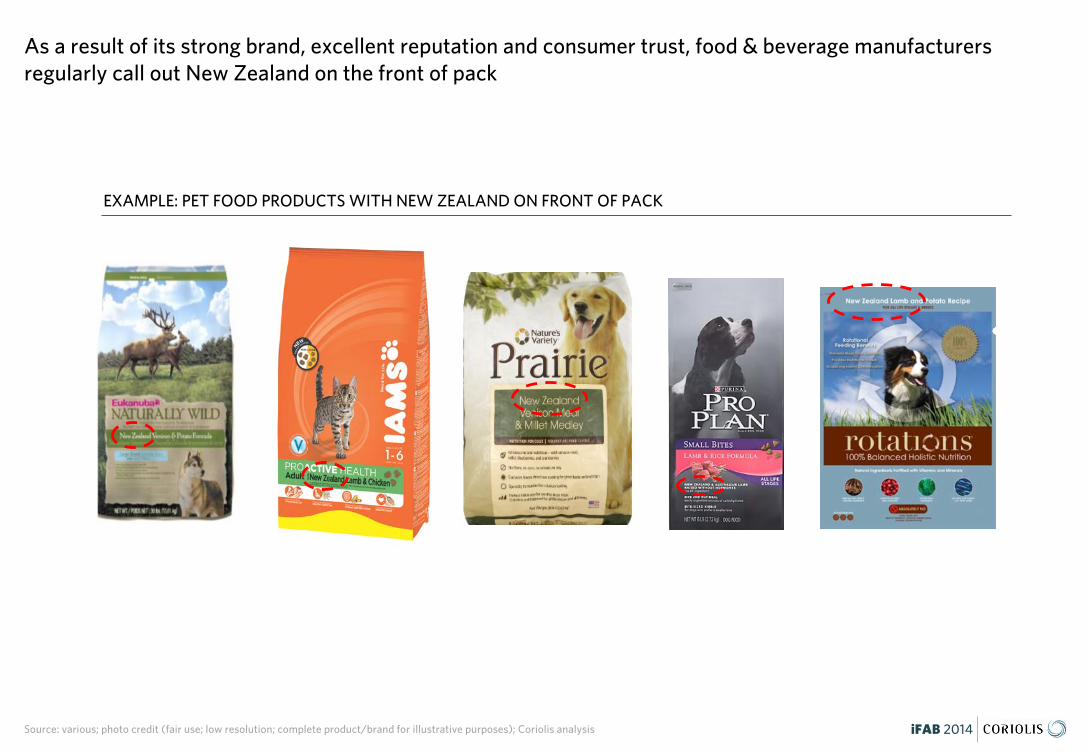
As a result of its strong brand, excellent reputation and consumer trust, food & beverage manufacturers regularly call out New Zealand on the front of pack
EXAMPLE: PET FOOD PRODUCTS WITH NEW ZEALAND ON FRONT OF PACK
Source: various; photo credit (fair use; low resolution; complete product/brand for illustrative purposes); Coriolis analysis

SUPPORTIVE… business ecosystem
iFAB 2014
iFAB 2014
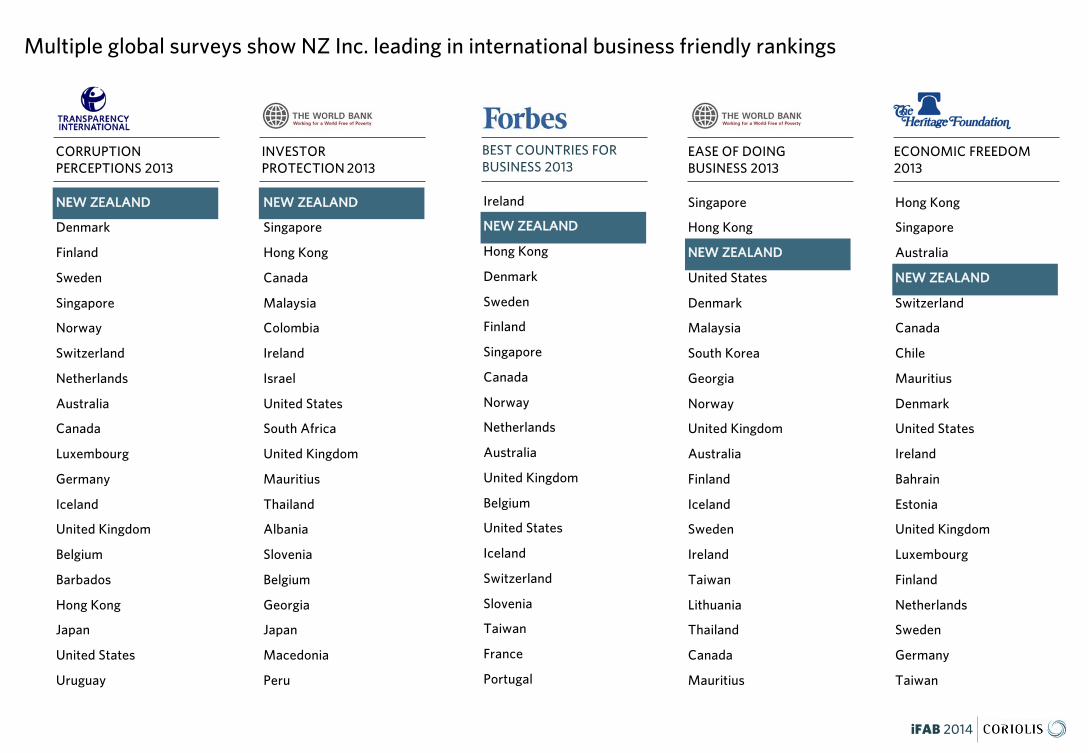
BEST COUNTRIES FOR BUSINESS 2013
Multiple global surveys show NZ Inc. leading in international business friendly rankings
Ireland
NNEEWW ZZEEAALLAANNDD
Hong Kong
Denmark
Sweden
Finland
Singapore
Canada
Norway
Netherlands
Australia
United Kingdom
Belgium
United States
Iceland
Switzerland
Slovenia
Taiwan
France
Portugal
NNEEWW ZZEEAALLAANNDD
Denmark
Finland
Sweden
Singapore
Norway
Switzerland
Netherlands
Australia
Canada
Luxembourg
Germany
Iceland
United Kingdom
Belgium
Barbados
Hong Kong
Japan
United States
Uruguay
Singapore
Hong Kong
NNEEWW ZZEEAALLAANNDD
United States
Denmark
Malaysia
South Korea
Georgia
Norway
United Kingdom
Australia
Finland
Iceland
Sweden
Ireland
Taiwan
Lithuania
Thailand
Canada
Mauritius
NNEEWW ZZEEAALLAANNDD
Singapore
Hong Kong
Canada
Malaysia
Colombia
Ireland
Israel
United States
South Africa
United Kingdom
Mauritius
Thailand
Albania
Slovenia
Belgium
Georgia
Japan
Macedonia
Peru
Hong Kong
Singapore
Australia
NNEEWW ZZEEAALLAANNDD
Switzerland
Canada
Chile
Mauritius
Denmark
United States
Ireland
Bahrain
Estonia
United Kingdom
Luxembourg
Finland
Netherlands
Sweden
Germany
Taiwan
CORRUPTION PERCEPTIONS 2013
EASE OF DOING BUSINESS 2013
INVESTOR PROTECTION 2013
ECONOMIC FREEDOM 2013

iFAB 2014
New Zealand food & beverage sectors have strong and robust industry representation
DAIRY MEAT SEAFOOD PRODUCE PROCESSED FOODS BEVERAGES
iFAB 2014
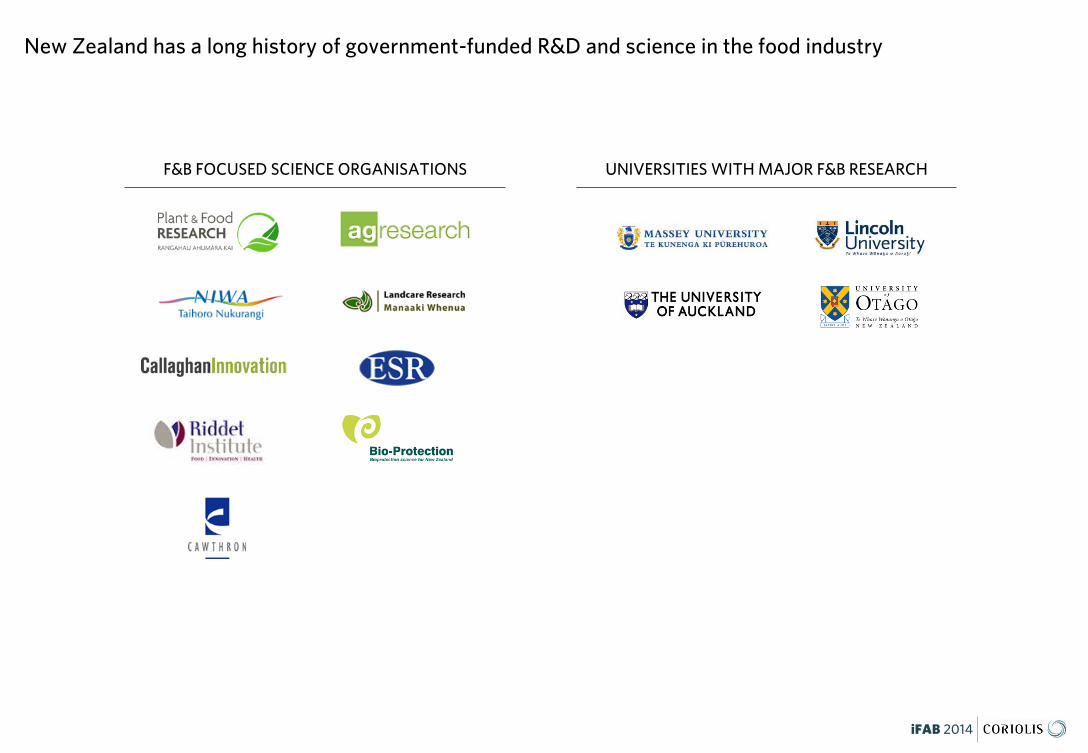
New Zealand has a long history of government-funded R&D and science in the food industry
F&B FOCUSED SCIENCE ORGANISATIONS UNIVERSITIES WITH MAJOR F&B RESEARCH
iFAB 2014
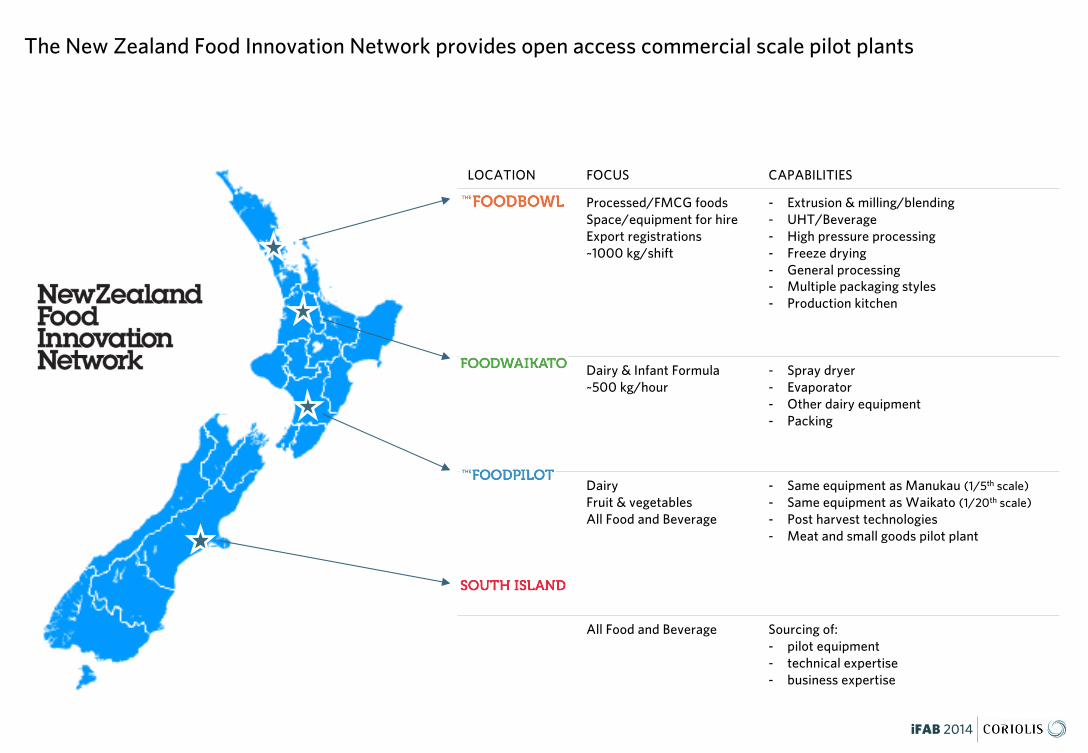
The New Zealand Food Innovation Network provides open access commercial scale pilot plants
LOCATION FOCUS CAPABILITIES
Processed/FMCG foods Space/equipment for hireExport registrations ~1000 kg/shift
- Extrusion & milling/blending- UHT/Beverage - High pressure processing- Freeze drying- General processing- Multiple packaging styles- Production kitchen
Dairy & Infant Formula~500 kg/hour
- Spray dryer- Evaporator- Other dairy equipment- Packing
DairyFruit & vegetablesAll Food and Beverage
- Same equipment as Manukau (1/5th scale)- Same equipment as Waikato (1/20th scale) - Post harvest technologies- Meat and small goods pilot plant
All Food and Beverage Sourcing of: - pilot equipment- technical expertise- business expertise
ATTRACTING… investment
iFAB 2014
iFAB 2014
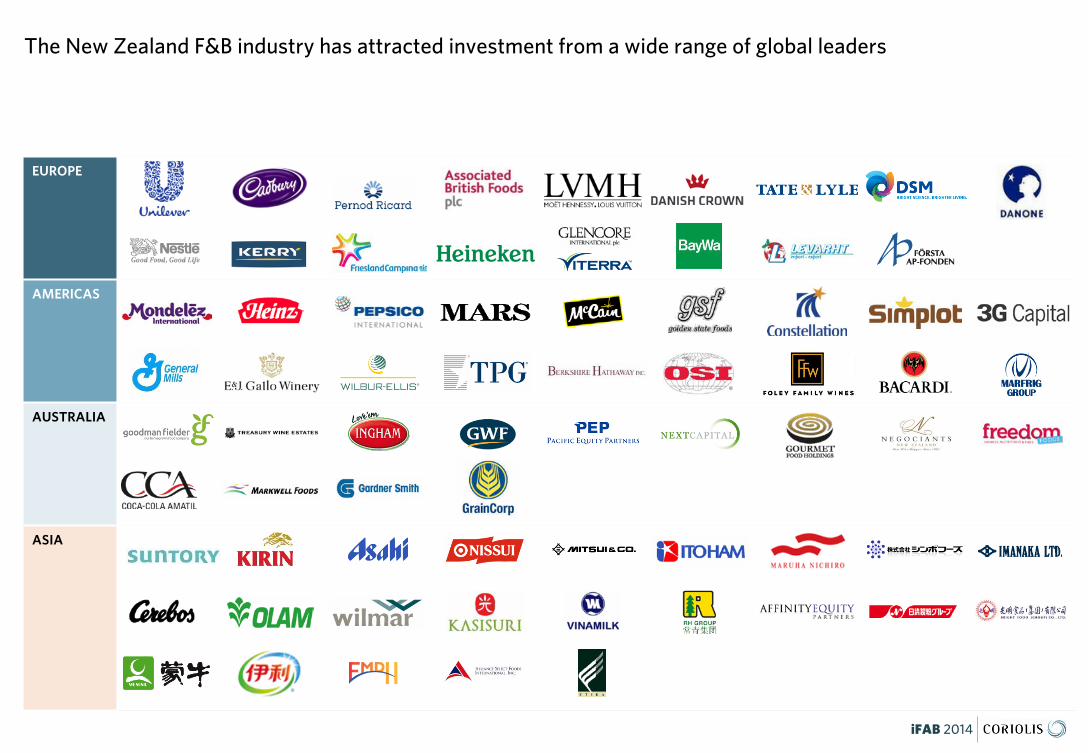
EUROPE
AMERICAS
AUSTRALIA
ASIA
The New Zealand F&B industry has attracted investment from a wide range of global leaders
iFAB 2014
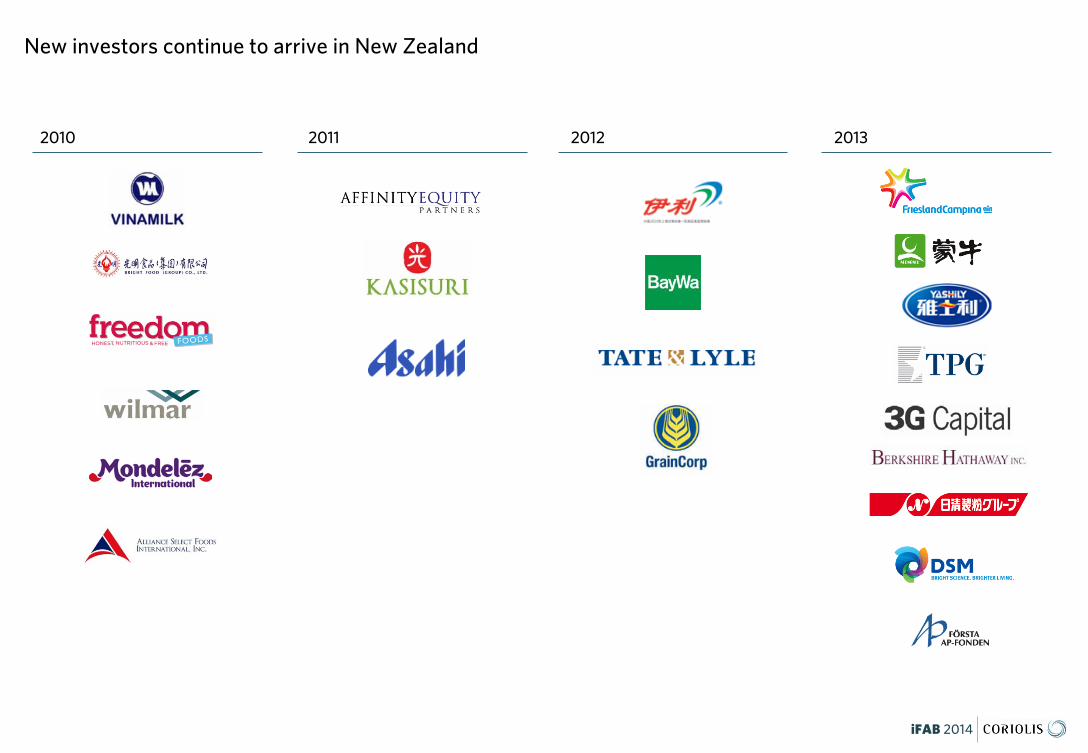
New investors continue to arrive in New Zealand
2010 2011 2012 2013
iFAB 2014
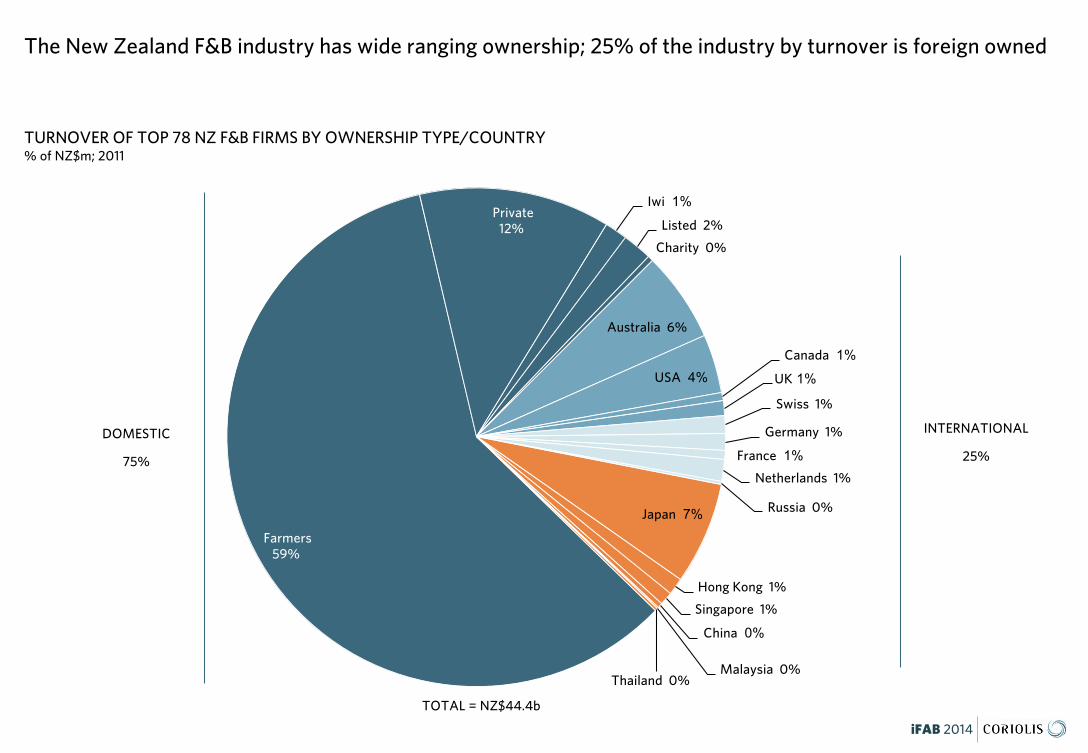
Farmers 59%
Private 12%
Iwi 1%
Listed 2%
Charity 0%
Australia 6%
USA 4%Canada 1%
UK 1%
Swiss 1%
Germany 1%
France 1%Netherlands 1%
Russia 0%Japan 7%
Hong Kong 1%
Singapore 1%
China 0%
Malaysia 0%Thailand 0%
TURNOVER OF TOP 78 NZ F&B FIRMS BY OWNERSHIP TYPE/COUNTRY% of NZ$m; 2011
The New Zealand F&B industry has wide ranging ownership; 25% of the industry by turnover is foreign owned
DOMESTIC
75%
TOTAL = NZ$44.4b
INTERNATIONAL
25%

LEARN… more
iFAB 2014
iFAB 2014
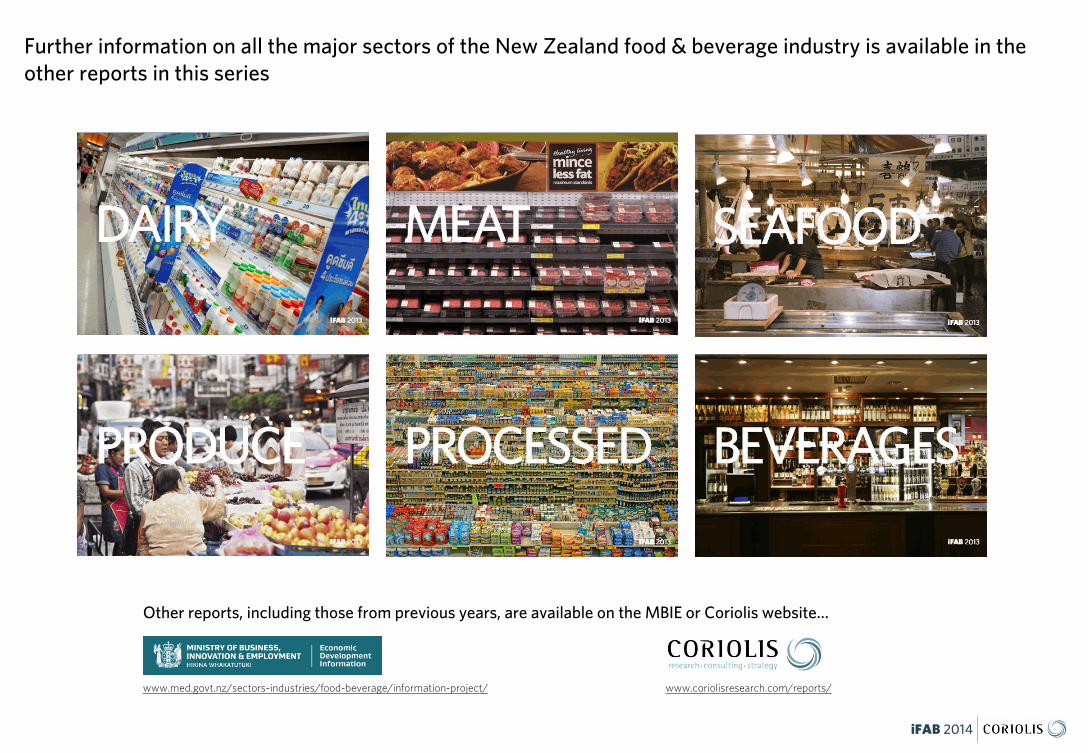
Further information on all the major sectors of the New Zealand food & beverage industry is available in the other reports in this series
Other reports, including those from previous years, are available on the MBIE or Coriolis website…
www.med.govt.nz/sectors-industries/food-beverage/information-project/ www.coriolisresearch.com/reports/
iFAB 2014
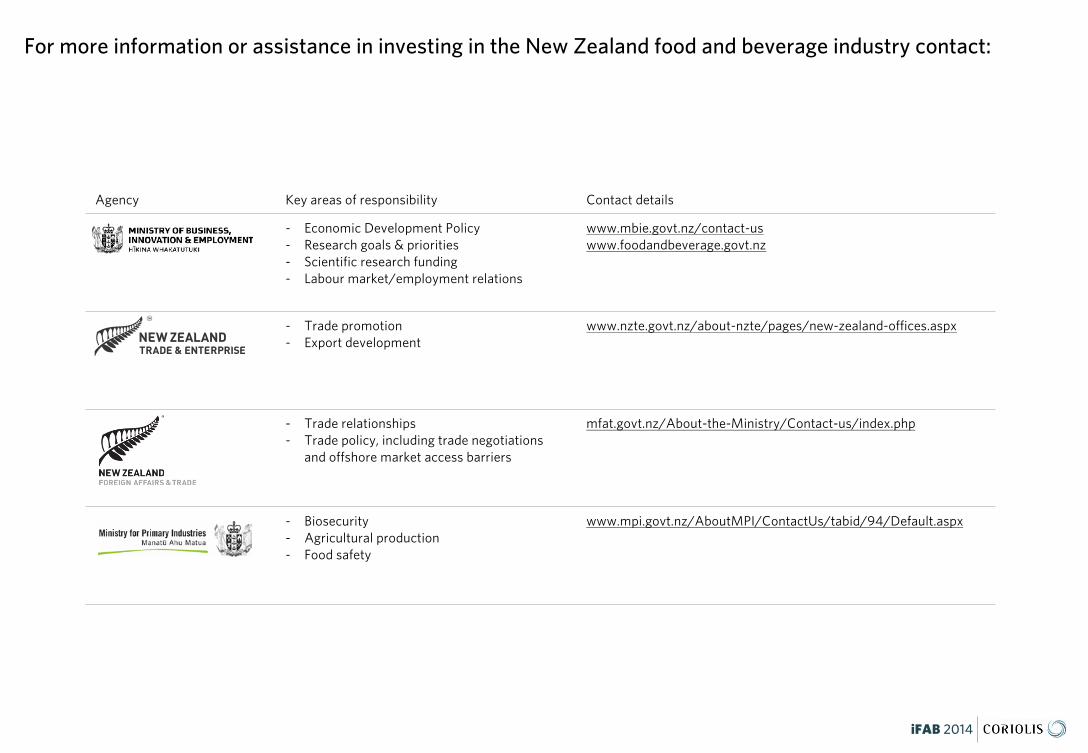
Agency Key areas of responsibility Contact details
- Economic Development Policy- Research goals & priorities- Scientific research funding- Labour market/employment relations
www.mbie.govt.nz/contact-uswww.foodandbeverage.govt.nz
- Trade promotion- Export development
www.nzte.govt.nz/about-nzte/pages/new-zealand-offices.aspx
- Trade relationships- Trade policy, including trade negotiations
and offshore market access barriers
mfat.govt.nz/About-the-Ministry/Contact-us/index.php
- Biosecurity- Agricultural production- Food safety
www.mpi.govt.nz/AboutMPI/ContactUs/tabid/94/Default.aspx
For more information or assistance in investing in the New Zealand food and beverage industry contact:
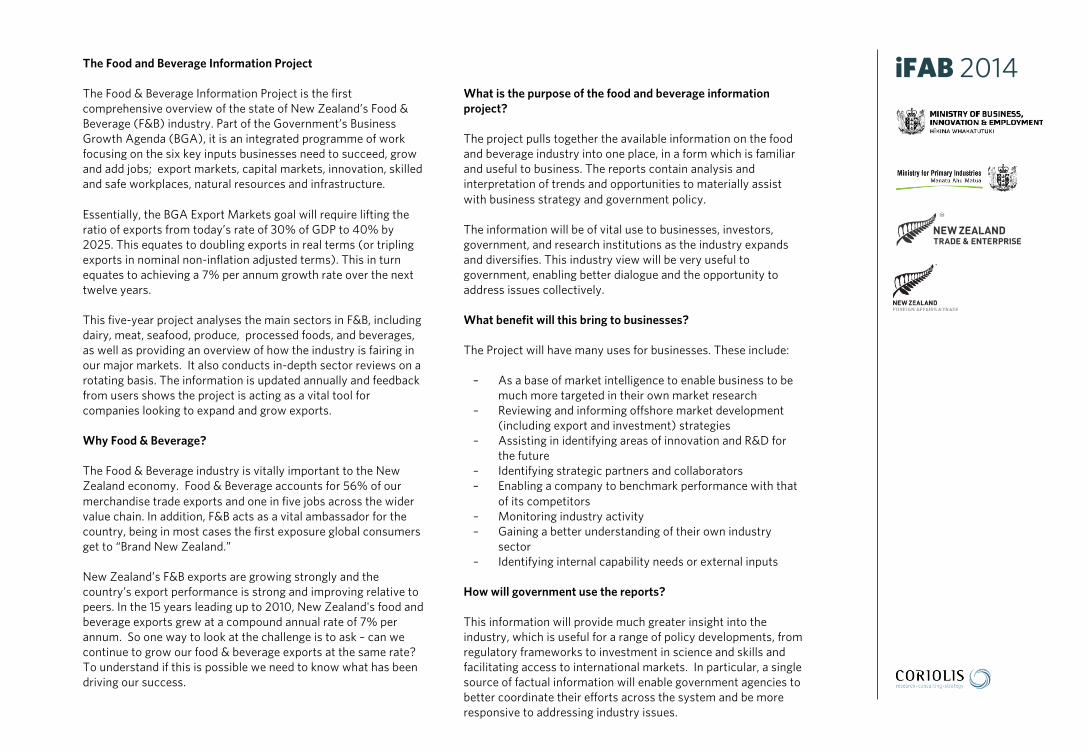
The Food and Beverage Information Project
The Food & Beverage Information Project is the first comprehensive overview of the state of New Zealand’s Food & Beverage (F&B) industry. Part of the Government’s Business Growth Agenda (BGA), it is an integrated programme of work focusing on the six key inputs businesses need to succeed, grow and add jobs; export markets, capital markets, innovation, skilled and safe workplaces, natural resources and infrastructure.
Essentially, the BGA Export Markets goal will require lifting the ratio of exports from today’s rate of 30% of GDP to 40% by 2025. This equates to doubling exports in real terms (or tripling exports in nominal non-inflation adjusted terms). This in turn equates to achieving a 7% per annum growth rate over the next twelve years.
This five-year project analyses the main sectors in F&B, including dairy, meat, seafood, produce, processed foods, and beverages, as well as providing an overview of how the industry is fairing in our major markets. It also conducts in-depth sector reviews on a rotating basis. The information is updated annually and feedback from users shows the project is acting as a vital tool for companies looking to expand and grow exports.
Why Food & Beverage?
The Food & Beverage industry is vitally important to the New Zealand economy. Food & Beverage accounts for 56% of our merchandise trade exports and one in five jobs across the wider value chain. In addition, F&B acts as a vital ambassador for the country, being in most cases the first exposure global consumers get to “Brand New Zealand.”
New Zealand’s F&B exports are growing strongly and the country’s export performance is strong and improving relative to peers. In the 15 years leading up to 2010, New Zealand's food and beverage exports grew at a compound annual rate of 7% per annum. So one way to look at the challenge is to ask – can we continue to grow our food & beverage exports at the same rate? To understand if this is possible we need to know what has been driving our success.
What is the purpose of the food and beverage information project?
The project pulls together the available information on the food and beverage industry into one place, in a form which is familiar and useful to business. The reports contain analysis and interpretation of trends and opportunities to materially assist with business strategy and government policy.
The information will be of vital use to businesses, investors, government, and research institutions as the industry expands and diversifies. This industry view will be very useful to government, enabling better dialogue and the opportunity to address issues collectively.
What benefit will this bring to businesses?
The Project will have many uses for businesses. These include:
– As a base of market intelligence to enable business to be much more targeted in their own market research
– Reviewing and informing offshore market development (including export and investment) strategies
– Assisting in identifying areas of innovation and R&D for the future
– Identifying strategic partners and collaborators– Enabling a company to benchmark performance with that
of its competitors– Monitoring industry activity– Gaining a better understanding of their own industry
sector– Identifying internal capability needs or external inputs
How will government use the reports?
This information will provide much greater insight into the industry, which is useful for a range of policy developments, from regulatory frameworks to investment in science and skills and facilitating access to international markets. In particular, a single source of factual information will enable government agencies to better coordinate their efforts across the system and be more responsive to addressing industry issues.
iFAB 2014
Coriolis is a boutique management consultingfirm that focuses on food, consumerpackaged goods, retailing and foodservice.
Coriolis advises clients on strategy,operations, organization, and mergers andacquisitions. We develop practical, fact-basedinsights grounded in the real world that guideour clients decisions and actions. Founded in1999, Coriolis is based in Auckland, NewZealand and works on projects across theAsia Pacific region.
WHAT WE DO
We help our clients assemble the factsneeded to guide their big decisions. We makepractical recommendations. Whereappropriate, we work with them to makechange happen.
HOW WE DO IT
Our style is practical and down-to-earth. Wetry to put ourselves in our clients’ shoes andfocus on actions. We listen hard, but we aresuspicious of the consensus. We provide anexternal, objective perspective. We are happyto link our fees to results.
WHO WE WORK WITH
We only work with a select group of clientswe trust. We build long term relationshipswith our clients and more than 80% of ourwork comes from existing clients. Our clientstrust our experience, advice and integrity.
Typical assignments for clients include…
FIRM STRATEGY & OPERATIONS:We help clients develop their own strategy forgrowing sales and profits. We have a strongbias towards growth driven by new products,new channels and new markets.
MARKET ENTRYWe help clients identify which countries arethe most attractive – from a consumer, acompetition and a channel point-of-view.Following this we assist in developing a planfor market entry and growth.
VALUE CREATIONWe help clients create value through revenuegrowth and cost reduction.
TARGET IDENTIFICATIONWe help clients identify high potentialacquisition targets by profiling industries,screening companies and devising a plan toapproach targets.
DUE DILIGENCEWe help organisations make better decisionsby performing consumer and market-focuseddue diligence and assessing performanceimprovement opportunities.
EXPERT WITNESSWe provide expert witness support to clientsin legal cases and insurance claims. We assistwith applications under competition/fairtrade laws and regulations.
READ MORE ON OUR WEBSITE.
ABOUT CORIOLIS’ SERVICES
CORIOLIS LIMITEDPO BOX 90-509AUCKLAND, NEW ZEALANDT: +64 9 623 1848www.coriolisresearch.com
ABOUT CORIOLIS’ SERVICES


