January, 2018INVESTORS PRESENTATION1
JANUARY, 2018
INVESTORS PRESENTATION

January, 2018INVESTORS PRESENTATION2
DISCLAIMER
Some of the statements contained in this document may be forward-looking statements concerning Vilmorin & Cie SA's financial position,results, businesses, strategy or projects.
Vilmorin & Cie SA considers that such statements are based onreasonable assumptions but cannot and does not give any assurancethat the Group's future performance will be consistent with thosestatements.
Actual results could differ from those currently anticipated in suchstatements due to a certain number of inherent risks and uncertainties,most of which are beyond Vilmorin & Cie SA's control, such as thosedescribed in the documents filed or to be filed by Vilmorin & Cie SA withthe French securities regulator (Autorité des marchés financiers) andmade available for downloading from the Company's website:www.vilmorincie.com

January, 2018INVESTORS PRESENTATION3
AGENDA
VILMORIN & CIE AT A GLANCE s. 04
VILMORIN & CIE GROWTH STRATEGY s. 11
SALES FOR THE 1st QUARTER 2017-2018 s. 22
OUTLOOK FOR 2017-2018 AND MID TERM AMBITIONS s. 30
VILMORIN & CIE ON THE STOCK EXCHANGE s. 34
SCHEDULE AND CONTACTS s. 37
APPENDICES s. 40

January, 2018INVESTORS PRESENTATION4
4
VILMORIN & CIE AT A GLANCE

January, 2018INVESTORS PRESENTATION5
VILMORIN & CIE, 4TH LARGEST SEEDS COMPANY IN THE WORLD
Fourth largest seeds company in the world with leading positions on its core activities
Pure player built up on historical expertise in botany since 1743and on the basis of real proximity with the agricultural world
A long-term vision of the development, strengthened by the consistent support of its reference shareholder, Limagrain, an international agricultural cooperative group
VILMORIN & CIE AT A GLANCE
N°2worldwide
for vegetable
seeds
N°1in Europe
for straw
cereals (1)
N°3in North
America for
corn seeds
N°4in Europe
for corn
seeds
(1) Wheat and barley

January, 2018INVESTORS PRESENTATION6
A FULL CONTROL OF ALL STAGES IN SEEDS BUSINESS
VILMORIN & CIE AT A GLANCE
ANALYZING
NEEDS
CREATING
NEW SEEDS
COLLECTING
GENETIC
RESOURCES
PRODUCING
SEEDS
DISTRIBUTING AND
SELLING SEEDS
AROUND 300 VARIETIES LAUNCHED PER YEAR
A 7 TO 10 YEARS CYCLE
January, 2018INVESTORS PRESENTATION7
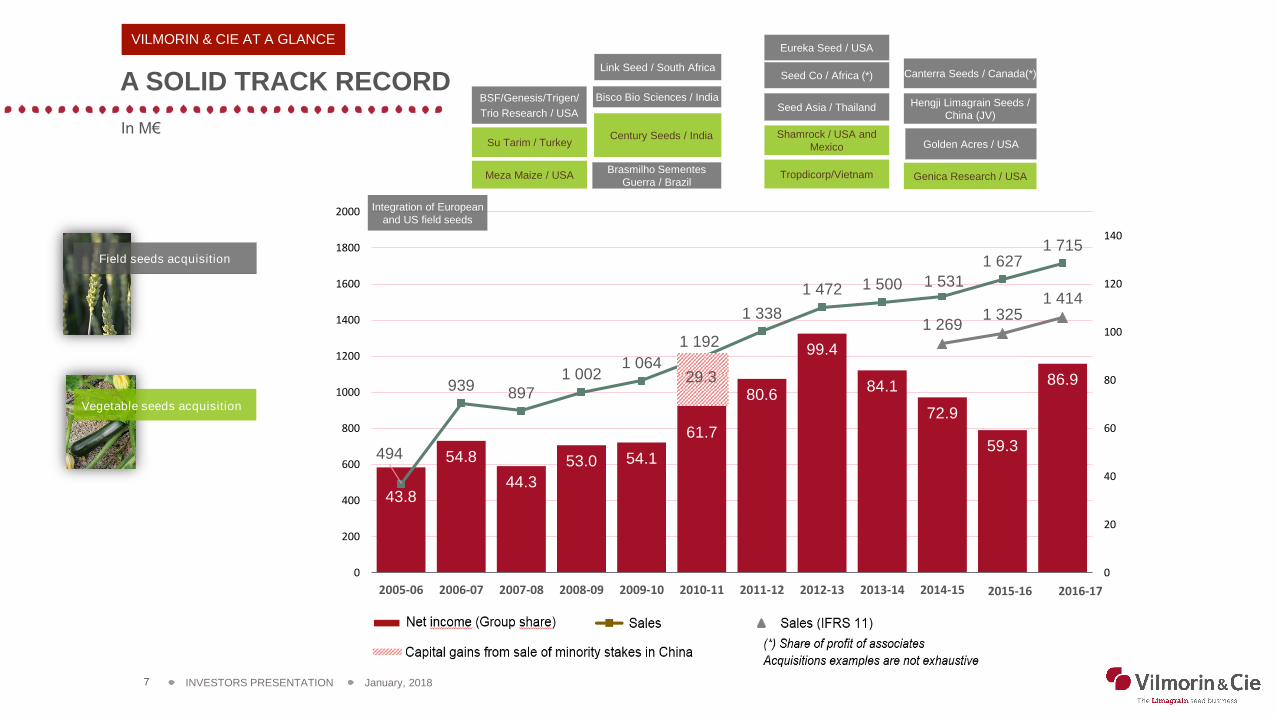
43.8
54.8
44.3
53.0 54.1
80.6
99.4
84.1
72.9
59.3
86.9
494
939897
1 0021 064
1 192
1 338
1 472 1 500 1 531
1 6271 715
1 2691 325
1 414
0
20
40
60
80
100
120
140
0
200
400
600
800
1000
1200
1400
1600
1800
2000
2005-06 2006-07 2007-08 2008-09 2009-10 2010-11 2011-12 2012-13 2013-14 2014-15 2015-16 2016-17
A SOLID TRACK RECORD
VILMORIN & CIE AT A GLANCE
In M€
Integration of European
and US field seeds
Brasmilho Sementes
Guerra / Brazil
Bisco Bio Sciences / IndiaBSF/Genesis/Trigen/
Trio Research / USA
Century Seeds / India
Link Seed / South Africa
Eureka Seed / USA
Seed Co / Africa (*)
Seed Asia / Thailand
Field seeds acquisition
Hengji Limagrain Seeds /
China (JV)
Golden Acres / USA
Vegetable seeds acquisition
Tropdicorp/Vietnam
Shamrock / USA and
Mexico
Canterra Seeds / Canada(*)
Genica Research / USA
Su Tarim / Turkey
Meza Maize / USA
29.3
61.7
January, 2018INVESTORS PRESENTATION8
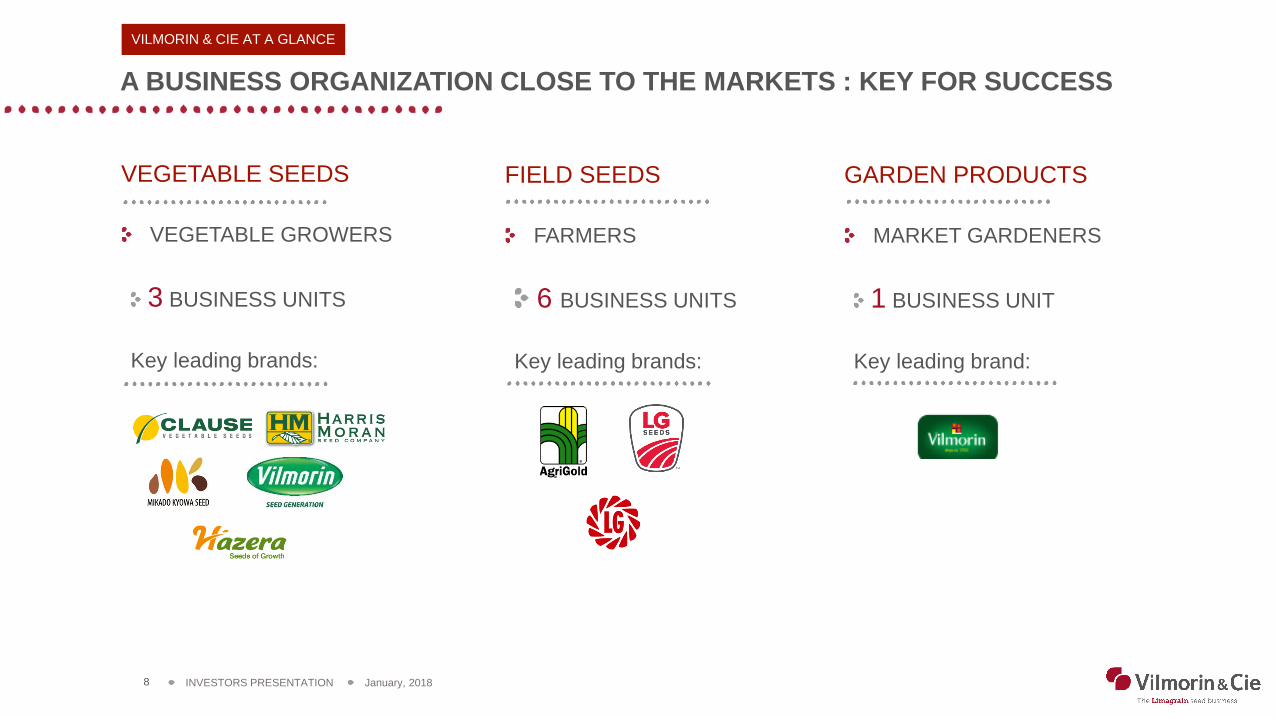
A BUSINESS ORGANIZATION CLOSE TO THE MARKETS : KEY FOR SUCCESS
VILMORIN & CIE AT A GLANCE
VEGETABLE SEEDS
VEGETABLE GROWERS
3 BUSINESS UNITS
Key leading brands:
FIELD SEEDS
FARMERS
6 BUSINESS UNITS
Key leading brands:
GARDEN PRODUCTS
MARKET GARDENERS
1 BUSINESS UNIT
Key leading brand:
January, 2018INVESTORS PRESENTATION9
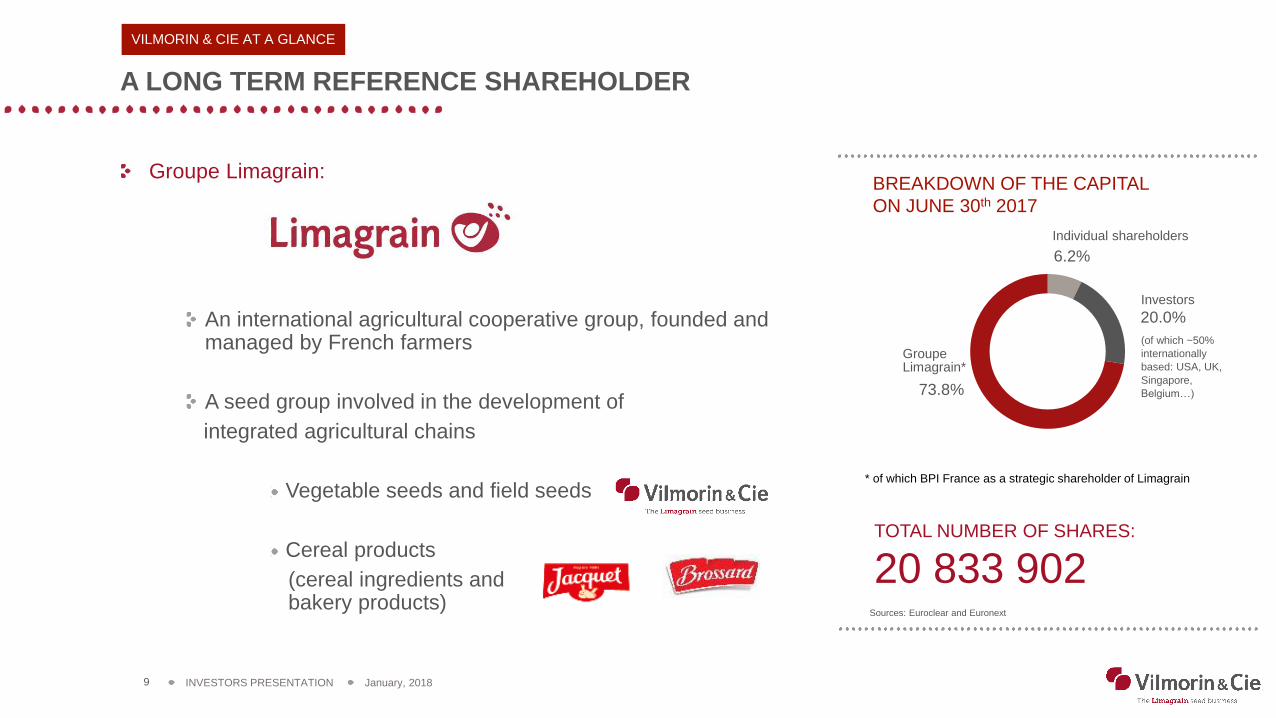
Investors
(of which ~50%
internationally
based: USA, UK,
Singapore,
Belgium…)
A LONG TERM REFERENCE SHAREHOLDER
Groupe Limagrain:
An international agricultural cooperative group, founded and managed by French farmers
A seed group involved in the development of
integrated agricultural chains
Vegetable seeds and field seeds
Cereal products
(cereal ingredients and bakery products)
BREAKDOWN OF THE CAPITAL
ON JUNE 30th 2017
6.2%
20.0%
73.8%
Groupe Limagrain*
Individual shareholders
* of which BPI France as a strategic shareholder of Limagrain
Sources: Euroclear and Euronext
TOTAL NUMBER OF SHARES:
20 833 902
VILMORIN & CIE AT A GLANCE

January, 2018INVESTORS PRESENTATION10
Moving agriculture forward to meet food challenges
A LONG TERM REFERENCE SHAREHOLDER
Groupe Limagrain, a reference shareholder guaranteeing:
Stable corporate governance
Long term strategy
A perfect knowledge of agriculture, customers and theirs needs
LIMAGRAIN IN BRIEF
MISSION
* Figures for the overall scope of activity worldwide, taking into account data from the
companies AgReliant, AGT, Genective, Seed Co and Soltis.
VILMORIN & CIE AT A GLANCE
STRATEGY
KEY FIGURES
To provide farmers throughout the world with sustainable solutions to improve their farms' profitability
Nearly 2,000 farmer members2.6 billion euros in salesMore than 10,000 employees

January, 2018INVESTORS PRESENTATION11
11
VILMORIN & CIE GROWTH STRATEGY
January, 2018INVESTORS PRESENTATION12
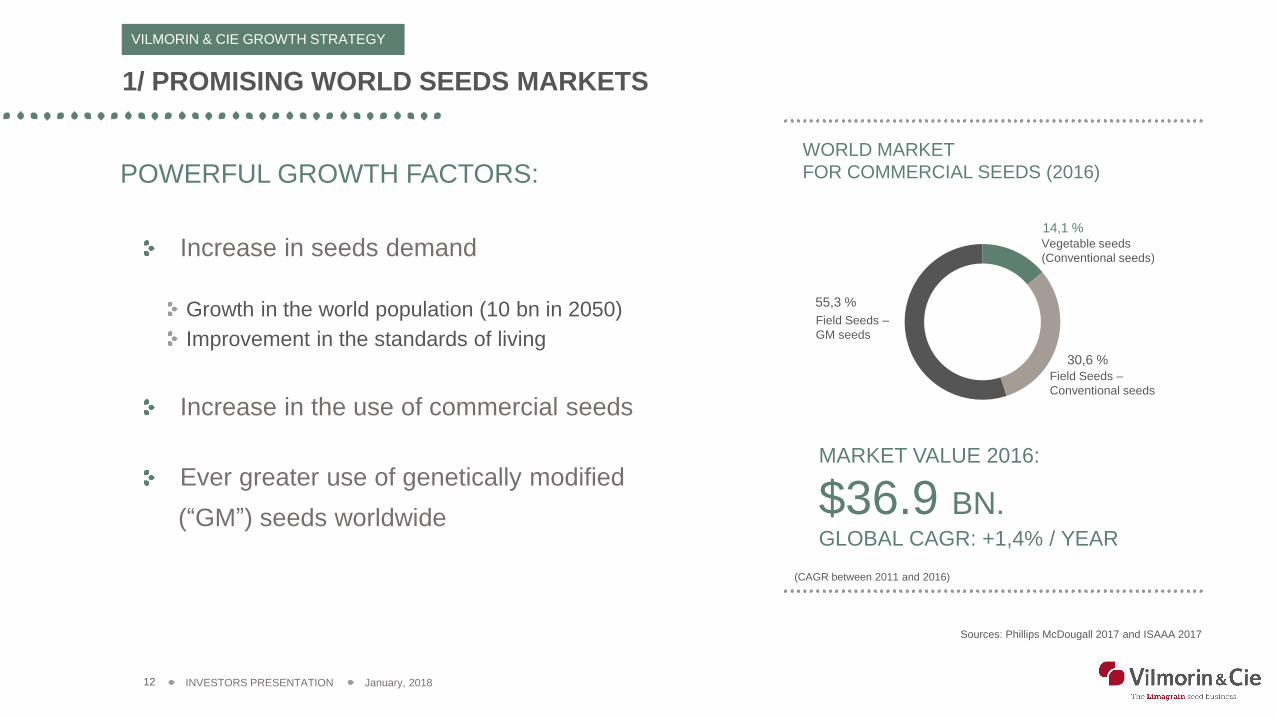
1/ PROMISING WORLD SEEDS MARKETS
VILMORIN & CIE GROWTH STRATEGY
POWERFUL GROWTH FACTORS:
Increase in seeds demand
Growth in the world population (10 bn in 2050)
Improvement in the standards of living
Increase in the use of commercial seeds
Ever greater use of genetically modified
(“GM”) seeds worldwide
Vegetable seeds
(Conventional seeds)
WORLD MARKET
FOR COMMERCIAL SEEDS (2016)
(CAGR between 2011 and 2016)
Field Seeds –
Conventional seeds
Field Seeds –
GM seeds
14,1 %
30,6 %
55,3 %
MARKET VALUE 2016:
$36.9 BN. GLOBAL CAGR: +1,4% / YEAR
Sources: Phillips McDougall 2017 and ISAAA 2017

January, 2018INVESTORS PRESENTATION13
1/ MARKET FOR SEEDS: SLIGHT INCREASE FOR GMO IN 2016
VILMORIN & CIE GROWTH STRATEGY
WORLD MARKET ACREAGE
185.1 million hectares (around 10% of arable land), +3% / 2015,
grown by 18 million farmers in 26 countries
Sources: ISAAA 2017. Phillips McDougall 2017
WORLD MARKET VALUE
More than $20 billion in 2016 (i.e. 55 % of the world market for seeds), +3% / 2015
million ha
185GMO :
ACREAGE PER COUNTRY
-10
10
30
50
70
90
110
130
150
170
190
1996 1998 2000 2002 2004 2006 2008 2010 2012 2014 2016
Others
China
India
Canada
Argentina
Brazil
USA
January, 2018INVESTORS PRESENTATION14
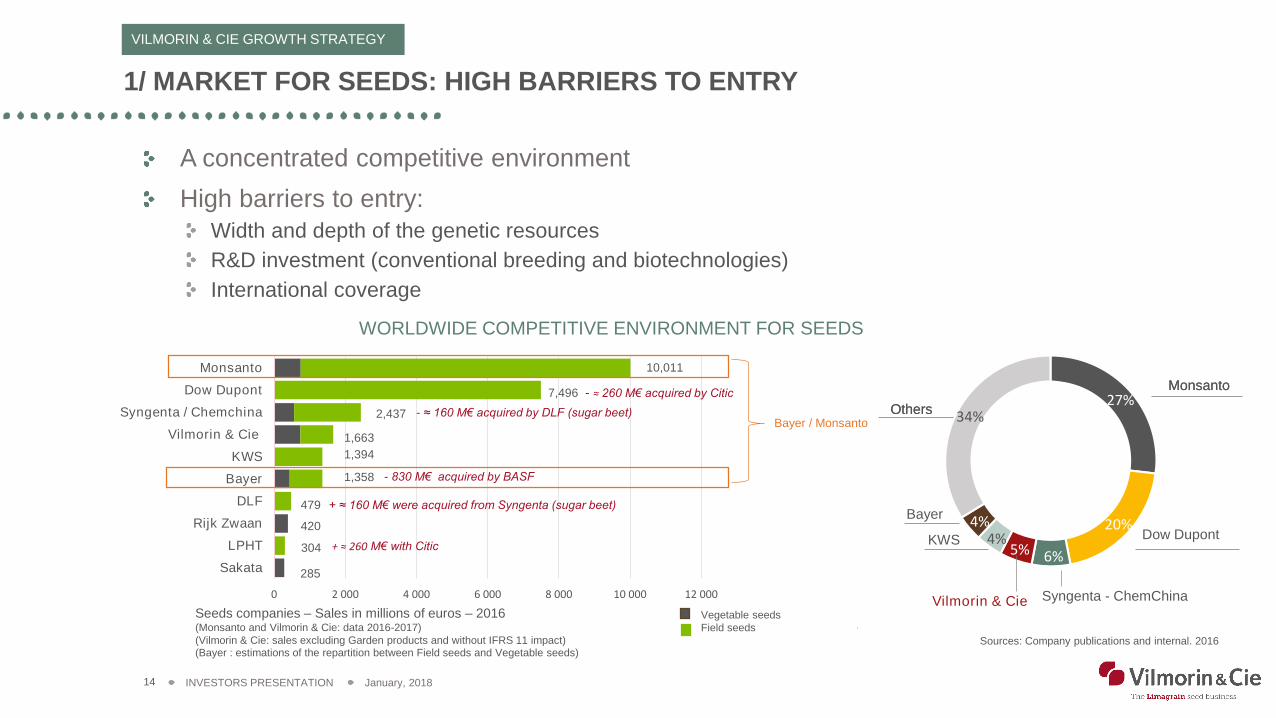
1/ MARKET FOR SEEDS: HIGH BARRIERS TO ENTRY
VILMORIN & CIE GROWTH STRATEGY
A concentrated competitive environment
High barriers to entry:
Width and depth of the genetic resources
R&D investment (conventional breeding and biotechnologies)
International coverage
WORLDWIDE COMPETITIVE ENVIRONMENT FOR SEEDS
Seeds companies – Sales in millions of euros – 2016(Monsanto and Vilmorin & Cie: data 2016-2017)
(Vilmorin & Cie: sales excluding Garden products and without IFRS 11 impact) (Bayer : estimations of the repartition between Field seeds and Vegetable seeds)
Sources: Company publications and internal. 2016
KWS
Monsanto
Others
Vegetable seeds
Field seeds
0 2 000 4 000 6 000 8 000 10 000 12 000
Sakata
LPHT
Rijk Zwaan
DLF
Bayer
KWS
Vilmorin & Cie
Syngenta / Chemchina
Dow Dupont
Monsanto
+ ≈ 260 M€ with Citic
- 830 M€ acquired by BASF
Bayer / Monsanto
+ ≈ 160 M€ were acquired from Syngenta (sugar beet)
7,496 - ≈ 260 M€ acquired by Citic
1,663
1,394
420
479
304
285
2,437 - ≈ 160 M€ acquired by DLF (sugar beet)
10,011
1,358
27%
20%
6%5%4%
4%
34%
Dow Dupont
Syngenta - ChemChina
Bayer
Vilmorin & Cie
Monsanto
Others

January, 2018INVESTORS PRESENTATION15
2/ A STRATEGY OF WINNING MARKET SHARES
VILMORIN & CIE GROWTH STRATEGY
3 strategic priorities
3 strategic foundations
INNOVATION TARGETED POLICY OF
EXTERNAL GROWTHINTERNATIONALIZATION
Vegetable seeds: reinforce world leadership
Corn seeds: become a global actor
Wheat seeds : become the world reference

January, 2018INVESTORS PRESENTATION16
34%
33%
17%
16%
3 / VEGETABLE SEEDS. DIVISION PROFILE
VILMORIN & CIE GROWTH STRATEGY
Tomato
Sweet and hot pepper
Carrot
Melon
SquashBeanOnion
Others
SALES OF VEGETABLE SEEDSPER CROP. 2016-2017
SALES OF VEGETABLE SEEDSPER GEOGRAPHICAL AREA. 2016-2017
Europe
Americas
Africa / Middle East
Asia / Oceania
KEY FIGURES 2016-2017
32736
17.1%
COUNTRIES
WITH
LOCATIONS
M€
SALES
OPERATING
MARGIN
Current operating margin : 17.3%
1
3
1
1
22
1,2,3: worldwide competitive positions
N°2in the
world
- A very strong competitive position addressing worldwide vegetable growers and food processors
- An extremely diversified product line-up with more than 30 species (tomato, carrot, melon, pepper, bean, etc.)
January, 2018INVESTORS PRESENTATION17
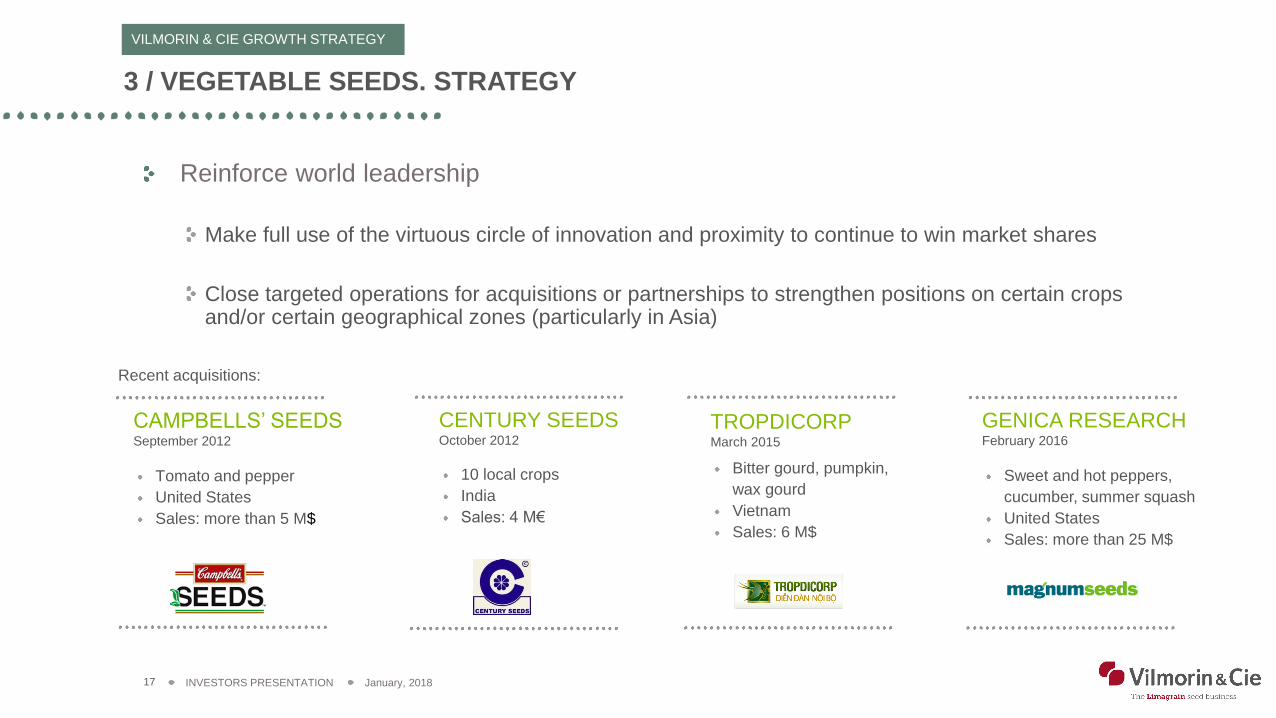
3 / VEGETABLE SEEDS. STRATEGY
VILMORIN & CIE GROWTH STRATEGY
Reinforce world leadership
Make full use of the virtuous circle of innovation and proximity to continue to win market shares
Close targeted operations for acquisitions or partnerships to strengthen positions on certain crops and/or certain geographical zones (particularly in Asia)
CAMPBELLS’ SEEDSSeptember 2012
Tomato and pepper
United States
Sales: more than 5 M$
CENTURY SEEDSOctober 2012
10 local crops
India
Sales: 4 M€
TROPDICORP March 2015
Bitter gourd, pumpkin,
wax gourd
Vietnam
Sales: 6 M$
GENICA RESEARCHFebruary 2016
Sweet and hot peppers,
cucumber, summer squash
United States
Sales: more than 25 M$
Recent acquisitions:

January, 2018INVESTORS PRESENTATION18
52%
42%
3% 3%
4 / FIELD SEEDS. DIVISION PROFILE
VILMORIN & CIE GROWTH STRATEGY
SALES OF FIELD SEEDS*PER GEOGRAPHICAL AREA. 2016-2017
Europe
Americas
Asia / Oceania
KEY FIGURES 2016-2017
33
626
2.7%
COUNTRIES
WITH
LOCATIONS*
M€
SALES
OPERATING
MARGIN
Current operating margin : 3.6%
(928 M€)*
N°1in Europe
for straw
cereals
N°3in North
America
And N°4in Europe
for corn seeds
- One of the top players in strategic crops targeting farmers
- 2 worldwide strategic crops: corn and wheat
- And regional strategic crops: sunflower, rapeseed and barley in Europe, rice in India, and soybean, which Vilmorin & Cie distributes in North and South America and in South Africa
11%
4%
4%
15%
66%
SALES OF FIELD SEEDS*PER CROP. 2016-2017
Cereals (corn,
wheat, barley)
Other field seeds
Rapeseed
Feed grains
Sunflower
(1) Wheat and barley
Africa / Middle East
* Without the application of the standard IFRS 11 (“Joint arrangements”) resulting in certain
activities being consolidated using the “Equity method” since 2014-2015 (in particular AgReliant.
North America. Field Seeds)
(1)

January, 2018INVESTORS PRESENTATION19
4 / CORN SEEDS. STRATEGY
VILMORIN & CIE GROWTH STRATEGY
CORN SEEDS: BECOME A GLOBAL ACTOR
SEED COMinority stake. 2014
#1 African seeds company
Sales: 135 M$
6 factories & 8 research stations in south
east Africa
SEED ASIAMarch 2014
Hybrid tropical corn
Thailand
Sales: 9 M$
HENGJI LIMAGRAIN SEEDSJV. September 2015
Corn
China
Production and distribution
Technological strategic partnership between Vilmorin & Cie and KWS
*Source: USDA
Internationalize activitiesfurther afield from European and North American activities on the largest world seed market in terms of value
(more than $15 bn in 2016*)
GM corn traits licensing agreements with Syngenta (October 2015)
Develop a proprietary portfolio of GM seeds
Recent acquisitions:

January, 2018INVESTORS PRESENTATION20
4 / WHEAT SEEDS. STRATEGY
VILMORIN & CIE GROWTH STRATEGY
WHEAT SEEDS: BECOME THE WORLD REFERENCE
*Source: USDA
Consolidate position of leader in Europe and become the world reference of the first worldwide crop in terms of cultivated surface areas (more than 220 million hectares in 2016*)
Develop more efficient seeds and contributeto converting the market to high yield seeds
Gradually extend the positions to other major wheat markets and develop strong partnerships internationally
NORTH AMERICA
United States
Canada
AUSTRALIA
Australian Grain Technologies
OTHER ZONES
South America
Asia
January, 2018INVESTORS PRESENTATION21
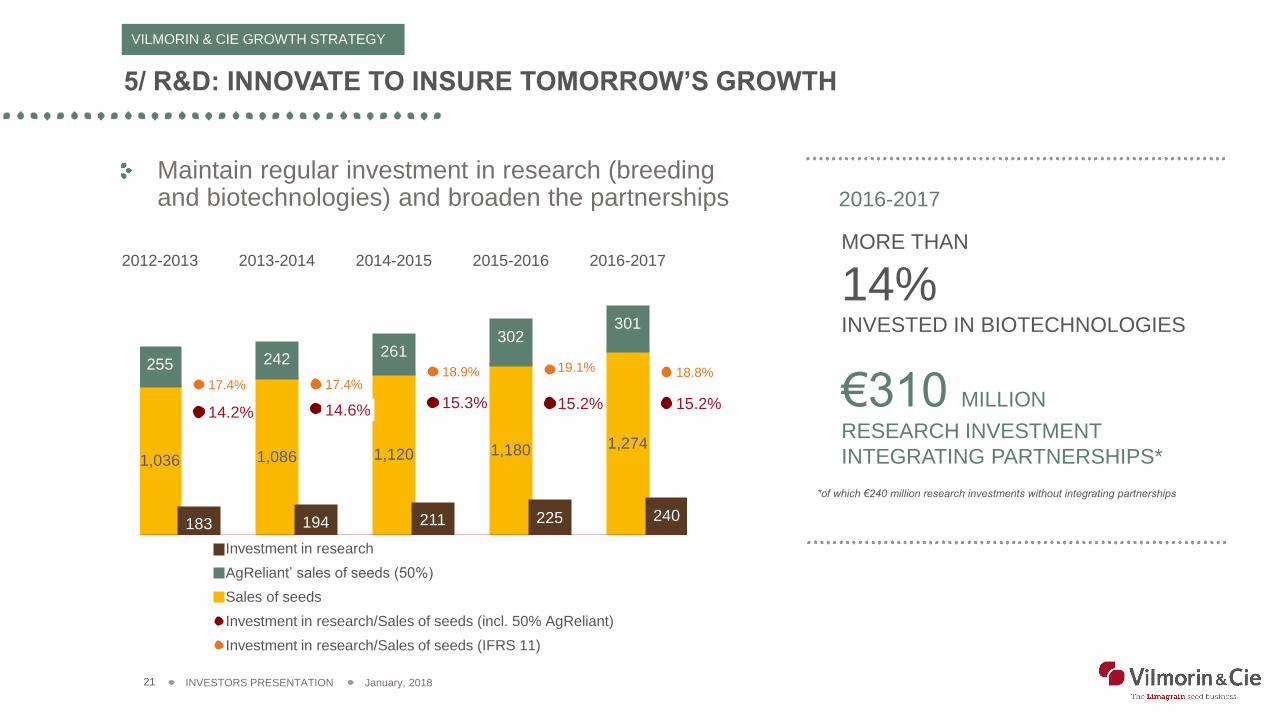
5/ R&D: INNOVATE TO INSURE TOMORROW’S GROWTH
VILMORIN & CIE GROWTH STRATEGY
2016-2017
*of which €240 million research investments without integrating partnerships
€310 MILLION
RESEARCH INVESTMENT
INTEGRATING PARTNERSHIPS*
MORE THAN
14%INVESTED IN BIOTECHNOLOGIES
Maintain regular investment in research (breeding and biotechnologies) and broaden the partnerships
1,036 1,086 1,120 1,180 1,274
255 242261
302301
183 194 211 225 240
14.2% 14.6% 15.3% 15.2% 15.2%
17.4% 17.4%18.9% 19.1% 18.8%
0
200
400
600
800
1 000
1 200
1 400
1 600
1 8002012-2013 2013-2014 2014-2015 2015-2016 2016-2017
Effort de recherche
Chiffre d'affaires semences AgReliant (à 50%)
Chiffre d'affaires semences
Effort de recherche/chiffre d'affaires semences (yc AgReliant 50%)
Effort de recherche/chiffre d'affaires semences (IFRS 11)
Investment in research
AgReliant’ sales of seeds (50%)
Sales of seeds
Investment in research/Sales of seeds (incl. 50% AgReliant)
Investment in research/Sales of seeds (IFRS 11)

January, 2018INVESTORS PRESENTATION22
22
SALES FOR THE 1ST QUARTER 2017-2018 (ON SEPTEMBER 30, 2017)
January, 2018INVESTORS PRESENTATION23
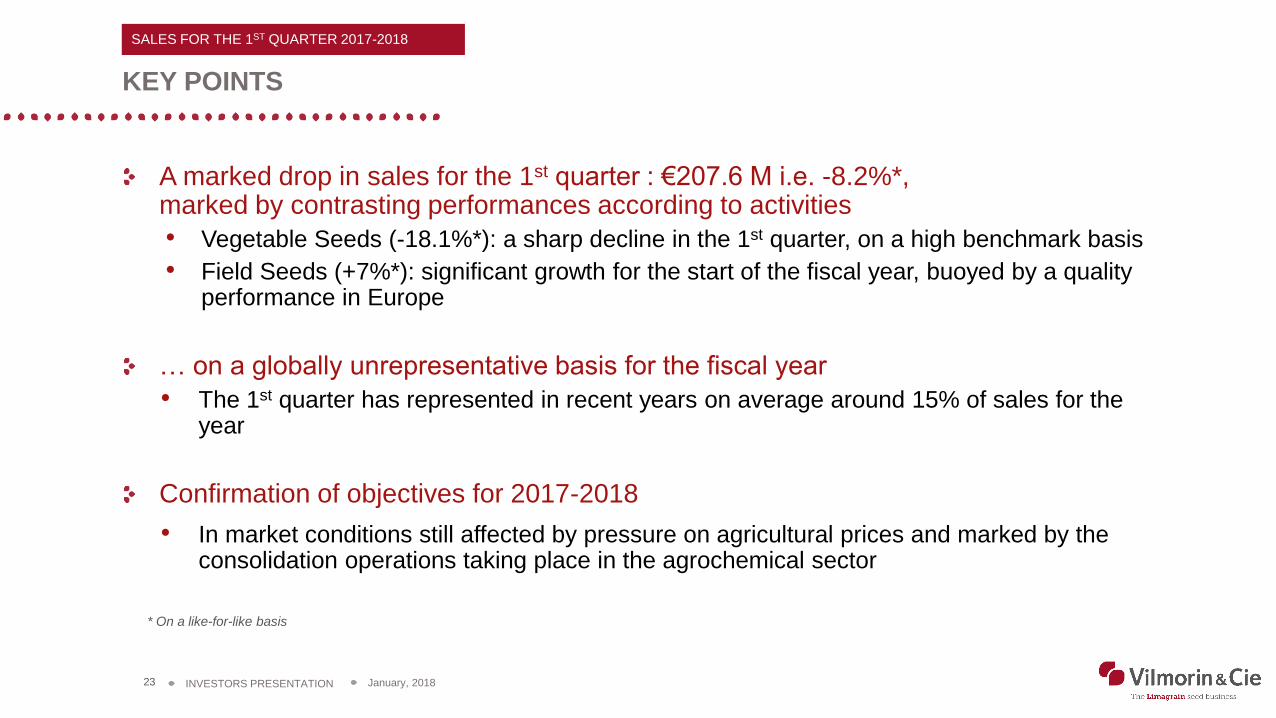
A marked drop in sales for the 1st quarter : €207.6 M i.e. -8.2%*, marked by contrasting performances according to activities
• Vegetable Seeds (-18.1%*): a sharp decline in the 1st quarter, on a high benchmark basis
• Field Seeds (+7%*): significant growth for the start of the fiscal year, buoyed by a quality performance in Europe
… on a globally unrepresentative basis for the fiscal year
• The 1st quarter has represented in recent years on average around 15% of sales for the year
Confirmation of objectives for 2017-2018
• In market conditions still affected by pressure on agricultural prices and marked by the consolidation operations taking place in the agrochemical sector
* On a like-for-like basis
KEY POINTS
SALES FOR THE 1ST QUARTER 2017-2018

January, 2018INVESTORS PRESENTATION24
REFERENCES
SALES FOR THE 1ST QUARTER 2017-2018
2016 2017
$ 1.12 1.17
¥ 114 130
£ 0.85 0.90
TRY 3.31 4.13
ILS 4.25 4.18
BRL 3.62 3.71
INR 75 76
MXN 20.9 20.9
UAH 28.3 30.5
RUB 72.1 69.3
Accounting referenceIFRS on September 30, 2017
Consolidation scopeNo variation
Average rates of the main currencies on September 30, 2017 (and September 30, 2016)

January, 2018INVESTORS PRESENTATION25
CONSOLIDATED SALES*
In M€
53%43%
4%
SALES* FOR THE 1ST QUARTER 2017-2018 PER DIVISION
Vegetable
Seeds
Field
Seeds
Garden Products and
Holdings
SALES FOR THE 1ST QUARTER 2017-2018
* Revenue from ordinary activities
232208
-6 -18
sept.-16 Impactdevises
Activité sept.-17
-10.5%
-8.2%
Currency
impactActivity
January, 2018INVESTORS PRESENTATION26
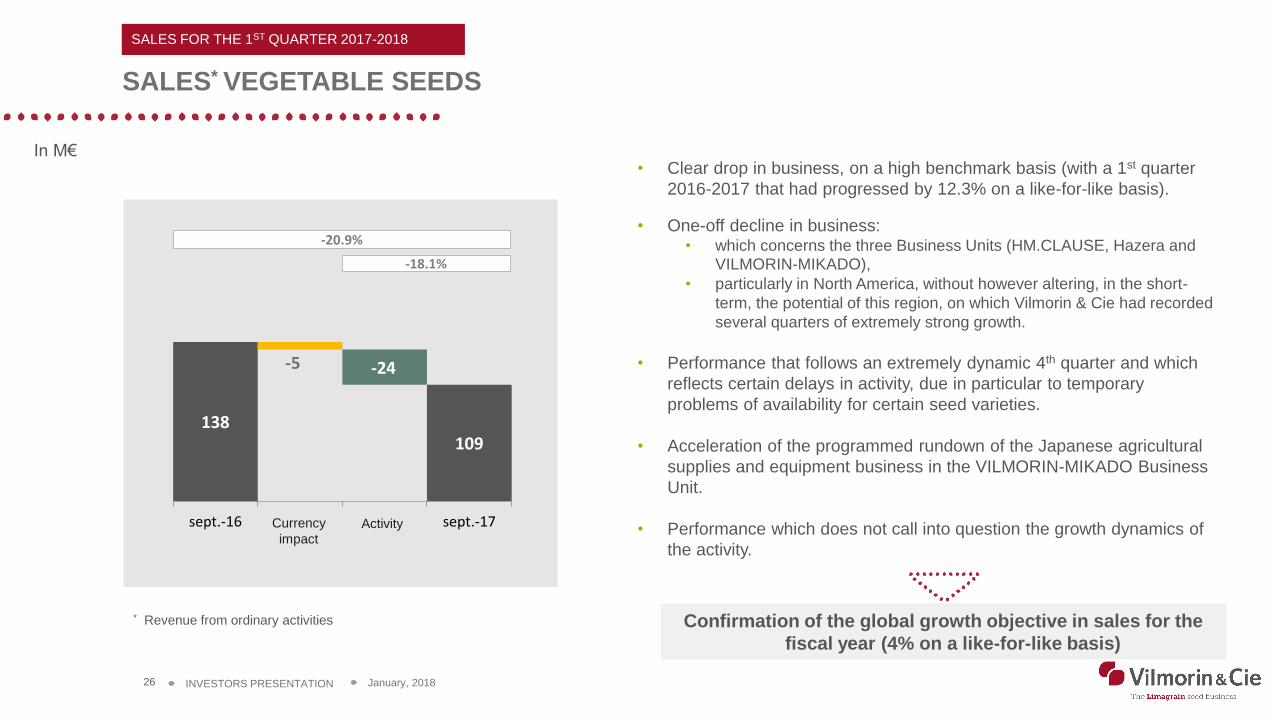
SALES* VEGETABLE SEEDS
In M€
SALES FOR THE 1ST QUARTER 2017-2018
• Clear drop in business, on a high benchmark basis (with a 1st quarter
2016-2017 that had progressed by 12.3% on a like-for-like basis).
• One-off decline in business: • which concerns the three Business Units (HM.CLAUSE, Hazera and
VILMORIN-MIKADO),
• particularly in North America, without however altering, in the short-
term, the potential of this region, on which Vilmorin & Cie had recorded
several quarters of extremely strong growth.
• Performance that follows an extremely dynamic 4th quarter and which
reflects certain delays in activity, due in particular to temporary
problems of availability for certain seed varieties.
• Acceleration of the programmed rundown of the Japanese agricultural
supplies and equipment business in the VILMORIN-MIKADO Business
Unit.
• Performance which does not call into question the growth dynamics of
the activity.
* Revenue from ordinary activities
138109
-5
sept.-16 Impactdevises
Activité sept.-17
-20.9%
-18.1%
-24
Confirmation of the global growth objective in sales for the
fiscal year (4% on a like-for-like basis)
Currency
impactActivity

January, 2018INVESTORS PRESENTATION27
SALES* FIELD SEEDS
In M€
SALES FOR THE 1ST QUARTER 2017-2018
Europe:• Rapeseed: high level of growth (volume and value), particularly in Central Europe,
France and the United Kingdom, leading to significant market shares gains, thanks to a
portfolio of highly efficient products from a technical point of view.
• Straw cereals (wheat, barley): very slight increase in sales, in a market still affected by a
reduction in certified seeds.
• Forage and amenity grass seeds: slight growth in business.
South America:• Increase in sales, particularly for soybean, a relevant complement to the corn offering.
• Drop in sales for the first corn campaign in Brazil (safra), reflecting the current evolution
of cultivated acreage for this crop.
• Promising outlook for orders for the 2nd corn campaign (safrinha), for which acreage
should increase, but with less intensity than during the previous fiscal year.
• Confirmation of the growth objectives fixed for this region.
Asia:• Good start to the fiscal year, with a strong increase in business particularly in India.
Europe and North America:• Procurement of corn seeds is nearly complete, and according to the latest estimates, is
globally in line with production plans objectives.
• Revenue from ordinary activities
after application of IFRS 11 (i.e. excluding AgReliant)
8590
6
-1
sept.-16 Impactdevises
Activité sept.-17
+5.9%
+7.0%
Reaffirmation of the objective to increase sales
for the fiscal year (at least 5% on a like-for-like basis)
Currency
impactActivity

January, 2018INVESTORS PRESENTATION28
CONSOLIDATED SALES* PER GEOGRAPHICAL AREA
Americas
€43 M. -23.6%**
Africa/Middle East €20 M. -16.3% **
Europe
€115 M. +1.4%**
Asia/Oceania
€28 M. -24.0%**
60 %
10 %
* Sales of goods
** Current data compared with 2016-2017
56%
21%
13%
10%
Africa/
Middle East
Americas
Asia/Oceania
Europe
SALES FOR THE 1ST QUARTER 2017-2018
January, 2018INVESTORS PRESENTATION29
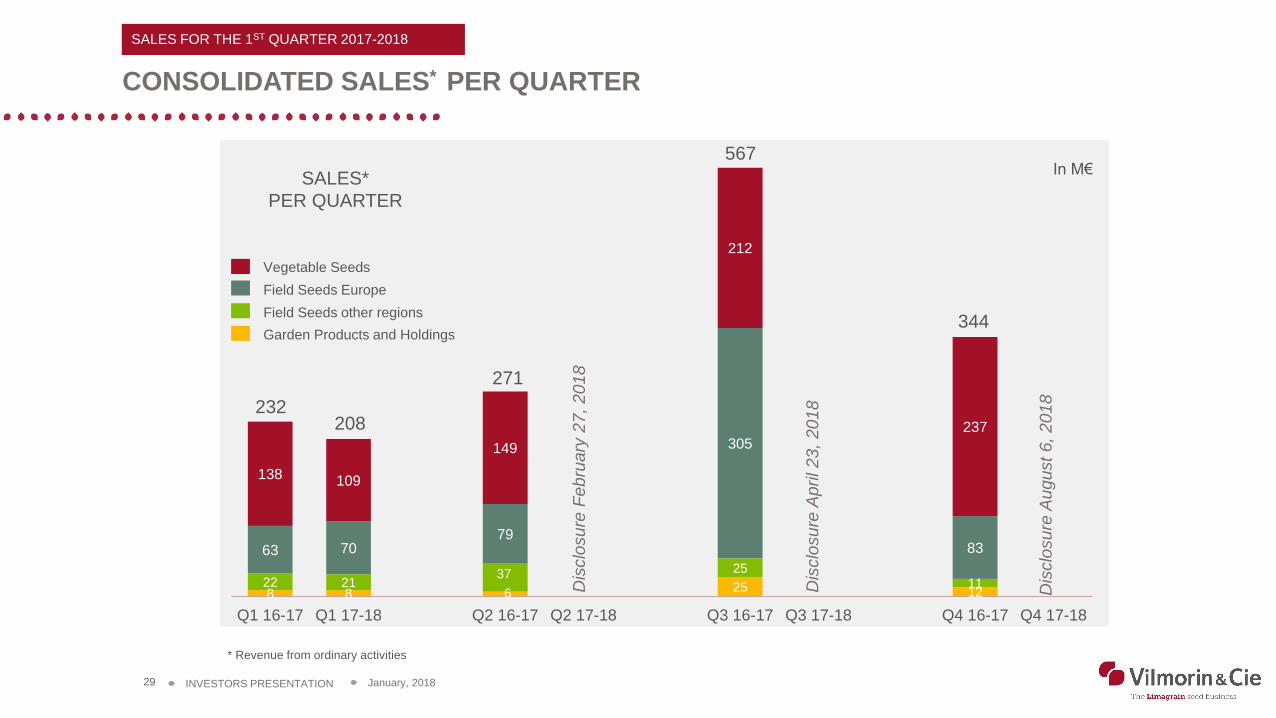
CONSOLIDATED SALES* PER QUARTER
* Revenue from ordinary activities
SALES FOR THE 1ST QUARTER 2017-2018
8 8 6 25 1222 21
37 2511
63 7079
305
83
138 109
149
212
237
Q1 16-17 Q1 17-18 Q2 16-17 Q2 17-18 Q3 16-17 Q3 17-18 Q4 16-17 Q4 17-18
208
In M€
232
271
Vegetable Seeds
Field Seeds Europe
Field Seeds other regions
Garden Products and Holdings
SALES*
PER QUARTER
567
344
Dis
clo
su
re F
eb
rua
ry 2
7,
20
18
Dis
clo
su
re A
pri
l 23,
201
8
Dis
clo
su
re A
ug
ust
6,
20
18
January, 2018INVESTORS PRESENTATION30
OUTLOOK FOR 2017-2018 AND MID-TERM AMBITIONS

January, 2018INVESTORS PRESENTATION31
CONFIRMATION OF OBJECTIVES
OUTLOOK FOR 2017-2018
Vegetable Seeds
Strengthen world leadership:
> By pursuing innovation in plant breeding and close proximity to markets.
> While remaining on the look-out for any external growth opportunity
to consolidate positions for strategic zones and crops.
In Japan, Vilmorin & Cie will pursue its programmed rundown of the agricultural
supplies and equipment activity of the Business Unit VILMORIN-MIKADO.
Objective for 2017-2018
Sales for Vegetable Seeds = +4%on a like-for-like basis
Field Seeds
Strengthen positions in regions where facilities have been established:Objective for 2017-2018
Sales for Field Seeds > +5%on a like-for-like basis
> In market conditions that will probably remain difficult in Europe.
> Pursuing the deployment of the strategic plan for Field Seeds aiming to:
- Become a global player in corn seeds.
- Ultimately become the world reference for wheat seeds.

January, 2018INVESTORS PRESENTATION32
CONFIRMATION OF OBJECTIVES
OUTLOOK FOR 2017-2018
Achieve significant growth in sales and consolidate the current operating margin rate
Aim for a contribution from its associated companies* at least equivalent to that of 2016-2017.
* Mainly AgReliant (North America. Field Seeds), Seed Co (Africa. Field Seeds) and AGT (Australia. Field Seeds).
Consolidated sales +5%
on a like-for-like basis
Current operating margin rate at the
same level as in 2016-2017, taking into
account research investment ≈ €255 M
Pursue deployment of the development and innovation strategy,
in a long-term vision,
over a fiscal year which should continue to be affected
by the pressure on agricultural prices
and will be marked by the consolidation operations in the agrochemical sector.
January, 201833 INVESTORS PRESENTATION
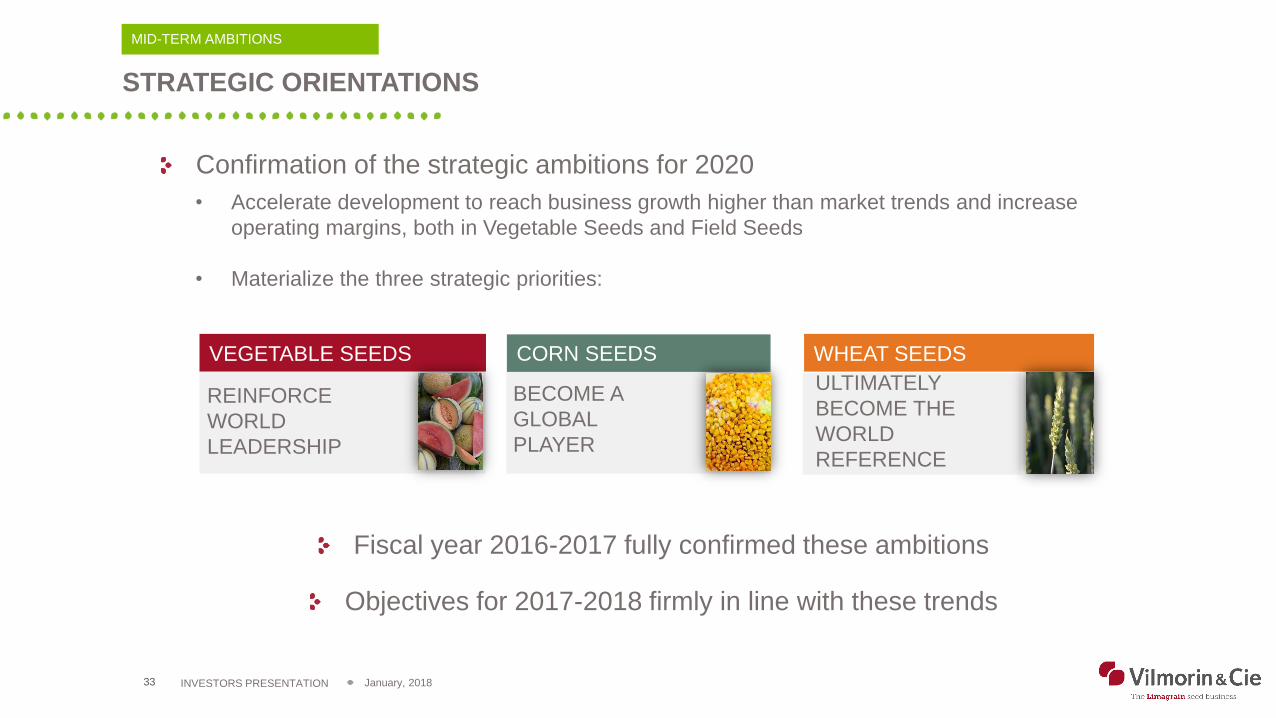
STRATEGIC ORIENTATIONS
MID-TERM AMBITIONS
VEGETABLE SEEDS CORN SEEDS WHEAT SEEDS
ULTIMATELY
BECOME THE
WORLD
REFERENCE
BECOME A
GLOBAL
PLAYER
REINFORCE
WORLD
LEADERSHIP
• Accelerate development to reach business growth higher than market trends and increase
operating margins, both in Vegetable Seeds and Field Seeds
• Materialize the three strategic priorities:
Confirmation of the strategic ambitions for 2020
Fiscal year 2016-2017 fully confirmed these ambitions
Objectives for 2017-2018 firmly in line with these trends

January, 2018INVESTORS PRESENTATION34
VILMORIN & CIEON THE STOCK EXCHANGE

January, 2018INVESTORS PRESENTATION35
(Source: Euronext.com)
€89.70SHARE PRICE
ON JANUARY 5TH, 2018
VILMORIN & CIE ON THE STOCK EXCHANGE
EVOLUTION OF THE SHARE PRICE
Vilmorin & Cie :
Vilmorin & Cie
CAC 40
MARKET CAPITALIZATION
ON JANUARY 5TH, 2018
€1.9 BN.
+ 27.3% 10 years + 26.5% 5 years + 52.3% 1 year

January, 2018INVESTORS PRESENTATION36
VILMORIN & CIE ON THE STOCK EXCHANGE
DIVIDENDS (1)
* Capital gain from the disposal of a minority stake in China.
(1) Data not restated for the allotment of free shares of January 2013 and January 2015.
28.4%Pay-out 35.3% 31.4% 37.2% 44.8% 38.6%
4.37
3.87
4.77
4.04
3.50
2.85
4.17
1.24 1.36 1.50 1.50 1.571.10
1.60
2011 2012 2013 2014 2015 2016 2017
Profit (group share) per share Dividend
1.40*
38.4%
Proposal

January, 2018INVESTORS PRESENTATION37
SCHEDULE AND CONTACTS

January, 2018INVESTORS PRESENTATION38
TUESDAY FEBRUARY 27, 2018
Disclosure of the sales and results for the 1st semester 2017-2018
MONDAY APRIL 23, 2018
Disclosure of the sales for the 3rd quarter 2017-2018
MONDAY AUGUST 6, 2018
Disclosure of the sales at the end for fiscal year 2017-2018
WEDNESDAY OCTOBER 17, 2018
Disclosure of the annual results for fiscal year 2017-2018
SCHEDULE
January, 2018INVESTORS PRESENTATION39
FOR ANY FURTHER INFORMATION:
CONTACTS
Valérie MONSERAT
All our financial information on
www.vilmorincie.com
Vilmorin & Cie
Head Office: 4 quai de la Mégisserie – F-75001 PARIS
Postal address: CS 20001 Saint-Beauzire – F-63360 GERZAT
Tel: +33 (0)473 634 485
Vincent SUPIOT

January, 2018INVESTORS PRESENTATION40
APPENDICESKey financial data for fiscal year 2016-2017Organization chart
January, 2018INVESTORS PRESENTATION41
APPENDICESKey financial data for fiscal year 2016-2017

January, 2018INVESTORS PRESENTATION42
INCOME STATEMENT
In M€ 2015-2016 2016-2017 Variation
Sales 1 325.1 1 414.0 +6.7%
Sales margin 632.2 687.0 +€54.8 M
Sales margin rate 47.7% 48.6% +0.9 pt
Operating income 100.3 118.3 +€18.0 M
Operating margin rate 7.6% 8.4% +0.8 pt
Current operating margin rate 8.4% 9.2% +0.8 pt
Income from associated companies 30.8 33.9 +€3.1 M
Financial income -36.5 -24.5 -(€12.0) M
Income taxes -33.8 -37.6 +(€3.8) M
Net income 60.8 90.1 +€29.3 M
Net income Group share 59.3 86.9 +€27.6 M
RESULTS FOR FISCAL YEAR 2016-2017

January, 2018INVESTORS PRESENTATION43
KEY FIGURES FOR EACH ACTIVITY’S CONTRIBUTION TO CONSOLIDATED SALES
* Revenue from ordinary activities
Sales* Operating income Net income
In M€ 2015-2016 2016-2017 2015-2016 2016-2017 2015-2016 2016-2017
Vegetable Seeds 688.7 735.8 109.3 125.8 71.6 84.9
Field Seeds 581.7 626.0 10.6 17.2 17.3 31.9
Garden Products 53.6 51.2 -4.6 -6.7 -4.6 -6.9
Holdings 1.1 1.0 -15.0 -18.0 -23.5 -19.8
Consolidated 1 325.1 1 414.0 100.3 118.3 60.8 90.1
RESULTS FOR FISCAL YEAR 2016-2017

January, 2018INVESTORS PRESENTATION44
FREE CASH-FLOW
In M€ 2015-2016 2016-2017
Net indebtedness at the beginning of the FY 660 742
EBITDA 278 316
Variation of working capital needs 20 -43
Other operating items -28 -12
Net industrial investments -46 -38
Activated development costs -157 -165
Operating cash-flow 68 57
Net financial investments -116 -5
Capital and other equity contributions -1 -
Dividends -10 -4
Net financial charges -23 -23
Free cash-flow -83 25
Other restatements (IFRS/Currency, etc.) 1 3
Net indebtedness at the end of the FY 742 714
RESULTS FOR FISCAL YEAR 2016-2017

January, 2018INVESTORS PRESENTATION45
BALANCE SHEET STRUCTURE
Total balance sheet 2 159 2 179
of which cash 207 256
In M€
Gearing 55%
Leverage 2.3
742 714
64 7689 80
1 264 1 309
June 2016 June 2017
Equity
Provisions
Net deferred taxes
Net indebtedness
468 492
1 691 1 687
Net fixed assets
Net working capitalneeds
RESULTS FOR FISCAL YEAR 2016-2017

January, 2018INVESTORS PRESENTATION46
APPENDICESVILMORIN & CIE ORGANIZATION CHART
January, 2018INVESTORS PRESENTATION47
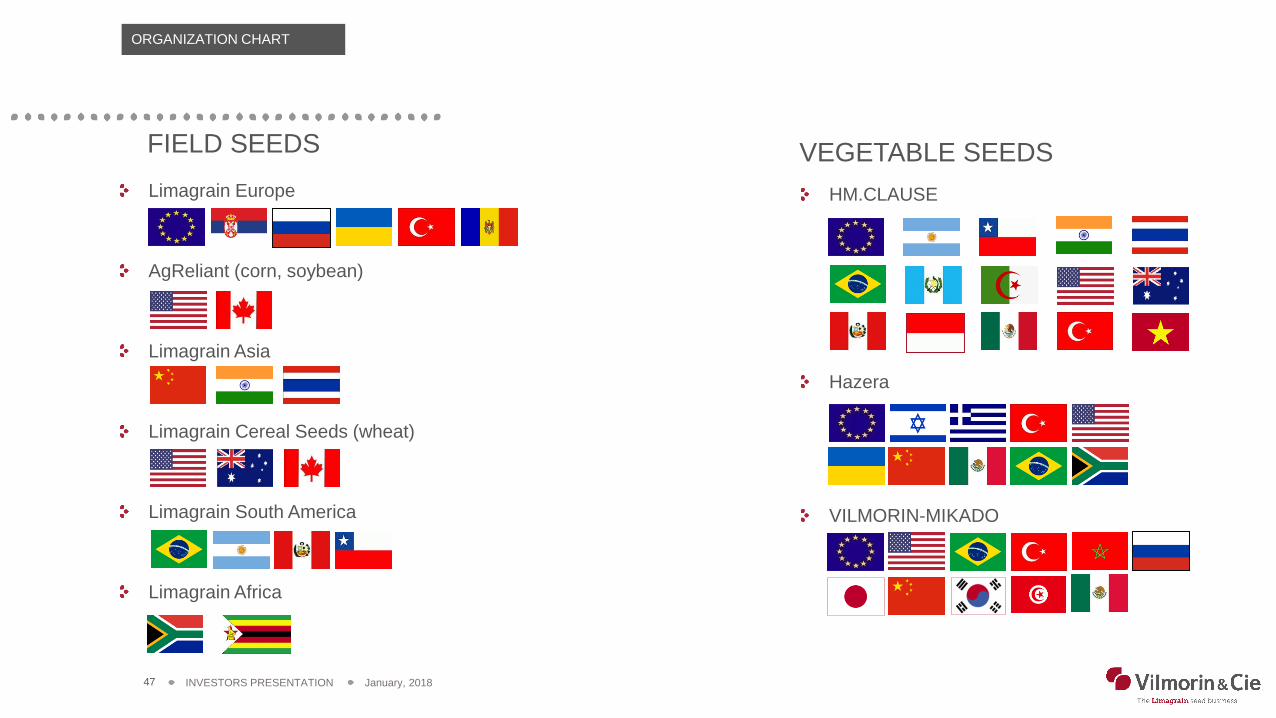
FIELD SEEDS
Limagrain Europe
AgReliant (corn, soybean)
Limagrain Asia
Limagrain Cereal Seeds (wheat)
Limagrain South America
Limagrain Africa
ORGANIZATION CHART
VEGETABLE SEEDS
HM.CLAUSE
Hazera
VILMORIN-MIKADO

January, 2018INVESTORS PRESENTATION48
THANK YOUVILMORIN & CIE
Head office: 4 quai de la Mégisserie – F-75001 PARIS
Postal address: CS 20001 Saint-Beauzire – F-63360 GERZAT
Tel: +33 473 634 485
www.vilmorincie.com


