World Leadership in High Power Fiber Lasers
www.ipgphotonics.com
IPG Photonics CorporationThe Fiber Laser Company™
(NASDAQ: IPGP)
2015 Bank of America Merrill Lynch
Global Technology Conference
June 2015
Safe Harbor Statement
2
The statements in this presentation that relate to future plans, market forecasts, events or performance are forward-looking statements. These statements involve risks and uncertainties, including, risks associated with the strength or weakness of the business conditions in industries and geographic markets that IPG serves, particularly the effect of downturns in the markets IPG serves; uncertainties and adverse changes in the general economic conditions of markets; IPG's ability to penetrate new applications for fiber lasers and increase market share; the rate of acceptance and penetration of IPG's products; inability to manage risks associated with international customers and operations; foreign currency fluctuations; high levels of fixed costs from IPG's vertical integration; the appropriateness of IPG's manufacturing capacity for the level of demand; competitive factors, including declining average selling prices; the effect of acquisitions and investments; inventory write-downs; intellectual property infringement claims and litigation; interruption in supply of key components; manufacturing risks; government regulations and trade sanctions; and other risks identified in the Company's SEC filings. Readers are encouraged to refer to the risk factors described in the Company's Annual Report on Form 10-K and its periodic reports filed with the SEC, as applicable. Actual results, events and performance may differ materially. Readers are cautioned not to rely on the forward-looking statements, which speak only as of the date hereof. The Company undertakes no obligation to release publicly the result of any revisions to these forward-looking statements that may be made to reflect events or circumstances after the date hereof or to reflect the occurrence of unanticipated events.
IPG Overview
Global leader in industrial fiber lasers
FY 2014 sales of $770 million; YOY growth of 19%
$3.79 diluted EPS; up 28% YOY
Growing acceptance of fiber lasers replacing traditional lasers
Products are sold to OEMs, systems integrators and end
users for use in many industries
Global operations with over 3,000 employees
3
Investment Highlights
Expanding $4.7 billion opportunity for all lasers Approximate average annual growth rate of 6%
Recognized leader in the rapidly growing fiber laser market Estimated 15% CAGR from 2015 to 2019
Significant competitive advantages First mover advantage
Performance, product range and reliability
Lowest cost (vertically integrated model)
Strong IP position
Vertical integration and direct sales model drives
industry-leading margins (54.1% GM in FY 2014)
Broad geographies, end markets and applications Asia & Australia 52%, Europe 33%, North & South America 15%
4
The technology leader and most profitable
company in the rapidly growing fiber laser market
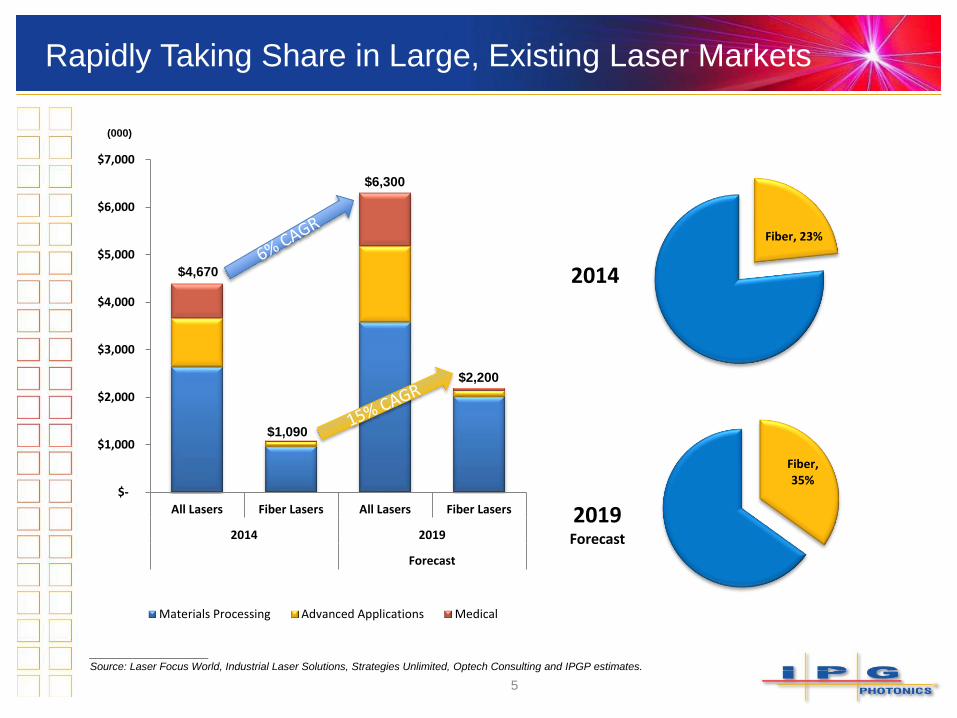
$-
$1,000
$2,000
$3,000
$4,000
$5,000
$6,000
$7,000
All Lasers Fiber Lasers All Lasers Fiber Lasers
2014 2019
Forecast
Materials Processing Advanced Applications Medical
5
Rapidly Taking Share in Large, Existing Laser Markets
$4,670
$1,090
$6,300
$2,200
____________________
Source: Laser Focus World, Industrial Laser Solutions, Strategies Unlimited, Optech Consulting and IPGP estimates.
Fiber, 23%
2014
Fiber, 35%
2019Forecast
(000)
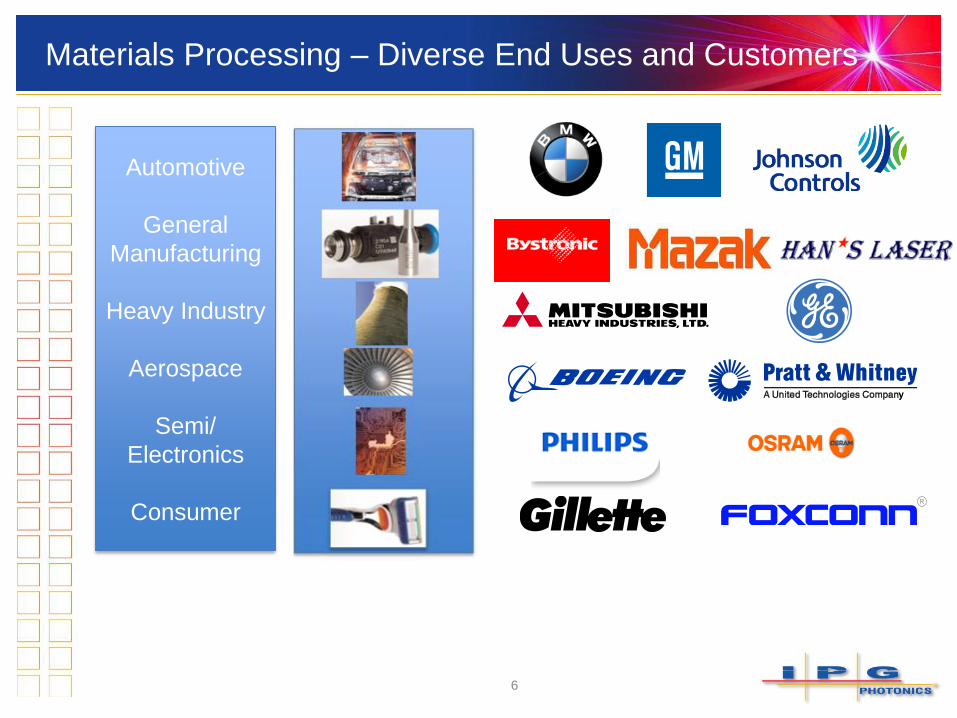
Materials Processing – Diverse End Uses and Customers
6
Automotive
General
Manufacturing
Heavy Industry
Aerospace
Semi/
Electronics
Consumer
7
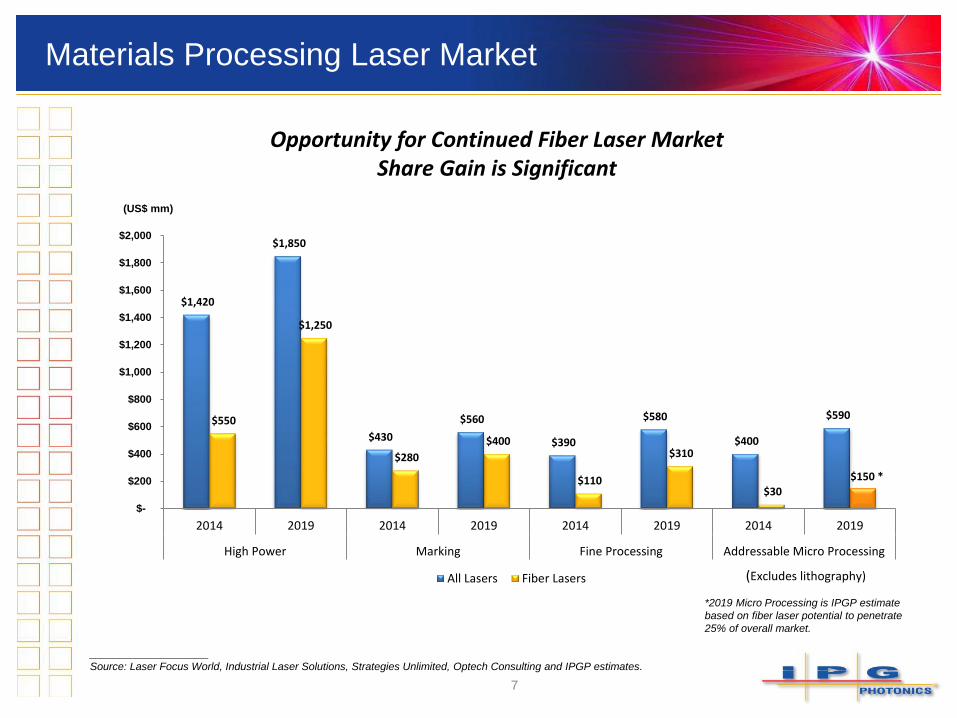
Materials Processing Laser Market
____________________
Source: Laser Focus World, Industrial Laser Solutions, Strategies Unlimited, Optech Consulting and IPGP estimates.
Opportunity for Continued Fiber Laser Market Share Gain is Significant
$1,420
$1,850
$430
$560
$390
$580
$400
$590 $550
$1,250
$280
$400
$110
$310
$30
$150 *
$-
$200
$400
$600
$800
$1,000
$1,200
$1,400
$1,600
$1,800
$2,000
2014 2019 2014 2019 2014 2019 2014 2019
High Power Marking Fine Processing Addressable Micro Processing
All Lasers Fiber Lasers
(US$ mm)
(Excludes lithography)
*2019 Micro Processing is IPGP estimate
based on fiber laser potential to penetrate
25% of overall market.
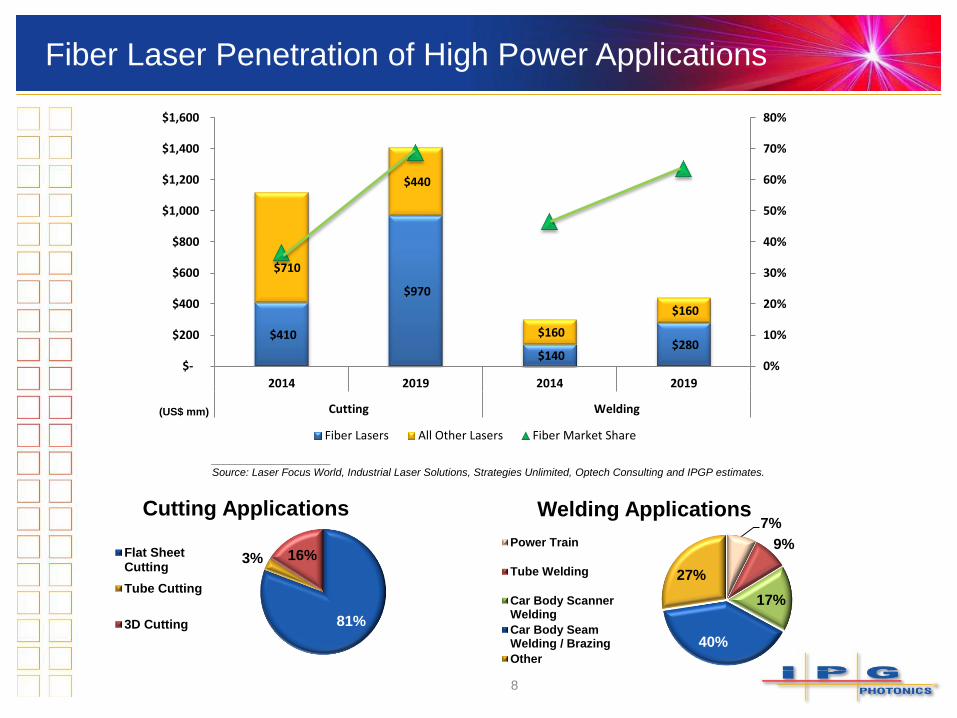
Fiber Laser Penetration of High Power Applications
8
7%
9%
17%
40%
27%
Welding Applications
Power Train
Tube Welding
Car Body ScannerWelding
Car Body SeamWelding / Brazing
Other
81%
3% 16%
Cutting Applications
Flat SheetCutting
Tube Cutting
3D Cutting
$410
$970
$140 $280
$710
$440
$160
$160
0%
10%
20%
30%
40%
50%
60%
70%
80%
$-
$200
$400
$600
$800
$1,000
$1,200
$1,400
$1,600
2014 2019 2014 2019
Cutting Welding
Fiber Lasers All Other Lasers Fiber Market Share
____________________
Source: Laser Focus World, Industrial Laser Solutions, Strategies Unlimited, Optech Consulting and IPGP estimates.
(US$ mm)
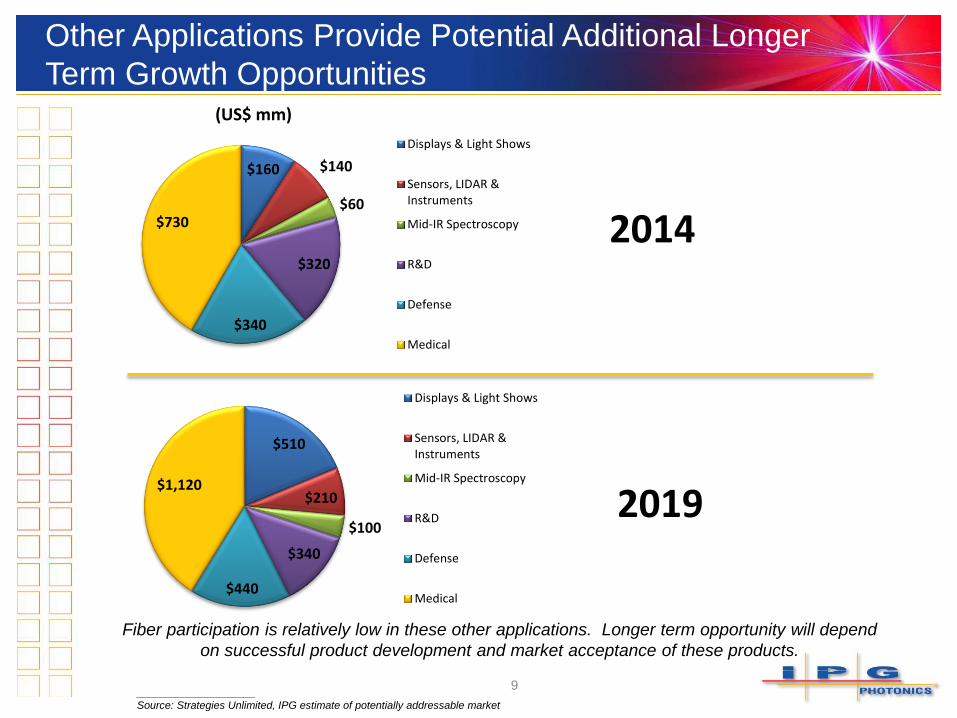
Other Applications Provide Potential Additional Longer
Term Growth Opportunities
9
$160 $140
$60
$320
$340
$730
Displays & Light Shows
Sensors, LIDAR &Instruments
Mid-IR Spectroscopy
R&D
Defense
Medical
2014
$510
$210
$100
$340
$440
$1,120
Displays & Light Shows
Sensors, LIDAR &Instruments
Mid-IR Spectroscopy
R&D
Defense
Medical
2019
(US$ mm)
____________________
Source: Strategies Unlimited, IPG estimate of potentially addressable market
Fiber participation is relatively low in these other applications. Longer term opportunity will depend
on successful product development and market acceptance of these products.
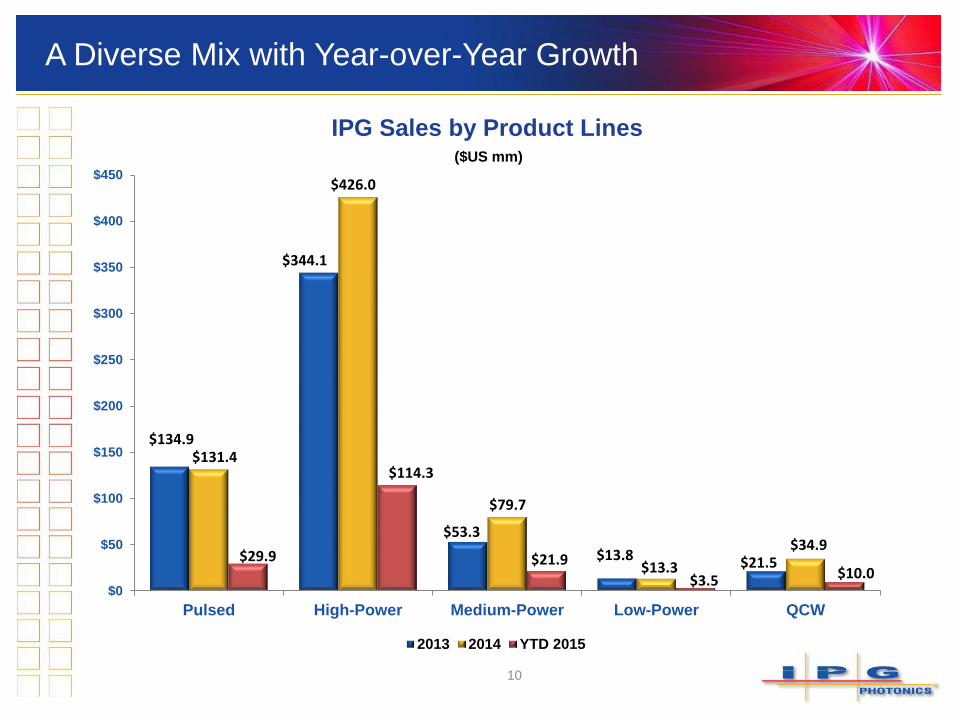
A Diverse Mix with Year-over-Year Growth
10
$134.9
$344.1
$53.3
$13.8 $21.5
$131.4
$426.0
$79.7
$13.3
$34.9 $29.9
$114.3
$21.9
$3.5 $10.0 $0
$50
$100
$150
$200
$250
$300
$350
$400
$450
Pulsed High-Power Medium-Power Low-Power QCW
($US mm)
IPG Sales by Product Lines
2013 2014 YTD 2015
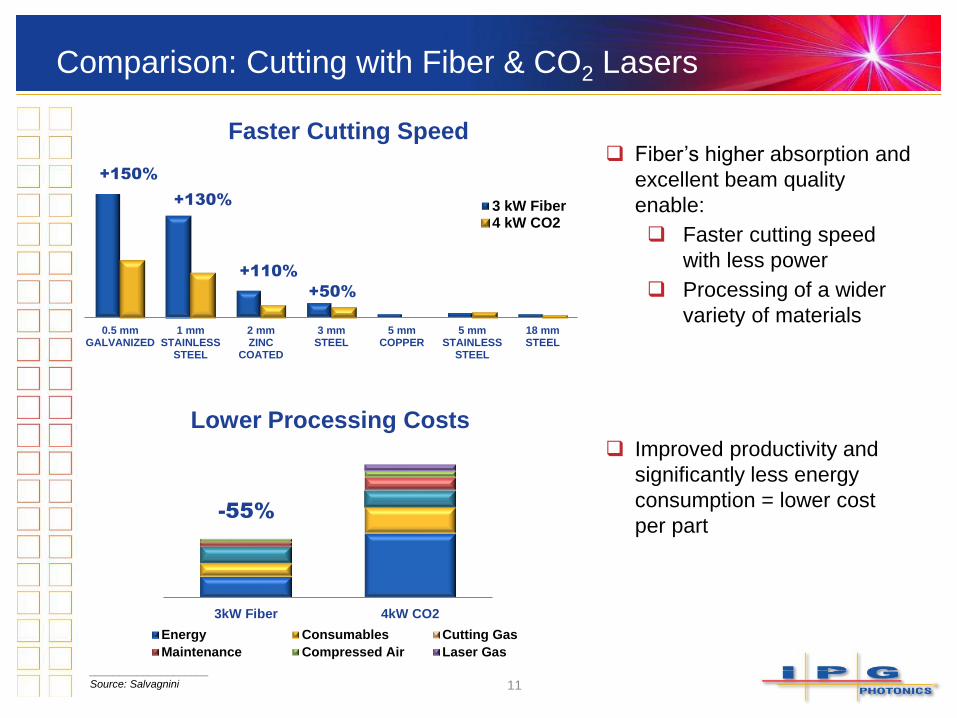
Comparison: Cutting with Fiber & CO2 Lasers
11
0.5 mmGALVANIZED
1 mmSTAINLESS
STEEL
2 mmZINC
COATED
3 mmSTEEL
5 mmCOPPER
5 mmSTAINLESS
STEEL
18 mmSTEEL
3 kW Fiber4 kW CO2
+150%
+130%
+110%
+50%
Faster Cutting Speed Fiber’s higher absorption and
excellent beam quality
enable:
Faster cutting speed
with less power
Processing of a wider
variety of materials
____________________
Source: Salvagnini
3kW Fiber 4kW CO2
Energy Consumables Cutting Gas
Maintenance Compressed Air Laser Gas
-55%
Improved productivity and
significantly less energy
consumption = lower cost
per part
Lower Processing Costs
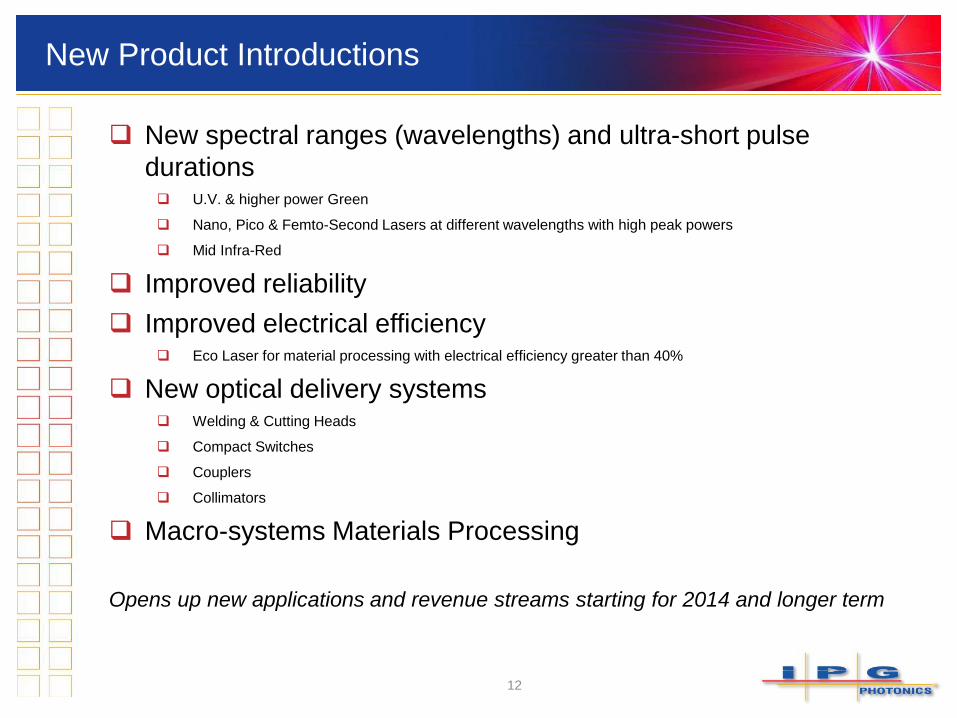
New spectral ranges (wavelengths) and ultra-short pulse
durations U.V. & higher power Green
Nano, Pico & Femto-Second Lasers at different wavelengths with high peak powers
Mid Infra-Red
Improved reliability
Improved electrical efficiency Eco Laser for material processing with electrical efficiency greater than 40%
New optical delivery systems Welding & Cutting Heads
Compact Switches
Couplers
Collimators
Macro-systems Materials Processing
Opens up new applications and revenue streams starting for 2014 and longer term
New Product Introductions
12
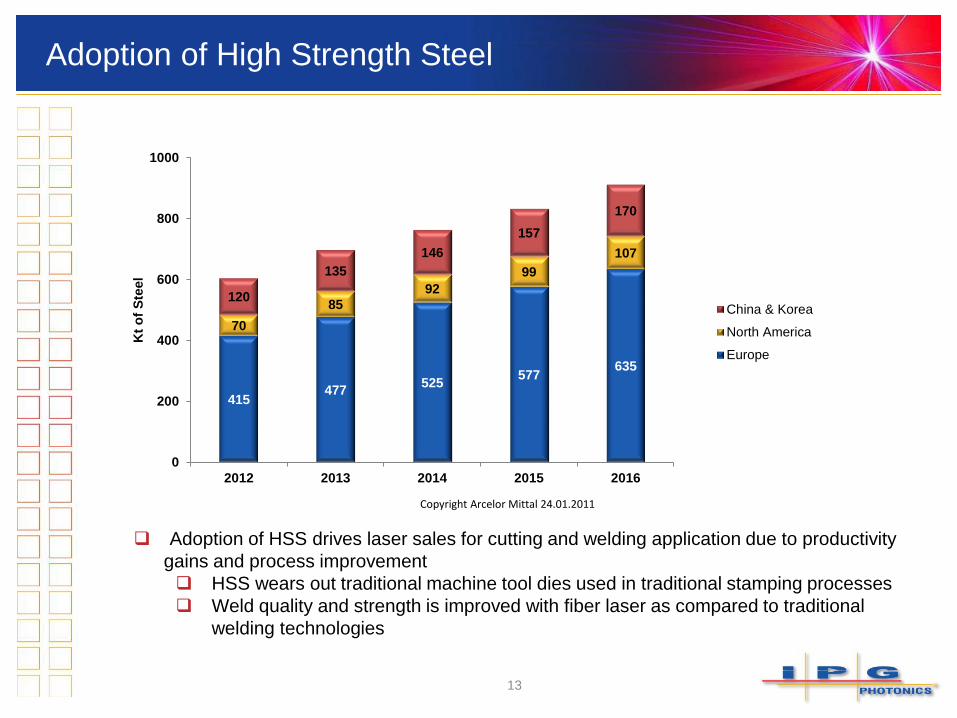
415477
525577
635
70
85
92
99
107
120
135
146
157
170
0
200
400
600
800
1000
2012 2013 2014 2015 2016
Kt
of
Ste
el
China & Korea
North America
Europe
Copyright Arcelor Mittal 24.01.2011
13
Adoption of High Strength Steel
Adoption of HSS drives laser sales for cutting and welding application due to productivity
gains and process improvement
HSS wears out traditional machine tool dies used in traditional stamping processes
Weld quality and strength is improved with fiber laser as compared to traditional
welding technologies
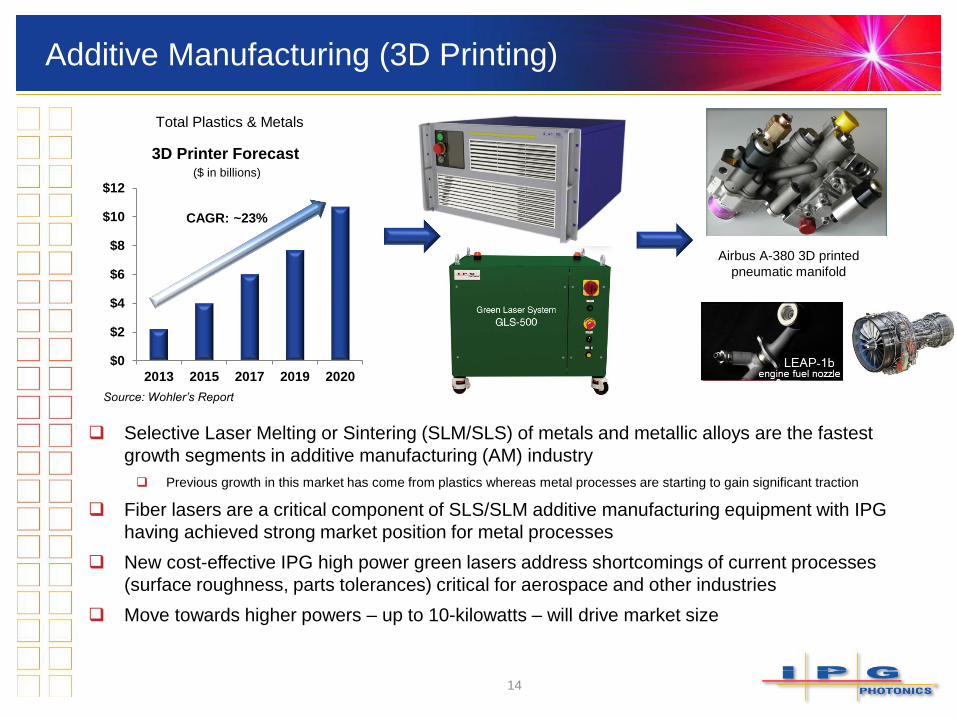
Additive Manufacturing (3D Printing)
Selective Laser Melting or Sintering (SLM/SLS) of metals and metallic alloys are the fastest
growth segments in additive manufacturing (AM) industry
Previous growth in this market has come from plastics whereas metal processes are starting to gain significant traction
Fiber lasers are a critical component of SLS/SLM additive manufacturing equipment with IPG
having achieved strong market position for metal processes
New cost-effective IPG high power green lasers address shortcomings of current processes
(surface roughness, parts tolerances) critical for aerospace and other industries
Move towards higher powers – up to 10-kilowatts – will drive market size
Airbus A-380 3D printed
pneumatic manifold
14
Total Plastics & Metals
$0
$2
$4
$6
$8
$10
$12
2013 2015 2017 2019 2020
3D Printer Forecast($ in billions)
CAGR: ~23%
Source: Wohler’s Report
15
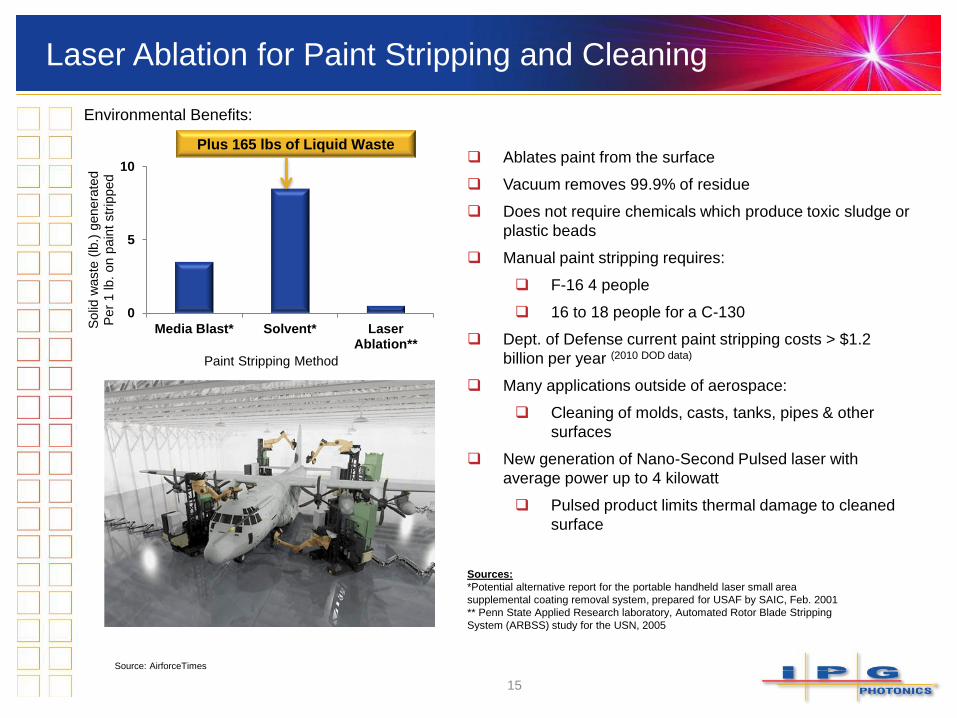
Source: AirforceTimes
Ablates paint from the surface
Vacuum removes 99.9% of residue
Does not require chemicals which produce toxic sludge or
plastic beads
Manual paint stripping requires:
F-16 4 people
16 to 18 people for a C-130
Dept. of Defense current paint stripping costs > $1.2
billion per year (2010 DOD data)
Many applications outside of aerospace:
Cleaning of molds, casts, tanks, pipes & other
surfaces
New generation of Nano-Second Pulsed laser with
average power up to 4 kilowatt
Pulsed product limits thermal damage to cleaned
surface
Laser Ablation for Paint Stripping and Cleaning
Sources:
*Potential alternative report for the portable handheld laser small area
supplemental coating removal system, prepared for USAF by SAIC, Feb. 2001
** Penn State Applied Research laboratory, Automated Rotor Blade Stripping
System (ARBSS) study for the USN, 2005
Environmental Benefits:
0
5
10
Media Blast* Solvent* LaserAblation**
Solid
waste
(lb
.) g
enera
ted
Per
1 lb.
on p
ain
t str
ipped
Paint Stripping Method
Plus 165 lbs of Liquid Waste
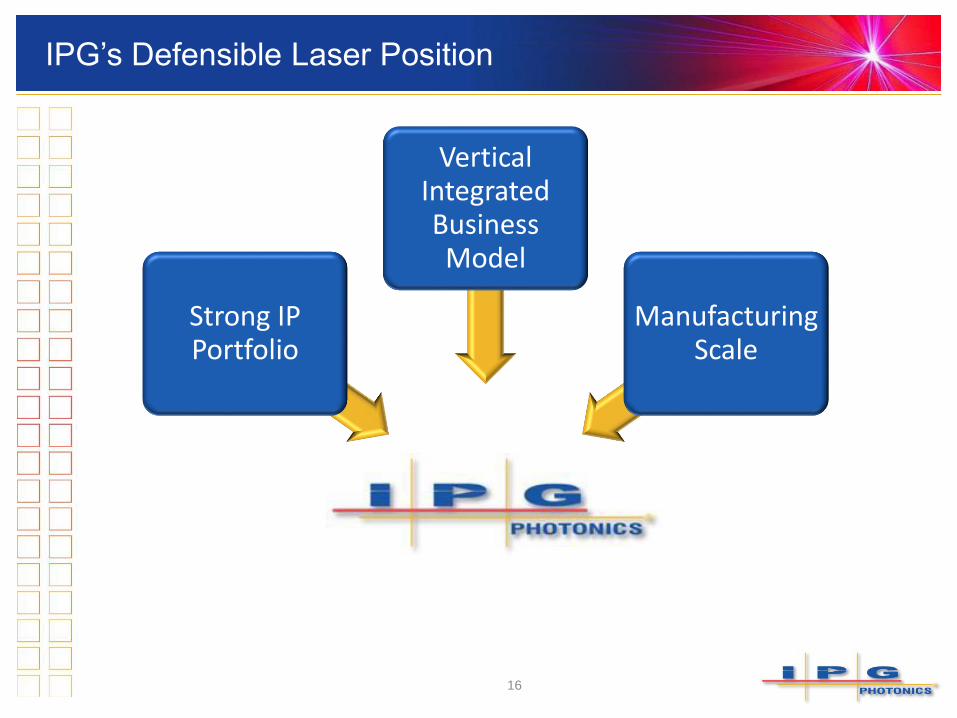
IPG’s Defensible Laser Position
16
Strong IP Portfolio
Vertical Integrated Business Model
Manufacturing Scale
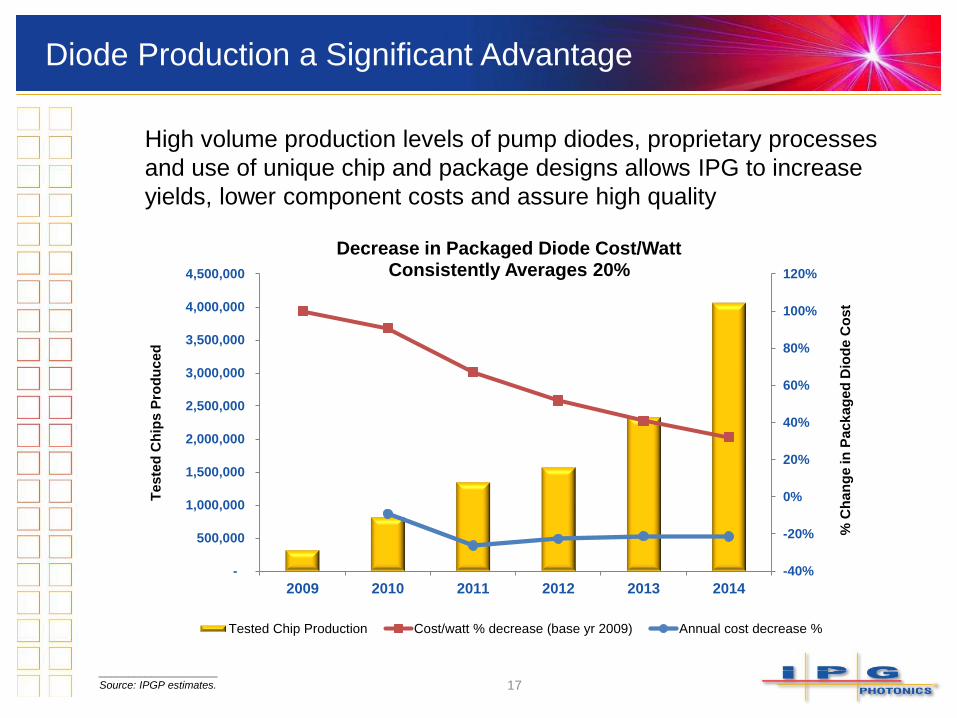
Diode Production a Significant Advantage
17
High volume production levels of pump diodes, proprietary processes
and use of unique chip and package designs allows IPG to increase
yields, lower component costs and assure high quality
____________________
Source: IPGP estimates.
-40%
-20%
0%
20%
40%
60%
80%
100%
120%
-
500,000
1,000,000
1,500,000
2,000,000
2,500,000
3,000,000
3,500,000
4,000,000
4,500,000
2009 2010 2011 2012 2013 2014
% C
ha
ng
e in
Pa
ck
ag
ed
Dio
de
Co
st
Te
ste
d C
hip
s P
rod
uc
ed
Decrease in Packaged Diode Cost/Watt Consistently Averages 20%
Tested Chip Production Cost/watt % decrease (base yr 2009) Annual cost decrease %
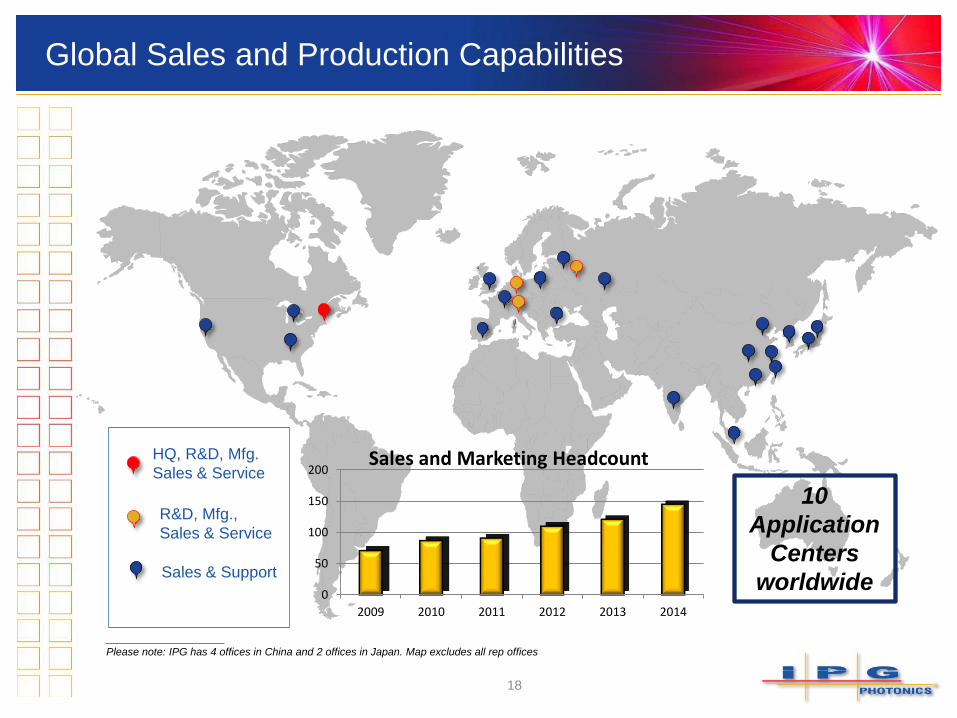
Global Sales and Production Capabilities
____________________
Please note: IPG has 4 offices in China and 2 offices in Japan. Map excludes all rep offices
Sales & Support
R&D, Mfg.,
Sales & Service
HQ, R&D, Mfg.
Sales & Service
18
10
Application
Centers
worldwide0
50
100
150
200
2009 2010 2011 2012 2013 2014
Sales and Marketing Headcount
19
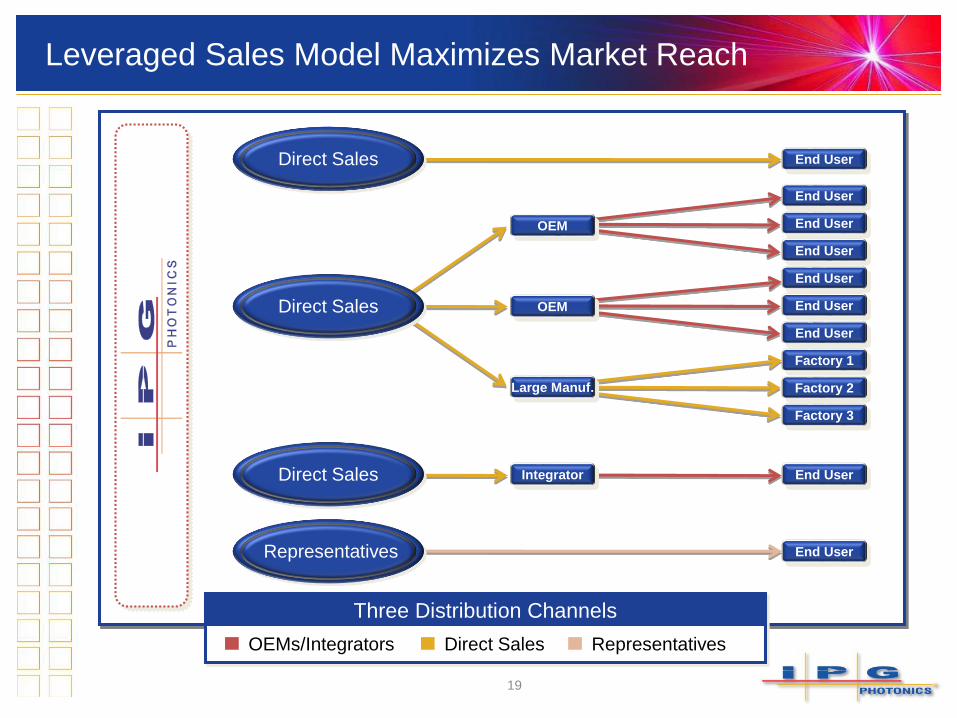
Three Distribution Channels
OEMs/Integrators Direct Sales Representatives
End User
End User
End User
End User
End User
End User
End User
End User
Factory 1
Factory 2
Factory 3
End User
OEM
Large Manuf.
OEM
Integrator
Representatives
Direct Sales
Direct Sales
Direct Sales
Leveraged Sales Model Maximizes Market Reach
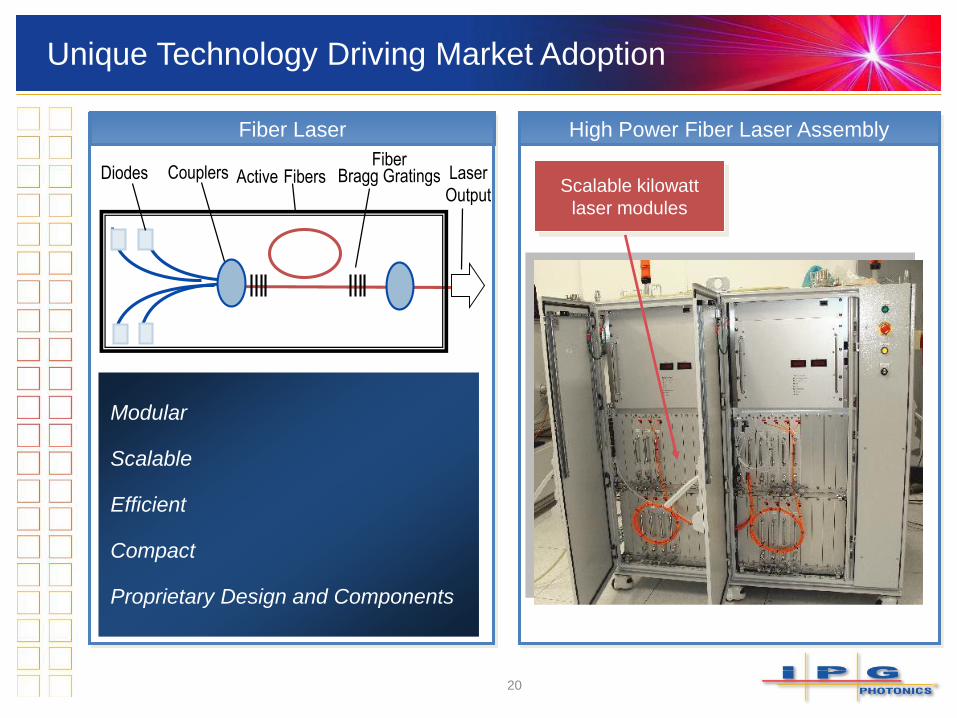
Unique Technology Driving Market Adoption
Fiber Laser
Laser
Output
Fiber Bragg GratingsActive FibersCouplersDiodes
Modular
Scalable
Efficient
Compact
Proprietary Design and Components
High Power Fiber Laser Assembly
Scalable kilowatt
laser modules
20

Vertical Integration Drives Significant Benefits
2121
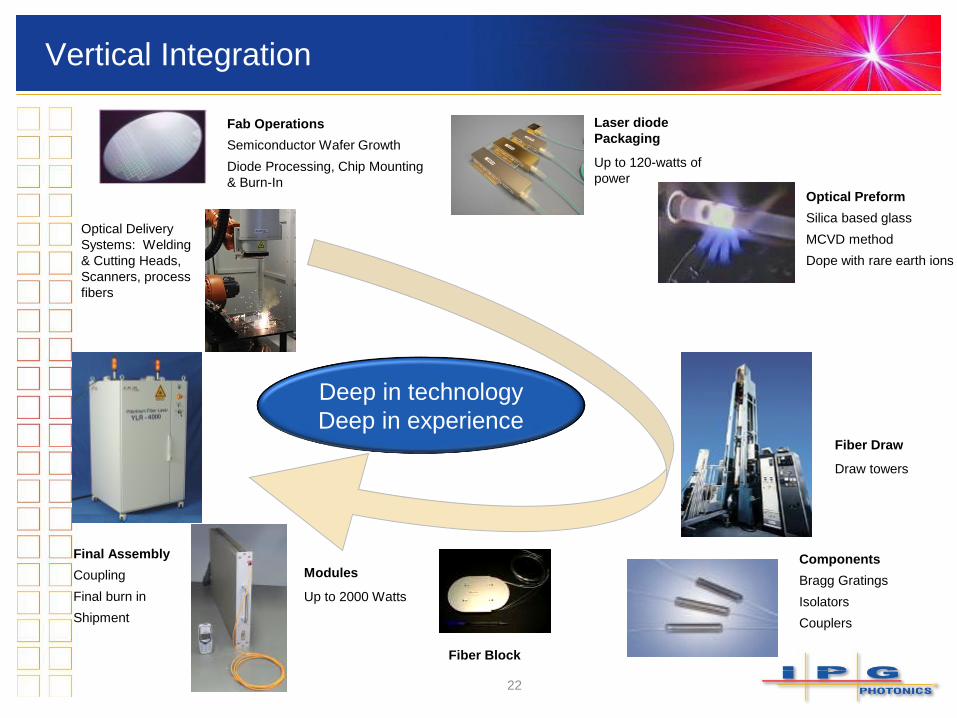
Fab Operations
Semiconductor Wafer Growth
Diode Processing, Chip Mounting
& Burn-In
Laser diode
Packaging
Up to 120-watts of
power
Optical Preform
Silica based glass
MCVD method
Dope with rare earth ions
Fiber Draw
Draw towers
Fiber Block
Modules
Up to 2000 Watts
Final Assembly
Coupling
Final burn in
Shipment
Components
Bragg Gratings
Isolators
Couplers
Deep in technology
Deep in experience
Vertical Integration
22
Optical Delivery
Systems: Welding
& Cutting Heads,
Scanners, process
fibers
World Leadership in High Power Fiber Lasers
www.ipgphotonics.com
Financial Overview
24
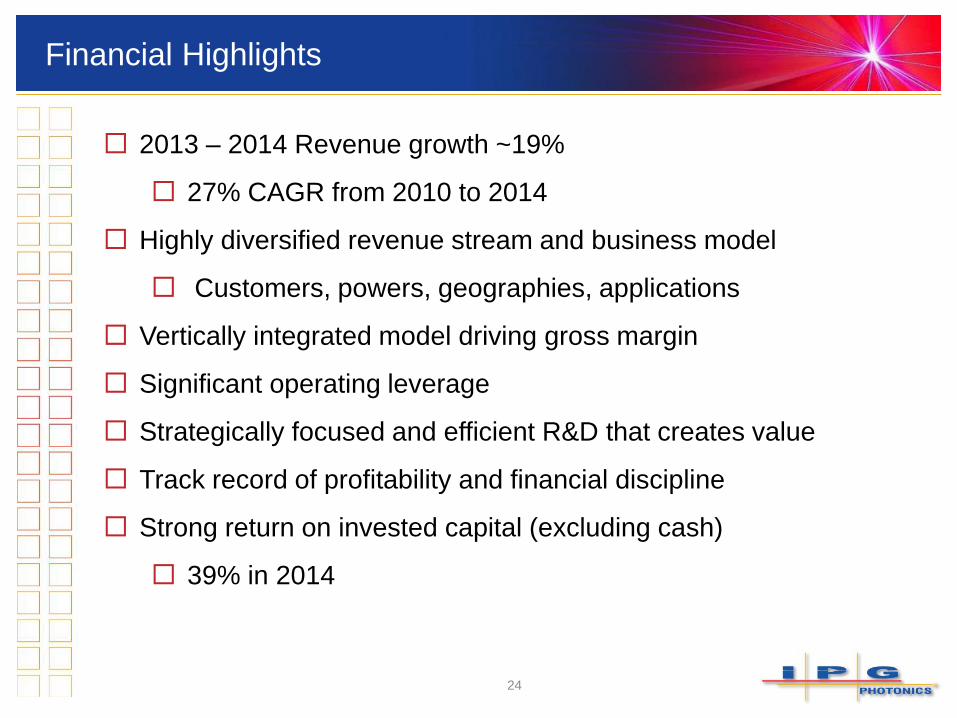
Investment Highlights 2013 – 2014 Revenue growth ~19%
27% CAGR from 2010 to 2014
Highly diversified revenue stream and business model
Customers, powers, geographies, applications
Vertically integrated model driving gross margin
Significant operating leverage
Strategically focused and efficient R&D that creates value
Track record of profitability and financial discipline
Strong return on invested capital (excluding cash)
39% in 2014
Financial Highlights
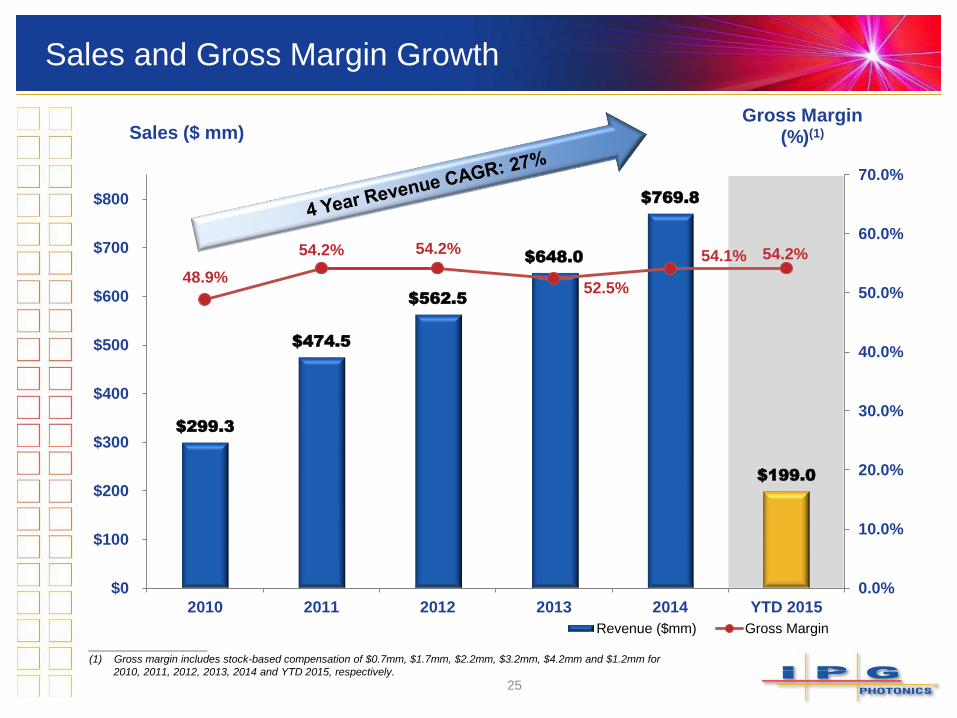
Sales and Gross Margin Growth
25
____________________
(1) Gross margin includes stock-based compensation of $0.7mm, $1.7mm, $2.2mm, $3.2mm, $4.2mm and $1.2mm for
2010, 2011, 2012, 2013, 2014 and YTD 2015, respectively.
$299.3
$474.5
$562.5
$648.0
$769.8
$199.0
48.9%
54.2% 54.2%
52.5%
54.1% 54.2%
0.0%
10.0%
20.0%
30.0%
40.0%
50.0%
60.0%
70.0%
$0
$100
$200
$300
$400
$500
$600
$700
$800
2010 2011 2012 2013 2014 YTD 2015
Gross Margin(%)(1)Sales ($ mm)
Revenue ($mm) Gross Margin
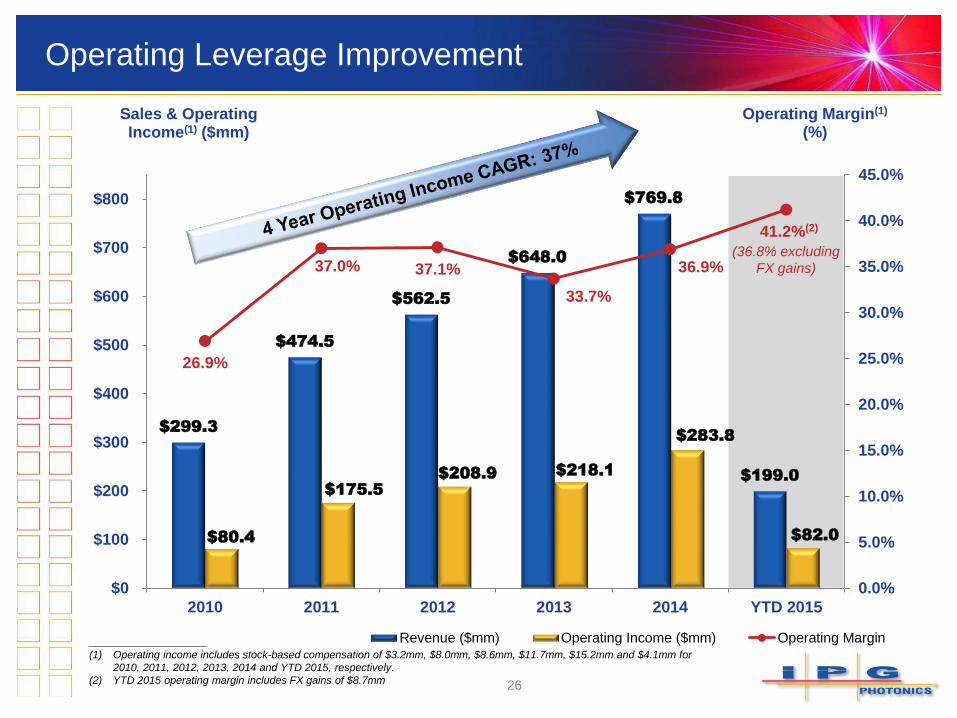
Operating Leverage Improvement
26
$299.3
$474.5
$562.5
$648.0
$769.8
$199.0
$80.4
$175.5
$208.9 $218.1
$283.8
$82.0
26.9%
37.0% 37.1%
33.7%
36.9%
41.2%(2)
0.0%
5.0%
10.0%
15.0%
20.0%
25.0%
30.0%
35.0%
40.0%
45.0%
$0
$100
$200
$300
$400
$500
$600
$700
$800
2010 2011 2012 2013 2014 YTD 2015
Operating Margin(1)
(%)Sales & Operating Income(1) ($mm)
Revenue ($mm) Operating Income ($mm) Operating Margin____________________
(1) Operating income includes stock-based compensation of $3.2mm, $8.0mm, $8.6mm, $11.7mm, $15.2mm and $4.1mm for
2010, 2011, 2012, 2013, 2014 and YTD 2015, respectively.
(2) YTD 2015 operating margin includes FX gains of $8.7mm
(36.8% excluding
FX gains)
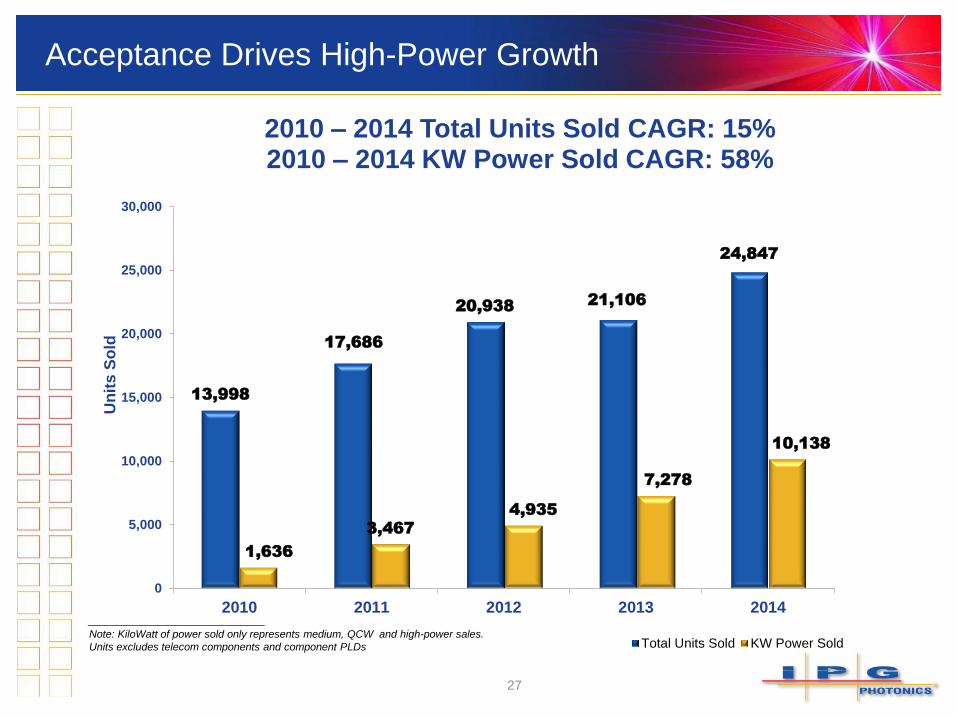
13,998
17,686
20,938 21,106
24,847
1,636
3,467
4,935
7,278
10,138
0
5,000
10,000
15,000
20,000
25,000
30,000
2010 2011 2012 2013 2014
Un
its
So
ld
2010 – 2014 Total Units Sold CAGR: 15%2010 – 2014 KW Power Sold CAGR: 58%
Total Units Sold KW Power Sold
Acceptance Drives High-Power Growth
____________________Note: KiloWatt of power sold only represents medium, QCW and high-power sales.
Units excludes telecom components and component PLDs
27
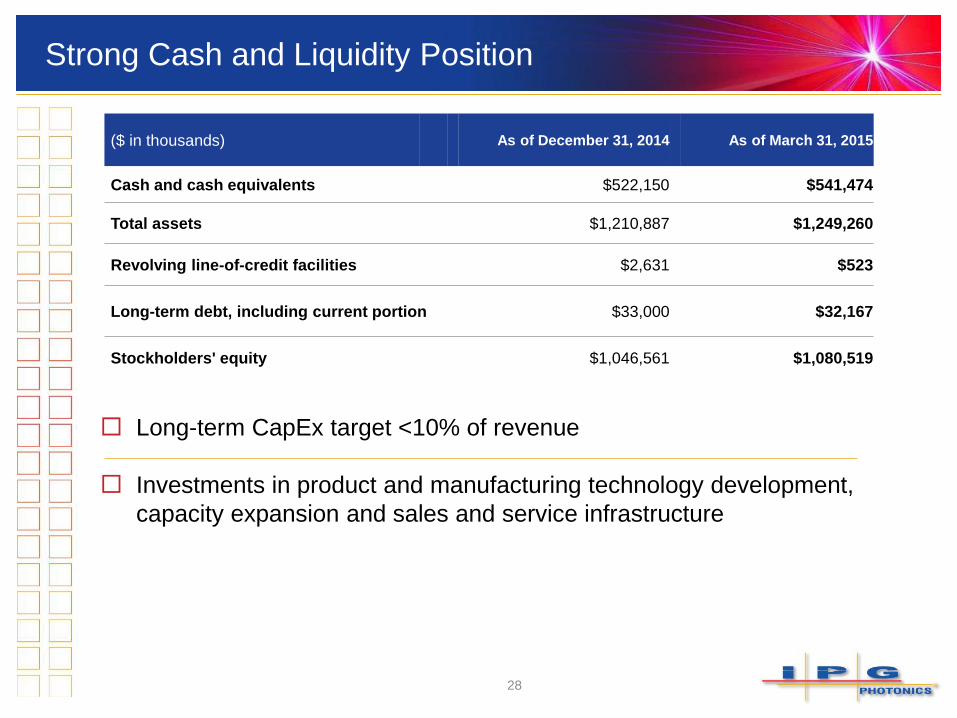
Strong Cash and Liquidity Position
Long-term CapEx target <10% of revenue
Investments in product and manufacturing technology development,
capacity expansion and sales and service infrastructure
28
($ in thousands) As of December 31, 2014 As of March 31, 2015
Cash and cash equivalents $522,150 $541,474
Total assets $1,210,887 $1,249,260
Revolving line-of-credit facilities $2,631 $523
Long-term debt, including current portion $33,000 $32,167
Stockholders' equity $1,046,561 $1,080,519
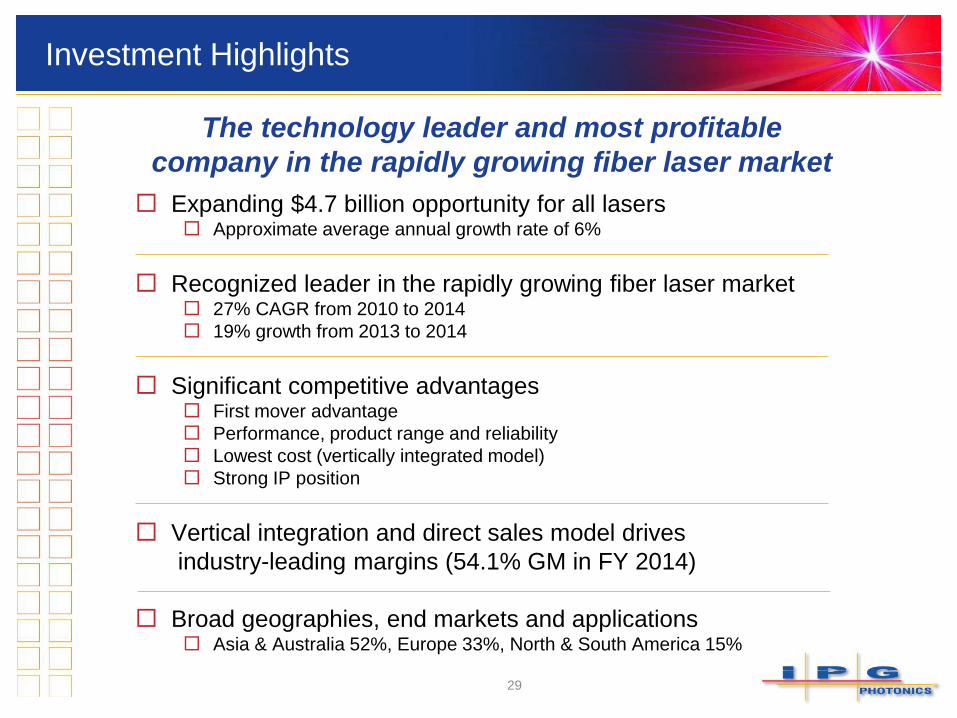
Investment Highlights
Expanding $4.7 billion opportunity for all lasers Approximate average annual growth rate of 6%
Recognized leader in the rapidly growing fiber laser market 27% CAGR from 2010 to 2014
19% growth from 2013 to 2014
Significant competitive advantages First mover advantage
Performance, product range and reliability
Lowest cost (vertically integrated model)
Strong IP position
Vertical integration and direct sales model drives
industry-leading margins (54.1% GM in FY 2014)
Broad geographies, end markets and applications Asia & Australia 52%, Europe 33%, North & South America 15%
29
The technology leader and most profitable
company in the rapidly growing fiber laser market


