Download - Ir presentation february

Aon plc
(NYSE: AON)
February 2015

1
Greg Case
Chief Executive Officer
Christa Davies
Chief Financial Officer
Scott Malchow
Senior Vice President, Investor Relations/FP&A
2
Safe Harbor StatementThis communication contains certain statements related to future results, or states our intentions, beliefs and expectations or predictions for the future which are forward-looking
statements as that term is defined in the Private Securities Litigation Reform Act of 1995. These forward-looking statements are subject to certain risks and uncertainties that could
cause actual results to differ materially from either historical or anticipated results depending on a variety of factors. These forward-looking statements include information about
possible or assumed future results of our operations. All statements, other than statements of historical facts that address activities, events or developments that we expect or
anticipate may occur in the future, including such things as our outlook, future capital expenditures, growth in commissions and fees, changes to the composition or level of our
revenues, cash flow and liquidity, expected tax rates, business strategies, competitive strengths, goals, the benefits of new initiatives, growth of our business and operations, plans
and references to future successes, are forward-looking statements. Also, when we use the words such as “anticipate”, “believe”, “estimate”, “expect”, “intend”, “plan”, “probably”, or
similar expressions, we are making forward-looking statements.
The following factors, among others, could cause actual results to differ from those set forth in the forward looking statements: general economic and political conditions in different
countries in which Aon does business around the world; changes in the competitive environment; fluctuations in exchange and interest rates that could influence revenue and
expense; changes in global equity and fixed income markets that could affect the return on invested assets; changes in the funding status of Aon's various defined benefit pension
plans and the impact of any increased pension funding resulting from those changes; the level of Aon’s debt limiting financial flexibility; rating agency actions that could affect Aon's
ability to borrow funds; the effect of the change in global headquarters and jurisdiction of incorporation, including differences in the anticipated benefits; changes in estimates or
assumptions on our financial statements; limits on Aon’s subsidiaries to make dividend and other payments to Aon; the impact of law suits and other contingent liabilities and loss
contingencies arising from errors and omissions and other claims against Aon; the impact of, and potential challenges in complying with, legislation and regulation in the jurisdictions in
which Aon operates, particularly given the global scope of Aon’s businesses and the possibility of conflicting regulatory requirements across jurisdictions in which Aon does business;
the impact of any investigations brought by regulatory authorities in the U.S., U.K. and other countries; the impact of any inquiries relating to compliance with the U.S. Foreign Corrupt
Practices Act and non-U.S. anti-corruption laws and with U.S. and non-U.S. trade sanctions regimes; failure to protect intellectual property rights or allegations that we infringe on the
intellectual property rights of others; the effects of English law on our operating flexibility and the enforcement of judgments against Aon; the failure to retain and attract qualified
personnel; international risks associated with Aon’s global operations; the effect or natural or man-made disasters; the potential of a system or network breach or disruption resulting in
operational interruption or improper disclosure of personal data; Aon’s ability to develop and implement new technology; the damage to our reputation among clients, markets or third
parties; the actions taken by third parties that preform aspects of our business operations and client services; the extent to which Aon manages certain risks created in connection
with the various services, including fiduciary and investments and other advisory services and business process outsourcing services, among others, that Aon currently provides, or
will provide in the future, to clients; Aon’s ability to grow, develop and integrate companies that it acquires or new lines of business; changes in commercial property and casualty
markets, commercial premium rates or methods of compensation; changes in the health care system or our relationships with insurance carriers; Aon’s ability to implement initiatives
intended to yield cost savings, and the ability to achieve those cost savings.
Further information concerning Aon and its business, including factors that potentially could materially affect Aon's financial results, is contained in Aon's filings with the SEC. See
Aon’s Annual Report on Form 10-K and its Quarterly Reports on Form 10-Q for a further discussion of these and other risks and uncertainties applicable to Aon’s businesses. Aon
does not undertake, and expressly disclaims, any duty to update any forward-looking statement whether as a result of new information, future events or changes in their respective
expectations, except as required by law.
Explanation of Non-GAAP Measures
This communication includes supplemental information related to organic revenue, free cash flow, adjusted operating margin and adjusted earnings per share, that exclude the effects
of restructuring charges, intangible asset amortization, capital expenditures, transaction and integration costs and certain other noteworthy items that affected results for the
comparable periods. Organic revenue excludes from reported revenues the impact of foreign exchange, acquisitions, divestitures, transfers between business units, reimbursable
expenses and unusual items. The impact of foreign exchange is determined by translating last year's revenue, expense or net income at this year's foreign exchange rates.
Reconciliations are provided in the attached schedules. Supplemental organic revenue information and additional measures that exclude the effects of the restructuring charges and
certain other items do not affect net income or any other GAAP reported amounts. Free cash flow is cash flow from operating activity less capital expenditures. Management believes
that these measures are important to make meaningful period-to-period comparisons and that this supplemental information is helpful to investors. They should be viewed in addition
to, not in lieu of, the Company’s Consolidated Financial Statements. Industry peers provide similar supplemental information regarding their performance, although they may not
make identical adjustments.

3
Agenda
Section 1 Industry-Leading Franchise Focused on Risk and People
• #1 in Risk Solutions and #1 in HR Solutions
• Largest Globally Owned Network of Resources and Capabilities
• Operating in Markets Growing Long-Term in both Size and Complexity
Section 2 Taken Significant Steps to Position the Firm to Deliver Financial Results
Section 3 Significant Opportunity for Further Value Creation
4
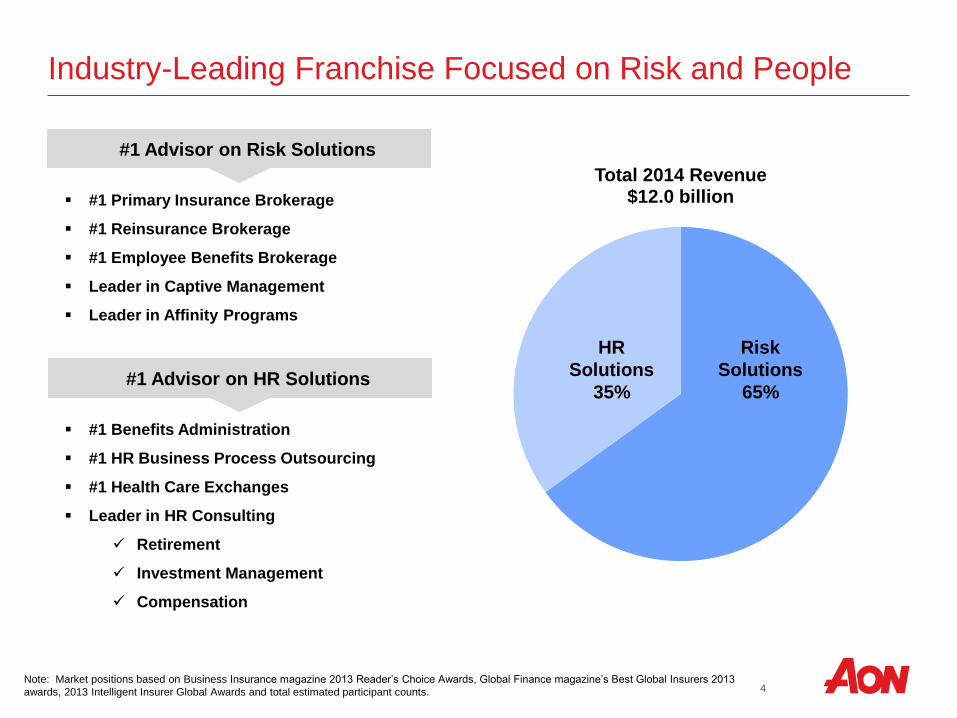
Industry-Leading Franchise Focused on Risk and People
#1 Primary Insurance Brokerage
#1 Reinsurance Brokerage
#1 Employee Benefits Brokerage
Leader in Captive Management
Leader in Affinity Programs
#1 Advisor on Risk Solutions
Note: Market positions based on Business Insurance magazine 2013 Reader’s Choice Awards, Global Finance magazine’s Best Global Insurers 2013
awards, 2013 Intelligent Insurer Global Awards and total estimated participant counts.
#1 Benefits Administration
#1 HR Business Process Outsourcing
#1 Health Care Exchanges
Leader in HR Consulting
Retirement
Investment Management
Compensation
Total 2014 Revenue$12.0 billion
HR
Solutions
35%
Risk
Solutions
65%#1 Advisor on HR Solutions

5
Largest Global Network of Resources and Capabilities
Aon presence in over 120 countries
with more than 500 offices
Place more than $110 billion of premium flow
Unparalleled market insight and data
Strongest technology platform
Deepest analytic expertise
Integrated capital markets solutions
~32,000 colleagues globally
World-class brand recognition
Substantial relationships across large
corporate and middle market
Serve half of the Fortune 500
Administer benefits for more than 23 million
participants around the globe
~31,000 colleagues globally
Total 2014 Revenue by Geography
U.S.48%
Americas (excl. U.S.)10%
U.K.13%
EMEA19%
APAC10%
Risk Solutions HR Solutions
6
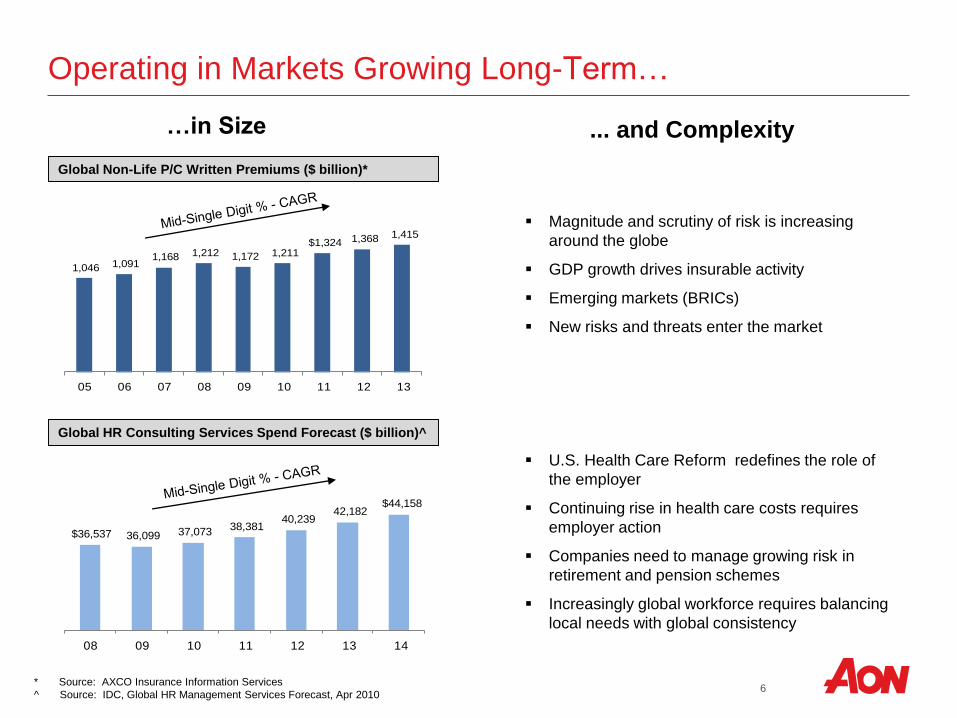
Operating in Markets Growing Long-Term…
Global Non-Life P/C Written Premiums ($ billion)*
... and Complexity…in Size
Magnitude and scrutiny of risk is increasing
around the globe
GDP growth drives insurable activity
Emerging markets (BRICs)
New risks and threats enter the market
1,046 1,091 1,168 1,212 1,172 1,211
$1,324 1,368 1,415
05 06 07 08 09 10 11 12 13
$36,537 36,099 37,073 38,381
40,239 42,182
$44,158
08 09 10 11 12 13 14
U.S. Health Care Reform redefines the role of
the employer
Continuing rise in health care costs requires
employer action
Companies need to manage growing risk in
retirement and pension schemes
Increasingly global workforce requires balancing
local needs with global consistency
Global HR Consulting Services Spend Forecast ($ billion)^
* Source: AXCO Insurance Information Services
^ Source: IDC, Global HR Management Services Forecast, Apr 2010

7
Agenda
Section 1 Industry-Leading Franchise Focused on Risk and People
Section 2 Taken Significant Steps to Position the Firm to Deliver Financial Results
• Focused the Portfolio
• Significantly Invested in Global Capabilities
• Delivered on Key Financial Metrics
Section 3 Significant Opportunity for Further Value Creation

8
Focused the
Portfolio
Significantly
Invested in Global
Capabilities
Delivered on Key
Financial Metrics
100% 100%
Underwriting
HR Solutions
Risk Solutions
32%
13%
55%
17%
83%
Exited low-margin, capital intensive insurance underwriting
Focused the portfolio towards higher-margin, capital light
professional services (Benfield and Hewitt Associates)
High recurring revenue streams
Strong free cash flow generation
2004 2009
35%
65%
100%
2014
Focused the Portfolio on Capital Light Professional Services

9
Delivery Technology Innovation
Systems Analytics Talent
Insights Content Brand
Focused the
Portfolio
Significantly
Invested in
Global
Capabilities
Delivered on Key
Financial Metrics
Significant Investments in Global Client Serving Capabilities
Revenue
Engine
Health Care
Exchanges
10
Focused the
Portfolio
Significantly
Invested in Global
Capabilities
Delivered on
Key Financial
Metrics
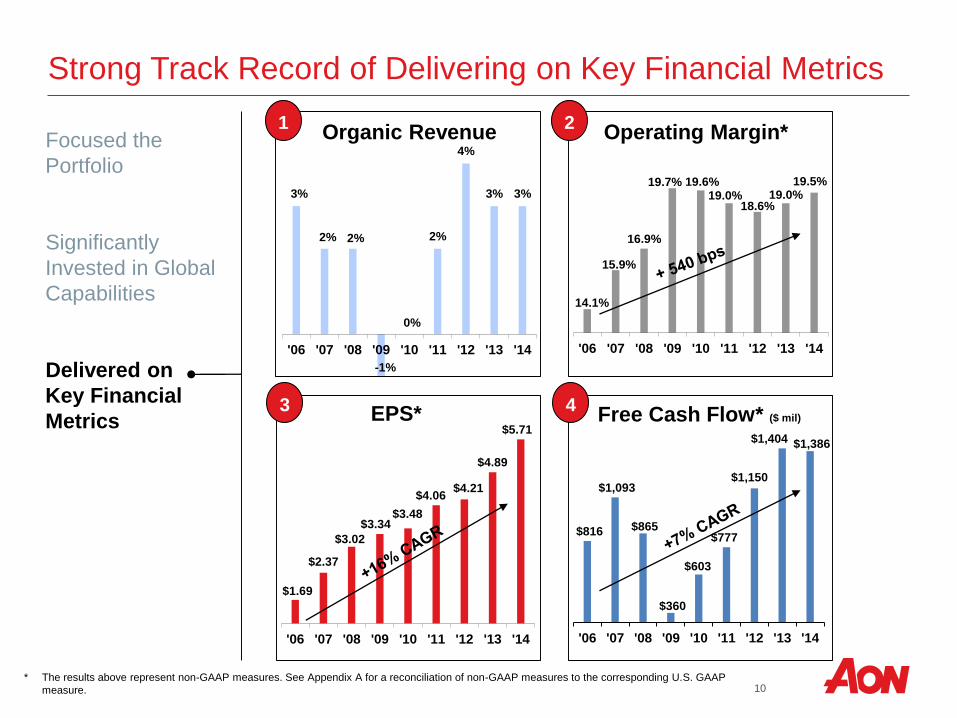
3%
2% 2%
-1%
0%
2%
4%
3% 3%
'06 '07 '08 '09 '10 '11 '12 '13 '14
1Organic Revenue
14.1%
15.9%
16.9%
19.7% 19.6%19.0%
18.6%19.0%
19.5%
'06 '07 '08 '09 '10 '11 '12 '13 '14
Operating Margin*2
EPS*
$1.69
$2.37
$3.02
$3.34 $3.48
$4.06 $4.21
$4.89
$5.71
'06 '07 '08 '09 '10 '11 '12 '13 '14
3
Strong Track Record of Delivering on Key Financial Metrics
$816
$1,093
$865
$360
$603
$777
$1,150
$1,404
'06 '07 '08 '09 '10 '11 '12 '13 '14
Free Cash Flow* ($ mil)4
* The results above represent non-GAAP measures. See Appendix A for a reconciliation of non-GAAP measures to the corresponding U.S. GAAP
measure.
$1,386
11
Agenda
Section 1 Industry-Leading Franchise Focused on Risk and People
Section 2 Taken Significant Steps to Position the Firm to Deliver Financial Results
Section 3 Significant Opportunity for Further Value Creation
• United Aon to Drive Sustainable Long-Term Growth
• Continue to Deliver on Long-Term Operating Margin Targets
• Effectively Allocate Capital through Strong Free Cash Flow Generation
• Continue to Drive Long-Term Value Creation for Shareholders

12
United Aon to Drive Sustainable Long-Term Growth
Aon grew up through
+425 acquisitions over
the last 25 years
Our initiatives have
united Aon as one
global firm now
capable of delivering
the best of Aon to any
client seamlessly
around the globe
Resulting In:
Greater productivity
Increased retention
Increased win rates
Increased yield
Better solutions
Salesforce.comOne revenue platform
2006
Revenue EnginePipeline management, customer feedback, productivity
Market AnalyticsGlobal premium flow insights
Aon Client PromiseUnified approach to serving clients
2008 2009 20102007 2011
Risk AnalyticsIndustry-leading models and actuarial capability
2012 2013+
Aon UnitedRisk Solutions + HR Solutions
13
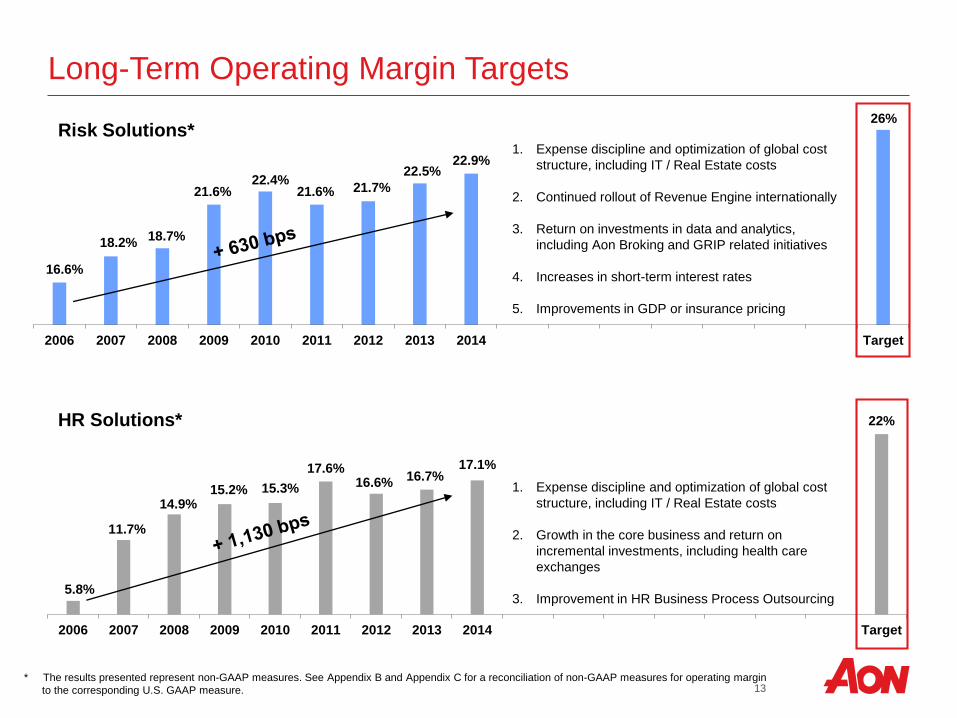
16.6%
18.2%18.7%
21.6%22.4%
21.6% 21.7%
22.5%22.9%
2006 2007 2008 2009 2010 2011 2012 2013 2014 Target
1. Expense discipline and optimization of global cost
structure, including IT / Real Estate costs
2. Continued rollout of Revenue Engine internationally
3. Return on investments in data and analytics,
including Aon Broking and GRIP related initiatives
4. Increases in short-term interest rates
5. Improvements in GDP or insurance pricing
5.8%
11.7%
14.9%15.2% 15.3%
17.6%16.7%
17.1%
22%
2006 2007 2008 2009 2010 2011 2012 2013 2014 Target
1. Expense discipline and optimization of global cost
structure, including IT / Real Estate costs
2. Growth in the core business and return on
incremental investments, including health care
exchanges
3. Improvement in HR Business Process Outsourcing
Long-Term Operating Margin Targets
* The results presented represent non-GAAP measures. See Appendix B and Appendix C for a reconciliation of non-GAAP measures for operating margin
to the corresponding U.S. GAAP measure.
Risk Solutions*
HR Solutions*
26%
16.6%
14
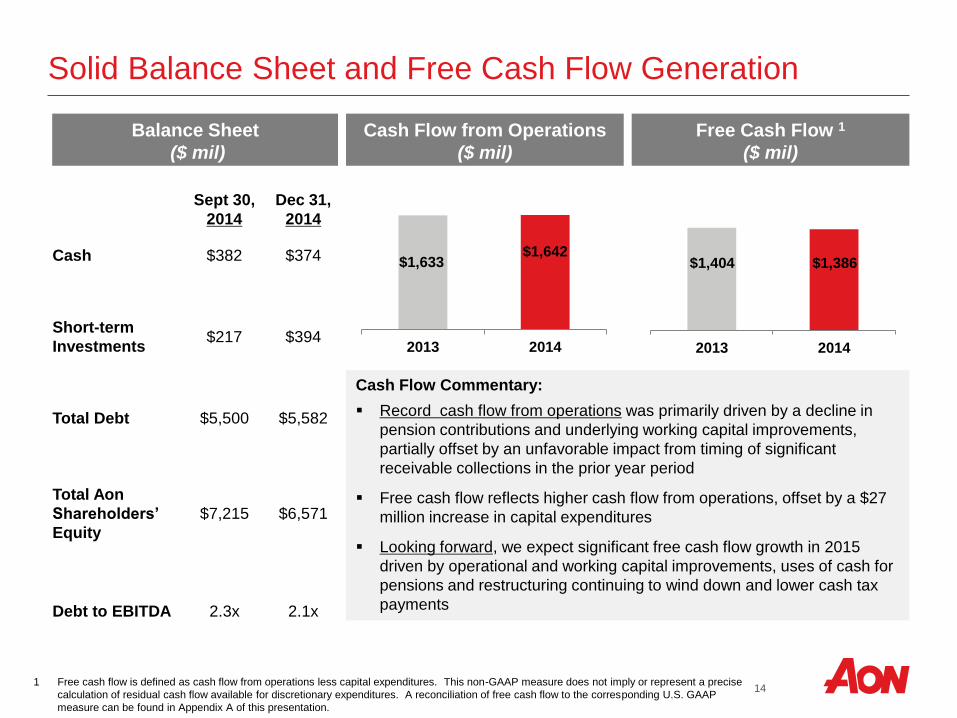
2013 2014
$1,633$1,642
Solid Balance Sheet and Free Cash Flow Generation
Sept 30,
2014
Dec 31,
2014
Cash $382 $374
Short-term
Investments$217 $394
Total Debt $5,500 $5,582
Total Aon
Shareholders’
Equity
$7,215 $6,571
Debt to EBITDA 2.3x 2.1x
Balance Sheet
($ mil)
1 Free cash flow is defined as cash flow from operations less capital expenditures. This non-GAAP measure does not imply or represent a precise
calculation of residual cash flow available for discretionary expenditures. A reconciliation of free cash flow to the corresponding U.S. GAAP
measure can be found in Appendix A of this presentation.
Cash Flow from Operations
($ mil)
Free Cash Flow 1
($ mil)
Cash Flow Commentary:
Record cash flow from operations was primarily driven by a decline in
pension contributions and underlying working capital improvements,
partially offset by an unfavorable impact from timing of significant
receivable collections in the prior year period
Free cash flow reflects higher cash flow from operations, offset by a $27
million increase in capital expenditures
Looking forward, we expect significant free cash flow growth in 2015
driven by operational and working capital improvements, uses of cash for
pensions and restructuring continuing to wind down and lower cash tax
payments
2013 2014
$1,404 $1,386

15
Significantly Increasing Free Cash Flow*
* Free cash flow is a non-GAAP measure that is defined as cash flow from operations less capital expenditures.
1 The Company has $5.6 billion of remaining authorization under its share repurchase program as of December 31, 2014.
2 Estimate based on current actuarial assumptions as of 12/31/14 measurement date.
3 Net of cash acquired.
$1,125 $1,102
$2,250
$204 $212 $273$162 $54
$479
2012 2013 2014
Uses of Free Cash Flow ($ millions)
Share Repurchase Dividends M&A
Aon expects to double free cash flow from $1.15 billion in 2012
to more than $2.3 billion annually by the end of 2017 driven by
three key areas:
1. Operational improvement as the firm makes progress towards
its long-term operating margin targets
2. Declining required uses of cash for pensions and restructuring
3. A lower effective tax rate
$269 $229 $256 $270 $245 $252 $260
$638
$523
$316$220 $212 $160 $126
$143
$152
$82
$31$21 $12 $11
2012 2013 2014 2015e 2016e 2017e 2018e
Declining Required Uses of Cash ($ millions)
Capital Expenditures Pension Contributions Restructuring - Cash
Anticipated increase of
$653 million in Free Cash
Flow annually
2
1 3

16
8%
20%
16%
5%4%
14%
23%
15%
7% 8%
14%
31%
20%
13%
15%
0%
5%
10%
15%
20%
25%
30%
35%
1-year 2-years 5-years 8-years 10-years
Peers* S&P Index AON
Consistent outperformance with
double-digit total returns over the
long-term
Annualized Total Returns^ (CAGR %)
* The peer average total return includes MMC, WSH, BRO and AJG. The detailed CAGR for each peer can be found in Appendix D.
^ Total returns were calculated as of December 31, 2014.
Total Return has Consistently Outperformed Peers

17
Summary – Continued Long-Term Value Creation
Positioned for sustainable long-term growth in both Risk Solutions and HR Solutions
Significant leverage to an improving global economy, interest rates and insurance pricing
Investing in colleagues and capabilities around the globe to better serve clients
Opportunity for long-term operating margin improvement with increased operating leverage in the business
Strong balance sheet and free cash flow generation with declining uses of required cash outlays
Increased financial flexibility and effective capital allocation is expected to drive significant shareholder value

18
Appendix
19
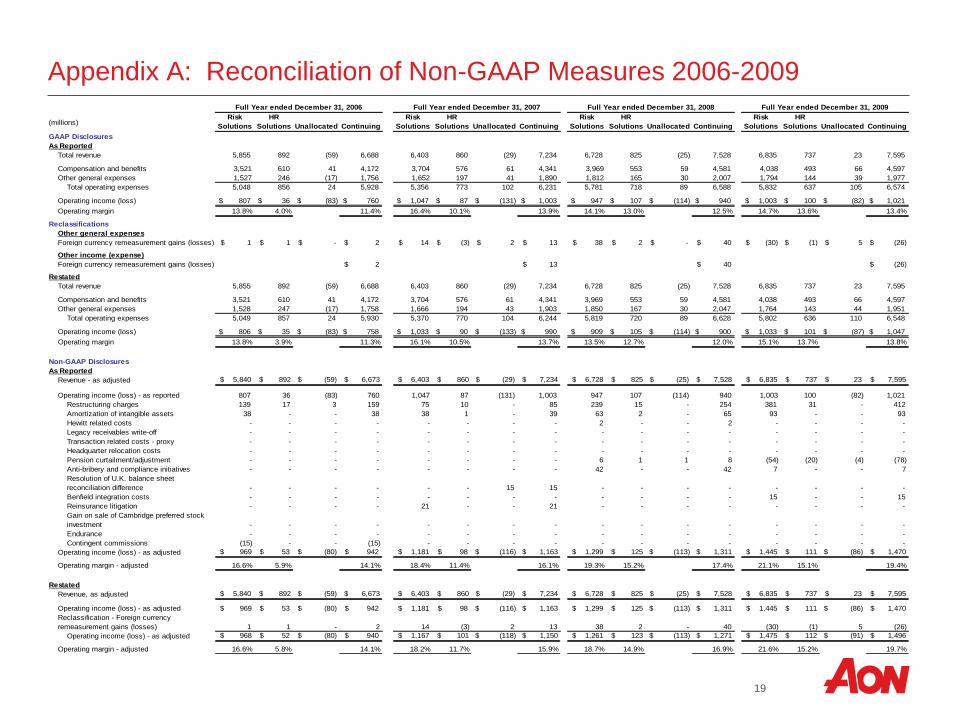
Appendix A: Reconciliation of Non-GAAP Measures 2006-2009Full Year ended December 31, 2006 Full Year ended December 31, 2007 Full Year ended December 31, 2008 Full Year ended December 31, 2009
Full Year
ended
(millions)Risk
Solutions
HR
Solutions Unallocated Continuing
Risk
Solutions
HR
Solutions Unallocated Continuing
Risk
Solutions
HR
Solutions Unallocated Continuing
Risk
Solutions
HR
Solutions Unallocated Continuing
GAAP Disclosures
As Reported
Total revenue 5,855 892 (59) 6,688 6,403 860 (29) 7,234 6,728 825 (25) 7,528 6,835 737 23 7,595
Compensation and benefits 3,521 610 41 4,172 3,704 576 61 4,341 3,969 553 59 4,581 4,038 493 66 4,597
Other general expenses 1,527 246 (17) 1,756 1,652 197 41 1,890 1,812 165 30 2,007 1,794 144 39 1,977
Total operating expenses 5,048 856 24 5,928 5,356 773 102 6,231 5,781 718 89 6,588 5,832 637 105 6,574
Operating income (loss) 807$ 36$ (83)$ 760$ 1,047$ 87$ (131)$ 1,003$ 947$ 107$ (114)$ 940$ 1,003$ 100$ (82)$ 1,021$
Operating margin 13.8% 4.0% 11.4% 16.4% 10.1% 13.9% 14.1% 13.0% 12.5% 14.7% 13.6% 13.4%
Reclassifications
Other general expenses
Foreign currency remeasurement gains (losses) $ 1 $ 1 $ - $ 2 $ 14 $ (3) $ 2 $ 13 $ 38 $ 2 $ - $ 40 $ (30) $ (1) $ 5 $ (26)
Other income (expense)
Foreign currency remeasurement gains (losses) $ 2 $ 13 $ 40 $ (26)
Restated
Total revenue 5,855 892 (59) 6,688 6,403 860 (29) 7,234 6,728 825 (25) 7,528 6,835 737 23 7,595
Compensation and benefits 3,521 610 41 4,172 3,704 576 61 4,341 3,969 553 59 4,581 4,038 493 66 4,597
Other general expenses 1,528 247 (17) 1,758 1,666 194 43 1,903 1,850 167 30 2,047 1,764 143 44 1,951
Total operating expenses 5,049 857 24 5,930 5,370 770 104 6,244 5,819 720 89 6,628 5,802 636 110 6,548
Operating income (loss) 806$ 35$ (83)$ 758$ 1,033$ 90$ (133)$ 990$ 909$ 105$ (114)$ 900$ 1,033$ 101$ (87)$ 1,047$
Operating margin 13.8% 3.9% 11.3% 16.1% 10.5% 13.7% 13.5% 12.7% 12.0% 15.1% 13.7% 13.8%
Non-GAAP Disclosures
As Reported
Revenue - as adjusted $ 5,840 $ 892 $ (59) $ 6,673 $ 6,403 $ 860 $ (29) $ 7,234 $ 6,728 $ 825 $ (25) $ 7,528 $ 6,835 $ 737 $ 23 $ 7,595
Operating income (loss) - as reported 807 36 (83) 760 1,047 87 (131) 1,003 947 107 (114) 940 1,003 100 (82) 1,021
Restructuring charges 139 17 3 159 75 10 - 85 239 15 - 254 381 31 - 412
Amortization of intangible assets 38 - - 38 38 1 - 39 63 2 - 65 93 - - 93
Hewitt related costs - - - - - - - - 2 - - 2 - - - -
Legacy receivables write-off - - - - - - - - - - - - - - - -
Transaction related costs - proxy - - - - - - - - - - - - - - - -
Headquarter relocation costs - - - - - - - - - - - - - - - -
Pension curtailment/adjustment - - - - - - - - 6 1 1 8 (54) (20) (4) (78)
Anti-bribery and compliance initiatives - - - - - - - - 42 - - 42 7 - - 7
Resolution of U.K. balance sheet
reconciliation difference - - - - - - 15 15 - - - - - - - -
Benfield integration costs - - - - - - - - - - - - 15 - - 15
Reinsurance litigation - - - - 21 - - 21 - - - - - - - -
Gain on sale of Cambridge preferred stock
investment - - - - - - - - - - - - - - - -
Endurance - - - - - - - - - - - - - - - -
Contingent commissions (15) - - (15) - - - - - - - - - - - -
Operating income (loss) - as adjusted $ 969 $ 53 $ (80) $ 942 $ 1,181 $ 98 $ (116) $ 1,163 $ 1,299 $ 125 $ (113) $ 1,311 $ 1,445 $ 111 $ (86) $ 1,470
Operating margin - adjusted 16.6% 5.9% 14.1% 18.4% 11.4% 16.1% 19.3% 15.2% 17.4% 21.1% 15.1% 19.4%
Restated
Revenue, as adjusted $ 5,840 $ 892 $ (59) $ 6,673 $ 6,403 $ 860 $ (29) $ 7,234 $ 6,728 $ 825 $ (25) $ 7,528 $ 6,835 $ 737 $ 23 $ 7,595
Operating income (loss) - as adjusted $ 969 $ 53 $ (80) $ 942 $ 1,181 $ 98 $ (116) $ 1,163 $ 1,299 $ 125 $ (113) $ 1,311 $ 1,445 $ 111 $ (86) $ 1,470
1 1 - 2 14 (3) 2 13 38 2 - 40 (30) (1) 5 (26)
Operating income (loss) - as adjusted $ 968 $ 52 $ (80) $ 940 $ 1,167 $ 101 $ (118) $ 1,150 $ 1,261 $ 123 $ (113) $ 1,271 $ 1,475 $ 112 $ (91) $ 1,496
Operating margin - adjusted 16.6% 5.8% 14.1% 18.2% 11.7% 15.9% 18.7% 14.9% 16.9% 21.6% 15.2% 19.7%
Reclassification - Foreign currency
remeasurement gains (losses)

20
Appendix A: Reconciliation of Non-GAAP Measures 2010-2013Full Year ended December 31, 2010 Full Year ended December 31, 2011 Full Year ended December 31, 2012 Full Year ended December 31, 2013
(millions)Risk
Solutions
HR
Solutions Unallocated Continuing
Risk
Solutions
HR
Solutions Unallocated Continuing
Risk
Solutions
HR
Solutions Unallocated Continuing
Risk
Solutions
HR
Solutions Unallocated Continuing
GAAP Disclosures
As Reported
Total revenue 6,989 1,545 (22) 8,512 7,537 3,781 (31) 11,287 7,632 3,925 (43) 11,514 7,789 4,057 (31) 11,815
Compensation and benefits 3,939 1,041 117 5,097 4,179 2,286 102 6,567 4,260 2,360 4,385 2,455
Other general expenses 1,743 383 63 2,189 1,944 1,147 23 3,114 1,879 1,276 1,864 1,284
Total operating expenses 5,682 1,424 180 7,286 6,123 3,433 125 9,681 6,139 3,636 6,249 3,739
Operating income (loss) 1,307$ 121$ (202)$ 1,226$ 1,414$ 348$ (156)$ 1,606$ 1,493$ 289$ (186)$ 1,596$ 1,540$ 318$ (187)$ 1,671$
Operating margin 18.7% 7.8% 14.4% 18.8% 9.2% 14.2% 19.6% 7.4% 13.9% 19.8% 7.8% 14.1%
Reclassifications
Other general expenses
Foreign currency remeasurement gains (losses) $ (21) $ - $ 3 $ (18) $ 1 $ 12 $ (3) $ 10
Other income (expense)
Foreign currency remeasurement gains (losses) $ (18) $ 10
Restated
Total revenue 6,989 1,545 (22) 8,512 7,537 3,781 (31) 11,287
Compensation and benefits 3,939 1,041 117 5,097 4,179 2,286 102 6,567
Other general expenses 1,722 383 66 2,171 1,945 1,159 20 3,124
Total operating expenses 5,661 1,424 183 7,268 6,124 3,445 122 9,691
Operating income (loss) 1,328$ 121$ (205)$ 1,244$ 1,413$ 336$ (153)$ 1,596$
Operating margin 19.0% 7.8% 14.6% 18.7% 8.9% 14.1%
Non-GAAP Disclosures
As Reported
Revenue - as adjusted $ 6,989 $ 1,545 $ (22) $ 8,512 $ 7,537 $ 3,781 $ (31) $ 11,287 $ 7,632 $ 3,925 $ (43) $ 11,514 $ 7,789 $ 4,057 $ (31) $ 11,815
Operating income (loss) - as reported 1,307 121 (202) 1,226 1,414 348 (156) 1,606 1,493 289 (186) 1,596 1,540 318 (187) 1,671
Restructuring charges 115 57 - 172 65 48 - 113 35 66 - 101 94 80 - 174
Amortization of intangible assets 114 40 - 154 129 233 - 362 126 297 - 423 115 280 - 395
Hewitt related costs - 19 21 40 - 47 - 47 - - - - - - - -
Legacy receivables write-off - - - - 18 - - 18 - - - - - - - -
Transaction related costs - proxy - - - - - - 3 3 - - - - - - - -
Headquarter relocation costs - - - - - - - - - - 24 24 - - 5 5
Pension curtailment/adjustment - - 49 49 - - - - - - - - - - - -
Anti-bribery and compliance initiatives 9 - - 9 - - - - - - - - - - - -
Resolution of U.K. balance sheet
reconciliation difference - - - - - - - - - - - - - - - -
Benfield integration costs - - - - - - - - - - - - - - - -
Reinsurance litigation - - - - - - - - - - - - - - - -
Gain on sale of Cambridge preferred stock
investment - - - - - - - - - - - - - - - -
Endurance - - - - - - - - - - - - - - - -
Contingent commissions - - - - - - - - - - - - - - - -
Operating income (loss) - as adjusted $ 1,545 $ 237 $ (132) $ 1,650 $ 1,626 $ 676 $ (153) $ 2,149 $ 1,654 $ 652 $ (162) $ 2,144 $ 1,749 $ 678 $ (182) $ 2,245
Operating margin - adjusted 22.1% 15.3% 19.4% 21.6% 17.9% 19.0% 21.7% 16.6% 18.6% 22.5% 16.7% 19.0%
Restated
Revenue, as adjusted $ 6,989 $ 1,545 $ (22) $ 8,512 $ 7,537 $ 3,781 $ (31) $ 11,287
Operating income (loss) - as adjusted $ 1,545 $ 237 $ (132) $ 1,650 $ 1,626 $ 676 $ (153) $ 2,149
(21) - 3 (18) 1 12 (3) 10
Operating income (loss) - as adjusted $ 1,566 $ 237 $ (135) $ 1,668 $ 1,625 $ 664 $ (150) $ 2,139
Operating margin - adjusted 22.4% 15.3% 19.6% 21.6% 17.6% 19.0%
Reclassification - Foreign currency
remeasurement gains (losses)
21
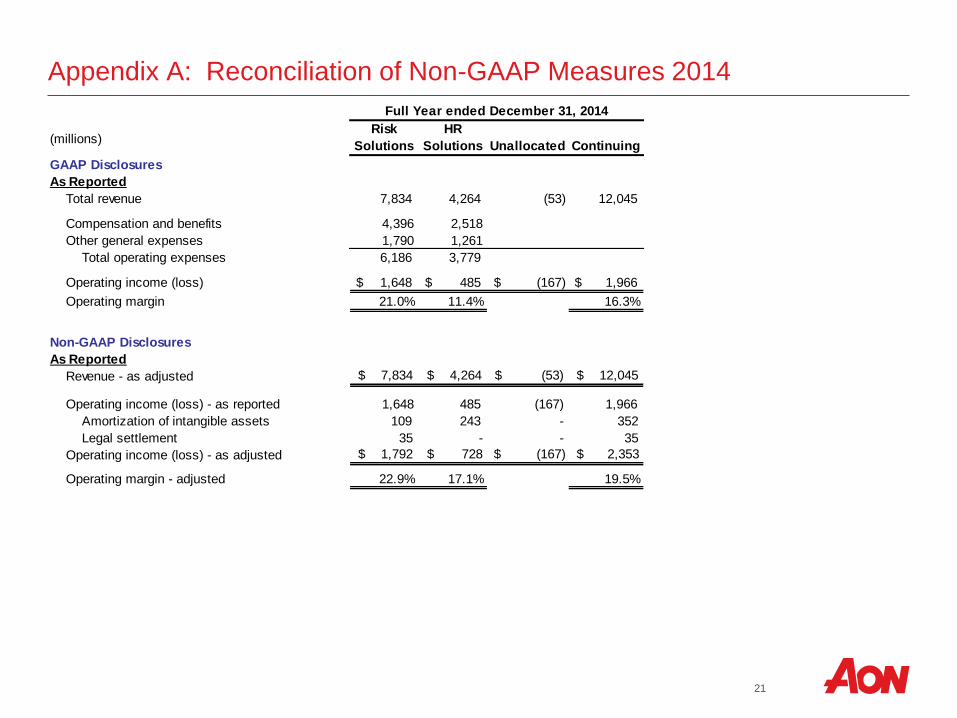
Appendix A: Reconciliation of Non-GAAP Measures 2014
Full Year ended December 31, 2014
(millions)Risk
Solutions
HR
Solutions Unallocated Continuing
GAAP Disclosures
As Reported
Total revenue 7,834 4,264 (53) 12,045
Compensation and benefits 4,396 2,518
Other general expenses 1,790 1,261
Total operating expenses 6,186 3,779
Operating income (loss) 1,648$ 485$ (167)$ 1,966$
Operating margin 21.0% 11.4% 16.3%
Non-GAAP Disclosures
As Reported
Revenue - as adjusted $ 7,834 $ 4,264 $ (53) $ 12,045
Operating income (loss) - as reported 1,648 485 (167) 1,966
Amortization of intangible assets 109 243 - 352
Legal settlement 35 - - 35
Operating income (loss) - as adjusted $ 1,792 $ 728 $ (167) $ 2,353
Operating margin - adjusted 22.9% 17.1% 19.5%
22
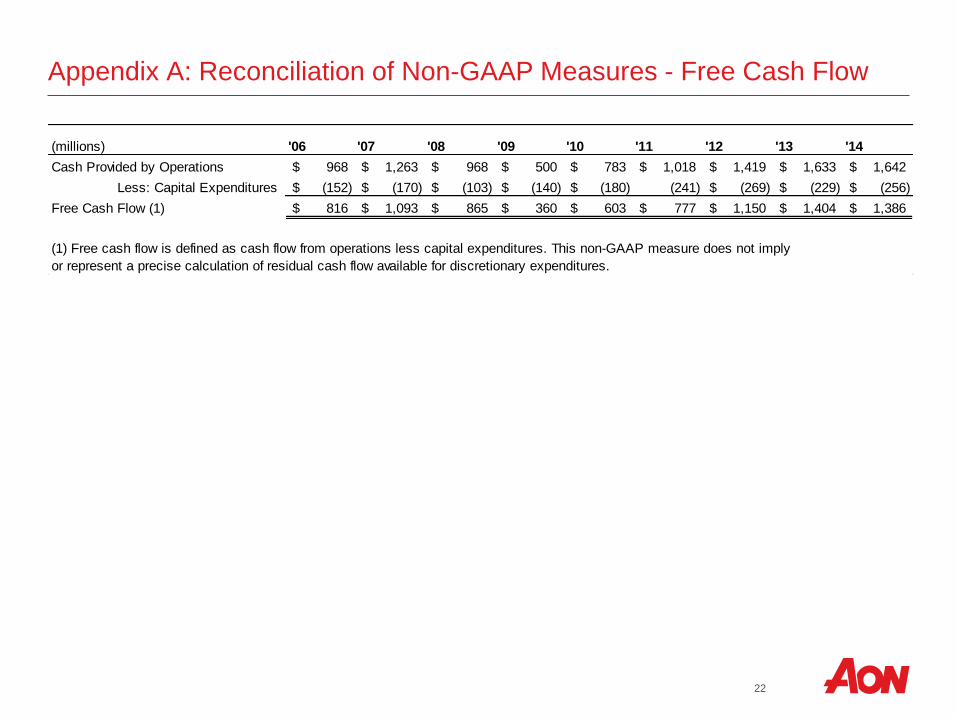
Appendix A: Reconciliation of Non-GAAP Measures - Free Cash Flow
'06 '07 '08 '09 '10 '11 '12 '13 '14
Cash Provided by Operations 968$ 1,263$ 968$ 500$ 783$ 1,018$ 1,419$ 1,633$ 1,642$
Less: Capital Expenditures (152)$ (170)$ (103)$ (140)$ (180)$ (241) (269)$ (229)$ (256)$
Free Cash Flow (1) 816$ 1,093$ 865$ 360$ 603$ 777$ 1,150$ 1,404$ 1,386$
(1) Free cash flow is defined as cash flow from operations less capital expenditures. This non-GAAP measure does not imply
or represent a precise calculation of residual cash flow available for discretionary expenditures.
(millions)
23
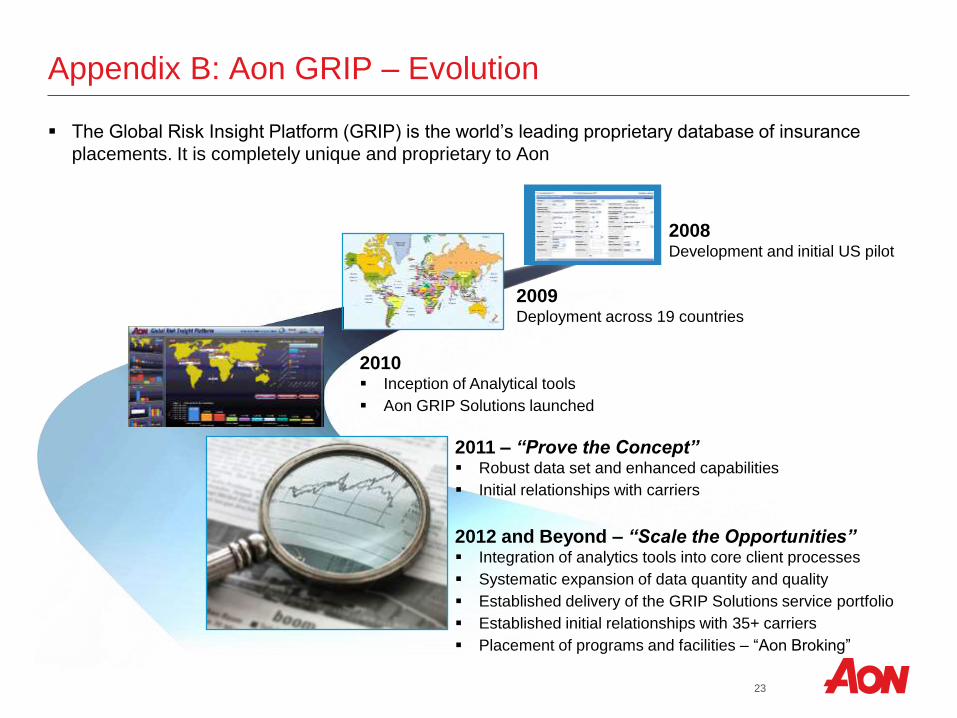
Appendix B: Aon GRIP – Evolution
The Global Risk Insight Platform (GRIP) is the world’s leading proprietary database of insurance
placements. It is completely unique and proprietary to Aon
2011 – “Prove the Concept” Robust data set and enhanced capabilities
Initial relationships with carriers
2012 and Beyond – “Scale the Opportunities” Integration of analytics tools into core client processes
Systematic expansion of data quantity and quality
Established delivery of the GRIP Solutions service portfolio
Established initial relationships with 35+ carriers
Placement of programs and facilities – “Aon Broking”
2008Development and initial US pilot
2009Deployment across 19 countries
2010 Inception of Analytical tools
Aon GRIP Solutions launched

24
Appendix B: Aon GRIP – Today
World’s largest proprietary database of insurance placement data
Insights into:
More than US $119 billion premium
More than 2.4 million opportunities to quote
More than 100,000 global clients across 1,100 industries in
173 countries
51 lines of coverage
Supported by over 60 colleagues in Aon’s Center
of Innovation & Analytics in Dublin
7,367 Aon colleagues currently inputting data
20 Countries in North and South America, Europe, Asia and the
Pacific
Recognized as leading innovator with accolades across financial
services industry
Growing client base of 35+ premier insurance carriers around the
world including Global insurers, Domestic insurers and Lloyd’s
underwriters

25
Appendix C: Private Health Care Exchange Investment
• Cost pressure, health care reform, and population health concerns have made this a critical time in health care. The average cost of health
coverage is $13,000+ per employee and growing at 6.5-8% per year.1 Employers need to reduce trend rate, reduce volatility and ensure
sustainability, while maintaining a benefits offering that attracts and retains talent.
• An exchange is a competitive marketplace consisting of buyers and suppliers that organizes and simplifies the process of evaluating and
purchasing a product or service, and it can work in health insurance
• Employer-sponsored US healthcare plans are poised to transition from a self-insured, defined benefit structure to a fully insured, defined
contribution structure which transfers risk from the employer to the insurer and fixes the employer’s cost — and a competitive market
enables this to happen without shifting cost to employees and retirees
• The exchange simplifies the management of health benefits for employers — the employer simply decides the company subsidy in the form
of a credit, and provides access to a choice of plans and insurers with full decision support, customer service, and consumer advocacy
services through Aon
1
Health Care
Credit
Defined Contribution
Subsidy
2 3
Employees Shop Across
Plan & Carrier OptionsCarrier Risk & Incentives Aligned
21 Rating Bands Risk Adjustment
Bronze
Bronze Plus
Silver
Gold
Platinum
Aetna
United
BCBS
Kaiser
HealthNet
Bronze
Silver
Gold
Platinum
Bronze
Silver
Gold
Standardized
Plans
Competing
Carriers+
Aetna
United
Delta
MetLife
MetLife
United
VSP
4
Aon Active Health Exchange
Insured health care offerings
Communication
Decision support
Enrollment
Advocacy
HRA administration
Employer Provides Subsidy
Private Exchange Platform
Insured Health Care Offerings
Employer converts current group-based health care subsidy into an HRA credit, which may be set at or below the actuarial equivalent of the current subsidy
Retiree HRA
Medicare Advantage
Medigap
Individual Part D
Other (dental, vision)
Commission Revenue
Retiree Enrollments
Aon Retiree Health Exchange
1 Aon Hewitt Health Value Index, National Business Group on Health, August 13, 2014, Adjusted for fees and expenses, Aon Hewitt 2014 Health
Care Survey, August 2014
26
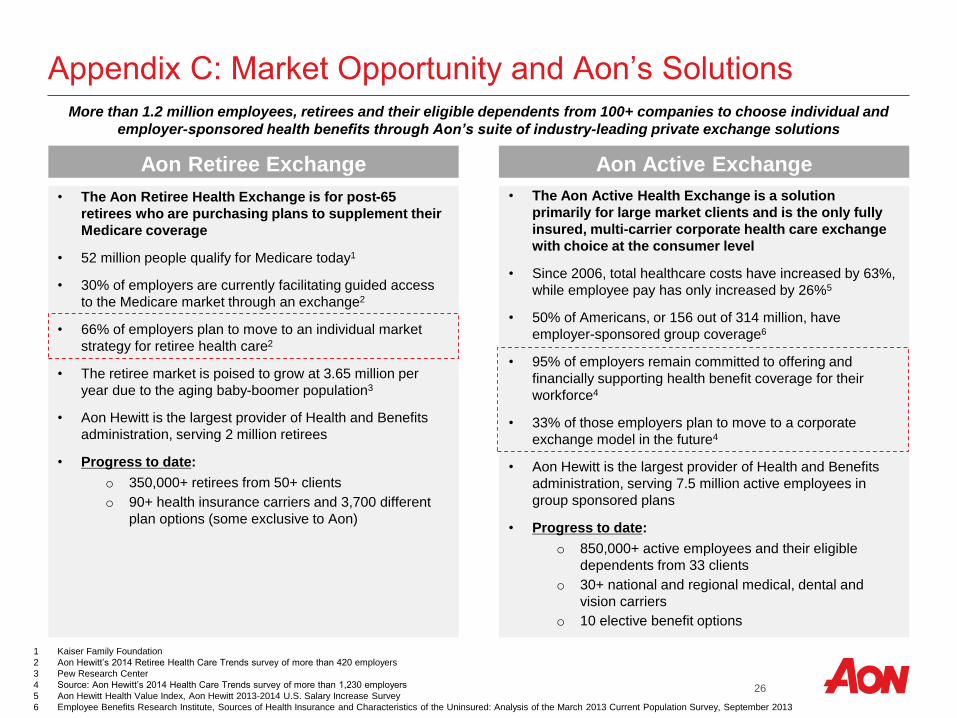
Appendix C: Market Opportunity and Aon’s Solutions
• The Aon Retiree Health Exchange is for post-65
retirees who are purchasing plans to supplement their
Medicare coverage
• 52 million people qualify for Medicare today1
• 30% of employers are currently facilitating guided access
to the Medicare market through an exchange2
• 66% of employers plan to move to an individual market
strategy for retiree health care2
• The retiree market is poised to grow at 3.65 million per
year due to the aging baby-boomer population3
• Aon Hewitt is the largest provider of Health and Benefits
administration, serving 2 million retirees
• Progress to date:
o 350,000+ retirees from 50+ clients
o 90+ health insurance carriers and 3,700 different
plan options (some exclusive to Aon)
Aon Retiree Exchange Aon Active Exchange
• The Aon Active Health Exchange is a solution
primarily for large market clients and is the only fully
insured, multi-carrier corporate health care exchange
with choice at the consumer level
• Since 2006, total healthcare costs have increased by 63%,
while employee pay has only increased by 26%5
• 50% of Americans, or 156 out of 314 million, have
employer-sponsored group coverage6
• 95% of employers remain committed to offering and
financially supporting health benefit coverage for their
workforce4
• 33% of those employers plan to move to a corporate
exchange model in the future4
• Aon Hewitt is the largest provider of Health and Benefits
administration, serving 7.5 million active employees in
group sponsored plans
• Progress to date:
o 850,000+ active employees and their eligible
dependents from 33 clients
o 30+ national and regional medical, dental and
vision carriers
o 10 elective benefit options
More than 1.2 million employees, retirees and their eligible dependents from 100+ companies to choose individual and
employer-sponsored health benefits through Aon’s suite of industry-leading private exchange solutions
1 Kaiser Family Foundation
2 Aon Hewitt’s 2014 Retiree Health Care Trends survey of more than 420 employers
3 Pew Research Center
4 Source: Aon Hewitt’s 2014 Health Care Trends survey of more than 1,230 employers
5 Aon Hewitt Health Value Index, Aon Hewitt 2013-2014 U.S. Salary Increase Survey
6 Employee Benefits Research Institute, Sources of Health Insurance and Characteristics of the Uninsured: Analysis of the March 2013 Current Population Survey, September 2013
27
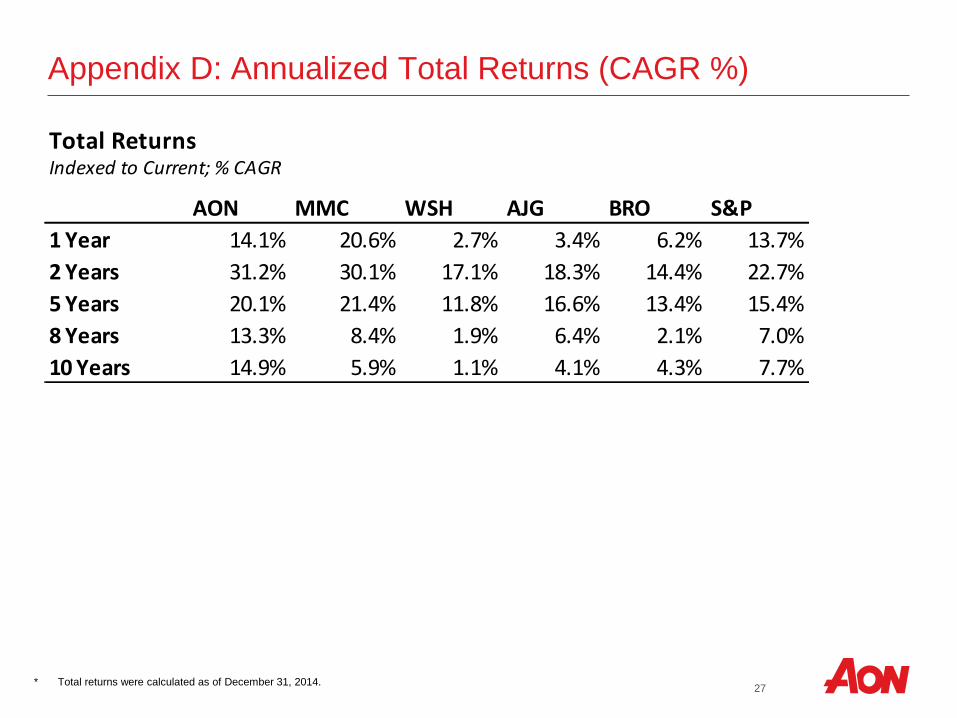
Appendix D: Annualized Total Returns (CAGR %)
* Total returns were calculated as of December 31, 2014.
Total ReturnsIndexed to Current; % CAGR
AON MMC WSH AJG BRO S&P
1 Year 14.1% 20.6% 2.7% 3.4% 6.2% 13.7%
2 Years 31.2% 30.1% 17.1% 18.3% 14.4% 22.7%
5 Years 20.1% 21.4% 11.8% 16.6% 13.4% 15.4%
8 Years 13.3% 8.4% 1.9% 6.4% 2.1% 7.0%
10 Years 14.9% 5.9% 1.1% 4.1% 4.3% 7.7%

Investor RelationsScott Malchow
Office: +44 (0) 20 7086 0100
Erika Shouldice
Office: 312-381-5957
Steven Krall
Office: 312-381-3353


