
The mass distribution in spiral galaxies
Irina Yegorova
SISSA, Trieste, Italy
In collaboration with Paolo Salucci,Alessandro Pizzella, Niv Drory

Outline:
•The disk mass of spiral galaxies
•Radial Tully-Fisher relation (RTF)
• Satellites of spiral galaxies


GVM(R)
2rot R
=


Two different methods to determine the masses of spiral galaxies1. Using kinematical data
2/122 ][ hd VVV +=
dopt RR 2.3=
dd RVM 22=

UGC 8460

2. Using photometrical data
The method is based on the comparison of multicolor photometry from SDSS to a grid of stellar population synthesis models (Niv Drory, Max-Planck, Garching)
The data:
ugriz bands from the Sloan Digital Sky Survey (SDSS) (Data Release 4)
JHK bands from the 2 Micron All Sky Survey

log Mpho = (-0.4 ± 1.27) + (1.02 ± 0.12) log Mkin

Mass-to-light ratio vs color and luminosity
)log(log21log kinphoD MMM +≅

The Tully-Fisher (TF) relation is an empirically established correlation between the luminosity L of a spiral galaxy and its rotational velocity V (Tully-Fisher, 1977)

New method of determiningDistances to galaxies
R.B.Tully and J.R.Fisher,A&A, 54. 661-673, 1977

TF-relation has two important applications:
1. It is used to obtain cosmological distances
M = m - 5logD - 25
2. It can be used for studying the dynamical properties and the evolution of galaxies

Physical basis of the TF-relation
From the equation of centrifugal equilibrium we get:
MV 20
cRGγ= V0 – representative velocity, M - total mass,
Rc – characteristic radius of luminous matter γ - structural parameter depending on the shape
of the mass distribution
M M M mass total lumdark +=
lum
dark
MM α
prametermatter dark
= 2c
lum0 R
Mµ
parameterdensity surface
=

The first equation can be written in this form:
10
22240 1M −+= ]µGα)([γVlum
This equation can be written in the form of theTully-Fisher relation:
10
22240 )]/M()1([ −+= LGVL lumµαγ
)/log(5.2 sunsun LLMM −=

Samples:1st sample: 967 spiral galaxies Mathewson
(1992)
2nd sample: 304 spiral galaxies Courteau(1997)86 galaxies selected for analysis
3 sample: 329 spiral galaxies Vogt (2004)81 galaxies selected for analysis

0.0 0.5 1.0 1.5 2.0 2.5 3.0
0
50
100
150
200
250
V
R/Rd
UGC2405
Vmax

1. Mathewson sample: R R/Ropt; bin=0.2
2. Courteau sample: R R/Rd; bin=0.2
3. Vogt sample: R R/Rd; bin=0.2
Ropt=3.2Rd, where R_d is the disk exponential length-scale, for Freeman (exponential) disk this corresponds to the 25 B-mag/arcsec^2 photometric radius.

1st sample: TF-relation for 967 galaxies
1.0 1.2 1.4 1.6 1.8 2.0 2.2 2.4 2.6
-16
-17
-18
-19
-20
-21
-22
-23
-24
Mi
log V
0.2R/Ropt
0.4R/Ropt
0.6R/Ropt
0.8R/Ropt
1.0R/Ropt
1.2R/Ropt

1st sample: TF-relation for 967 galaxies

Slope of the TF-relationMB = ai + bi log V(Ri)
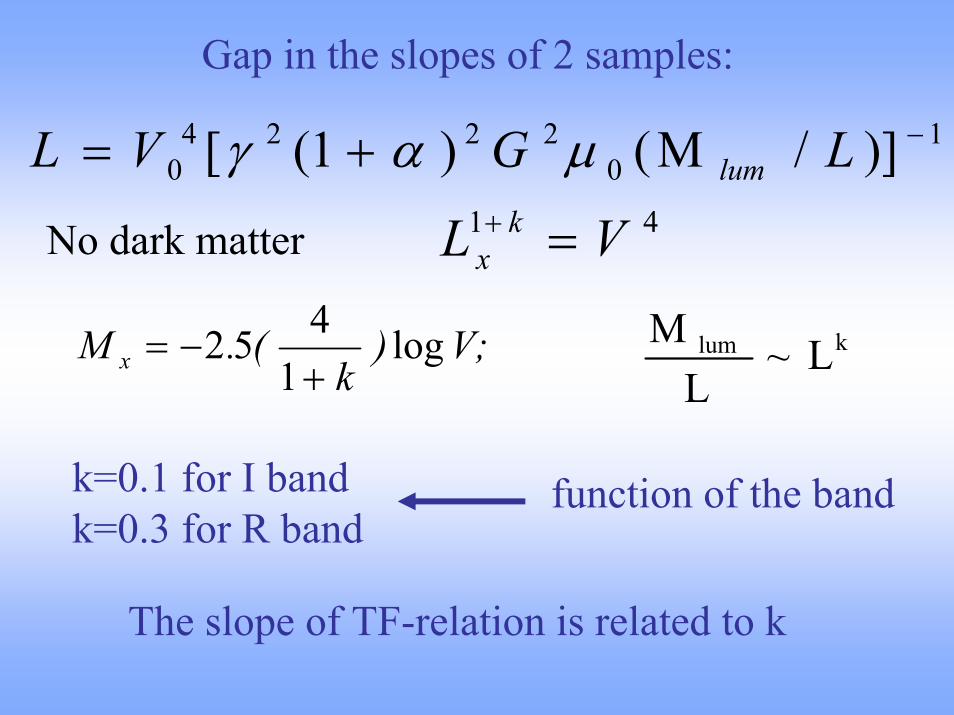
Gap in the slopes of 2 samples:
10
22240 )]/M()1([ −+= LGVL lumµαγ
No dark matter 41 VL kx =+
V;)k
(.M x log1
452+
−= klum L~L
M
k=0.1 for I bandk=0.3 for R band
function of the band
The slope of TF-relation is related to k

Physical meaning of the slope
The slope of the TF-relation steadily rises with distance due to the fact that the fractional amount of the dark matter in galaxies changes with the radius.
240 )),(1(~ −+ LRVL α
MM
lum
dark α= parmetermatter dark
α decreases with L
α increases with Rthis has influence on the slope

Scatter of the TF-relation

TF-relation using Vmax
1.9 2.0 2.1 2.2 2.3 2.4 2.5
-19.0
-19.5
-20.0
-20.5
-21.0
-21.5
-22.0
-22.5
MR
log Vmax
1.4 1.6 1.8 2.0 2.2 2.4 2.6-16
-17
-18
-19
-20
-21
-22
-23
-24
Mi
logVmax
slope=-7,579; scatter=0,328; number of galaxies=843
slope=-5.54; scatter=0.49; number of galaxies=83


Probing dark matter halos of spiral galaxies with their satellites
1.5 - 2 satellites per host galaxy
•Zaritsky (1993): 45 primaries – 69 satellitesKitt Peak 2.3 m
•Sales & Lambas (2004): 1498 primaries – 3079 satellites
2dFGRS 3.9 m
•T. Breinerd (2004) 3 samples: 1351 primaries – 2084 satellites, 948 primaries – 1294 satellites,400 primaries – 658 satellites
SDSS 2.5 m

We are studying 7 isolated spiral galaxies at z = 0.03 - 0.09
+ = 58 h
Satellites + Rotation curves

SDSS J154040.56-000933.5z=0.078

7 primaries 77 satellites identified
Primary galaxy
z N of sat. (SDSS)
N of sat. (found)
SDSSJ134215.02 0.029 4 8SDSSJ145211.01 0.046 4 7SDSSJ152621.67 0.083 4 17SDSSJ153221.6 0.085 5 19SDSSJ154040.5 0.075 7 11SDSSJ154904.29 0.077 2 8SDSSJ221957.2 0.038 4 7

SDSS J145211.01+044053.6

SDSS J145211.01+044053.6

SDSS J145211.01+044053.6

Main results:•The kinematical and spectro-photometrical methods coincides
•We found a Radial Tully-Fisher (RTF):
The slope decreases monotonically with the distance, while the scatter increases with distance. This implies the presence of a non luminous mass component (DM) whose dynamical importance, with respect to the stellar disk (baryonic matter) increases with radius.
The small scatter in the RTF-relation. This implies that galaxies have similar physical characteristics.
• Satellites seems a good tracer of matter distribution in spirals


