
Kansas Housing Markets2011 ForecastJanuary 13, 2011
Dr. Stanley D. LonghoferWSU Center for Real Estate

Our Partnership with You
In 2008, the WSU Center for real estate entered into a partnership with the Kansas Association of Realtors® and most of your local Realtor® or MLS boards to help provide comprehensive statistics and analysis of MLS data across the state

Our Partnership with You:Statewide Housing Market Data

2007-2010: Ripple Effects
The end of the subprime era (including piggyback loans)
Layoffs and job market turmoil An explosion of foreclosure activity Record low mortgage rates (for those
who can qualify) Homebuyer tax credits (times two)

Existing Home Sales Activity
3,000
4,000
5,000
6,000
7,000
U.S
. Sal
es in
1,0
00s
10
15
20
25
30
Kan
sas
Sal
es in
1,0
00s
2006 2007 2008 2009 2010
KansasU.S.
Sources: NAR and participating Kansas REALTOR MLS systemsNote: Data are seasonally-adjusted annual rates
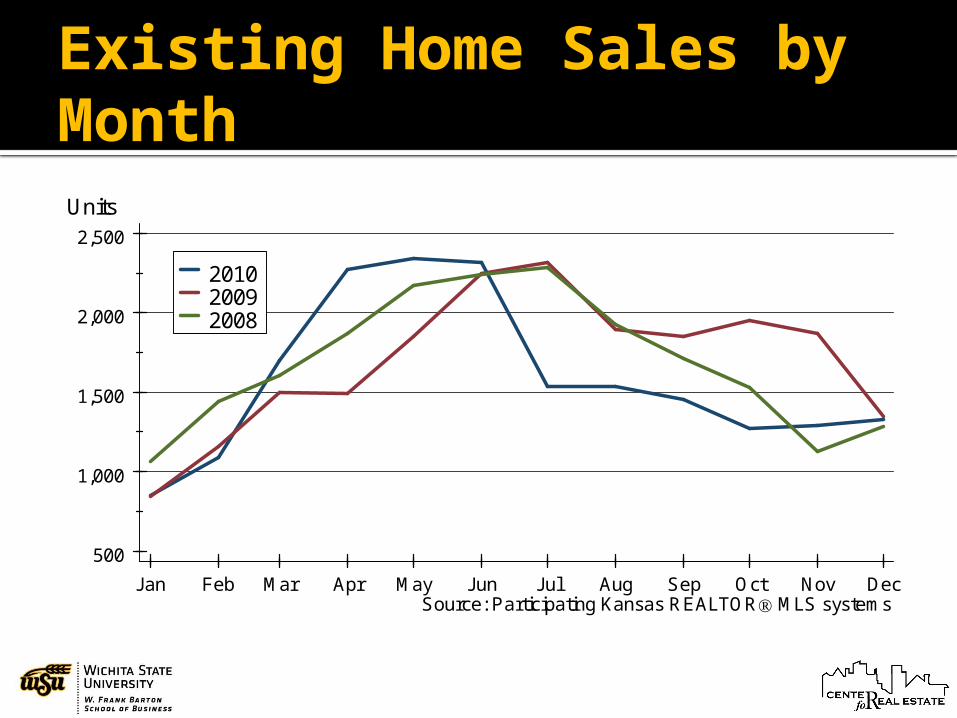
Existing Home Sales by Month
500
1,000
1,500
2,000
2,500
Jan Feb Mar Apr May Jun Jul Aug Sep Oct Nov Dec
201020092008
Source: Participating Kansas REALTOR MLS systems
Units

Existing Home Inventories
0
2
4
6
8
10
12
2008 2009 2010
U.S.Kansas
Sources: NAR and participating Kansas REALTOR MLS systemsNote: U.S. data are seasonally adjusted; Kansas data are not
Months' Supply

U.S. New Home Activity
300
600
900
1,200
1,500
1,800
2,100
U.S
. Sin
gle-
Fam
ily B
uild
ing
Per
mits
200
400
600
800
1,000
1,200
1,400
U.S
. New
Hom
e S
ales
2001 2002 2003 2004 2005 2006 2007 2008 2009 2010
SalesPermits
Source: U.S. Bureau of the CensusData are seasonally-adjusted annual rates

New Home Sales Activity
200
400
600
800
1,000
1,200
U.S
. Sal
es in
1,0
00s
0
1,000
2,000
3,000
4,000
5,000
Kan
sas
Sal
es
2006 2007 2008 2009 2010
KansasU.S.
Sources: U.S. Census Bureau and participating Kansas REALTOR MLS systemsNote: Data are seasonally-adjusted annual rates

New Home Sales by Month
50
100
150
200
250
Jan Feb Mar Apr May Jun Jul Aug Sep Oct Nov Dec
201020092008
Source: Participating Kansas REALTOR MLS systems
Units
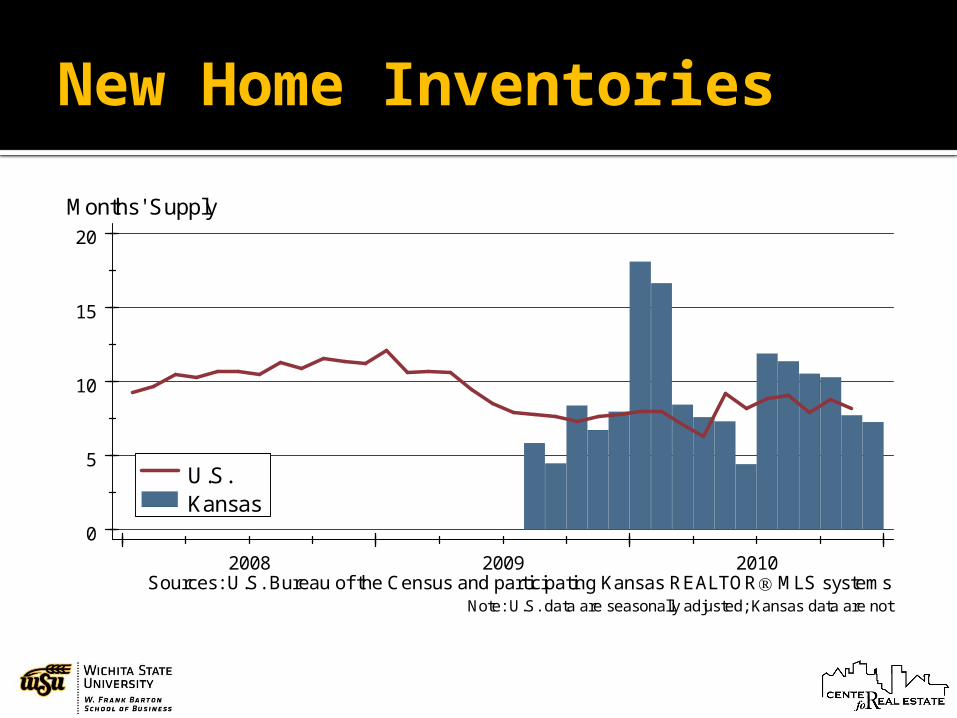
New Home Inventories
0
5
10
15
20
2008 2009 2010
U.S.Kansas
Sources: U.S. Bureau of the Census and participating Kansas REALTOR MLS systemsNote: U.S. data are seasonally adjusted; Kansas data are not
Months' Supply

New Single-Family Building Permits
0
250
500
750
1,000
1,250
1,500
1,750
U.S
. S.F
. Per
mits
in 1
,000
s
0
2
4
6
8
10
12
14
Kan
sas
S.F
. Per
mits
in 1
,000
s
2006 2007 2008 2009 2010
KansasU.S.
Source: U.S. Bureau of the CensusData are seasonally adjusted annual rates

Home Price Appreciation
-10
-5
0
5
10
15
2000 2001 2002 2003 2004 2005 2006 2007 2008 2009 2010
KansasU.S.
Source: Federal Housing Finance Agency (FHFA)
Percent

Home Price Appreciation
100.00
120.00
140.00
160.00
180.00
2000 2001 2002 2003 2004 2005 2006 2007 2008 2009 2010
KansasU.S.
Source: Federal Housing Finance Agency (FHFA)
Index: 2000q1 = 100

Kansas Home Price Appreciation
95.00
100.00
105.00
110.00
115.00
2007 2008 2009 2010
Kansas City Lawrence ManhattanTopeka Wichita
Source: Federal Housing Finance Agency (FHFA)
Index: 2007q1 = 100

What Can We Expect for 2011?
2010 was a tumultuous yearHard to tell the current in the market with all the ripples
How fast markets recover depends in large part on the rest of the economy

Real GDP Growth since 2001
-10
-5
0
5
10
2001 2002 2003 2004 2005 2006 2007 2008 2009 2010Source: Bureau of Economic Analysis
Percent

Total Non-Farm Employment
125,000
130,000
135,000
140,000
145,000
U.S
. Em
ploy
men
t in
1,00
0s
1,250
1,300
1,350
1,400
1,450
Kan
sas
Em
ploy
men
t in
1,00
0s
2001 2002 2003 2004 2005 2006 2007 2008 2009 2010
KansasU.S.
Source: U.S. Bureau of Labor StatisticsData are seasonally adjusted

Unemployment Rate
2
4
6
8
10
12
2001 2002 2003 2004 2005 2006 2007 2008 2009 2010
KansasU.S.
Source: U.S. Bureau of Labor StatisticsData are seasonally adjusted
Percent
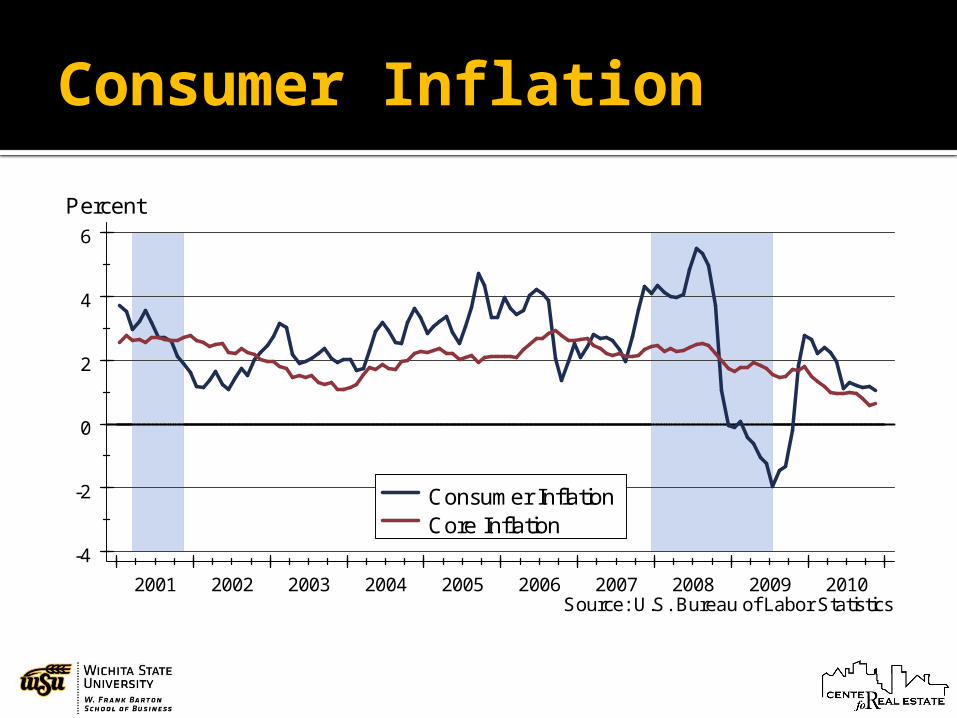
Consumer Inflation
-4
-2
0
2
4
6
2001 2002 2003 2004 2005 2006 2007 2008 2009 2010
Consumer InflationCore Inflation
Source: U.S. Bureau of Labor Statistics
Percent
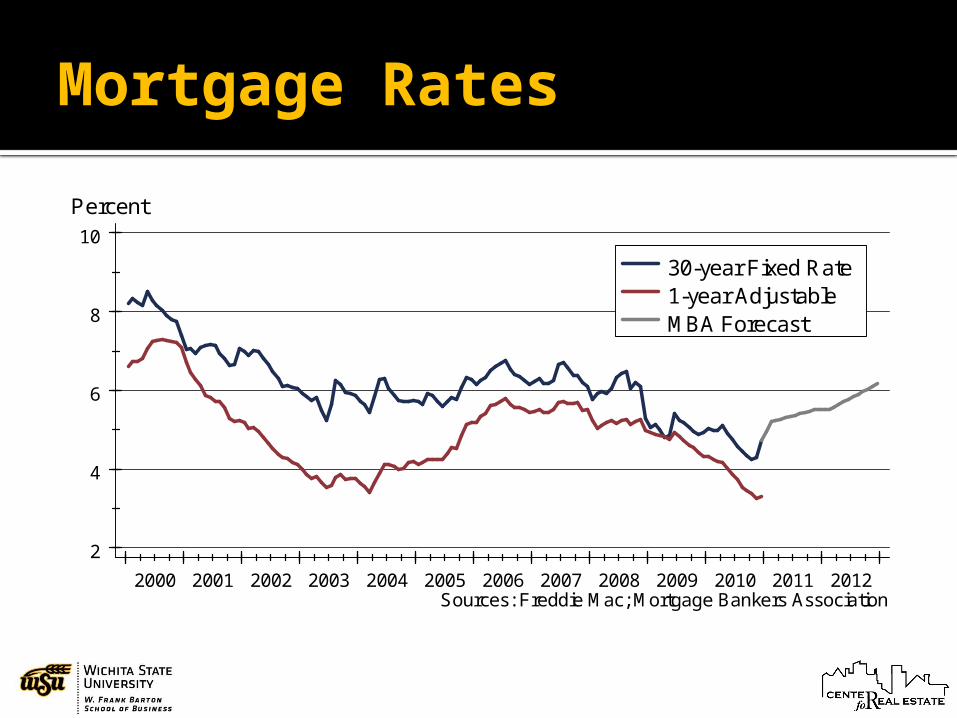
Mortgage Rates
2
4
6
8
10
2000 2001 2002 2003 2004 2005 2006 2007 2008 2009 2010 2011 2012
30-year Fixed Rate1-year AdjustableMBA Forecast
Sources: Freddie Mac; Mortgage Bankers Association
Percent
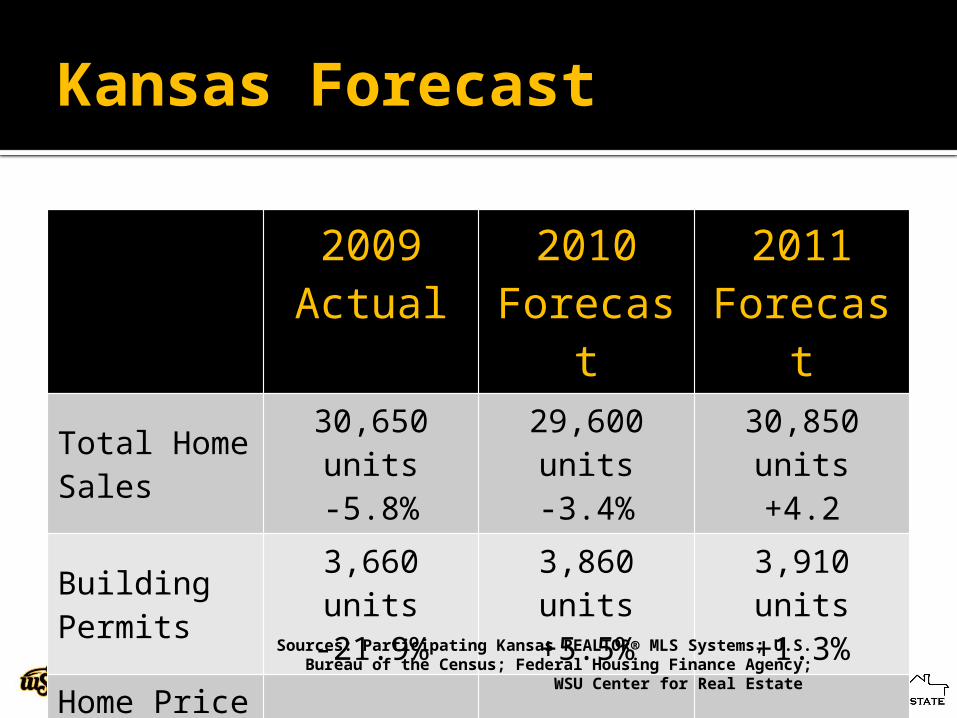
Kansas Forecast
2009 Actual
2010 Forecast
2011 Forecast
Total Home Sales
30,650 units-5.8%
29,600 units-3.4%
30,850 units+4.2
Building Permits
3,660 units-21.9%
3,860 units+5.5%
3,910 units+1.3%
Home Price Appreciation
-0.4% -1.1% +0.2%
Sources: Participating Kansas REALTOR® MLS Systems; U.S. Bureau of the Census; Federal Housing Finance
Agency; WSU Center for Real Estate

2011 Housing Markets Forecast
Kansas City
Lawrence
Manhattan Topeka Wichita
Sales25,050 units
+2.5%
1,430 units
+9.2%
620 units+3.3%
2,700 units
+1.1%
8,680 units+6.6%
Permits
2,100 units
+1.9%
220 units
+10.0%
190 units-5.0%
310 units
+14.8%
1,080 units+0.9%
Home Prices -1.3% -0.5% +0.8% -0.5% +1.4%Sources: Heartland MLS; Lawrence Board of
REALTORS®; Manhattan Association of REALTORS®; Topeka Area Association of REALTORS®; South Central
Kansas MLS; U.S. Bureau of the Census; City of Manhattan; Federal Housing Finance Agency; WSU
Center for Real Estate

Laying a Foundation for Real Estate in Kansas
WSU Center for Real Estate


