January 2012
FundingStatement 2012-13
Championing Young People’s Learning
☺
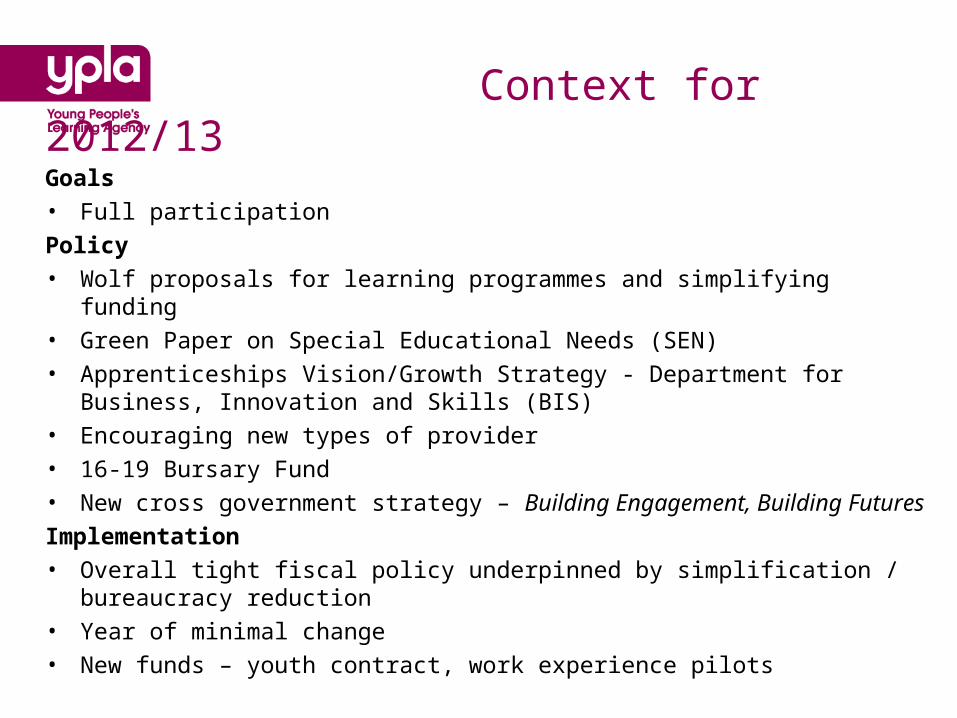
Context for 2012/13
Goals
• Full participation
Policy
• Wolf proposals for learning programmes and simplifying funding
• Green Paper on Special Educational Needs (SEN)
• Apprenticeships Vision/Growth Strategy - Department for Business, Innovation and Skills (BIS)
• Encouraging new types of provider
• 16-19 Bursary Fund
• New cross government strategy – Building Engagement, Building Futures
Implementation
• Overall tight fiscal policy underpinned by simplification / bureaucracy reduction
• Year of minimal change
• New funds – youth contract, work experience pilots
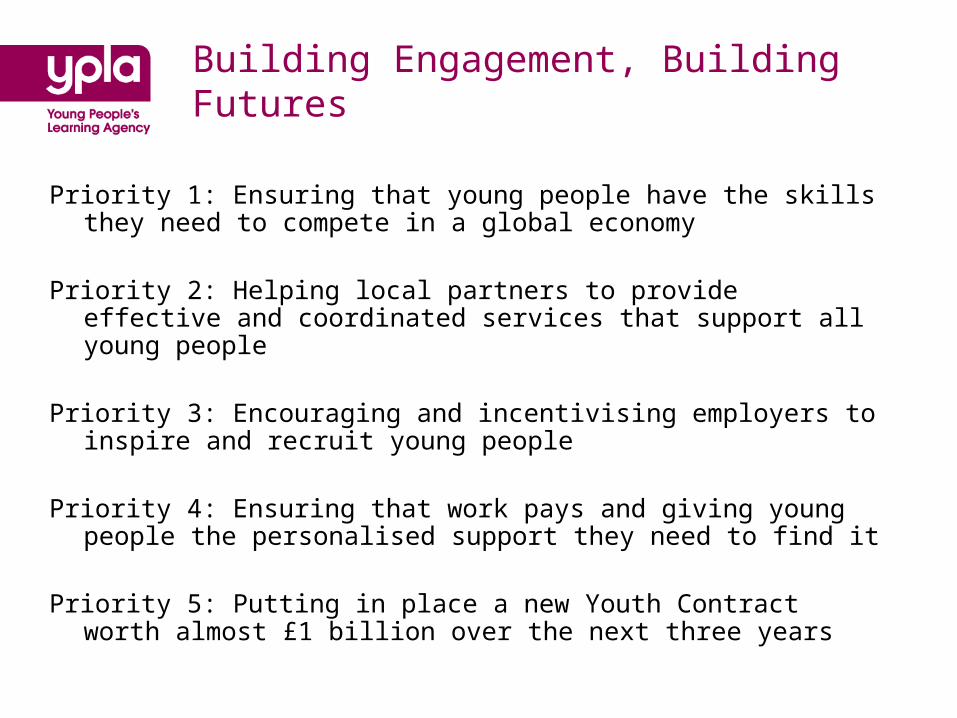
Building Engagement, Building Futures
Priority 1: Ensuring that young people have the skills they need to
compete in a global economy Priority 2: Helping local partners to provide effective and coordinated
services that support all young people Priority 3: Encouraging and incentivising employers to inspire and
recruit young people
Priority 4: Ensuring that work pays and giving young people the personalised support they need to find it
Priority 5: Putting in place a new Youth Contract worth almost £1 billion over the next three years

Existing and New Funds
Lagged learner numbers Exceptions
ESF New Funds Pilots
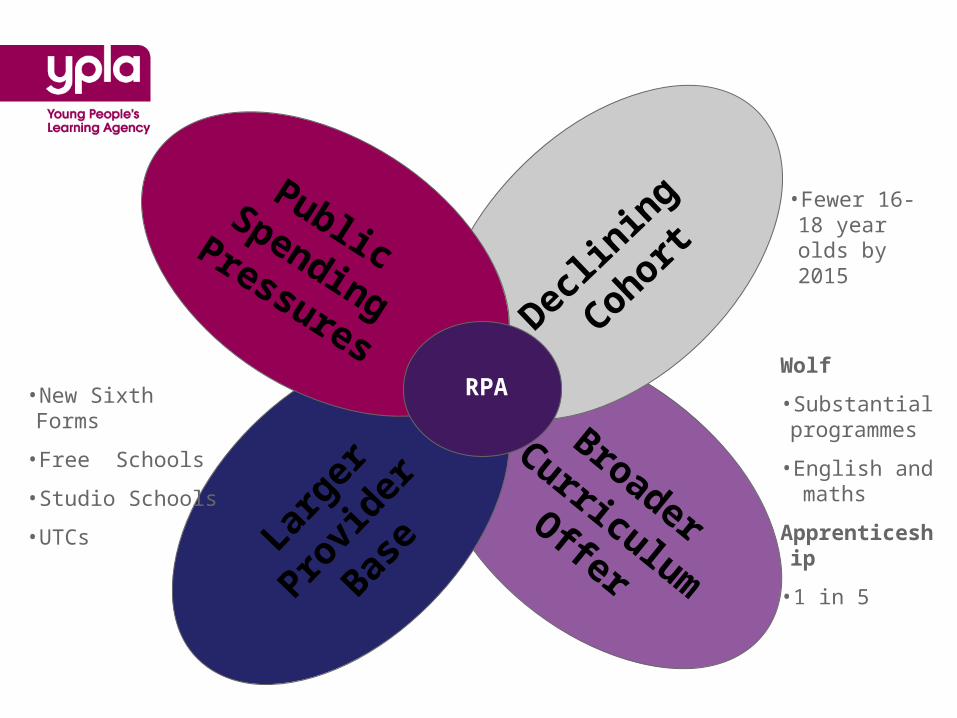
Broader
Curriculum
Offer
Larger
Provi
der
Base
Declin
ing
CohortPublic
Spending
Pressures
•Fewer 16-18 year olds by 2015
Wolf
•Substantial programmes
•English and maths
Apprenticeship
•1 in 5
•New Sixth Forms
•Free Schools
•Studio Schools
•UTCs
RPA
Spending Review2011-12 to 2014-15
Championing Young People’s Learning
☺
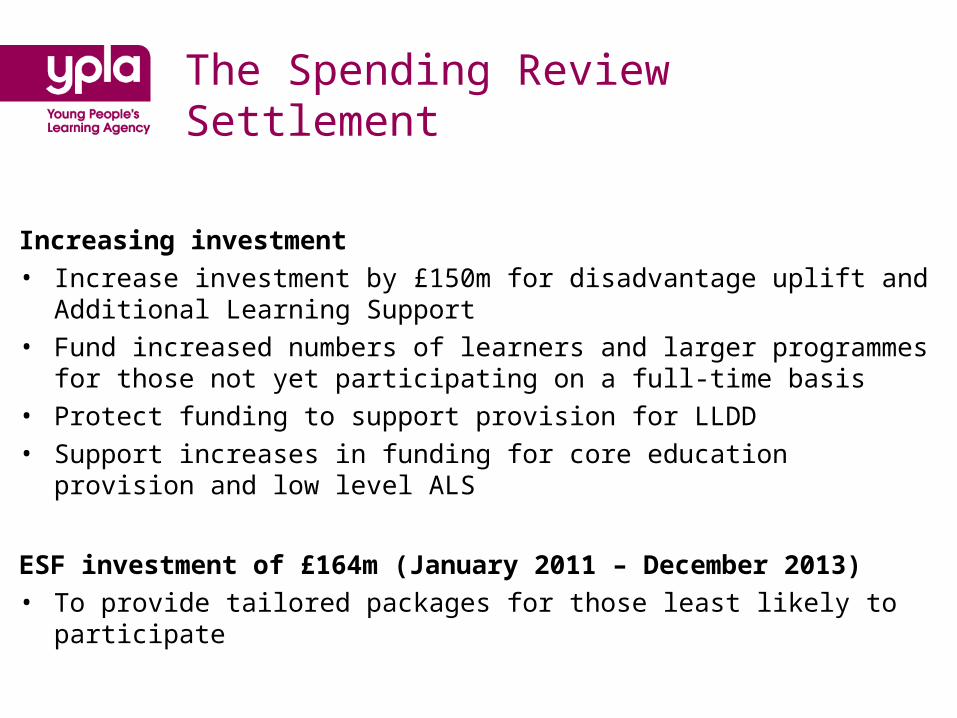
The Spending Review Settlement
Increasing investment• Increase investment by £150m for disadvantage uplift and Additional
Learning Support • Fund increased numbers of learners and larger programmes for those not
yet participating on a full-time basis• Protect funding to support provision for LLDD• Support increases in funding for core education provision and low level
ALS
ESF investment of £164m (January 2011 – December 2013)• To provide tailored packages for those least likely to participate

The Spending Review Settlement
Policy for Spending Review Period set out last year:• Funding for Entitlement reduced to 30 hours• National Funding Rate equalised for schools/Academies to a single rate• National Funding Rate for Apprenticeships to reduce by 2% per year• Staged removal of Teachers’ Pay Grant
• To fund increases and provide transitional protection to manage changes in funding at provider level carefully and in stages
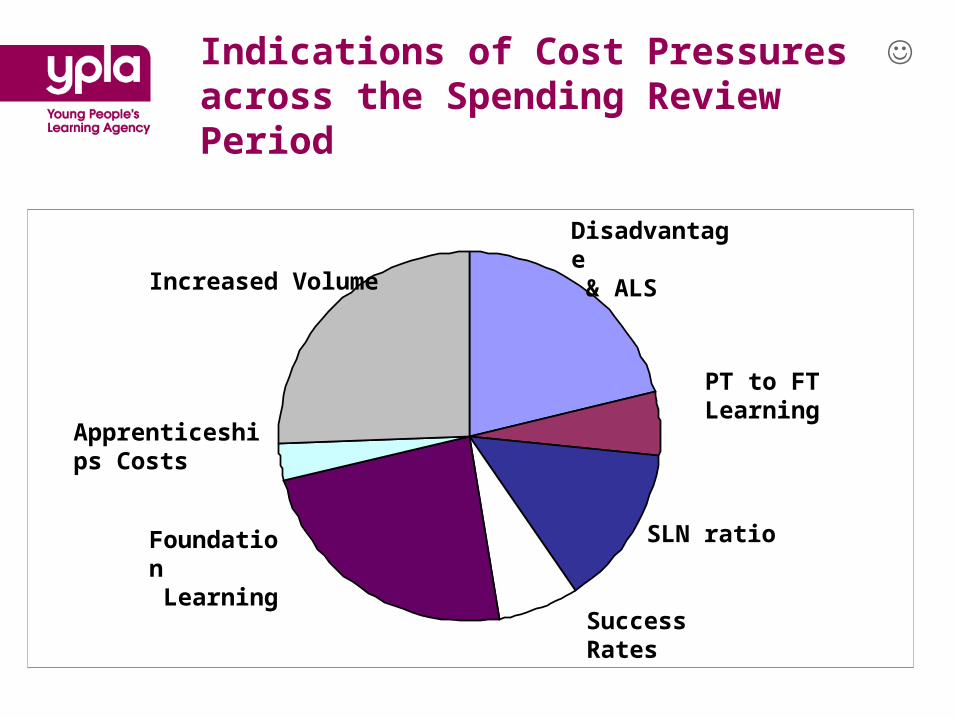
Indications of Cost Pressuresacross the Spending Review Period
Disadvantage & ALS
PT to FT Learning
SLN ratio
Success Rates
Foundation Learning
Apprenticeships Costs
Increased Volume
☺

Increased Budget
Indications of Funding Cost Pressures across the SR Period
ReducedSSF Entitlement
Apprenticeship Rates Reduction
Reduced FE Entitlement
SSF Convergenceto FE Funding Rate
☺
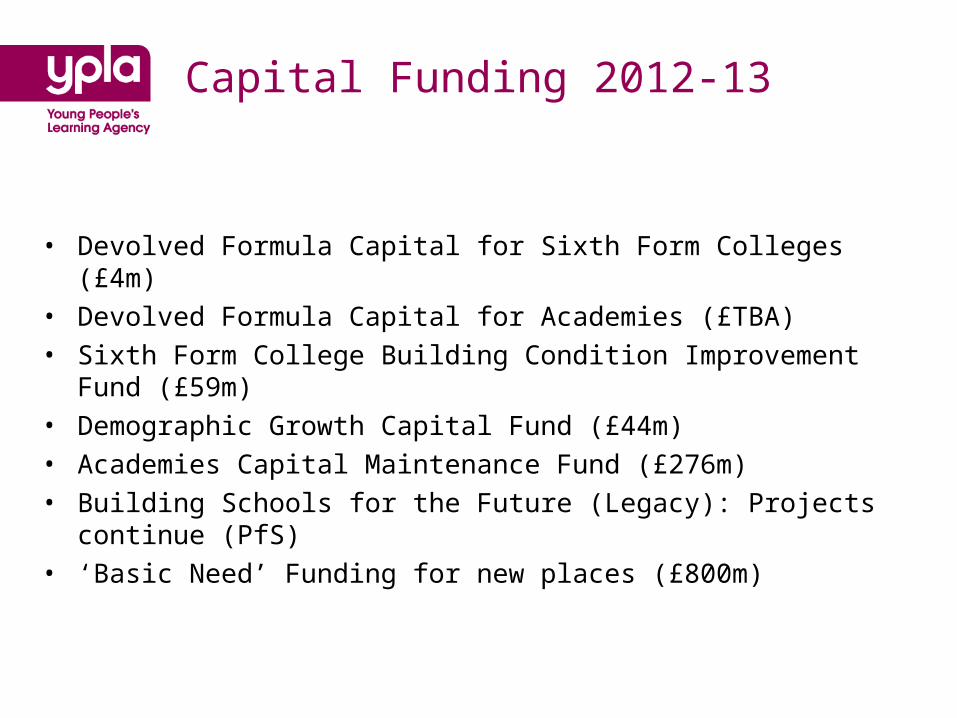
Capital Funding 2012-13
• Devolved Formula Capital for Sixth Form Colleges (£4m)• Devolved Formula Capital for Academies (£TBA)• Sixth Form College Building Condition Improvement Fund (£59m)• Demographic Growth Capital Fund (£44m)• Academies Capital Maintenance Fund (£276m) • Building Schools for the Future (Legacy): Projects continue (PfS)• ‘Basic Need’ Funding for new places (£800m)

The Drive to Full Participation
Championing Young People’s Learning
☺
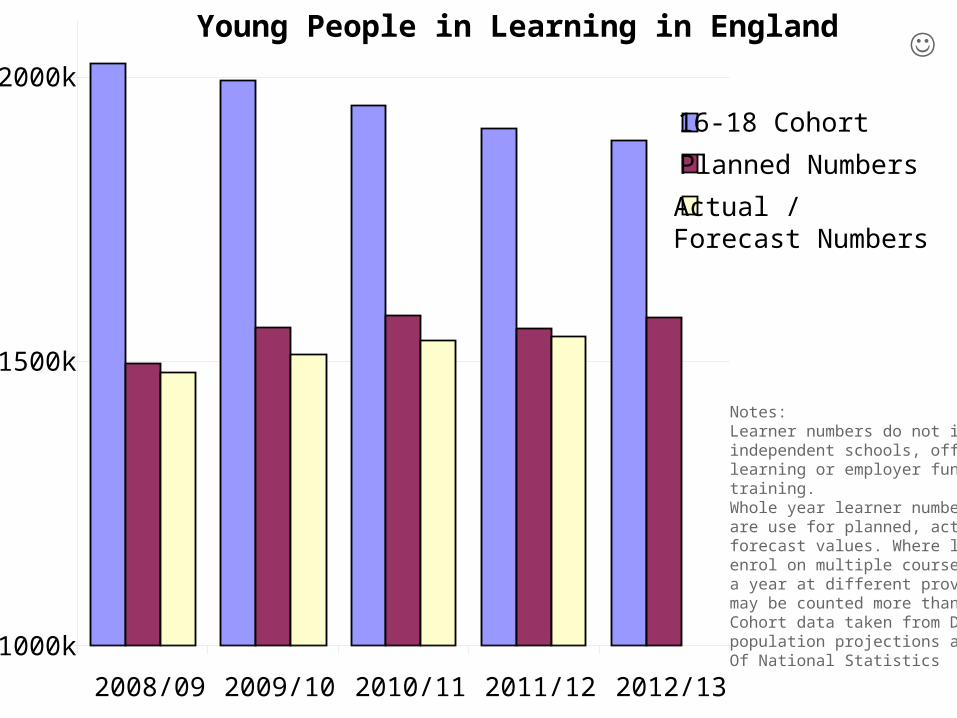
Notes:Learner numbers do not includeindependent schools, offenderlearning or employer fundedtraining.Whole year learner numbersare use for planned, actual andforecast values. Where learnersenrol on multiple courses during a year at different providers theymay be counted more than once.Cohort data taken from DfEpopulation projections and OfficeOf National Statistics
Young People in Learning in England
1000k
1500k
2000k
2008/09 2009/10 2010/11 2011/12 2012/13
16-18 Cohort
Planned Numbers
Actual / Forecast Numbers
☺
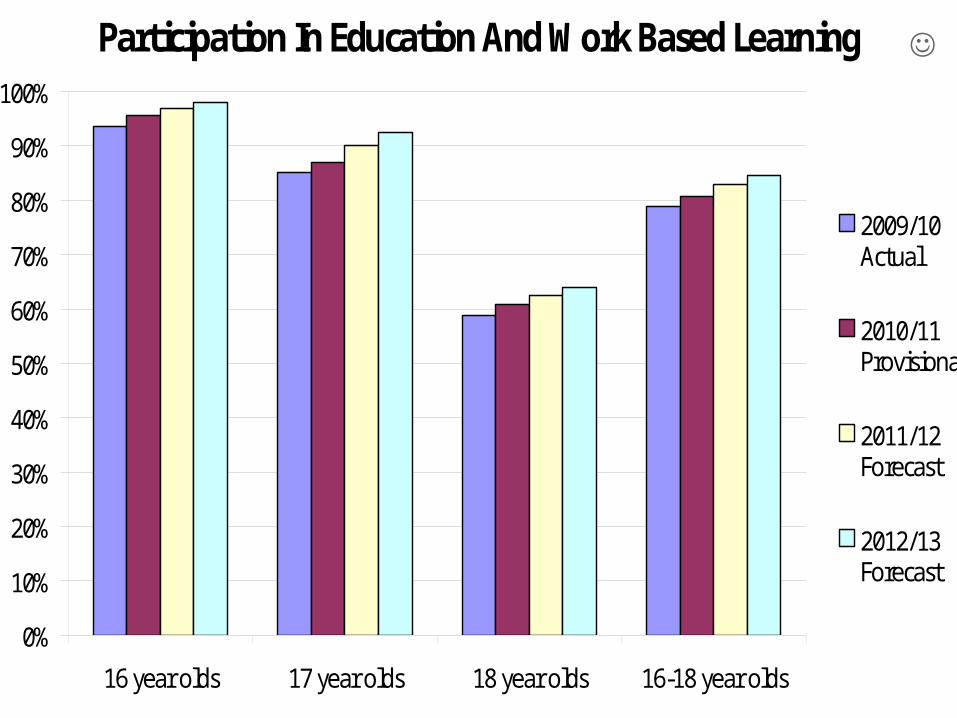
Participation In Education And Work Based Learning
0%
10%
20%
30%
40%
50%
60%
70%
80%
90%
100%
16 year olds 17 year olds 18 year olds 16-18 year olds
2009/10Actual
2010/11Provisional
2011/12Forecast
2012/13Forecast
☺

Learner numbers 2012/13
Young People Learning in England:Academic Year
2010/11estimated
2011/12estimated
2012/13estimated
Total participation:[1] 1,535k 1,543k 1,577k
Of which:
Colleges and other providers 872k 863k 865k
School Sixth Forms (incl. Academies & Special Educational Needs (SEN)/Special Schools post-16) 441k 449k 465k
Apprenticeships 215k 222k 240k
Specialist provision for LLDD 16-24 4k 4k 4k
FE provision for LLDD 19-24 (TBC) 4k 4k 4k
☺
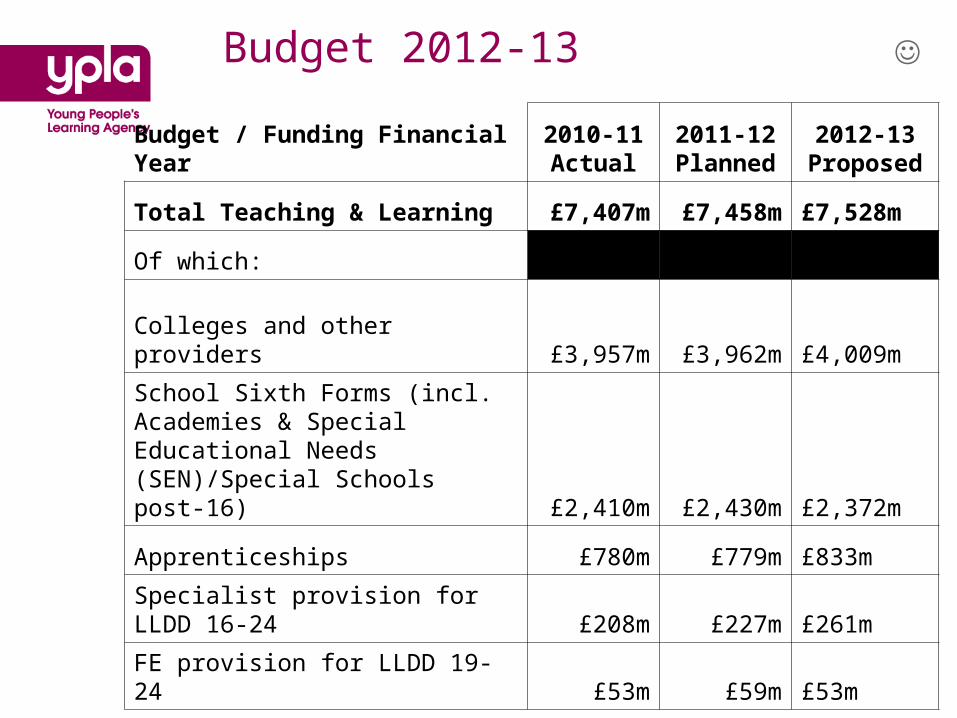
Budget 2012-13
Budget / Funding Financial Year2010-11Actual
2011-12Planned
2012-13Proposed
Total Teaching & Learning £7,407m £7,458m £7,528m
Of which:
Colleges and other providers £3,957m £3,962m £4,009m
School Sixth Forms (incl. Academies & Special Educational Needs (SEN)/Special Schools post-16) £2,410m £2,430m £2,372m
Apprenticeships £780m £779m £833m
Specialist provision for LLDD 16-24 £208m £227m £261m
FE provision for LLDD 19-24 £53m £59m £53m
☺

Key Messages
• Enough funding to provide 1.58m places and enough places for 98% of 16 year olds, over 92% of 17 year olds and 65% of 18 year olds
• Extension of Transitional Protection by one further year for those with the biggest adjustments
• 34,000 more places than we expect to deliver in 2011/12 and against a fall in the cohort of over 20,000: new places created to assist LAs to respond flexibly to pockets of
need• 18,000 Apprenticeship places more than we planned for 2011/12 to
support the emphasis on Apprenticeships• New funds and pilots

Priorities
• Improving retention between years 12 and 13• NEET Group age 16 and 17• Improving the contribution for participation and
progression from Foundation Learning• New Cross-Government Strategy – Building
Engagement, Building Futures

Foundation Learning Review
• Recruitment is a significant challenge • Sizes of programmes variable • Foundation learning is not providing bridge to Level 2 • Relatively little ‘personalisation’ of programmes • Progression in 2010/11 is expected to be weaker than in 2009/10 • Very focused programmes are more successful • Capacity of providers is an issue • Effective marketing and support for learner are key to success • Study programmes consultation includes FL and could deliver some
flexibility
☺

Rebalance funding towards disadvantaged learners and those needing additional support
Championing Young People’s Learning
☺
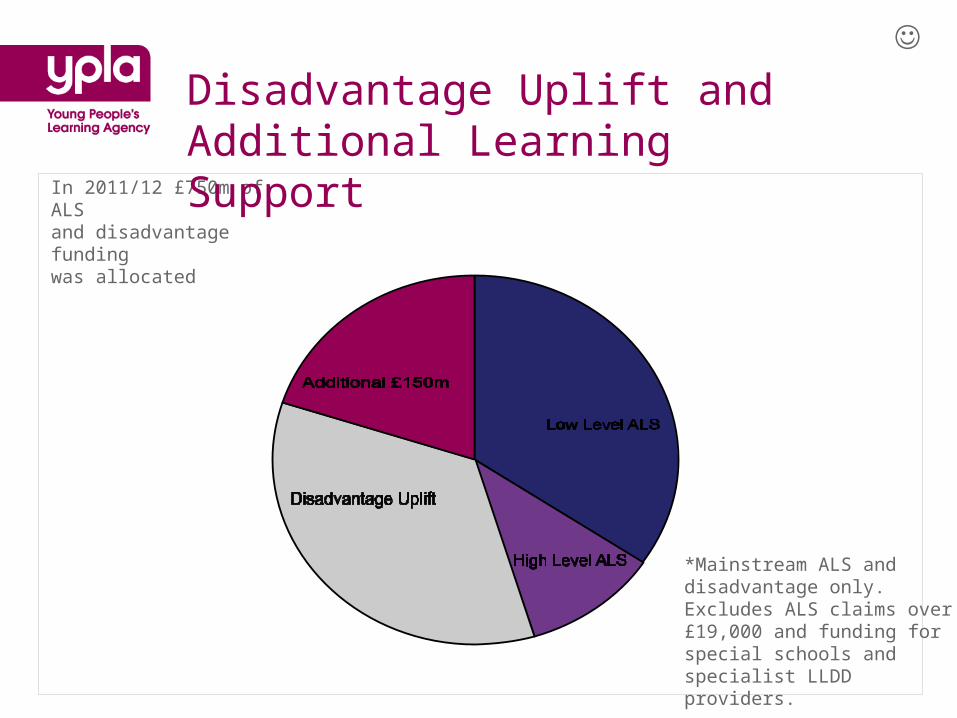
In 2011/12 £750m of ALSand disadvantage fundingwas allocated
*Mainstream ALS and disadvantage only. Excludes ALS claims over £19,000 and funding for special schools and specialist LLDD providers.
Disadvantage Uplift and Additional Learning Support
☺

Protecting Funding for Learners with Learning Difficulties and/or Disabilities
• Arrangements for funding learners with LDD to remain the same in 2012/13 as in 2011/12
• Budgets for 2012/13 will be calculated and passed out to providers as for 2011/12
• The Consultation on School Funding Reform set out Ministers’ plans to revise funding approaches for high needs pupils (affecting high level support budgets over £6000) and set an earliest date for change as financial year 2013-14
• Proposals for next steps will be made available in due course
• DfE considering future arrangements for provision for learners with special educational needs (SEN) or LDD
☺

High Cost ALS☺

Bursary Funds 2012/13
Bursaries (£180m Academic Year)• Funds available increase from £115m to £180m as
EMA transitional payments end• Bursaries of £1200 will continue for those in defined
vulnerable groups

Targeted Learner Support Funds
Arrangements still to be confirmed for• Care to Learn • Residential Support
Dance and Drama Awards• Arrangements for 2012/13 as in 2011/12
☺

Allocations
Championing Young People’s Learning
☺
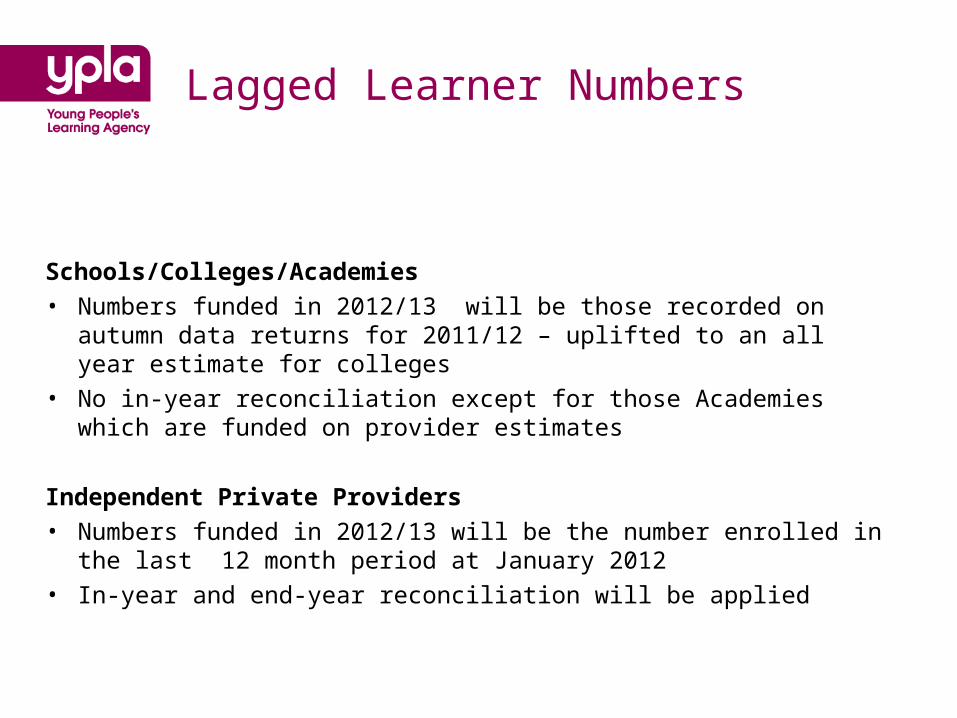
Lagged Learner Numbers
Schools/Colleges/Academies• Numbers funded in 2012/13 will be those recorded on autumn data
returns for 2011/12 – uplifted to an all year estimate for colleges• No in-year reconciliation except for those Academies which are
funded on provider estimates
Independent Private Providers• Numbers funded in 2012/13 will be the number enrolled in the last
12 month period at January 2012• In-year and end-year reconciliation will be applied

Exceptions to lagged learner numbers
Infrastructure changes New institutions, Mergers, closures
Extension of age range in 11-16 schools/Academies
Re-distribution of provision by agreement
Agreed re-allocation of learners (learner number neutral)
Academies Where Funding Agreements stipulate the use of Provider estimates
Significant provider failure
Performance issues, financial stability, breach of contract
Capital projects are not a routine exception to lagged learner numbers
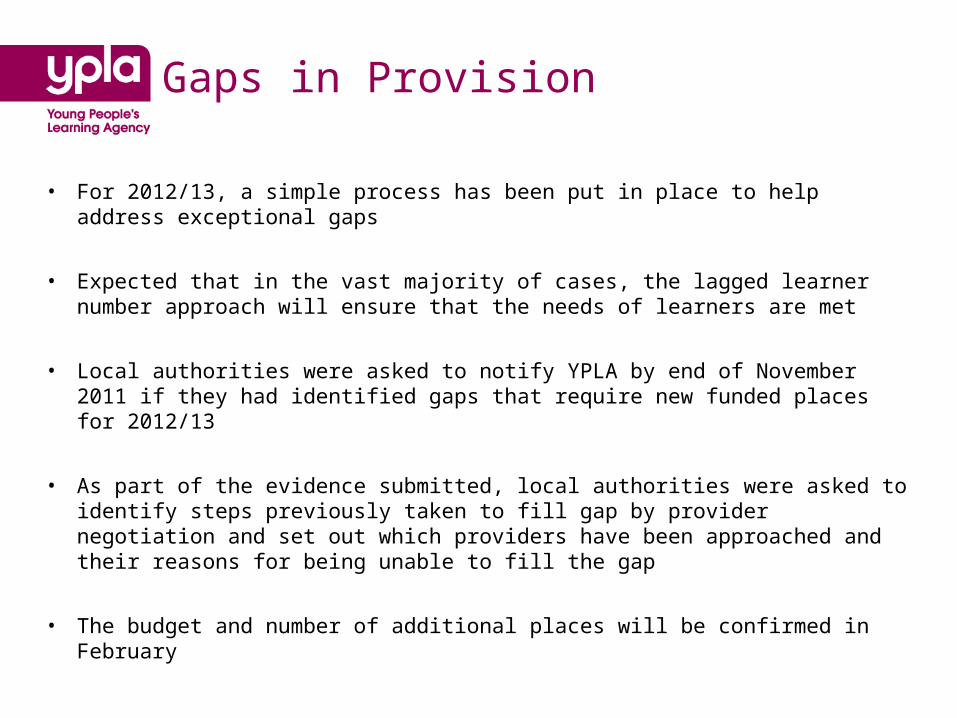
Gaps in Provision
• For 2012/13, a simple process has been put in place to help address exceptional gaps
• Expected that in the vast majority of cases, the lagged learner number approach will ensure that the needs of learners are met
• Local authorities were asked to notify YPLA by end of November 2011 if they had identified gaps that require new funded places for 2012/13
• As part of the evidence submitted, local authorities were asked to identify steps previously taken to fill gap by provider negotiation and set out which providers have been approached and their reasons for being unable to fill the gap
• The budget and number of additional places will be confirmed in February
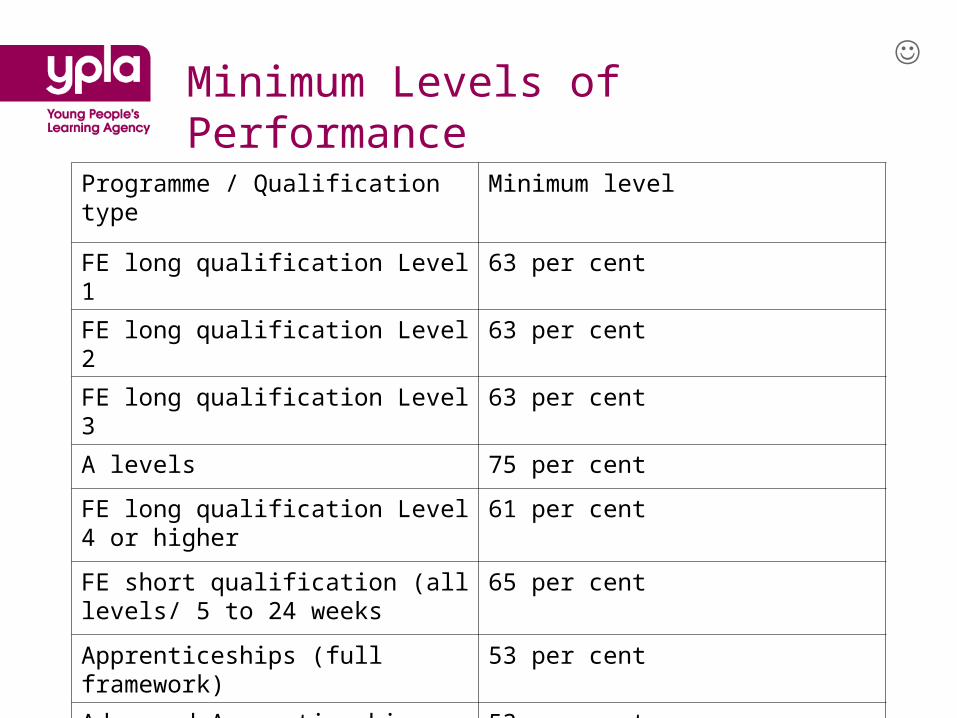
Programme / Qualification type Minimum level
FE long qualification Level 1 63 per cent
FE long qualification Level 2 63 per cent
FE long qualification Level 3 63 per cent
A levels 75 per cent
FE long qualification Level 4 or higher
61 per cent
FE short qualification (all levels/ 5 to 24 weeks
65 per cent
Apprenticeships (full framework) 53 per cent
Advanced Apprenticeships (full framework)
53 per cent
Minimum Levels of Performance☺

Minimum Levels of Performance
• Using 2010/11 performance data - any Notices to Improve (NtI) issued in this round will apply to the 2012/13 academic year
• Responsibility for any NtIs issued by YPLA and not lifted by end of March 2012 transfers to DfE or EFA
Beyond this year• DfE are thinking about a minimum standard that can apply
across all 16-18 provision (current MLP does not apply to school sixth form provision)
• We expect DfE to bring out proposals some time in the new year
Funding Formula
• The SLN to learner number ratio will be updated based on 2010/11 data
• The success factor will be updated to use 2009/10 qualification success rate data
• A 2% cap will be applied to reductions in success factors due to data volatility
• All increases in success rates will be funded in full• Latest version of IMD used, 2010 rather then 2007
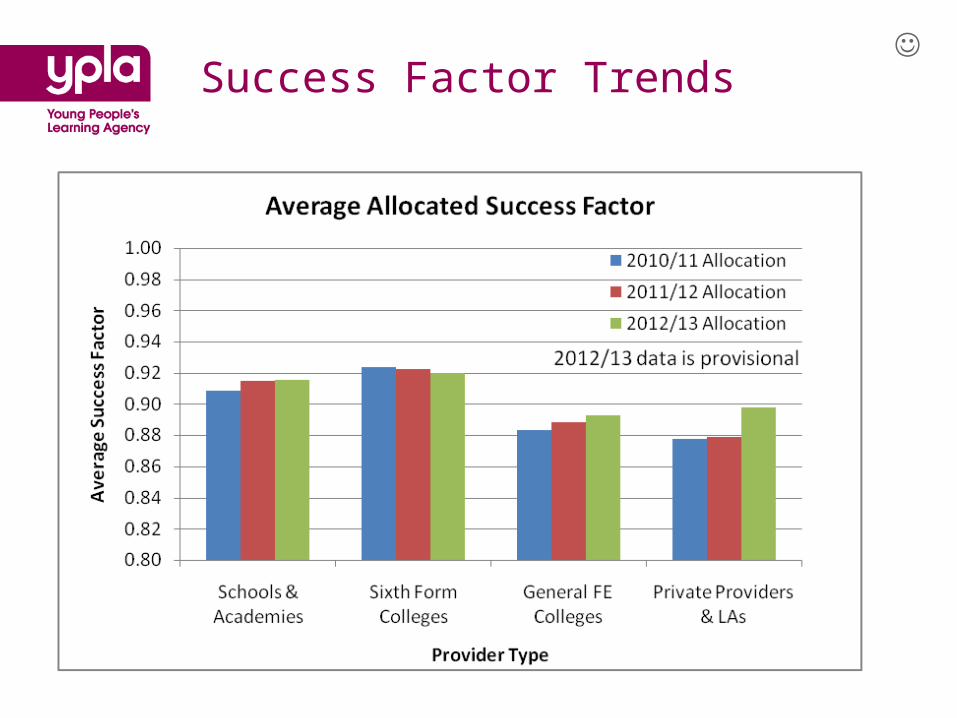
Success Factor Trends☺

IMD Table – Top 10
Local Authority IMD2007 based ranking
IMD2010 based ranking
Change in IMD2010 ranking relative to
IMD2007 rank
Manchester 2nd 1st up 1
Hackney 3rd 2nd up 1
Tower Hamlets 1st 3rd down 2
Liverpool 4th 4th Same
Newham 5th 5th Same
Knowsley 6th 6th Same
Haringey 11th 7th up 4
Birmingham 8th 8th Same
Blackpool 17th 9th up 8
Middlesbrough 9th 10th down 1
☺
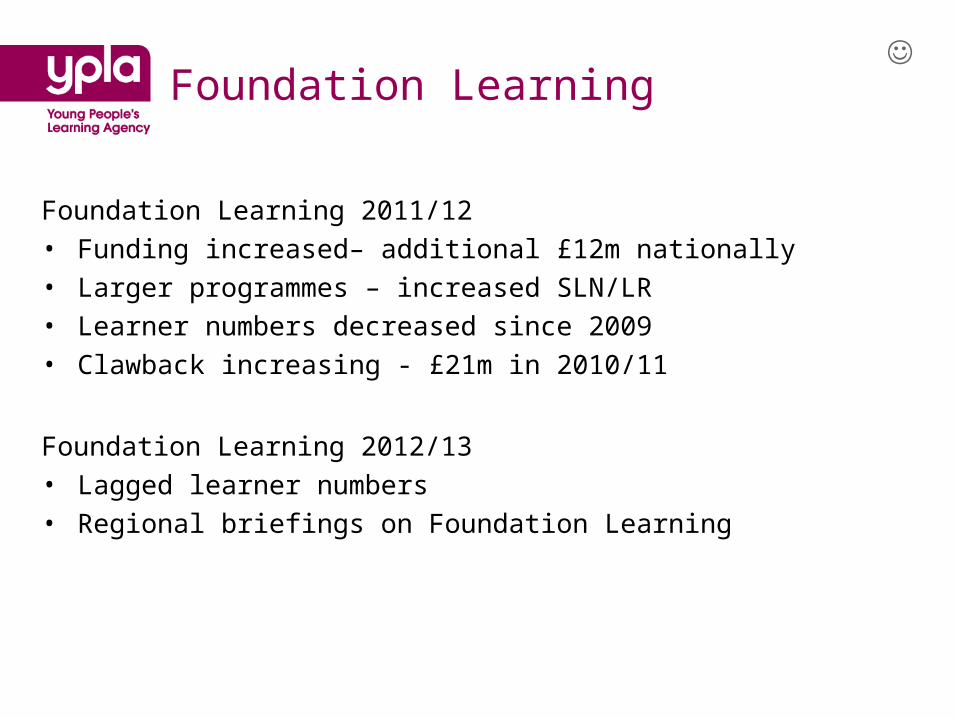
Foundation Learning
Foundation Learning 2011/12• Funding increased– additional £12m nationally • Larger programmes – increased SLN/LR • Learner numbers decreased since 2009 • Clawback increasing - £21m in 2010/11
Foundation Learning 2012/13• Lagged learner numbers • Regional briefings on Foundation Learning
☺
Championing Young People’s LearningChampioning Young People’s Learning
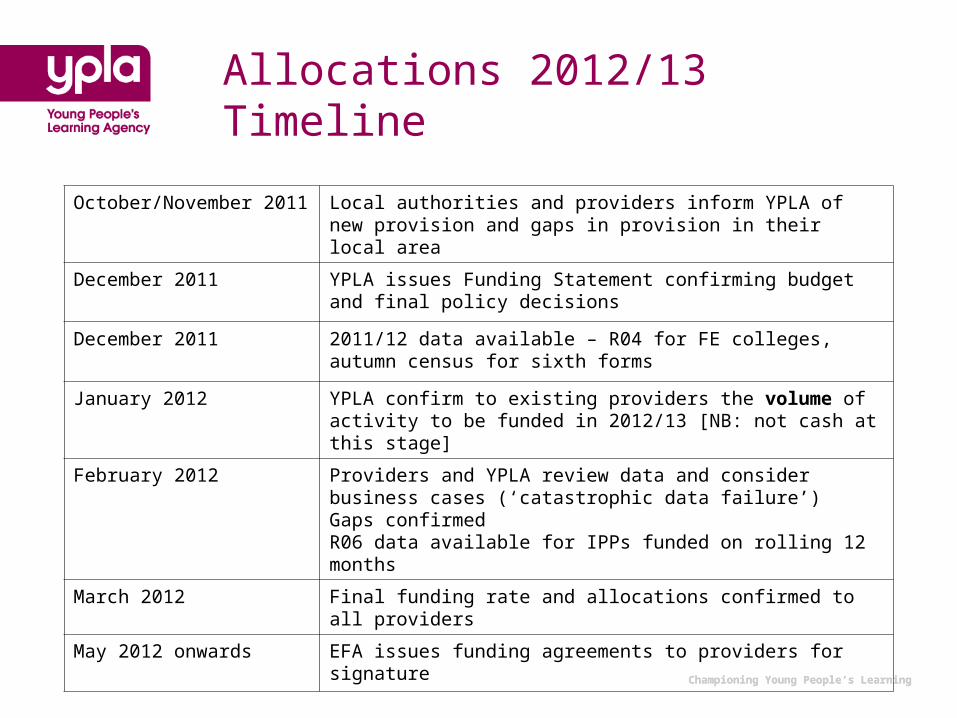
Allocations 2012/13Timeline
October/November 2011 Local authorities and providers inform YPLA of new provision and gaps in provision in their local area
December 2011 YPLA issues Funding Statement confirming budget and final policy decisions
December 2011 2011/12 data available – R04 for FE colleges, autumn census for sixth forms
January 2012 YPLA confirm to existing providers the volume of activity to be funded in 2012/13 [NB: not cash at this stage]
February 2012 Providers and YPLA review data and consider business cases (‘catastrophic data failure’)Gaps confirmedR06 data available for IPPs funded on rolling 12 months
March 2012 Final funding rate and allocations confirmed to all providers
May 2012 onwards EFA issues funding agreements to providers for signature

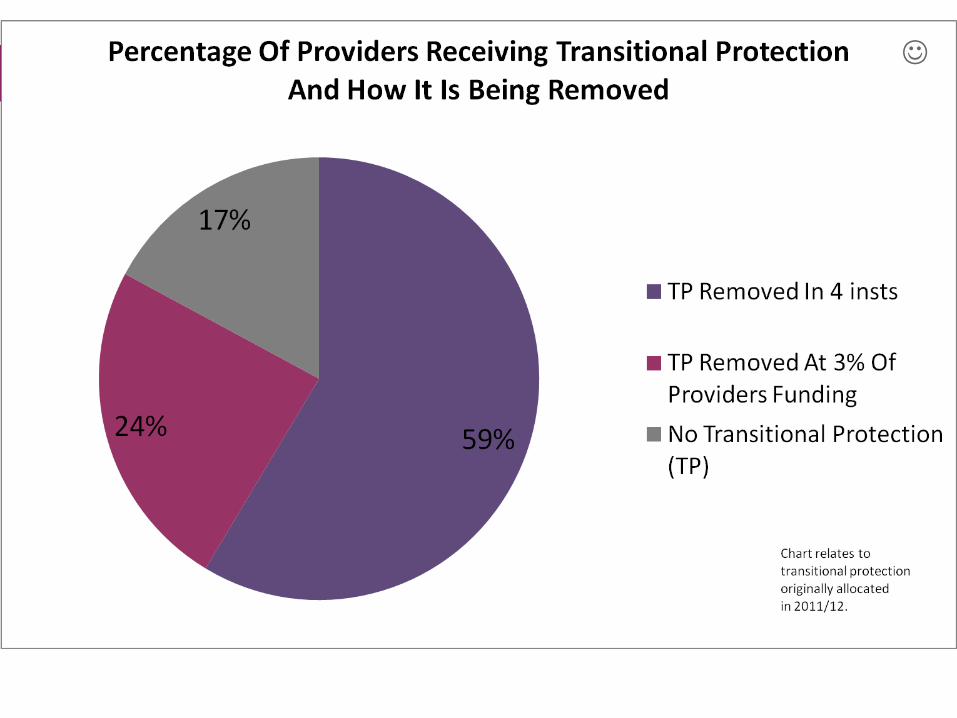
Transitional Protection
Championing Young People’s Learning
☺
☺

Transitional Protection: Example 1 (less than 3%)
£0
£200
£400
£600
£800
£1,000
£1,200
£1,400
£1,600
£1,800
£2,000
2011/12 2012/13 2013/14 2014/15 2015/16
TP P
er L
earn
er
TP £105 per learner in 2011/12 Total funding of £4500 per learner in 2011/12 Up to a 3% reduction of £135 per learner from their TP in 2012/13 This would remove them from transitional protection

Transitional Protection: Example 2 (3% - 12%)
£0
£200
£400
£600
£800
£1,000
£1,200
£1,400
£1,600
£1,800
£2,000
2011/12 2012/13 2013/14 2014/15 2015/16
TP P
er L
earn
er
TP £350 per learner in 2011/12 Total funding of £4500 per learner in 2011/12 Lead to a 3% reduction of £135 per learner from their TP in 2012/13

Transitional Protection: Example 3 (12%+)
£0
£200
£400
£600
£800
£1,000
£1,200
£1,400
£1,600
£1,800
£2,000
2011/12 2012/13 2013/14 2014/15 2015/16
TP P
er L
earn
er
Transitional Protection (TP) of £720 per learner in 2011/12Total funding of £4500 per learner in 2011/12Lead to a reduction of £180 per learner from their TP in 2012/13This is one quarter of the total TP
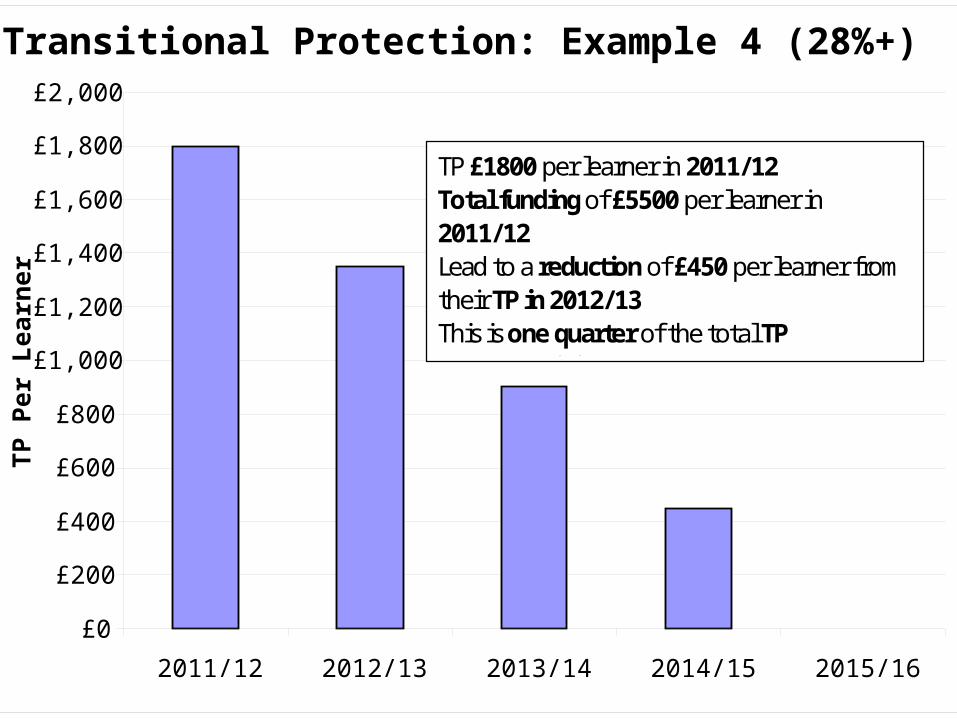
Transitional Protection: Example 4 (28%+)
£0
£200
£400
£600
£800
£1,000
£1,200
£1,400
£1,600
£1,800
£2,000
2011/12 2012/13 2013/14 2014/15 2015/16
TP P
er L
earn
er
TP £1800 per learner in 2011/12 Total funding of £5500 per learner in 2011/12 Lead to a reduction of £450 per learner from their TP in 2012/13 This is one quarter of the total TPTheir remaining TP would then

Next Steps
• January Learner Number Statements
• All key information will be put on the YPLA IM Portal• 11/12 statements are already there• Provider reports, Open Book and more• Useful links to guidance
https://gateway.imservices.org.uk
• Key Contacts – Territorial Teams

Questions
Championing Young People’s Learning


