
Japan Financial Crisis
By: Sander Chau
Winslow Han


Postwar Financial System
• Bank-based system with underdeveloped stock and bond market.
• Stable system – no threat of new entry
• Safe but inefficient system
• Postwar system could not last forever
• Banks grew too large but restricted by many restrictions

4 Basic Causes of Bank Difficulties
• Failure to create prudential regulatory system
• Macroeconomic mismanagement
• Effects of Globalization
• High rate of financial innovation

Prudential Regulatory System
• Deregulation of the system took place without creating a effective system
• Generates competition
• Profit no longer guaranteed

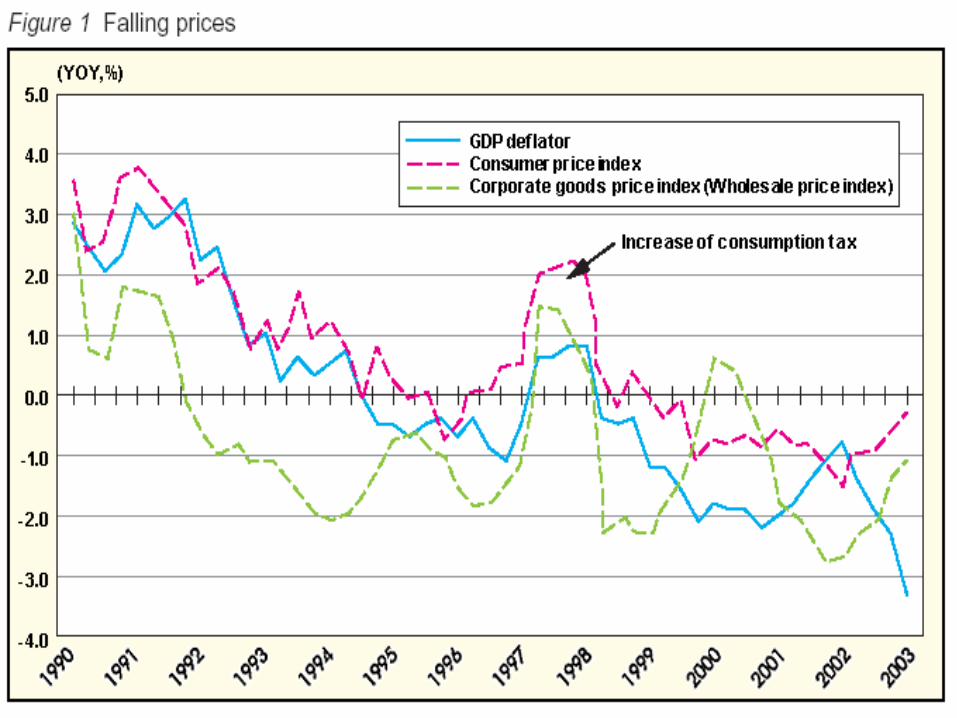
5 Macroeconomic Policy Mistakes
• Interest Rates were at postwar lows
• Not easing monetary and fiscal policies in the early 90’s
• Relying excessively on easy monetary policies in the mid 90’s
• Fiscal Stimulus through supplementary budgets in the mid 90’s, too little too late.
• Wrong optimistic forecast for ‘97

Effects of Globalization
• Economic and financial policies subject to foreign pressures
• World’s largest creditor nation: Japanese financial institutions engaged in foreign lending and portfolio investment
• Flourishing of a free global capital market• Big Bang deregulation creates competition
in Japan home market from foreign financial institutions

Financial Technology Innovation
• Wide range of new financial derivatives
• Mostly American and some European players
• Japanese banks unable to learn
• The most capable Japanese are hired away by foreign firms


Banking Sector Problems
• Mergers and failures have left Japan with 7 major banks
• Low profitability for more than 10 yrs
• Banks depend too heavily on revenue from lending
• Government sponsored financial institutions
• Evergreening

Comparison to US Banks
• Interest Margin of Japanese banks 1.2% compared to 3.3 to 3.5% of assets
• “Other Revenue” 38% revenue from lending operations compared to US 73% of lending revenue

Government Sponsored Institutions
• Japan Post: post office and largest deposit-taking institution in the world
• Heavily subsidized• 9 times the branches of all city banks• Same rate on deposits, explicit government
guarantee, no maintenance fee, lower rate on lending, no prepayment penalties
• Strong government resistance to address this problem and no public recognition of the losses that these government institutions have made with explicit subsidies

Table 1: An Overview of the Japanese Financial System
Number Of Total
Assets
Deposits Outstandin
g
Loans and Discount
Outstanding
Institutions Branches Employess Trillion % of GDP Trillion Trillion
Banks
City Banks (Consolidated) 7 2853 104847 410 81.9 260 238
Others 227 12221 238760 436.4 87.2 289.2 259
Cooperative Financial Institutions 2444 11197 173709 394 78.8 317 154
Non-depository financial institutions
Life Insurance 43 15807 380864 184 36.7 0 47
Other Insurance 59 4869 87501 33 6.6 0 4
Remaining 293 2256 94898 95 19 0 0
Public Financial Institutions
Postal Savings 1 24773 62422 242 48.3 239 0.7
Government Financial Institution 8 311 11250 166 33.2 0 159
Total Financial System 3082 74287 1154251 1960.4 391.7 1105.2 861.7

Bank Problem Example
• 1.1 trillion yen of public funds injected into Asahi and Daiwa Banks
• March 2003: Asahi and Daiwa Banks merge into Resona Bank (5th largest)
• Resona granted another 1.96 trillion yen• September 2003: Resona records loss of 1.76 trillion yen
for period between Mar-Sept 03 (90% capital provided, disappears)
• Regulators principal aim to avoid large bank failures• Little attention to future viability of recapitalized banks• Regulators did not systematically force other banks to
reassess their risk ratings• Gives little incentive for Banks to restructure

Book Value and Adjusted Capital in the Japanese Banking Sector
Mar-89 Mar-91 Mar-93 Mar-95 Mar-97 Mar-99 Mar-01 Mar-03
Market Value of Shares
A97.1 77.7 56.4 52 54.1 47.1 44.5 23.2
Book Value of Shares
B23.2 33.1 34.5 39.8 42.9 42.7 44.3 23.2
Reported Book Value of
Bank Capital C
22.5 30.2 31.8 32.3 28.5 33.7 36.7 24.8
Defered Tax Assets
D0.0 0.0 0.0 0.0 0.0 8.4 7.3 10.6
Estminated Underreserv
ing EN/A N/A N/A N/A 15 4.6 7.6 5.4
Adjusted Capital C+
((A-B)*.05)-D-E
66.8 57 44.9 39.6 20.2 23.4 21.9 8.8
Equity Capital Held by the
Govt0.0 0.0 0.0 0.0 0.0 6.3 7.1 7.3
Nikkei225 Stock Price
Average32839 26292 18591 15140 18008 15887 13000 7873
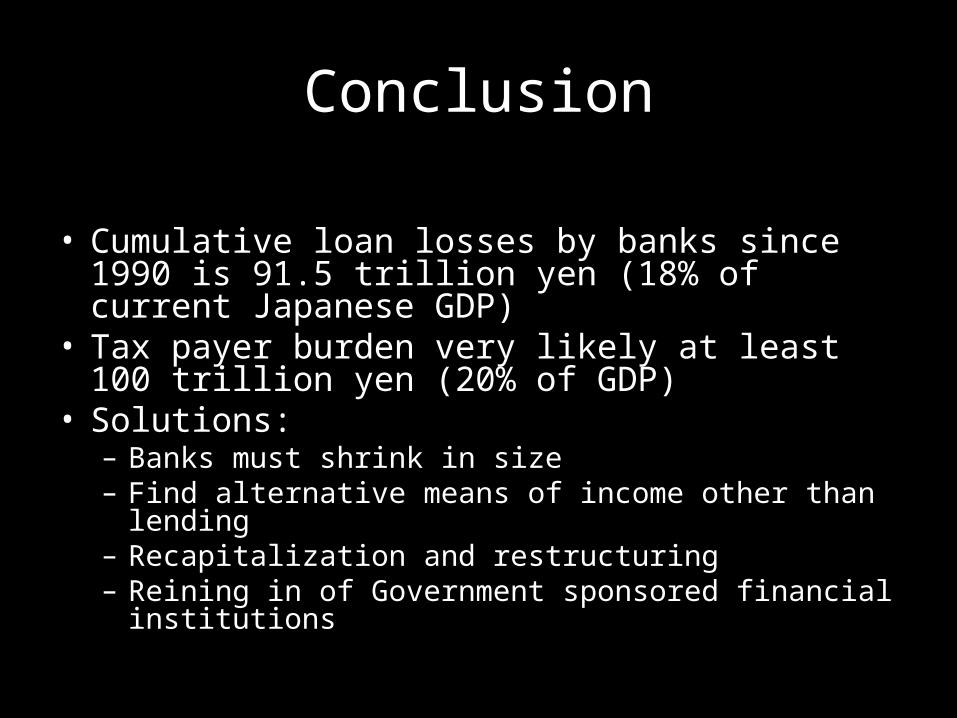
Conclusion
• Cumulative loan losses by banks since 1990 is 91.5 trillion yen (18% of current Japanese GDP)
• Tax payer burden very likely at least 100 trillion yen (20% of GDP)
• Solutions:– Banks must shrink in size– Find alternative means of income other than lending– Recapitalization and restructuring– Reining in of Government sponsored financial
institutions


