Ag 2
Ag 2
See Sheet 2
Ag 2
390000
390000
400000
400000
410000
410000
420000
420000
430000
430000
440000
440000
450000
450000
460000
460000
4870
000
4870
000
4880
000
4880
000
4890
000
4890
000
4900
000
4900
000
4910
000
4910
000
4920
000
4920
000
New York State Dept ofAgriculture and Markets
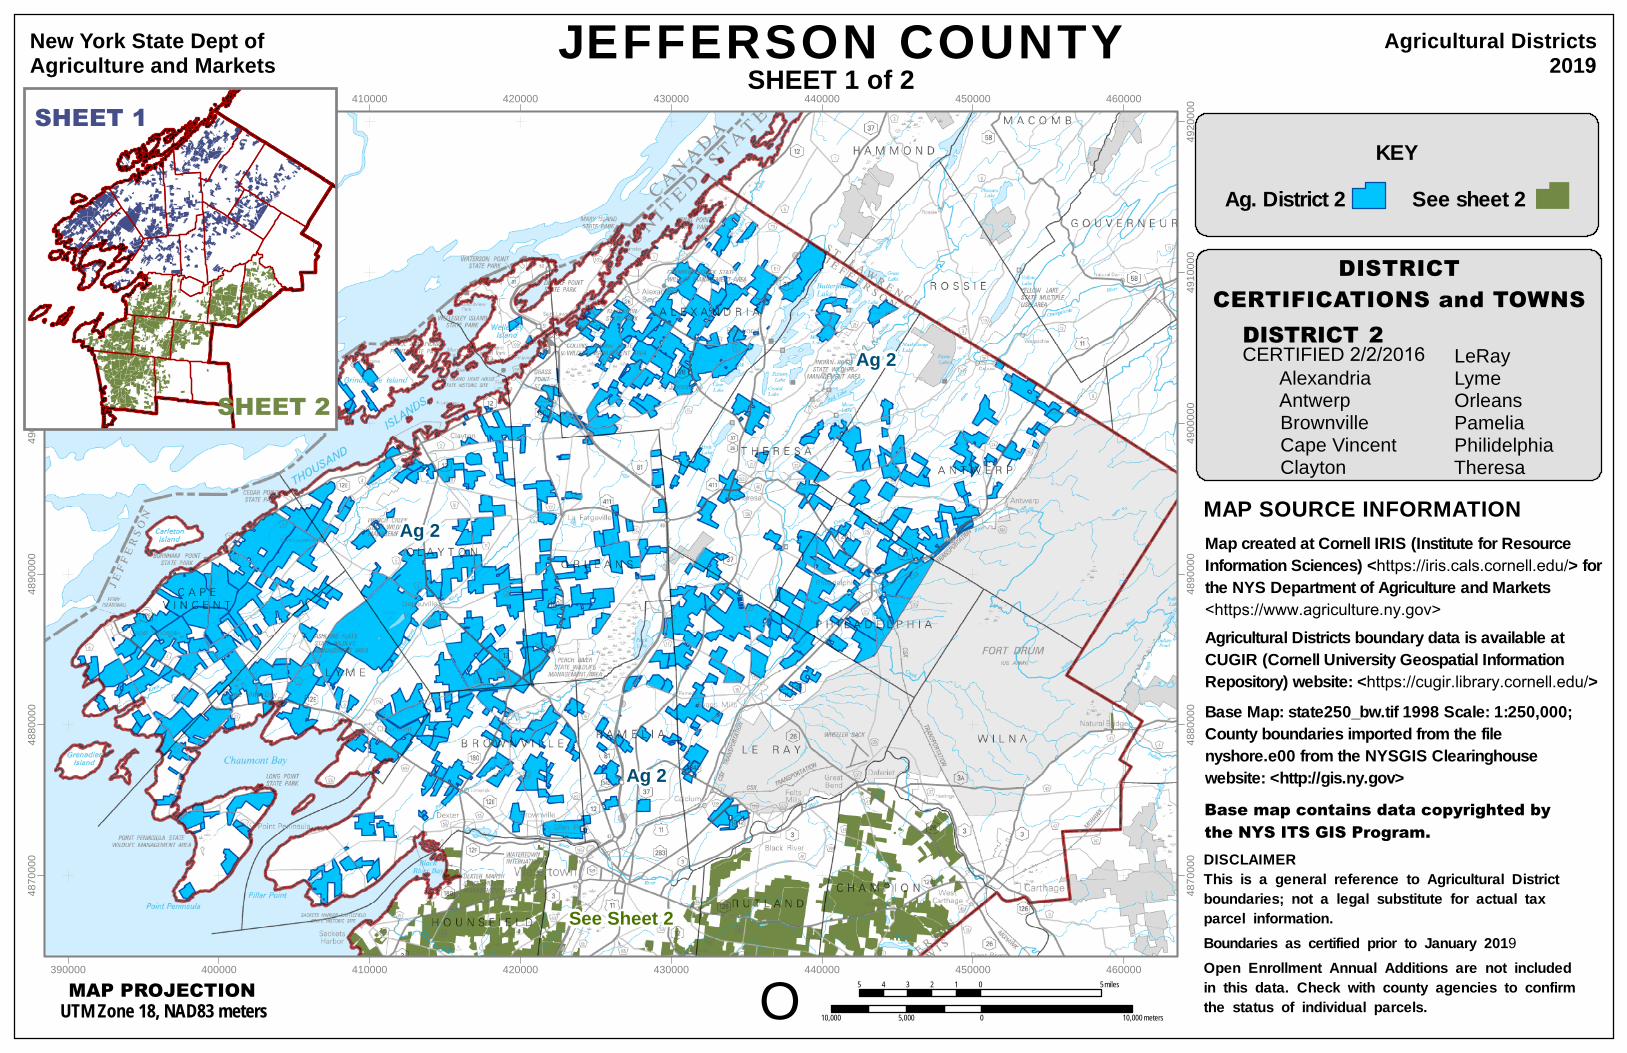
Agricultural Districts2019JEFFERSON COUNTY
O5 0 54 3 2 1 miles
10,000 0 10,0005,000 meters
MAP PROJECTIONUTM Zone 18, NAD83 meters
DISTRICTCERTIFICATIONS and TOWNS
LeRay Lyme Orleans Pamelia Philidelphia Theresa
DISTRICT 2 CERTIFIED 2/2/2016 Alexandria Antwerp Brownville Cape Vincent Clayton
KEYSee sheet 2Ag. District 2
SHEET 1 of 2SHEET 1
SHEET 2
DISCLAIMERThis is a general reference to Agricultural Districtboundaries; not a legal substitute for actual taxparcel information.
Open Enrollment Annual Additions are not includedin this data. Check with county agencies to confirmthe status of individual parcels.
Boundaries as certified prior to January 2019
MAP SOURCE INFORMATIONMap created at Cornell IRIS (Institute for Resource Information Sciences) <https://iris.cals.cornell.edu/> for the NYS Department of Agriculture and Markets<https://www.agriculture.ny.gov>Agricultural Districts boundary data is available at CUGIR (Cornell University Geospatial Information Repository) website: <https://cugir.library.cornell.edu/>Base Map: state250_bw.tif 1998 Scale: 1:250,000;County boundaries imported from the filenyshore.e00 from the NYSGIS Clearinghousewebsite: <http://gis.ny.gov>Base map contains data copyrighted by the NYS ITS GIS Program.

Ag 1
Ag 3
Ag 3
Ag 1
See Sheet 1
390000
390000
400000
400000
410000
410000
420000
420000
430000
430000
440000
440000
450000
450000
460000
460000
4840
000
4840
000
4850
000
4850
000
4860
000
4860
000
4870
000
4870
000
4880
000
4880
000
4890
000
4890
000
New York State Dept ofAgriculture and Markets
Agricultural Districts2019JEFFERSON COUNTY
KEYAg. District 3See sheet 1
Ag. District 1
MAP PROJECTIONUTM Zone 18, NAD83 meters O
5 0 54 3 2 1 miles
10,000 0 10,0005,000 meters
SHEET 2 of 2
SHEET 1
SHEET 2
DISCLAIMERThis is a general reference to Agricultural Districtboundaries; not a legal substitute for actual taxparcel information.
Open Enrollment Annual Additions are not includedin this data. Check with county agencies to confirmthe status of individual parcels.
Boundaries as certified prior to January 2019
DISTRICTCERTIFICATIONS and TOWNSDISTRICT 1
LorraineRodmanRutland
CERTIFIED 4/25/2013AdamsChampionHounsfield
WatertownWilnaWorth
LorraineHounsfieldWatertown
DISTRICT 3 CERTIFIED 2/28/2019AdamsEllisburgHenderson
MAP SOURCE INFORMATIONMap created at Cornell IRIS (Institute for Resource Information Sciences) <http://iris.cals.cornell.edu> for the NYS Department of Agriculture and Markets<https://www.agriculture.ny.gov>Agricultural Districts boundary data is available at CUGIR (Cornell University Geospatial Information Repository) website: <http://cugir.library.cornell.edu>
Base maps contains data copyrighted by the NYS ITS GIS Program.
Base Map: state250_bw.tif 1998 Scale: 1:250,000;County boundaries imported from the filenyshore.e00 from the NYSGIS Clearinghousewebsite: <http://gis.ny.gov>


