
J.P. Morgan Ultimate Services Investor Conference
© 2018 ASGN Incorporated. All rights reserved.
November 12, 2018
Peter Dameris, CEO
Ted Hanson, President

1
Safe Harbor
1
Certain statements made in this news release are “forward-looking statements” within the meaning ofSection 21E of the Securities Exchange Act of 1934, as amended, and involve a high degree of risk anduncertainty. Forward-looking statements include statements regarding the Company's anticipatedfinancial and operating performance.
All statements in this release, other than those setting forth strictly historical information, are forward-looking statements. Forward-looking statements are not guarantees of future performance, and actualresults might differ materially. In particular, the Company makes no assurances that the estimates ofrevenues, gross margin, SG&A, amortization, effective tax rate, net income, diluted shares outstanding,contract backlog, book-to-bill ratio, Adjusted EBITDA, Adjusted Net Income, and related per shareamounts (as applicable) set forth above will be achieved. Factors that could cause or contribute to suchdifferences include actual demand for our services, our ability to attract, train and retain qualified staffingconsultants, our ability to remain competitive in obtaining and retaining clients, the availability ofqualified contract professionals, management of our growth, continued performance and improvement ofour enterprise-wide information systems, our ability to manage our litigation matters, the successfulintegration of our acquired subsidiaries, and other risks detailed from time to time in our reports filedwith the SEC, including our Annual Report on Form 10-K for the year ended December 31, 2017, as filedwith the SEC on March 1, 2018 and our Quarterly Reports on Form 10-Q for the quarters ended March 31,2018 and June 30, 2018, as filed with the SEC on May 10, 2018 and August 9, 2018, respectively. Wespecifically disclaim any intention or duty to update any forward-looking statements contained in thisnews release.
2
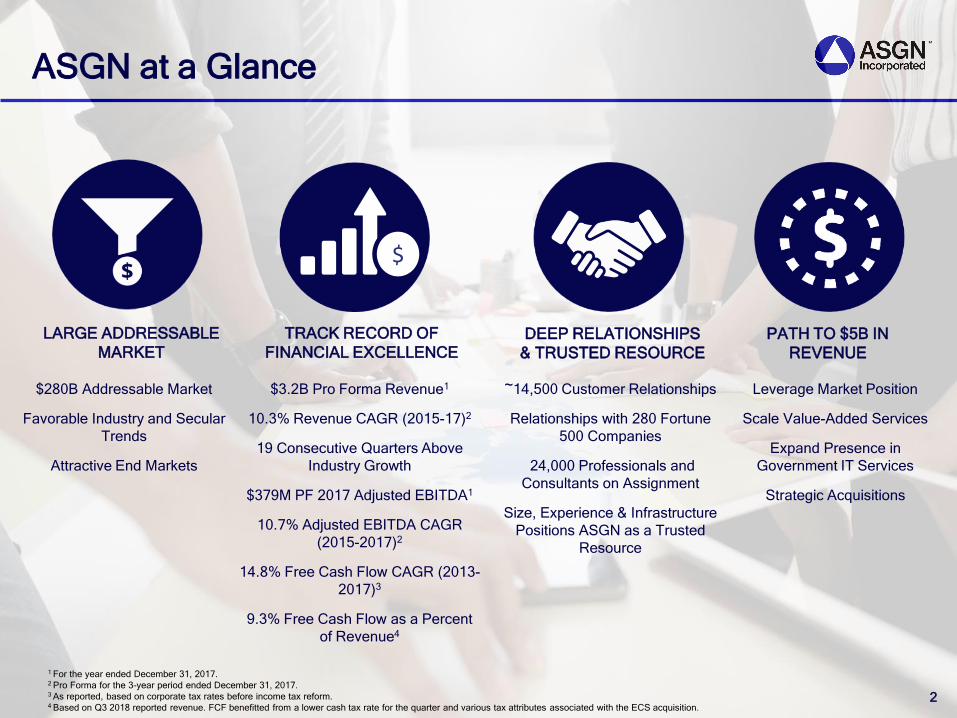
ASGN at a Glance
LARGE ADDRESSABLE
MARKET
$
$280B Addressable Market
Favorable Industry and Secular
Trends
Attractive End Markets
TRACK RECORD OF
FINANCIAL EXCELLENCEDEEP RELATIONSHIPS
& TRUSTED RESOURCE
$3.2B Pro Forma Revenue1
10.3% Revenue CAGR (2015-17)2
19 Consecutive Quarters Above
Industry Growth
$379M PF 2017 Adjusted EBITDA1
10.7% Adjusted EBITDA CAGR
(2015-2017)2
14.8% Free Cash Flow CAGR (2013-
2017)3
9.3% Free Cash Flow as a Percent
of Revenue4
~14,500 Customer Relationships
Relationships with 280 Fortune
500 Companies
24,000 Professionals and
Consultants on Assignment
Size, Experience & Infrastructure
Positions ASGN as a Trusted
Resource
1 For the year ended December 31, 2017.2 Pro Forma for the 3-year period ended December 31, 2017.3 As reported, based on corporate tax rates before income tax reform.4 Based on Q3 2018 reported revenue. FCF benefitted from a lower cash tax rate for the quarter and various tax attributes associated with the ECS acquisition.
PATH TO $5B IN
REVENUE
Leverage Market Position
Scale Value-Added Services
Expand Presence in
Government IT Services
Strategic Acquisitions
3
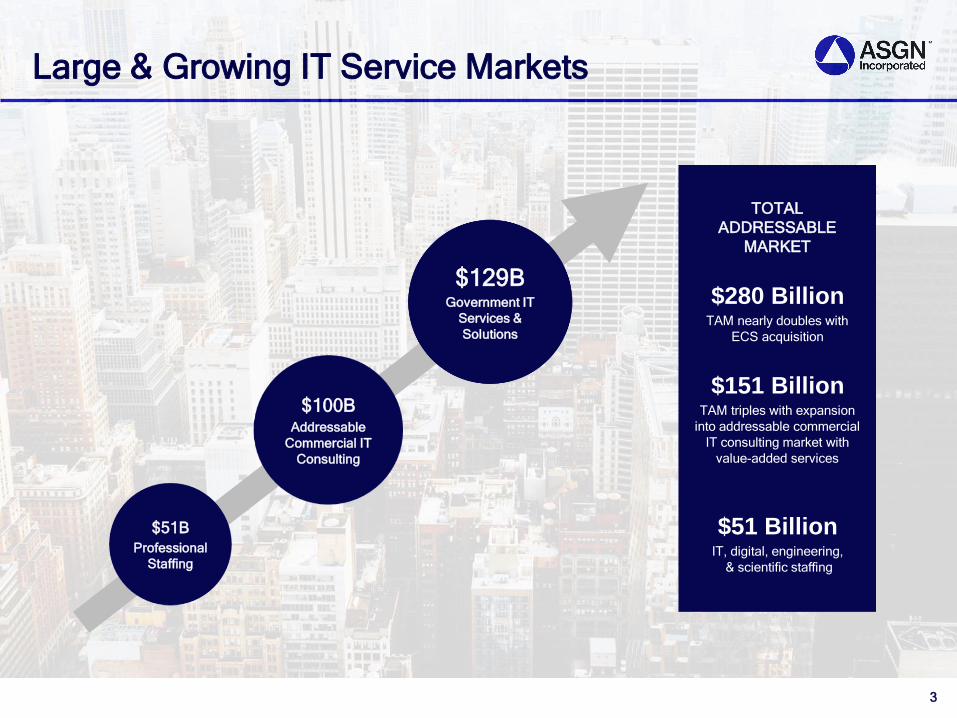
Large & Growing IT Service Markets
TOTAL
ADDRESSABLE
MARKET
$280 BillionTAM nearly doubles with
ECS acquisition
$151 BillionTAM triples with expansion
into addressable commercial
IT consulting market with
value-added services
$51 BillionIT, digital, engineering,
& scientific staffing
$51B
Professional
Staffing
$100BAddressable
Commercial IT
Consulting
$129BGovernment IT
Services &
Solutions
4
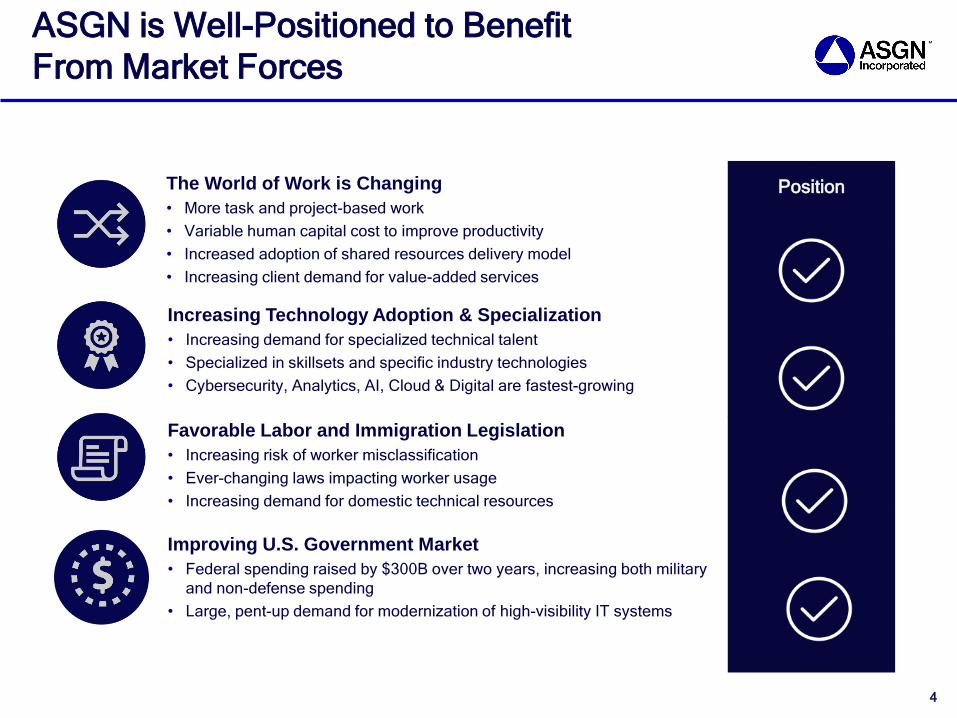
ASGN is Well-Positioned to Benefit
From Market Forces
TOTAL
ADDRESSABLE
MARKET
$151 BillionTAM triples with expansion
into addressable commercial
IT consulting market with
value-added services
$51 BillionIT, digital, engineering,
& scientific staffing
The World of Work is Changing
• More task and project-based work
• Variable human capital cost to improve productivity
• Increased adoption of shared resources delivery model
• Increasing client demand for value-added services
Increasing Technology Adoption & Specialization
• Increasing demand for specialized technical talent
• Specialized in skillsets and specific industry technologies
• Cybersecurity, Analytics, AI, Cloud & Digital are fastest-growing
Favorable Labor and Immigration Legislation
• Increasing risk of worker misclassification
• Ever-changing laws impacting worker usage
• Increasing demand for domestic technical resources
Position
Improving U.S. Government Market
• Federal spending raised by $300B over two years, increasing both military
and non-defense spending
• Large, pent-up demand for modernization of high-visibility IT systems

5
Staff Augmentation is the Original
Shared Resources Model
No risk of worker
misclassification
Constant access to large skilled
labor network
Improved ability to source talent
to meet specific project needs
Flexibility by converting fixed
costs into variable costs
Higher productivity, nearing
100% utilization with contracted
employees; compares to ~70%
productivity with FTE
Greater control, visibility and
quality over project and
deliverables
Less flexibility
Higher fixed costs
Limited to available network
Costs to repurposing employees
Limited to vendor resources
Less control of deliverables
Limited ability to source talent to
meet specific project needs
High cost
Limited ability to source talent to
meet specific project needs
Locked into contract resources
Internal Staff
Offshore Labor
Project Consulting
Outsourcing
Less control over deliverables
Limited ability to source talent to
meet specific project needs
Staff
Augmentation
Higher
Utilization
More
Flexibility
6
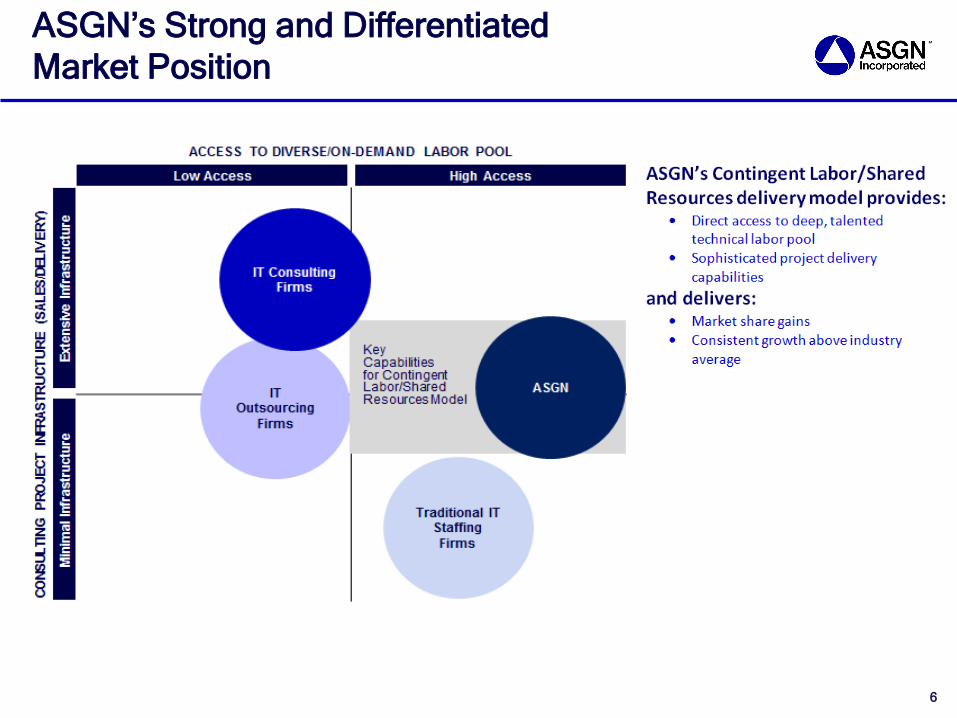
ASGN’s Strong and Differentiated
Market Position

Size and service offerings have allowed ASGN to consistently grow faster than published
industry growth rates.
• Early mover in the creation of the “shared economy” through staff augmentation & shared resources delivery
model
• Well positioned in large and growing end markets
• Expanding value-added services, our consulting services “light deliverable” model
ASGN is Gaining Market Share
19 Consecutive Quarters of Above Industry Revenue Growth
7.0%6.0%
5.0%4.0%
11.4% 11.1%12.0%
7.6%
2014 2015 2016 2017
ASGN VS. IT STAFFING INDUSTRY
IT STAFFING INDUSTRY ASGN
Source: SIA projections, Parthenon, ASGN internal estimates.
Note: 2014 to 2017 data is pro forma for ASGN as if the acquisitions of Creative Circle and CyberCoders occurred at the beginning of 2013. 7

8
Free Cash Flow Allows for Quick Deleveraging
3.7x
3.1x
2.8x2.6x
3.8x
3.0x
2.7x2.5x
3.7x3.5x
3.2x3.0x
2.8x
2.5x
3.7x
3.2x
2.5x
0.0x
0.5x
1.0x
1.5x
2.0x
2.5x
3.0x
3.5x
4.0x
4.5x
1Q07 2Q07 3Q07 3Q12 4Q12 1Q13 2Q15 3Q15 4Q15 1Q16 2Q16 2Q18 3Q18 4Q18 1Q19 2Q19 3Q19 4Q192007 2012 2015 2018
Leverage
Ratio
Decreased
1.1x
Leverage
Ratio
Decreased1.3x
Leverage Ratio
Decreased 1.2x
Projected Leverage
Ratio Decrease 1.2x1
Maintained Strong Credit Rating Throughout Periods of Leveraging & Deleveraging
2.9x
1 Projected leverage ratio decline from 1Q18 through 4Q19.
2.7x

9
Apex Segment Offerings
DESCRIPTION
Provides scalability and flexibility
required to digitally transform business
through IT staffing solutions and value-
added services.
DESCRIPTION
Provides top scientific, engineering,
and clinical research talent at all
career levels for contract, contract-to-
hire and direct-hire opportunities.
DESCRIPTION
Provides curated creative talent vetted
by industry professionals matched to
assignments for clients needing high-
quality talent.
MARKET POSITION
2nd Largest IT Staffing Firm in
U.S.1
MARKET POSITION
3rd Largest Clinical/Scientific Staffing Firm
in U.S.
MARKET POSITION
Largest Creative/Digital Staffing Firm
in U.S.
APEX SYSTEMSInformation Technology
APEX LIFE SCIENCESScientific, Engineering,
& Clinical Research
CREATIVE CIRCLEDigital + Creative
TECHNICAL OFFERINGS
Specialize in 16 unique skill areas in:
Infrastructure
Application Development
Security
PMO
TECHNICAL OFFERINGS
Science
Engineering
Clinical Research
TECHNICAL OFFERINGS
UX, UI
SEO
Design
1 Combined with ASGN Incorporated.

10
Oxford Segment Offerings
MARKET POSITION
6th-largest permanent placement firm
in the U.S.
MARKET POSITION
In top 10 of largest clinical/scientific
staffing firms in Europe
LIFE SCIENCES EUROPE
MARKET POSITION
Leading provider of
in-demand, senior-level consultants
DESCRIPTION
Global network of senior consultants
provides clients on-demand access to IT
and engineering consultants and full
project teams
Information Technology & Engineering
TECHNICAL OFFERINGS
Specialize in services in:
Information Technology
Healthcare Technology
Enterprise Applications
Security & Infrastructure
Data & Analytics
Engineering
Regulatory & Compliance
Software
Hardware
Mechanical
Permanent Placement
DESCRIPTION
Dedicated permanent placement practice
with automated client lead generation and
distribution, and candidate sourcing
supported by global cloud solution
Clinical & Scientific
DESCRIPTION
Clinical and scientific services in
Europe through:
Lab Support
Valesta
LabResource
TECHNICAL OFFERINGS
Specialize in:
Information Technology
Engineering
Finance & Accounting
Healthcare
TECHNICAL OFFERINGS
Specialize in scientific & clinical skills:
Chemists
Clinical research associates
Clinical lab assistants
Engineers
Biologists
Biochemists
Microbiologists

11
ECS Segment Overview
DESCRIPTION
Leading information technology provider helping
solve critical, complex challenges for customers in
the U.S. government and across select commercial
industries
MARKET POSITION
One of the leading, fastest-growing, mid-tier,
government IT contractors
TECHNICAL OFFERINGS
Cloud
Cybersecurity
Software development
IT modernization
Science and engineering
Government IT Services
ADVANCED SCIENCE
& ENGINEERING
Deliver high-performance, high-fidelity radar
cross-section systems, flight-termination
systems and classified solutions
Navy PEO IWS DARPA NOAA
CYBERSECURITY &
INFRASTRUCTURE
Architect/deploy advanced endpoint security-
as-a -service solutions
Provide application and infrastructure support
to worldwide systems
Navy DHSArmy
AGILE SOFTWARE
& CLOUD SOLUTIONS
Develop artificial intelligence to detect, identify,
track and geolocate targets
Develop mission-critical, enterprise-level
solutions
USDI FBI USPS

12
ASGN Catalysts for Growth
Leverage
Market Position
Expand Presence in
Government IT Services
Scale Value-Added
Services
Pursue Strategic
Acquisitions
• ~$100B of addressable market1
• Leverages ASGN’s vast contingent labor
pool rather than full-time bench resources
• Value-added services have grown and will
continue to grow faster than staffing1
• Entered $129B government services market
through ECS acquisition
• Adds to IT services capability as prime
government contractor
• Acquirer of choice
• Leverage track record of successful
integrations
• Target $500 - $700 million of acquired
revenue through 2022
Sources:1 Gartner; Technavio; Comptia; SIA Parthenon-EY CIO Survey.
• ASGN’s model delivers market
share gains and consistent above
industry average growth

13
ASGN’s Path to $5 Billion
1
3
2
4
2017 Pro Forma
Revenue
$3.2B
$4.3B –
$4.5B
2022 Targeted
Organic Revenue
$5.0B
2022 Targeted
Total Revenue
Leverage
Market Position
Scale Value-
Added Services
Expand Presence in
Government IT Services
Strategic Acquisitions

14
Range of Value-Added Services
Strategy
Architecture
Design
Systems Deployment
(incl. upgrades)
Service Centers
Technical Staffing
ECS Offerings
Apex & Oxford
Segment Offerings

1992
On Assignment Initial
Public Offering
2007
Entrance Into IT Market
2012
Comprehensive IT Staffing & Services Provider
2015
Entrance Into Digital/Creative Market
2004
Comprehensive Scientific Staffing Provider
• Peter Dameris Appointed CEO
• Implemented Revitalization Plan
15
Track record of successful acquisitions
Scientific Staffing
Expanded Professional / IT
Services Focus
2013
Expanded Permanent IT Capabilities
Further Expansion of
Professional IT Services &
Digital Capabilities
1985
On Assignment Founded
2018
Entrance Into
Government IT
Services & Solutions
15
Proven Track Record of Acquisitions

Financial Review

$264 $285
$311 $341
$45 $56
$67 $69
2015 2016 2017 TTM
Adjusted EBITDA & Margin
ASGN ECS
$309$341
$379$410USD in millionis
$727 $795
$850 $914
$100 $104
$109 $112
2015 2016 2017 TTM
Gross Profit & Margin
ASGN ECS
USD in millions
$827$899
$960 $1,026
31.3% 30.5% 29.9% 29.7%
$2,179 $2,440 $2,626 $2,830 $461 $507
$586 $621
2015 2016 2017 TTM
Revenues
ASGN ECS
$2,640$2,947
$3,212 $3,451USD in millionis
Above Industry Revenue Growth and
Stable Margins
11.7% 11.8%11.6% 11.9%
Results are presented on a pro form basis, which assumes the acquisition of ECS occurred at the beginning of 2015.TTM means trailing twelve months (as of 9/30/18).
17
37.4% 37.9%39.5% 39.9%
2015 2016 2017 TTM
Conversion of GP into Adj. EBITDA

18
Summary Comparative Financial Results
1 Pro forma is presented on the basis that assumes the acquisition of ECS (and of Info Reliance by ECS) occurred at the beginning of the periods presented,
but does not include the acquisition-related expenses or costs of amending the credit facility related to the acquisitions.2 Includes depreciation related to an ECS project that is included in cost of services ($2.7 million in Q3 2017 and $2.6 million in Q3 2018). 3 Does not include the "Cash Tax Savings on Indefinite-lived intangible Assets." These savings total $6.8 million each quarter, or $0.13 per
diluted share, and represent the economic value of the tax deduction that we receive from the amortization of goodwill and trademarks.
($'s in millions)
Pro Forma1
2018 2017 2017
Revenues 906.4$ 667.0$ 820.2$
Y-Y Change 35.9%
Gross Profit2 270.2 218.3 246.2
SG&A Expenses:
Cash SG&A 177.3 149.2 165.2
Depreciation 7.2 6.4 7.1
Stock-Based Compensation 8.6 6.4 7.8
Acquisition-Related Expenses 1.6 1.5 1.5
194.8 163.5 181.7
Amortization 18.5 8.2 19.2
Interest Expense 14.6 7.1 15.6
Net Income 49.2$ 34.9$ 30.2$
EPS 0.93$ 0.66$ 0.57$
Adjusted EBITDA2
112.9$ 83.4$ 100.2$
Adjusted Net Income3 68.7$ 44.1$ 50.0$
Adjusted EPS3 1.30$ 0.83$ 0.94$
Margins:
Gross 29.8% 32.7% 30.0%
Adjusted EBITDA 12.4% 12.5% 12.2%
SG&A as a % of Revenues 21.5% 24.5% 22.1%
As Reported
3 Months Ended September 30,

19
Selected Cash Flow and Balance Sheet Data
1 Free Cash Flow (a non-GAAP measure) is defined as cash provided by operating activities less capital expenditures.
($'s in millions) Three Months Ended September 30, Twelve Months Ended,
Cash Flows Data: 2018 2017 % Chg 9/30/18 12/31/17 % Chg
Adjusted EBITDA 112.9$ 83.4$ 35.3% 377.2$ 311.4$ 21.1%
Cash Flows Before Changes In Operating
Assets and Liabilities92.5 62.2 48.7% 310.5 256.8 20.9%
Changes in Operating Assets and Liabilities (0.5) (7.6) -94.0% (28.7) (60.3) -52.4%
Cash Flows from Operating Activities 92.1 54.6 68.7% 281.8 196.4 43.5%
Capital Expenditures 7.5 4.8 55.3% 28.3 24.3 16.5%
Free Cash Flow1
84.6 49.8 70.0% 253.5 172.2 47.2%
Free Cash Flow as a Percent of:
Revenues 9.3% 7.5% 25.1% 8.0% 6.6% 22.8%
Adjusted EBITDA 75.0% 59.7% 25.6% 67.2% 55.3% 21.6%
Debt Repayment 88.0 5.5 1500.0% 266.5 68.0 291.9%
Cash Paid to Repurchase Shares - 46.8 1.1 58.1 -98.1%
Balance Sheet Data: 9/30/18 12/31/17
Cash and Cash Equivalents 40.9$ 36.7$
Working Capital 355.2 332.8
Long-term Debt 1,154.2 575.2
Leverage Ratio (debt to trailing 12-months EBITDA) 2.89x 1.89x
Stockholders' Equity 1,129.8 991.4

20
Financial Estimates for Q4 2018
1 Includes $2.6 million in depreciation related to an ECS project that is included in costs of services.2 These estimates do not include acquisition, integration and strategic planning expenses.3 Adjusted Net Income, a non-GAAP financial measure, is defined as net income adjusted for, (i) acquisition, integration and strategic planning expenses and (ii) amortization of identifiable intangible
assets. Does not include the “Cash Tax Savings” on Indefinite-lived Assets.” These savings total $6.8 million per quarter, or $0.13 per diluted share, and represent the economic value of the tax deduction from the amortization of goodwill and trademarks.
(In millions, except per share amounts)
Low High
Revenues $905.0 $915.0
Pro forma year-over-year growth rate 8.8% 10.0%
Gross Margin1
29.5% 30.0%
SG&A Expenses2
$178.7 $181.2
Amortization of Intangible Assets $18.6 $22.55
Net Income:
GAAP $40.9 $44.6
Adjusted3
$59.2 $62.9
EPS (Diluted):
GAAP $0.77 $0.84
Adjusted3
$1.11 $1.18
Diluted Shares 53.3
Adjusted EBITDA $107.0 $112.0
Adjusted EBITDA Margin 11.8% 12.2%

21
Adjusted Net Income Estimates for Q4 2018
1 These estimates do not include acquisition, integration, or strategic planning expenses.2 These estimates do not include excess tax benefits related to stock-based compensation.3 Does not include the “Cash Tax Savings on Indefinite-lived Intangible Assets.” These savings total $6.8 million per quarter ($0.13 per diluted share) and represent the economic value of the tax
deduction that we receive from the amortization of goodwill and trademarks.
(In millions, except per share amounts)
Low High
Net Income - GAAP Basis1,2
40.9$ 44.6$
Add-backs:
Amortization of intangible assets 18.6 18.6
Income taxes on amortization for financial reporting purposes
not deductible for income tax purposes (0.3) (0.3)
Net Income - As Adjusted3
59.2$ 62.9$
Earnings Per Share (Diluted):
GAAP Basis 0.77$ 0.84$
As Adjusted3
1.11$ 1.18$
22
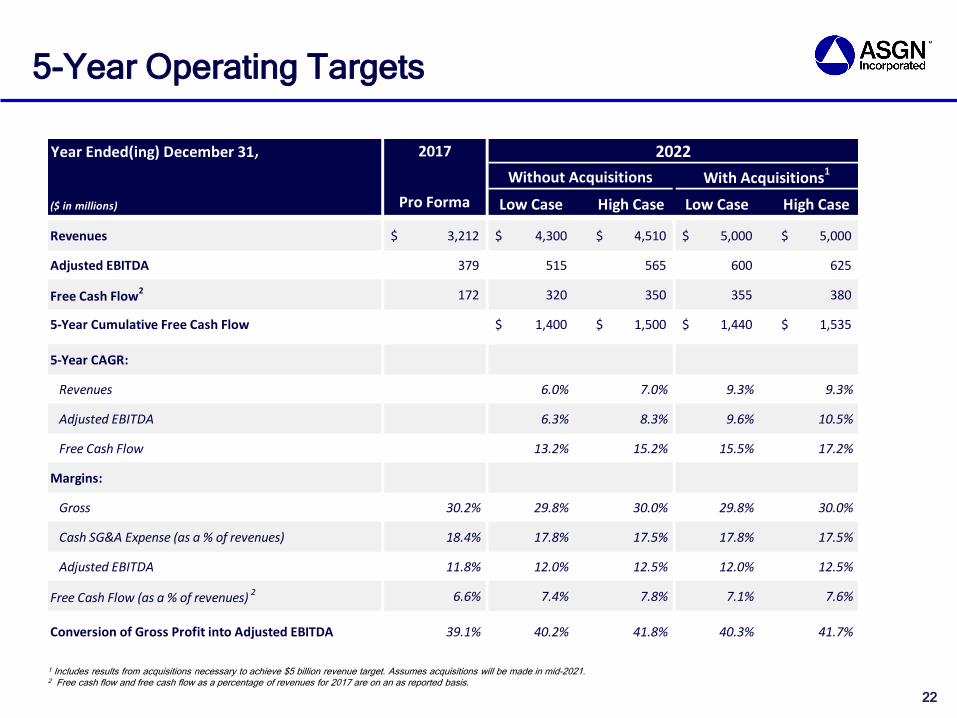
5-Year Operating Targets
Year Ended(ing) December 31 2017 2022
Without Acquisitions
($ in millions) Pro Forma Low Case High Case Low Case High Case
Revenues 3,212$ 4,300$ 4,510$ 5,000$ 5,000$
Adjusted EBITDA 379 515 565 600 625
Free Cash Flow2 172 320 350 355 380
5-Year Cumulative Free Cash Flow 1,400$ 1,500$ 1,440$ 1,535$
5-Year CAGR:
Revenues 6.0% 7.0% 9.3% 9.3%
Adjusted EBITDA 6.3% 8.3% 9.6% 10.5%
Free Cash Flow 13.2% 15.2% 15.5% 17.2%
Margins:
Gross 30.2% 29.8% 30.0% 29.8% 30.0%
Cash SG&A Expense (as a % of revenues) 18.4% 17.8% 17.5% 17.8% 17.5%
Adjusted EBITDA 11.8% 12.0% 12.5% 12.0% 12.5%
Free Cash Flow (as a % of revenues) 2 6.6% 7.4% 7.8% 7.1% 7.6%
Conversion of Gross Profit into Adjusted EBITDA 39.1% 40.2% 41.8% 40.3% 41.7%
With Acquisitions1
1 Includes results from acquisitions necessary to achieve $5 billion revenue target. Assumes acquisitions will be made in mid-2021.2 Free cash flow and free cash flow as a percentage of revenues for 2017 are on an as reported basis.
,

23
Key Assumptions Underlying 5-Year
Financial Targets
Assumes continuation of current growth rates
• IT staffing industry estimated to grow 4 percent rate in 2018
• Government services estimated to grow 2.9 percent rate in 2018
Operating Assumptions (before any contribution from acquisitions)
• Annual revenue growth of 6 to 7 percent (which is 2 to 3 percentage points above the estimated IT industry staffing space)
• Maintain gross margin at current levels
• Reduce cash SG&A margin by 60 to 80 basis points related to improved operating leverage
• Estimated amortization of intangible assets (based on preliminary allocation of ECS purchase price)
• Assumes approximately 125 basis point increase in LIBOR over the 5-year period
• Effective tax rate of 27 percent and an estimated cash tax rate of 19 percent
• Estimated cumulative free cash flow generation of $1.4 billion - $1.5 billion
• Assumes all excess free cash flow generated from current operations will be used to pay down debt
⎼ Expected to deleverage to 2.5x by the end of 2019
⎼ All outstanding debt will be repaid by 2022
• Assumes no stock repurchases
Acquisition Assumptions
• Acquire businesses generating $500 million to $700 million in revenues by 2022 to achieve $5 billion revenue target
• Aggressively pursue once leverage is at or below 2.5x, which is expected to occur by the end of 2019
• Include acquisitions necessary for ECS to achieve $1 billion revenue target on or before 2021
• Financial and operating profile of acquisitions expected to be similar to our existing business
• Financial model assumes all acquisitions will occur mid-2021 and does not include acquisition and financing-related expenses
• Acquisitions are expected to be accretive to consolidated free cash flow and Adjusted Net Income

($ in millions)
Year 1 Projection Year 1 Progress Relative to 5 Year Targets
Pro Forma 2018F1
Low Case High Case
Revenues (before acquisitions) 4,300$ 4,510$ 3,529$
Acquired Revenues 700 490 -
Total Revenues 5,000 5,000 3,529
Adjusted EBITDA 600 625 420
Free Cash Flow2
355 380 269
5-Year Cumulative Free Cash Flow 1,440 1,535 N/A
5-Year CAGR (Y-Y Change 2018):
Revenues (before acquisitions) 6.0% 7.0% 9.8%
Revenues (including Acquisitions) 9.3% 9.3% 9.8%
Adjusted EBITDA 9.6% 10.5% 11.1%
Free Cash Flow 15.5% 17.2% N/A
Margins:
Gross 29.8% 30.0% 29.8%
Cash SG&A Expense (as a % of revenues) 17.8% 17.5% 17.8%
Adjusted EBITDA 12.0% 12.5% 11.9%
Free Cash Flow (as a % of revenues)2
7.1% 7.6% 7.6%
5-Year Targets
Year Ending 12/31/22
2018
1 Projection for full year 2018 on a pro forma basis, which assumes ECS was acquired at the beginning of 2017.2 Estimate for 2018 assumes Q4 free cash flow will be 7.6 percent of revenues.
• Projected 2018 Pro Forma Revenue Growth expected to exceed 5 Year Targeted Growth Rates
• Free Cash Flow as a percentage of revenues is projected to be 7.6%, which is at the high end of the 5 Year Target range
• Margins are in-line with 5 Year Targets; 5 Year Targets assumed operating leverage in the outer years and greater economies of scale
24
2018 Projection vs. 5-Year Plan

25
ASGN Competitive Differentiators
& Value Drivers
Expand value-added services and increased
adoption of delivery model
Continueabove-industry growth
Maintaingross margins while growing at
above-industry rates
Improve operating leverage through
higher economies of scale
Generatestrong free cash flow as a result
of above-industry growth rates
and improved operating
leverage
Createhigher stockholder value
through a combination of
strategic acquisitions, stock
repurchases and deleveraging
Acquirebusinesses that enhance our value-added
service offerings and delivery model while
being immediately accretive to free cash
flow and Adjusted Net Income

© 2018 ASGN Incorporated. All rights reserved.


