

Table of
Contents
Key Statistics for June
Sales 2017 Residential Sales Stats Year-to-Year Total Sales by Map Area Median 2017 Median Sales Stats Year-to-Year Median Sales by Map Area Listings 2017 Active Listings by Map Area 2017 Total Active Listings vs. Total Sales Year-to-Year Active Listings by Map Area Inventory 2017 Months of Inventory by Map Area Year-to-Year Months of Inventory
Summary
About Hady Chahine Contact Information
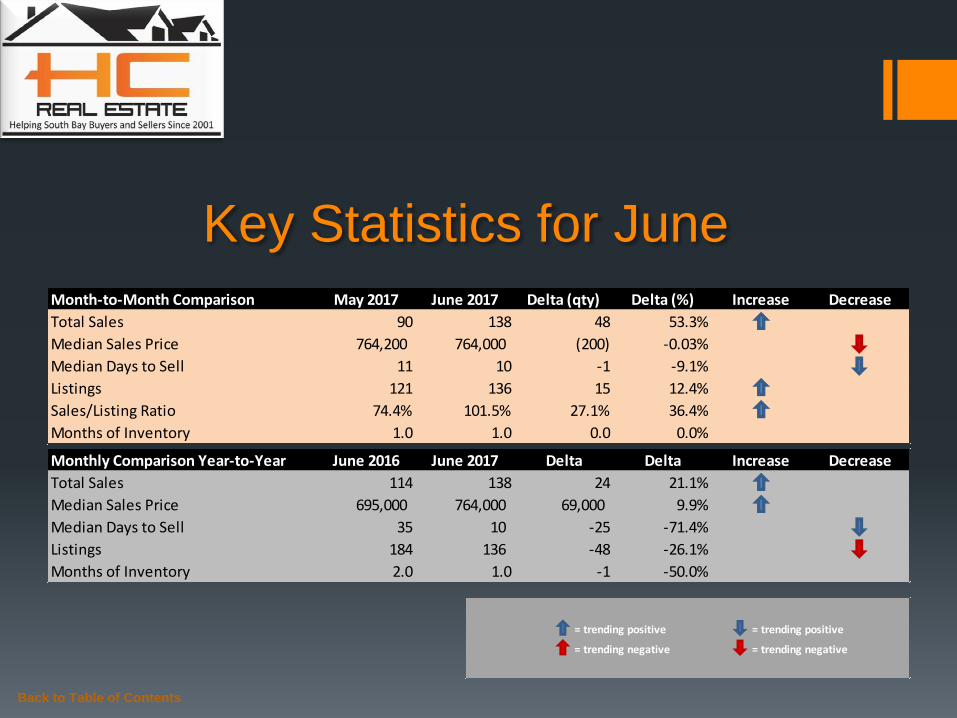
Key Statistics for June
Back to Table of Contents
= trending positive = trending positive
= trending negative = trending negative
Month-to-Month Comparison May 2017 June 2017 Delta (qty) Delta (%) Increase Decrease
Total Sales 90 138 48 53.3%
Median Sales Price 764,200 764,000 (200) -0.03%
Median Days to Sell 11 10 -1 -9.1%
Listings 121 136 15 12.4%
Sales/Listing Ratio 74.4% 101.5% 27.1% 36.4%
Months of Inventory 1.0 1.0 0.0 0.0%
Monthly Comparison Year-to-Year June 2016 June 2017 Delta Delta Increase Decrease
Total Sales 114 138 24 21.1%
Median Sales Price 695,000 764,000 69,000 9.9%
Median Days to Sell 35 10 -25 -71.4%
Listings 184 136 -48 -26.1%
Months of Inventory 2.0 1.0 -1 -50.0%

Back to Table of Contents
Total Sales Month-to-Month by Map Area Apr May Jun
Central Torrance 11 18 15
South East Torrance - West 4 7 17
Hollywood Riviera 8 7 18
South Torrance 10 9 13
Southwood 6 5 10
West Torrance 8 11 6
N Torrance - West 20 9 20
N Torrance - East 3 6 6
Old Torrance 9 12 18
South East Torrance - East 1 6 15
Total Sales 80 90 138
-
20
40
60
80
100
120
140
Apr May Jun
2017 Total Sales Month-to-Month by Map Area
Central Torrance
South East Torrance - West
Hollywood Riviera
South Torrance
Southwood
West Torrance
N Torrance - West
N Torrance - East
Old Torrance
South East Torrance - East
Total Sales

Back to Table of Contents
Total Sales Year-to-Year by Map Area 2015 2016 2017
Central Torrance 20 21 15
South East Torrance - West 7 6 17
Hollywood Riviera 14 12 18
South Torrance 7 10 13
Southwood 4 8 10
West Torrance 7 10 6
N Torrance - West 10 14 20
N Torrance - East 11 8 6
Old Torrance 18 13 18
South East Torrance - East 7 12 15
Total Sales 105 114 138
-
20
40
60
80
100
120
140
2015 2016 2017
Total Sales Year-to-Year by Map Area: June
Central Torrance
South East Torrance - West
Hollywood Riviera
South Torrance
Southwood
West Torrance
N Torrance - West
N Torrance - East
Old Torrance
South East Torrance - East
Total Sales

Back to Table of Contents
Median Sales Price Month-to-Month by Map Area Apr May Jun
Central Torrance 740,000 712,500 608,000
South East Torrance - West 612,500 840,000 470,000
Hollywood Riviera 1,457,500 1,405,000 1,396,500
South Torrance 890,500 890,000 995,000
Southwood 851,000 800,000 968,000
West Torrance 845,000 1,125,000 981,500
N Torrance - West 648,000 690,000 665,000
N Torrance - East 591,000 706,000 658,000
Old Torrance 615,000 640,000 650,000
South East Torrance - East 815,000 774,500 785,000
Market Median Sales Price 740,000 764,200 764,000
-
200,000
400,000
600,000
800,000
1,000,000
1,200,000
1,400,000
1,600,000
Apr May Jun
2017 Median Sales Price Month-to-Month by Map Area
Central Torrance
South East Torrance - West
Hollywood Riviera
South Torrance
Southwood
West Torrance
N Torrance - West
N Torrance - East
Old Torrance
South East Torrance - East
Market Median Sales Price

Back to Table of Contents
Median Sales Price Year-to-Year by Map Area 2015 2016 2017
Central Torrance 578,140 605,000 608,000
South East Torrance - West 410,000 367,450 470,000
Hollywood Riviera 1,082,500 1,177,000 1,396,500
South Torrance 740,000 856,500 995,000
Southwood 783,000 687,500 968,000
West Torrance 805,000 865,500 981,500
N Torrance - West 577,500 603,000 665,000
N Torrance - East 575,000 542,500 658,000
Old Torrance 589,500 595,000 650,000
South East Torrance - East 665,000 742,500 785,000
Market Median Sales Price 625,000 695,000 764,000
-
200,000
400,000
600,000
800,000
1,000,000
1,200,000
1,400,000
2015 2016 2017
Median Sales Price Year-to-Year by Map Area: June
Central Torrance
South East Torrance - West
Hollywood Riviera
South Torrance
Southwood
West Torrance
N Torrance - West
N Torrance - East
Old Torrance
South East Torrance - East
Market Median Sales Price

Back to Table of Contents
Active Listings vs. Total Sales by Map Area Jan Feb Mar Apr May Jun Jul Aug Sep Oct Nov Dec
Central Torrance 20 9 12 15 14 15
South East Torrance - West 5 8 15 16 9 12
Hollywood Riviera 20 13 18 21 22 22
South Torrance 6 8 13 6 11 15
Southwood 6 10 6 5 6 6
West Torrance 16 9 8 9 6 9
N Torrance - West 16 9 15 17 18 18
N Torrance - East 6 3 2 5 3 5
Old Torrance 13 12 18 21 21 23
South East Torrance - East 6 6 7 14 11 11
Total Active Listings 114 87 114 129 121 136
-
5
10
15
20
25
Jan Feb Mar Apr May Jun Jul Aug Sep Oct Nov Dec
2017 Active Listings by Map Area
Central Torrance
South East Torrance - West
Hollywood Riviera
South Torrance
Southwood
West Torrance
N Torrance - West
N Torrance - East
Old Torrance
South East Torrance - East

Back to Table of Contents
Active Listings vs. Total Sales by Map Area Jan Feb Mar Apr May Jun Jul Aug Sep Oct Nov Dec
Central Torrance 20 9 12 15 14 15
South East Torrance - West 5 8 15 16 9 12
Hollywood Riviera 20 13 18 21 22 22
South Torrance 6 8 13 6 11 15
Southwood 6 10 6 5 6 6
West Torrance 16 9 8 9 6 9
N Torrance - West 16 9 15 17 18 18
N Torrance - East 6 3 2 5 3 5
Old Torrance 13 12 18 21 21 23
South East Torrance - East 6 6 7 14 11 11
Total Active Listings 114 87 114 129 121 136
Total Sales 56 58 78 80 90 138
Sales/Listings Ratio 49.1% 66.7% 68.4% 62.0% 74.4% 101.5%
-
20
40
60
80
100
120
140
Jan Feb Mar Apr May Jun Jul Aug Sep Oct Nov Dec
2017 Total Active Listings vs. Total Sales
Total Active Listings Total Sales

Back to Table of Contents
Active Listings Year-to-Year by Map Area 2015 2016 2017
Central Torrance 23 17 15
South East Torrance - West 16 20 12
Hollywood Riviera 22 25 22
South Torrance 16 21 15
Southwood 7 5 6
West Torrance 13 18 9
N Torrance - West 25 26 18
N Torrance - East 15 8 5
Old Torrance 18 25 23
South East Torrance - East 14 19 11
Total Active Listings 169 184 136
-
20
40
60
80
100
120
140
160
180
200
2015 2016 2017
Active Listings Year-to-Year by Map Area: June
Central Torrance
South East Torrance - West
Hollywood Riviera
South Torrance
Southwood
West Torrance
N Torrance - West
N Torrance - East
Old Torrance
South East Torrance - East
Total Active Listings
Back to Table of Contents
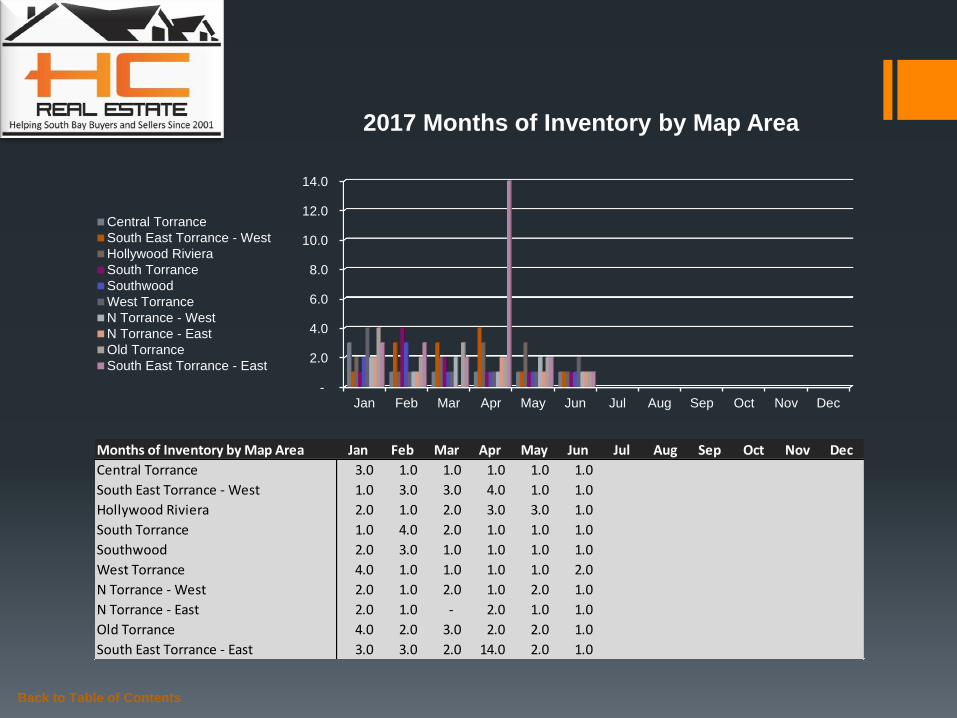
Months of Inventory by Map Area Jan Feb Mar Apr May Jun Jul Aug Sep Oct Nov Dec
Central Torrance 3.0 1.0 1.0 1.0 1.0 1.0
South East Torrance - West 1.0 3.0 3.0 4.0 1.0 1.0
Hollywood Riviera 2.0 1.0 2.0 3.0 3.0 1.0
South Torrance 1.0 4.0 2.0 1.0 1.0 1.0
Southwood 2.0 3.0 1.0 1.0 1.0 1.0
West Torrance 4.0 1.0 1.0 1.0 1.0 2.0
N Torrance - West 2.0 1.0 2.0 1.0 2.0 1.0
N Torrance - East 2.0 1.0 - 2.0 1.0 1.0
Old Torrance 4.0 2.0 3.0 2.0 2.0 1.0
South East Torrance - East 3.0 3.0 2.0 14.0 2.0 1.0
-
2.0
4.0
6.0
8.0
10.0
12.0
14.0
Jan Feb Mar Apr May Jun Jul Aug Sep Oct Nov Dec
2017 Months of Inventory by Map Area
Central Torrance
South East Torrance - West
Hollywood Riviera
South Torrance
Southwood
West Torrance
N Torrance - West
N Torrance - East
Old Torrance
South East Torrance - East

Back to Table of Contents
Months of Inventory Year-to-Year Jan Feb Mar Apr May Jun Jul Aug Sep Oct Nov Dec
2015 4.0 3.0 2.0 2.0 2.0 2.0 2.0 2.0 3.0 3.0 3.0 1.0
2016 3.0 3.0 2.0 2.0 2.0 2.0 2.0 1.0 2.0 2.0 1.0 1.0
2017 2.0 2.0 1.0 2.0 1.0 1.0
-
0.5
1.0
1.5
2.0
2.5
3.0
3.5
4.0
Jan Feb Mar Apr May Jun Jul Aug Sep Oct Nov Dec
Months of Inventory Year-to-Year
2015
2016
2017

Summary June was a busy, busy month for Torrance residential real estate as closed escrows spiked 53.3%, the sales-listing ratio climbed 36.4%, net listings increased 12.4%, and the median days to sell metric dropped 9.1%. During this time the median sales price data point fell by $200 or 0.03%. Year-over-year months of inventory metric decreased 50% from June 2016 to 2017.
In May, C.A.R. reported “California’s housing market rebounded in May as existing home sales and median home price recorded strong gains on both a monthly and annual basis, a trend in every major region of the state.” http://www.car.org/aboutus/mediacenter/newsreleases/2017releases/may2017sales?view=Standard
For listing or buying questions or representation, or further information on market trending behavior, please feel free to contact me anytime. I look forward to hearing from you!
Back to Table of Contents
Monthly Comparison Year-to-Year June 2016 June 2017 Delta Delta Increase Decrease
Total Sales 114 138 24 21.1%
Median Sales Price 695,000 764,000 69,000 9.9%
Median Days to Sell 35 10 -25 -71.4%
Listings 184 136 -48 -26.1%
Months of Inventory 2.0 1.0 -1 -50.0%
Month-to-Month Comparison May 2017 June 2017 Delta (qty) Delta (%) Increase Decrease
Total Sales 90 138 48 53.3%
Median Sales Price 764,200 764,000 (200) -0.03%
Median Days to Sell 11 10 -1 -9.1%
Listings 121 136 15 12.4%
Sales/Listing Ratio 74.4% 101.5% 27.1% 36.4%
Months of Inventory 1.0 1.0 0.0 0.0%

Back to Table of Contents
Serving South Bay Home Buyers and Sellers Since 2001
RE/MAX Top 4 Team in California – 2012
RE/MAX 100% Club - 2011
Shorewood Realtors Top 5% in Overall Sales 2001-2006, 2008-2010

The information being provided by CARETS (CLAW, CRISNet MLS, DAMLS, CRMLS, i-Tech MLS, and/or VCRDS) is for the visitor’s personal, non-commercial use and may not be used for
any purpose other than to identify prospective properties visitor may be interested in purchasing. Any information relating to a property referenced on this web site comes from the Internet
Data Exchange (IDX) program of CARETS. This web site may reference real estate listing(s) held by a brokerage firm other than the broker and/or agent who owns this web site. The accuracy
of all information, regardless of source, including but not limited to square footages and lot sizes, is deemed reliable but not guaranteed and should be personally verified through personal
inspection by and/or with the appropriate professionals.
Back to Table of Contents
Listings MLS BLOG Website
Hady Chahine
• 310-404-5361


