
KEPLER CHEUVREUX
GERMAN CORPORATE CONFERENCE 20.01.2014 l Frankfurt

Agenda
1 Current trading
2 Outdoor business
Germany
Digital OoH
Turkey, Poland and other markets
3 Online business
Buy & build strategy: current status
Video & premium sales business
Most recent acquisitions
4 Q4 2013 guidance statement
< 2 >
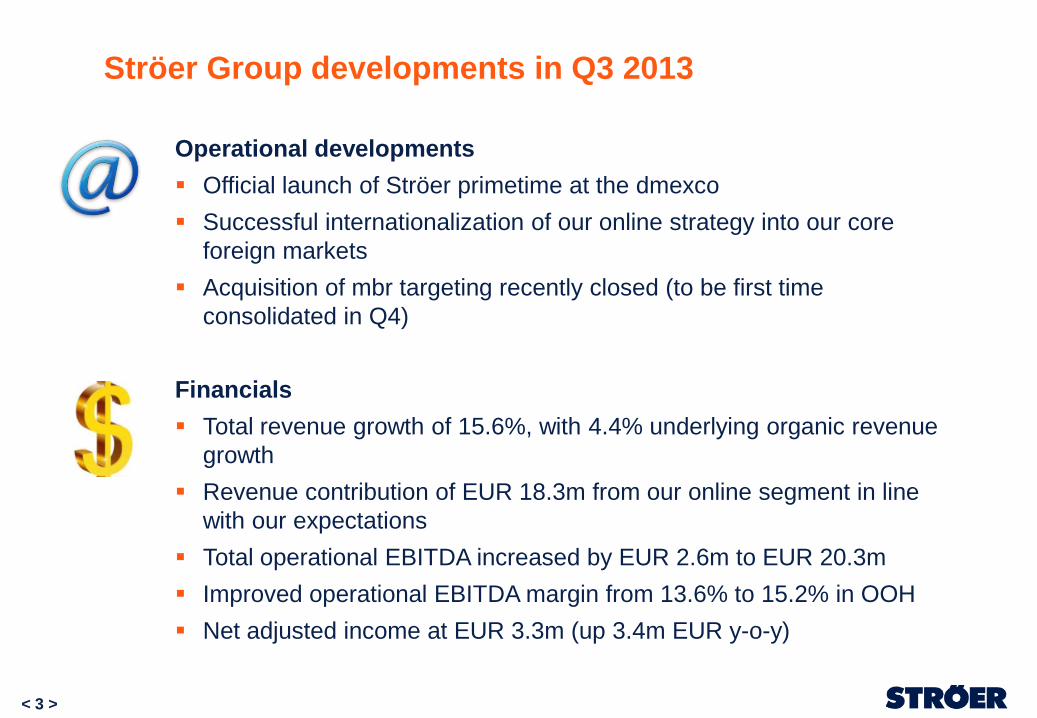
Ströer Group developments in Q3 2013
Operational developments
Official launch of Ströer primetime at the dmexco
Successful internationalization of our online strategy into our core
foreign markets
Acquisition of mbr targeting recently closed (to be first time
consolidated in Q4)
Financials
Total revenue growth of 15.6%, with 4.4% underlying organic revenue
growth
Revenue contribution of EUR 18.3m from our online segment in line
with our expectations
Total operational EBITDA increased by EUR 2.6m to EUR 20.3m
Improved operational EBITDA margin from 13.6% to 15.2% in OOH
Net adjusted income at EUR 3.3m (up 3.4m EUR y-o-y)
< 3 >

Improved OOH trading in 9M 2013
€ MM 9M 2013 9M 2012 Change
Revenues 439.3 397.4 +10.5%
Organic growth (1) 4.8% -5.1%
Operational EBITDA 67.7 58.5 +15.8%
Net adjusted income (2) 13.1 2.8 >+100%
Investments (3) 26.6 30.1 -11.4%
Free cash flow (4) -20.0 -7.5 <-100%
Net debt (5) 339.8 317.5 +7.0%
Leverage ratio 2.9x 3.0x -1.7%
< 4 >
Notes: (1) Organic growth = excluding exchange rate effects and effects from the (de)consolidation and discontinuation of operations; (2) Operational EBIT net of the financial result adjusted for exceptional items, amortization of acquired intangible advertising concessions and the normalized tax expense (32.5% tax rate); (3) Cash paid for investments in PPE and intangible assets; (4) Free cash flow = cash flows from operating activities less cash flows from investing activities; (5) Net debt = financial liabilities less cash (excl. hedge liabilities)

OOH gaining market share in Germany:
OOH market share increased from
4.9% to 5.7%* (as per Nielsen gross
spend) in the first nine months of
this year
Total advertising spend increased
by 1.7%**
LG and Napapijiri newly acquired in
the recent quarter
< 5 > * Source: Nielsen gross advertsing spend figures (09/13)
** Source: Invidis
5.7%
43.6%
32.9%
11.3%
6.2% 0.3%
Out-of-Home TV Print Internet Radio Cinema
New clients acquired in 9M 2013:
Market share of media channels
at 9M 2013

Expansion of our digital portfolio offering
(>9% of our 9M revenue in Germany)
Recent new installations OC Mall:
Skyline Plaza Frankfurt
54 screens – 120,000 visitors per week
Centro Oberhausen
10 screens – 422,000 visitors per week
Currently ~1,500 OC screens in Germany
High reach attained
Reach nationwide: ~19.2m
85% of people entering a shopping centre have
recognised digital advertising media1)
Direct access to customers on their
purchasing journey
< 6 > 1) According to a recent online study by BrandScience

Ströer Digital OOH Germany
< 7 >
848 customer bookings in 2013
400 new customers in 2013 ~ € 8,400k revenue
On average 27% of the monthly order book is generated in the
month running
Lead time (offer to contract) 10 days

OoH in Turkey & Other - Increasing topline performance & improved operational EBITDA
< 8 >
REVENUES
SEGMENT TURKEY € MM
63
70,5
9M 2012
9M 2013
Organic Growth
Continuously strong sales momentum on regional and
national levels
Expansion of last years Istanbul capacity spilling over
to revenue performance
Positive market sentiment on new product offerings
boost demand in Istanbul
+19.5% 1,5
2,8
9M 2012
9M 2013
OPERATIONAL EBITDA
SEGMENT OTHER € MM
+84.2%
BlowUP with strong topline performance boosting operational EBITDA
Ströer Poland suffering from continuously soft market dynamics
Rigorous cost saving measures resulting in improved operational EBITDA in Poland
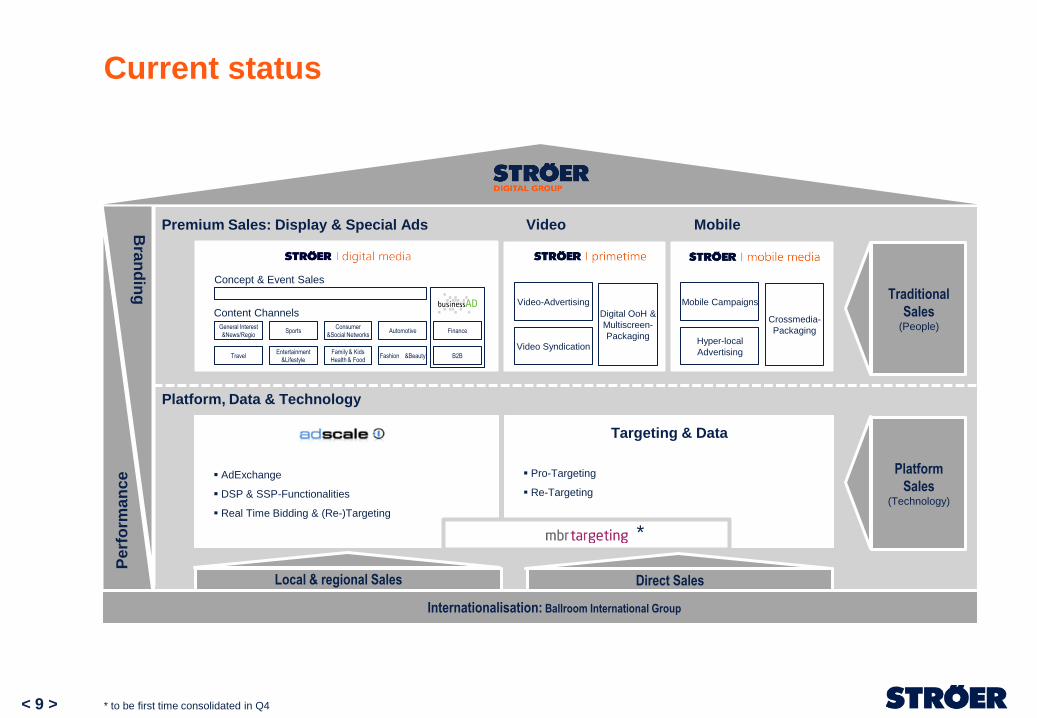
Current status
< 9 > * to be first time consolidated in Q4
Bra
nd
ing
Pe
rfo
rma
nce
Premium Sales: Display & Special Ads Video Mobile
Traditional
Sales (People)
Platform
Sales (Technology)
AdExchange
DSP & SSP-Functionalities
Real Time Bidding & (Re-)Targeting
Platform, Data & Technology
Local & regional Sales
Digital OoH &
Multiscreen-
Packaging Video Syndication
Video-Advertising
Concept & Event Sales
Content Channels Crossmedia-
Packaging Hyper-local
Advertising
Mobile Campaigns
Pro-Targeting
Re-Targeting
Direct Sales
Internationalisation: Ballroom International Group
General Interest
&News/Regio Sports
Consumer
&Social Networks Automotive Finance
Travel Entertainment
&Lifestyle
Family & Kids
Health & Food B2B Fashion &Beauty
Targeting & Data
*

Mobile
Video
Arbitrage and commission revenue model in place
< 10 >
Arbitrage
Display | Channels & Verticals Regional Platform, Data
AGOF #3
Unique video sales house
Best in class mobile company Strong sales force Targeting & Technology
Content |
Branding Consumer|
Performance
40 offices
Commission
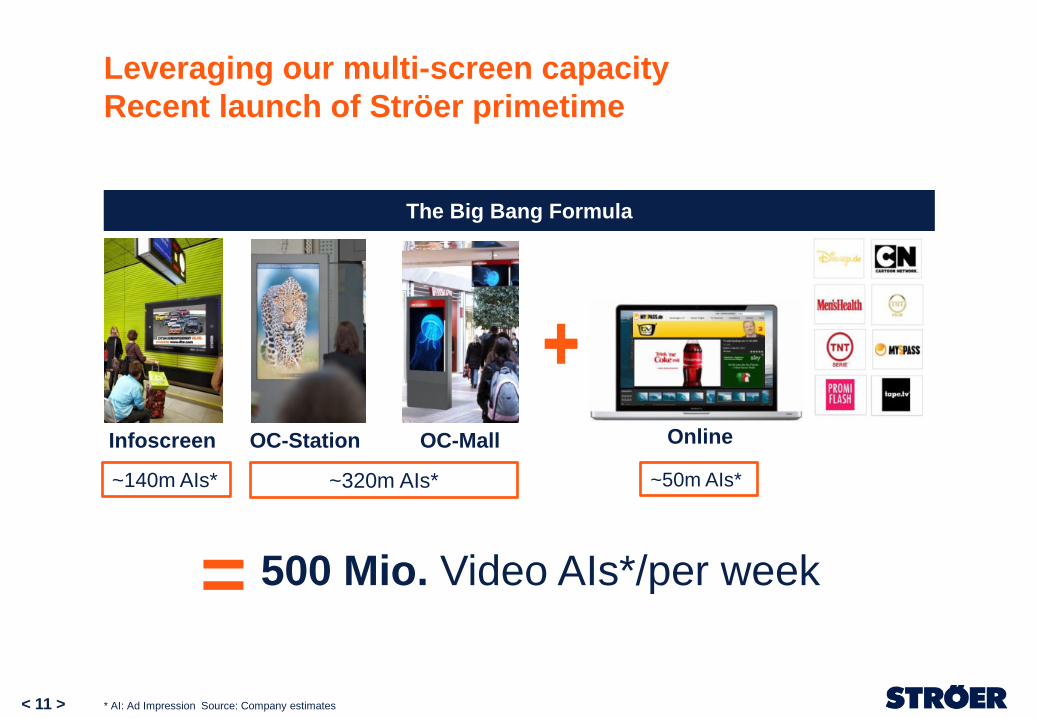
Leveraging our multi-screen capacity
Recent launch of Ströer primetime
< 11 > * AI: Ad Impression Source: Company estimates
Infoscreen OC-Mall OC-Station Online
+
500 Mio. Video AIs*/per week
~140m AIs* ~320m AIs* ~50m AIs*
=
The Big Bang Formula

Strong inventory of around 300 websites in Germany
< 12 >
* Individuals who have visited a Web site (or network)
•** Source: AGOF internet facts 10-2013, The Arbeitsgemeinschaft Online Forschung,
affiliation of leading online marketers in Germany
~29 m unique users
~53% reach
~1.5 bn page impressions
Latest new websites juraforum.de, weblogit.net,
zapitano.de, touchscore.de, combined unique
users of 1.5m
Unique users* per month October (AGOF**)
Business & Finance
(~10 publishers)
***
Publishers by segment
Sports
(~60 publishers)
Family & Kids
(~30 publishers)
Fashion&Beauty
(included in consumer)
Travel
(~35 publishers)
Digital Entertainment
(~50 publishers)
Consumer & Social Networks
(~50 publishers)
Automotive
(~30 publishers)
Business & B2B (~20 publisher)
*** BusinessAD
22,3
26,9
27,4
27,4
28,1
28,4
31,0
31,7
35,8
G+J Electronic Media Sales
OMS
eBay Advertising
IP Deutschland
TOMORROW FOCUS MEDIA
United Internet Media
Ströer Digital
Axel Springer Media Impact
Interactive Media CCSP
+ unique users to
be considered
from the GAN
Ströer GmbH

Deepening our content channels
Acquisition of Game Ad Net
13
Games & Portals
Ad Spending
Brands / Advertisers
Telecommunications
Entertainment Food
Consumer Goods
Ad Inventory
Ad Spending
Access to
Publishers
~5 EURm revenue in 2013
Fastest growing market segment**
~25 million people engage in
online/mobile Gaming in Germany***
* To be consolidated as GAN Ströer GmbH in Q1 2014
** Source: Nielsen Net Res, DFC Intelligence, 2011, PwC, Digi-Capital
*** Source: Company estimates
Gaming
Qualifying International
Premium Gaming Traffic
*
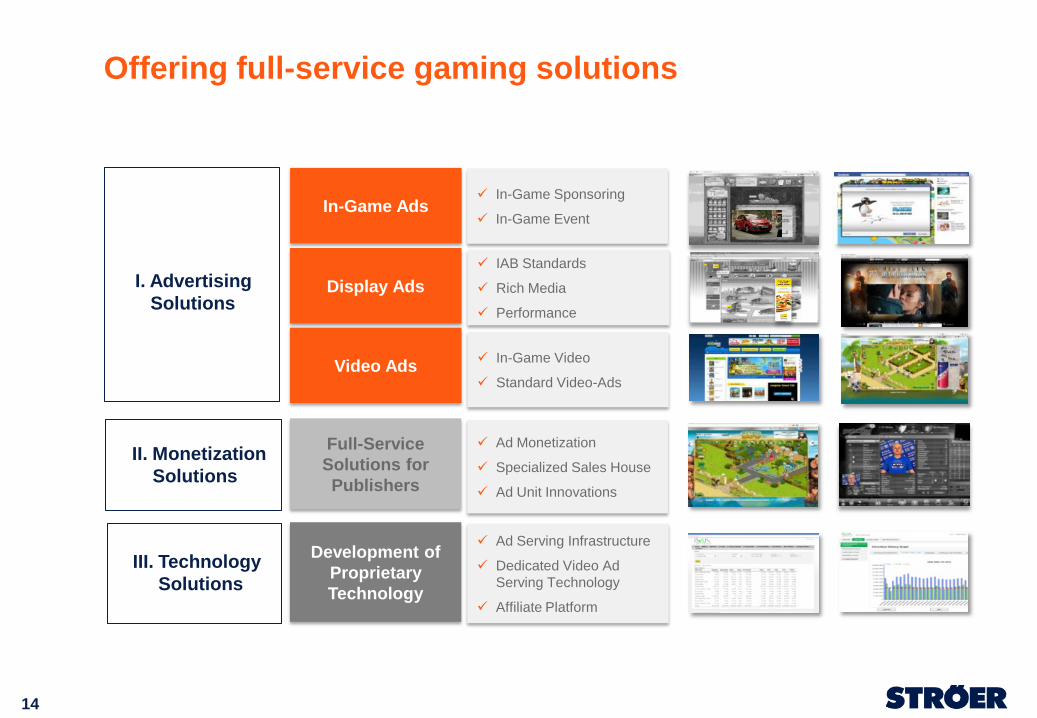
Offering full-service gaming solutions
14
Display Ads
Full-Service
Solutions for
Publishers
Development of
Proprietary
Technology
In-Game Ads
Ad Monetization
Specialized Sales House
Ad Unit Innovations
IAB Standards
Rich Media
Performance
Video Ads In-Game Video
Standard Video-Ads
In-Game Sponsoring
In-Game Event
Ad Serving Infrastructure
Dedicated Video Ad
Serving Technology
Affiliate Platform
II. Monetization
Solutions
III. Technology
Solutions
I. Advertising
Solutions

Publisher
Advertiser
Sell Inventory!
Buy inventory
to show ads!
Market place (SSP,
Marketer)
Agency
blackbox
Request Data
Conversion Data
Campaign Data
Highest
Performance
Best Price
conversion
Display Conversion Funnel
branding
protargeting
retargeting
direct
• Patented algorithm
• 13 years of research
• Theoretical physics
• Machine learning
• Artificial intelligence
Acquiring proprietary technology - mbr targeting
< 15 >

Our target 3.0 - Synchronisation of our technology on
to a modular platform
< 16 >
AdServer
3.0
DOOH
Premium Video
Desktop/Mobile/
Smart TV
Premium
Display
Customer
Prediction
DSP Display,
Video, Mobile
SSP Display,
Video, Mobile
Secondary Sales
(e.g. by RTB)
Premium-Sales
• Connection of each individual
system and interface
• Planning and extension of
group-wide campaigns from
one central platform
• Group wide aggregation of
data and optimisation of
campaigns
• Implementation of group-wide
research studies

Internationalising our business model - acquisition of
Ballroom International
No 1 independant sales house in Poland and Turkey
~ EUR 25m* of revenue (~80% of total revenue) generated in Turkey and Poland
Proprietary technology
Significant know-how and product technology
< 17 >
Revenue
stream
CPM CPL/CPO CPV
Market
position
#1 Turkey
#1 Poland
#1 Turkey
#2 Poland
#1 Turkey
Target
group
Agencies Direct clients TV Advertisers/
Agencies
Display sales (~70% of
sales)
Performance marketing/
Search engine marketing
(~ 20% of sales)
Video advertising and
Other (~10% of sales)
PL
TR
* based on 2012 full-year figures

18
For the fourth quarter of this year, we expect
revenues in the Out-of-Home segment to be
flattish due to the comparably strong fourth
quarter the year before, while we expect
increasing revenue contributions from the
Online segment.

Appendix
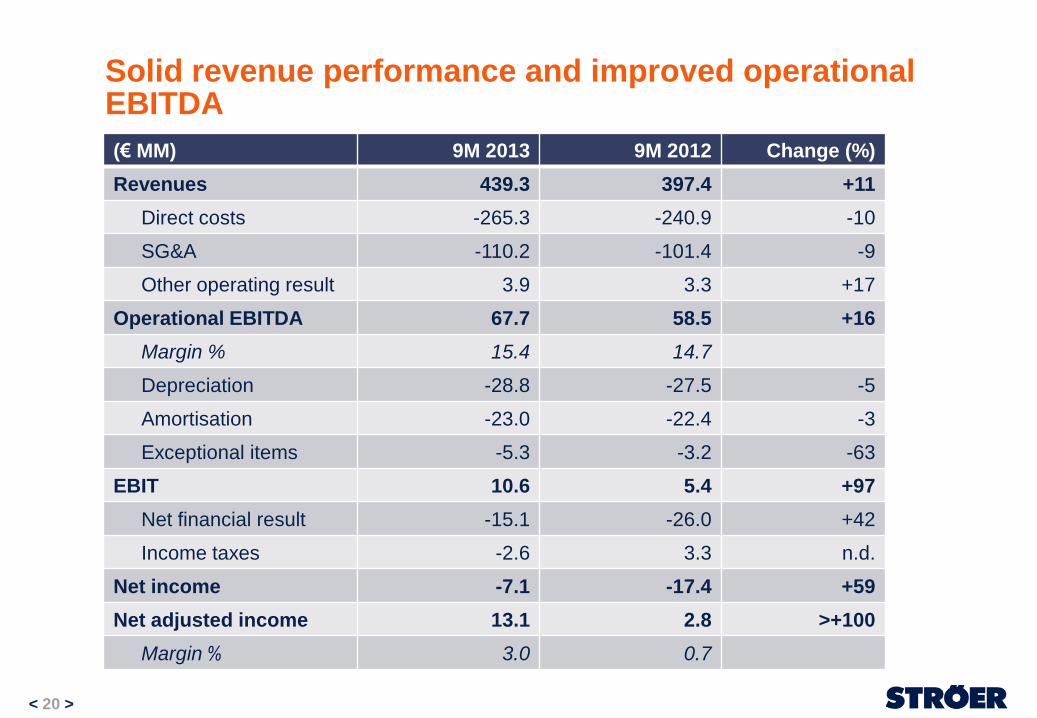
Solid revenue performance and improved operational EBITDA
(€ MM) 9M 2013 9M 2012 Change (%)
Revenues 439.3 397.4 +11
Direct costs -265.3 -240.9 -10
SG&A -110.2 -101.4 -9
Other operating result 3.9 3.3 +17
Operational EBITDA 67.7 58.5 +16
Margin % 15.4 14.7
Depreciation -28.8 -27.5 -5
Amortisation -23.0 -22.4 -3
Exceptional items -5.3 -3.2 -63
EBIT 10.6 5.4 +97
Net financial result -15.1 -26.0 +42
Income taxes -2.6 3.3 n.d.
Net income -7.1 -17.4 +59
Net adjusted income 13.1 2.8 >+100
Margin % 3.0 0.7
< 20 >

Group net adjusted income increased due to better
underlying profits and further improved financial result
< 21 >
Key adjustment representing amortization of acquired concessions (PPA effect)
Exceptional items include one-off costs for online acquisitions and efficiency measures
Adjustment of financial result mainly due termination of interest hedges and net revaluation
effects from FX movements in 9M/2013
Net
Adjusted
Income
9M/2012
Net
Adjusted
Income
9M/2013
Tax
Normalisation
@ 32.5%
Net
Income
Reported
9M/2013
(0.7)
19.3
5.3
Financial
Result
Exceptionals
-7.1
(3.7)
Amortisation
Acquired
Contracts
Exceptional
Items
€ MM % Margin 3.0% 0.7%
13.1
2.8

Group organic revenue up by 4.8%
< 22 >
Positive out of home revenue development in Germany and Turkey
Scope effects solely from online acquisitions
Significant effects from devaluations of Turkish Lira in Q2 and Q3
€ MM +4.8%
9M/2013
reported
439.3
Organic
19.2
9M/2012
normalized
420.1
FX
(5.1)
Scope
27.8
9M/2012
397.4
normalized for current scope
and FX
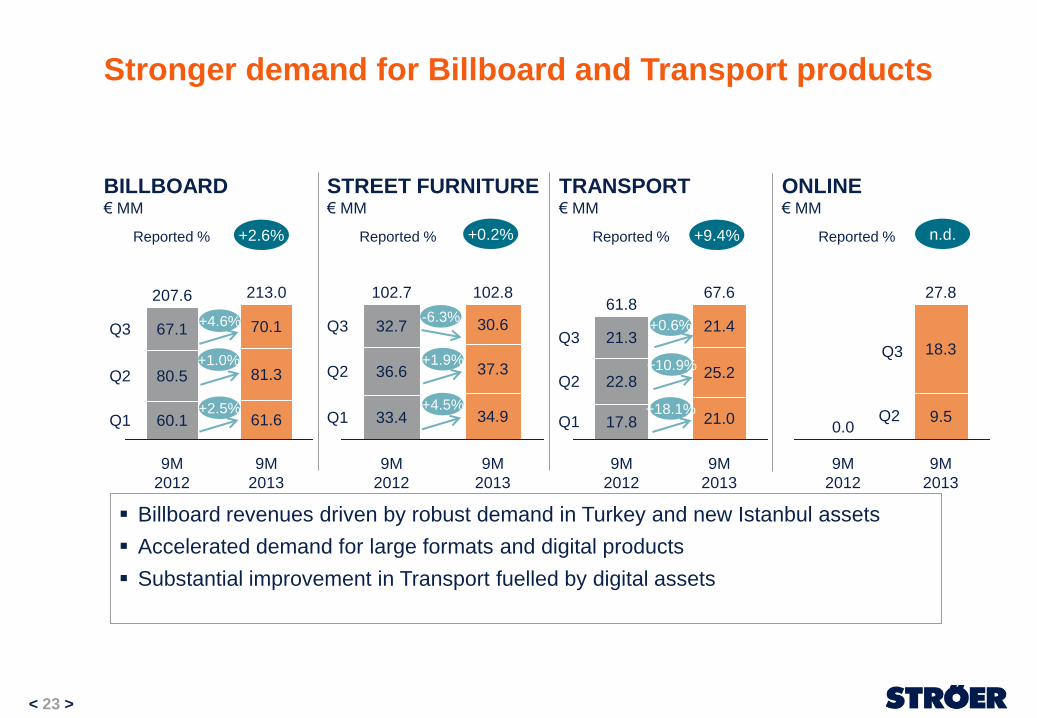
Stronger demand for Billboard and Transport products
< 23 >
BILLBOARD € MM
STREET FURNITURE € MM
TRANSPORT € MM
Billboard revenues driven by robust demand in Turkey and new Istanbul assets
Accelerated demand for large formats and digital products
Substantial improvement in Transport fuelled by digital assets
Q1
Q2
9M
2013
213.0
61.6
81.3
9M
2012
207.6
60.1
80.5
Q3 67.1 70.1
+2.5%
Reported % +2.6%
+1.0%
Q1
Q2
9M
2013
102.8
34.9
37.3
9M
2012
102.7
33.4
36.6
32.7 Q3 30.6
Q1
Q2
9M
2013
67.6
21.0
25.2
9M
2012
61.8
17.8
22.8
Q3 21.4
21.3
ONLINE € MM
Q2
9M
2013
27.8
9M
2012
0.0
Q3
9.5
18.3
Reported % +0.2% Reported % +9.4% Reported % n.d.
+1.9%
+4.5%
+10.9%
+18.1%
+4.6% -6.3% +0.6%

Ströer Germany: Revenues up in a muted market backed by demand for digital products and regional sales
< 24 >
REVENUES € MM
94.9 97.2
293.4 302.0
Q3 2012
Q3 2013
9M 2012
9M 2013
+2.4%
OPERATIONAL EBITDA € MM
18.2 19.9
61.0 62.8
Q3 2012
Q3 2013
9M 2012
9M 2013
INVESTMENTS* € MM
16.1
10.6
9M 2012
9M 2013
Gaining momentum in premium billboard products in Q3/2013
Increased revenues with regional clients driven by sales initiatives
Double-digit revenue increase of digital products in 9M/2013 leading to an increased
share of digital revenues from 8% in 9M/2012 to 9% in 9M/2013
+8.9%
* Cash paid for investments in PPE and intangible assets
% Margin
20.8%
Organic Growth
+2.4% 19.2%
+2.9%
+2.9%
+3.0%
20.4% 20.8%

Ströer Turkey: Continued growth driven by new assets and product launches in a robust market environment
REVENUES € MM
< 25 >
20.6 21.4
62.9 70.5
Q3 2012
Q3 2013
9M 2012
9M 2013
+20.0%
OPERATIONAL EBITDA € MM
-0.4
1.1 1.4
7.8
Q3 2012
Q3 2013
9M 2012
9M 2013
INVESTMENTS* € MM
8.7
4.6
9M 2012
9M 2013
Continuously strong sales momentum on regional and national levels
Positive market sentiment on new product offerings boost demand in Istanbul
Moderate Capex spending after strong prior year investments in Istanbul ramp-up
n.d.
% Margin
* Cash paid for investments in PPE and intangible assets
Organic Growth
+3.8%
-2.0% +2.3%
+12.1%
+19.5% +5.3% +11.1%
>+100%
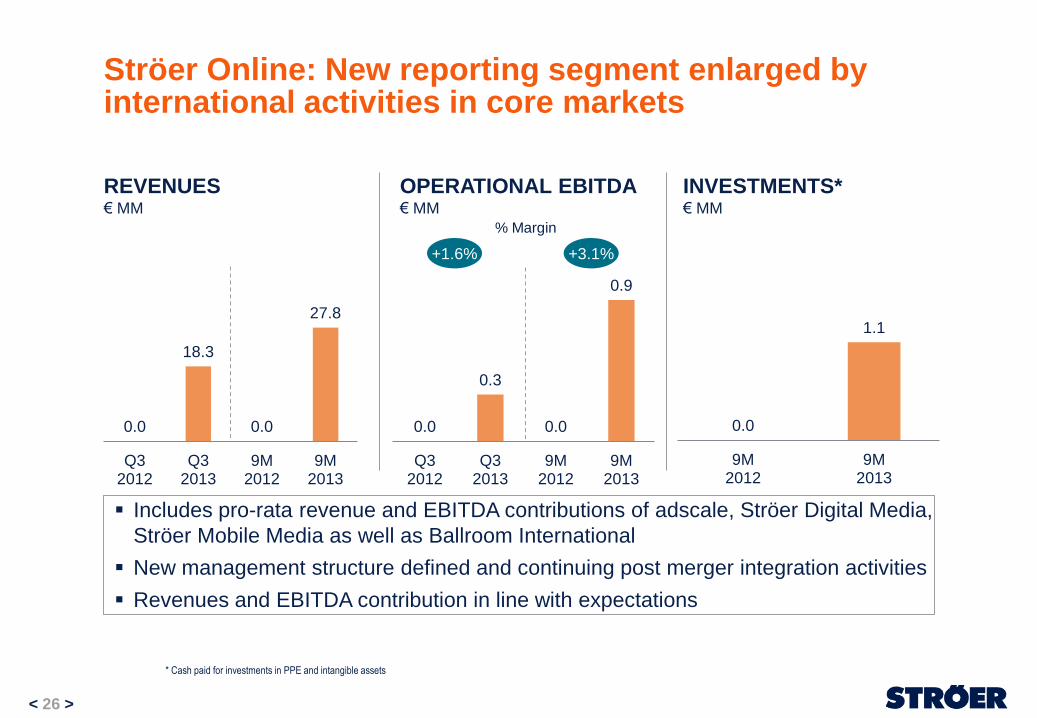
Ströer Online: New reporting segment enlarged by international activities in core markets
< 26 >
REVENUES € MM
0.0
18.3
0.0
27.8
Q3 2012
Q3 2013
9M 2012
9M 2013
OPERATIONAL EBITDA € MM
0.0
0.3
0.0
0.9
Q3 2012
Q3 2013
9M 2012
9M 2013
INVESTMENTS* € MM
0.0
1.1
9M 2012
9M 2013
Includes pro-rata revenue and EBITDA contributions of adscale, Ströer Digital Media,
Ströer Mobile Media as well as Ballroom International
New management structure defined and continuing post merger integration activities
Revenues and EBITDA contribution in line with expectations
% Margin
* Cash paid for investments in PPE and intangible assets
+3.1% +1.6%

Ströer Other*: Strong Revenue and EBITDA contribution from BlowUP
< 27 >
REVENUES € MM
14.5 13.7
41.2 39.5
Q3 2012
Q3 2013
9M 2012
9M 2013
-2.6%
OPERATIONAL EBITDA € MM
1.1 1.3 1.5
2.8
Q3 2012
Q3 2013
9M 2012
9M 2013
INVESTMENTS** € MM
0.6
1.6
9M 2012
9M 2013
BlowUP with strong topline performance boosting operational EBITDA
Ströer Poland suffering from continuously soft market dynamics
Rigorous cost saving measures resulting in improved operational EBITDA in Poland
+21.6%
% Margin
* BlowUPMedia Group and Ströer Poland
** Cash paid for investments in PPE and intangible assets
Organic Growth
-5.5%
+7.3% +3.7%
-4.3%
-3.2% +9.4%
+84.2%
+7.0%
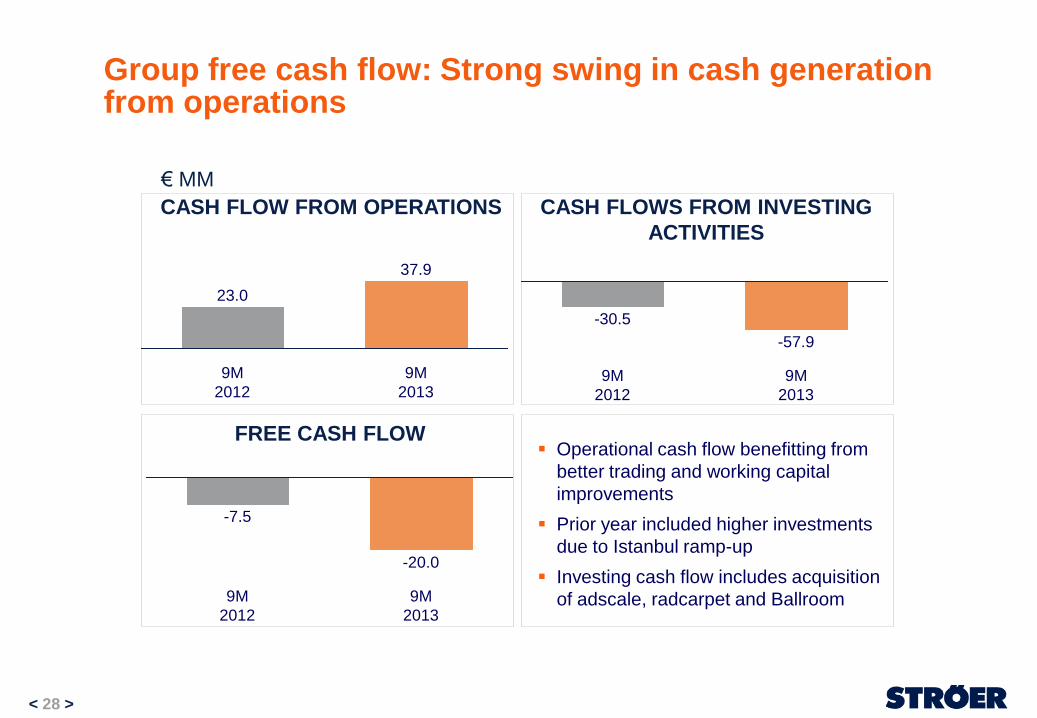
Group free cash flow: Strong swing in cash generation from operations
< 28 >
CASH FLOW FROM OPERATIONS
9M
2013
37.9
9M
2012
23.0
9M
2013
-57.9
9M
2012
-30.5
CASH FLOWS FROM INVESTING
ACTIVITIES
9M
2013
-20.0
9M
2012
-7.5
FREE CASH FLOW Operational cash flow benefitting from
better trading and working capital
improvements
Prior year included higher investments
due to Istanbul ramp-up
Investing cash flow includes acquisition
of adscale, radcarpet and Ballroom
€ MM
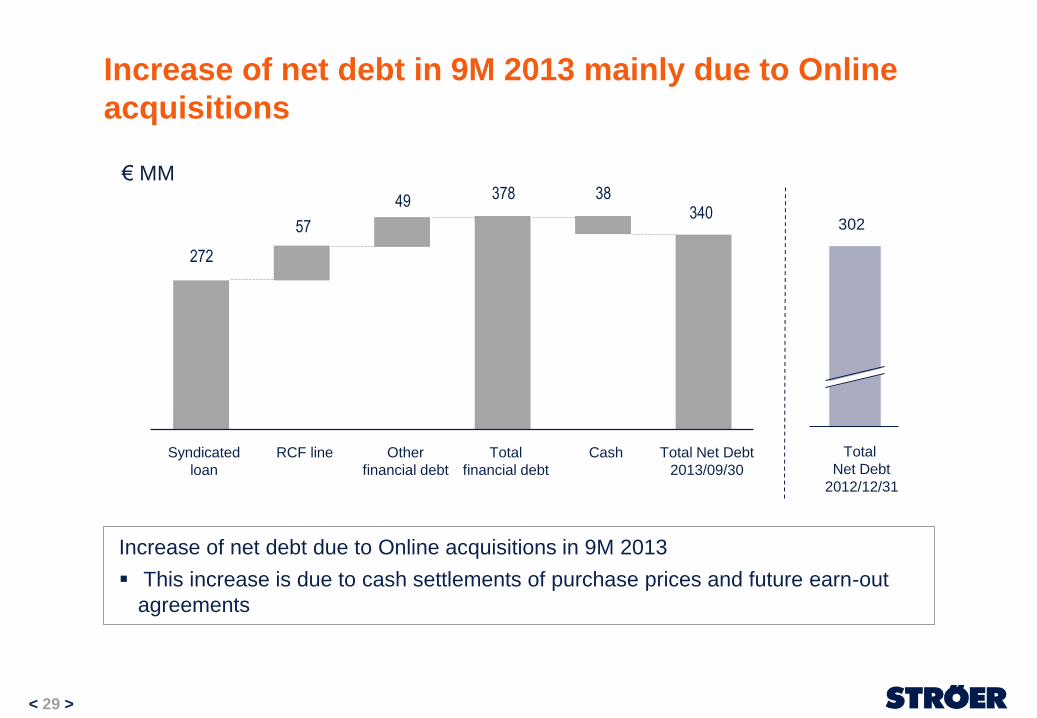
272
57
49 378 38 340
Increase of net debt in 9M 2013 mainly due to Online
acquisitions
< 29 >
Increase of net debt due to Online acquisitions in 9M 2013
This increase is due to cash settlements of purchase prices and future earn-out
agreements
€ MM
Total Net Debt
2013/09/30
Cash Total
financial debt
Other
financial debt
RCF line Syndicated
loan
Total
Net Debt
2012/12/31
302

Underlying net interest charge further improved in 2013
< 30 >
Lower debt service following optimized loan structure as part of refinancing in 07/2012
Further savings from termination of interest hedges that became due in October 2012
and April 2013
€ MM
Net financial
result
(reported)
9M 2013
15.1 (1.4) 2.1 15.8
Net FX
revaluation
effect
Net change
in derivative
values
Net interest
result
(normalized)
9M 2013
25.1
Net interest
result
(normalized)
9M 2012
-37%
Disclaimer
This presentation contains “forward looking statements” regarding Ströer Media AG (“Ströer”) or Ströer Group, including
opinions, estimates and projections regarding Ströer ’s or Ströer Group’s financial position, business strategy, plans and
objectives of management and future operations. Such forward looking statements involve known and unknown risks,
uncertainties and other important factors that could cause the actual results, performance or achievements of Ströer or
Ströer Group to be materially different from future results, performance or achievements expressed or implied by such
forward looking statements. These forward looking statements speak only as of the date of this presentation and are
based on numerous assumptions which may or may not prove to be correct. No representation or warranty, express or
implied, is made by Ströer with respect to the fairness, completeness, correctness, reasonableness or accuracy of any
information and opinions contained herein. The information in this presentation is subject to change without notice, it
may be incomplete or condensed, and it may not contain all material information concerning Ströer or Ströer Group.
Ströer undertakes no obligation to publicly update or revise any forward looking statements or other information stated
herein, whether as a result of new information, future events or otherwise.
< 31 >


