- 1 -
CESIS Electronic Working Paper Series
Paper No. 175
Key Characteristics of the Small Innovative Firm
Martin Andersson* and Hans Lööf**
(*CESIS and JIBS, **CESIS and the Division of Economics, KTH)
March 2009
The Royal Institute of technology Centre of Excellence for Science and Innovation Studies (CESIS)
http://www.cesis.se

- 2 -
Key Characteristics of the Small Innovative Firm
Martin Andersson1 and Hans Lööf2
1,2Centre of Excellence for Science and Innovation Studies (CESIS), Royal Institute of Technology,
Stockholm
1Jönköping International Business School (JIBS), Jönköping
Abstract
Despite broad agreement on the strategic role of SMEs (Small and Medium Sized Enterprises) in
industrial renewal processes, the lack of systematized and comprehensive information on the nature
and level of small innovative firms is striking. This bias is partly explained by an empirical shadow
created by the limited availability of good, detailed data for comparable firm-level analyses. Based on
extensive matched databases, the purpose of this paper is to provide new insights into the roles of
micro and small innovative firms in research-based as well as tradition-based manufacture. The data
consists of close to 160 000 observations of manufacturing firms in Sweden over the period 2000-
2006, including information on innovation activities captured by patent applications, firm
characteristics, international trade and the regional milieu.
Keywords: Innovation, Innovative Firms, Entrepreneurship, Small firms, Intellectual Property
Rights, Technology Transfer, Location
JEL: F43, L26, M13, O31, O34
Note: This is a substantially revised version of a previously published CESIS working paper no. 127 (A Portrait of the Innovative Firm as a Small Patenting Entrepreneur)

- 3 -
1. INTRODUCTION
This paper uses patent applications as an indicator of innovative activities and focuses on the
characteristics of innovative micro and small firms, with large firms serving as a reference group. It
studies how firms’ innovation activities vary in accordance with an extensive set of characteristics
including observed and unobserved firm-specific information and knowledge spillovers through
corporate ownership structure, international trade and the regional milieu. The data material consists
of close to 160 000 observations of manufacturing firms in Sweden over the period 2000-2006.
Small innovative firms are considered to be a key factor for entrepreneurial spirit and innovation.
Baumol’s (2002) hypothesis of a ‘David-Goliath’ symbiosis between small and large firms and the
Schumpeterian ‘Mark I’ hypothesis (Schumpeter 1934) emphasize the role of small innovative firms
in introducing new technology and variety into the economic system. Much research in recent decades
also shows that small firms account for a significant share of innovations and employment growth
(e.g. Rothwell 1989, Acs and Audretsch 1988 and 1991, Davidsson et al. 1994 and Audretsch 2002).
Indeed, there is a growing and important literature on startups, spin-offs into emerging and
knowledge-intensive sectors, such as ICT and pharmaceuticals, and survey-based studies such as the
Community Innovation Survey (CIS) data. But the dominance of anecdotal evidence based on
individual case-studies and findings from selective and fragmented quantitative information is evident.
This bias is partly explained by an empirical shadow created by the limited availability of detailed data
for comparable firm-level analyses.
Interestingly, one out of three Swedish manufacturing firms applying for national patent protection is a
micro firm (1-10 employees) or a small firm (11-25 employees)1; a similar situation is found in many
other countries (Iversen et al 2008). Despite the fact that SMEs account for a considerable fraction of
the total patent activity, and concerns about their importance in industrial renewal processes, the lack
of systematic and comprehensive information on the characteristics of small innovative firms is
striking.
Exploiting extensive, matched databases, the purpose of this paper is to provide new insights into the
roles of micro and small innovative firms in research-based as well as traditional manufacturing
sectors. The data used in this paper originates from Statistics Sweden, the Swedish Custom Office and
the Swedish Patent Office (PRV). The basic data set contains compulsory and audited register
1 To see the truly ‘smallness’ of firms with 1-25 employees (micro and small), consider that Acs and Audretsch (1988) as well as Acs et al. (1994) define “small firm innovations” as innovations by firms with less than 500 employees. In 2003 the EU commission adopted a definition stating that micro firms are those with 10 or fewer employees, whereas small firms are those with between 11 and 50 employees.

- 4 -
information on firm characteristics based on annual reports for all firms in Sweden. A unique
identification number for each firm allows this data to be merged with data on firms’ international
trade and patent applications, the educational level of the workforce and regional characteristics.
The data material is comprehensive and its richness enables us to evaluate propositions and arguments
with regard to the determinants of innovation derived from various strands of innovation literature: the
neo-Schumpeterian literature and the resource-based view of the firm (RBV), the theory of
agglomeration economies and the literature on international trade as a conduit for knowledge flows.
Section 2 of this paper presents propositions and arguments pertaining to the characteristics of the
innovative firm and emanating from different strands of literature. These provide the basis for the
selection of variables that are used to contrast innovative with non-innovative firms in the empirical
analysis. Section 3 contains the data, variables and descriptive statistics. Section 4 sets out the
empirical strategy and Section 5 the results of the econometric analyses of the relationships between
our chosen variables and the firms’ patent applications. Section 6 concludes the paper by providing
suggestions for further research and extensions.
2. THE INNOVATIVE FIRM AND ITS CHARACTERISTICS The main focus here is on the characteristics associated with innovative small firms. We use patent
application as a proxy for the firm’s innovative activities. Although patents are typically considered as
an output measure in some of the literature we refer to below, it may also be seen as an intermediate
product in the innovation process. This is the view taken in this paper.
It should be emphasized that many innovative firms do not apply for patent protection and that a
patent application is not an innovation, but only one of many possible innovation indicators. Though
the use of patents as innovation indicators has been debated, many scholars argue that it is a proper
measure of innovation (Griliches 1990). Acs et al. (2002) compare innovation and patents across US
regions and conclude; “the empirical evidence suggest that patents provide a fairly reliable measure of
innovative activity” (p.1080).
Which of the characteristics of a firm and its environment are important for innovation? There is no
established “general” theoretical model in the literature of the innovative firm. This paper relies on
theories, arguments and propositions in three main strands of the literature on R&D, technology and
innovation. These are; (i) the Schumpeterian literature and the resource-based view of the firm (RBV),
(ii) the literature on agglomeration economies and (iii) the literature on international technology
diffusion, which emphasizes international trade as a conduit for knowledge flows.

- 5 -
The three strands offer complementary perspectives on the determinants of innovation. While the neo-
Schumpeterian and RBV frameworks stress internal characteristics, the literature on agglomeration
economies and international trade puts focus on knowledge and information flows from the local
environment and from abroad.2 An example of the complementarities of the perspectives is that a
firm’s human capital may affect its capability to internally generate new techniques and products. At
the same time it reflects the absorptive capacity as regards knowledge and information flows from
either the local environment or from abroad. Next we discuss the three strands of the literature in more
detail. We also take up our definitions of, and reasons for using, the variables that we apply in the
empirical analysis of the determinants of innovation activity.
2.1 Internal firm characteristics The neo-Schumpeterian and the RBV perspectives emphasize internal characteristics, such as R&D,
physical capital, human capital and financial structure. A key assertion in the RBV literature is that a
firm’s competitive advantage depends on internal heterogeneous resources and capabilities (Penrose
1959, Barney 1991). According to this perspective, firms’ innovation activities are primarily explained
by their internal characteristics. The neo-Schumpeterian literature builds on similar premises, although
the role of sector characteristics is typically more explicit, as manifested, for instance, by concepts
such as technological regimes (Malerba and Orsenigo 1993).
Consistent with the RBV and the neo-Schumpeterian literature, several studies find that the
characteristics of the firms and the sector they operate in are important for explaining a firm’s
engagement in innovation activities (Kleinknecht and Mohnen 2002, Cohen 1995, Crépon et al. 1998,
Pavitt 1984). We will now review a set of characteristics that this literature suggests is important for
firms’ innovation activity and show how they are defined in this paper. The characteristics include
financial resources, physical capital, human capital, size, corporate ownership and sector affiliation.
Profit margin and short term debt
As innovation is often associated with risks and costly investments in knowledge and technology, both
internal financial resources and access to external capital are possible determinants of a firm’s
innovation activity. The theoretical literature suggests that the presence of asymmetric information and
moral hazard problems may be particularly serious for SMEs engaged in innovation activities Thus,
profitability can be expected to be more important for small and young innovative firms, since they
often have limited access to capital markets and difficulties in finding external sources of funds for
2It should also be emphasized that the various propositions as regards the characteristics of innovating firms from the different strands of literature considered here are ‘open-ended’, such that the verification of hypotheses derived from one type of literature does not preclude hypotheses from the others.

- 6 -
their R&D investments (Himmelfarb and Petersen 1994).3 However, the unsuitability of debt as a
source of finance for R&D and other innovation investment has been confirmed across different firm
sizes (Hall 2005).
In the analysis we use profit margin, defined as net profit after taxes divided by all sales, as a measure
of internal financial means. We also use short-term debt per employee as an indicator of access to
external financial resources.
Physical capital and human capital
The empirical literature has convincingly shown that physical capital is a major driving force of
economic growth at various levels of aggregation. One explanation is that new knowledge is
embedded in capital investments (Hulten 2001). In contrast, the relationship between physical capital
and innovation is less obvious. In fact, there is no consensus in the literature on the short-run
relationship between firms’ investment in R&D and other innovation activities and physical capital
investments. It is only for the long run that a robust association has been documented (De Jong 2007).
Human capital is regarded as reflecting a firm’s capacity to absorb, assimilate and develop new
knowledge and technology (Bartel and Lichtenberg 1987, Cohen and Levinthal 1990). Several
empirical studies also find that technological change tends to be skill-biased and changes the relative
labor demand in favor of highly skilled and educated workers (e.g. Berman et al. 1998, Machin and
van Reenen 1998).
We use the stock of capital (corrected for depreciation and new investments) per employee as the
capital variable and assume a positive correlation with patent application. We distinguish between two
categories of employment, skilled labour and ordinary labour. Skilled labour is defined as employees
with at least 3 years of university education and we consider this group as a proxy for R&D. Ordinary
labour has less than 3 years of university education and we use this information as the size variable.
Recent literature contains mixed results on the relationship between firm size and innovation output.4
We a priori expect a close and positive association between skilled labour and patent application and
we also believe that this link is stronger for small firms compared to large firms.
3 Scherer (1999) maintains that R&D outlays in large established firms are often of such magnitude that “…they can be financed through routine cash flow and, if need be, can resort to outside capital sources willing to provide funds on full faith and credit without detailed inquiry into the specific uses to which the funds will be put” (ibid. p.72). He argues further that this is one reason why empirical studies of internal cash flow and R&D among larger firms do not find systematic relationships. 4 One of the stylized facts of innovating firms as reported by Klette and Kortum (2004) is that R&D intensity, for instance, is independent of firm size.

- 7 -
Corporate ownership structure
A further characteristic is corporate ownership structure. We distinguish between individual firms and
firms belonging to a corporate group. Three types of corporate groups are analyzed: (i) uninational
corporations, (ii) domestic-owned multinational enterprises (MNE) and (iii) foreign-owned MNEs.
Following the literature, we assume there are important differences between non-MNEs and MNEs as
well as between domestic-owned MNEs and foreign-owned MNEs regarding technological
dissemination and innovation. Swedish MNEs can also be expected to have a distinct role in the
Swedish “innovation system”, since they tend to concentrate their R&D-investments domestically.
By definition, MNEs have established links to several markets and thereby a coupling to several
knowledge sources and innovation systems (cf. Dachs et al. 2008). Typically, they also have strong
internal capabilities pertaining to the development of proprietary information and knowledge within
the corporation (Pfaffermayr and Bellak 2002).5 Small firms that are part of a MNE (either domestic-
or foreign-owned) may thus be expected to be more innovative because of access to the MNE’s
knowledge and information networks and technology. It is also well known that mergers and
acquisitions are an important means by which MNEs expand. One reason why a MNE may acquire a
micro firm is that the latter has developed new knowledge and technology pertinent for the MNE.
Small innovative firms are often the source of the expansion of technological capabilities in large and
established firms (Granstand and Sjölander 1990).
Sector classification and year dummies
A typical argument in the neo-Schumpeterian literature is that the characteristics of a particular sector
or industry with which a firm is affiliated may influence its innovation activity. Different sectors have
different technology and innovation opportunities and are thus characterized by different technological
regimes (Malerba and Orsenigo 1993). Over a sequence of periods certain industries may be
characterized by rapid technological progress, translating into high technology and innovation
opportunities, which is typically the case in the early phases of a technology’s life cycle (cf. Vernon
1966). Small firms tend to have an innovation advantage precisely in high-technology and skill-
intensive sectors in which technology and innovation opportunities are high.
Our empirical analysis includes sector dummies based on the overall technology intensity of the sector
a firm is affiliated with. We consider four broad OECD classifications; high technology, high-medium
technology, low-medium technology and low technology sectors. We also include year dummies to
5MNEs have high ratios of R&D relative to sales, a large number of scientific, technical and other ‘white-collar’ workers as a percentage of their workforce, high value of intangible assets and large product differentiation efforts, such as high advertising to sales ratios (van Marrewijk 2002).

- 8 -
capture unobservable time-varying macro factors, such as general economic conditions, interest rate,
inflation, money supply and tax rates, common to all firms.
2.2 Location characteristics and agglomeration economies The literature on agglomeration economies emphasizes the firms’ local environment and that the
density of firms and the spatial concentration of human capital bring about place-specific external
economies of scale that may influence the performance of the firms. Marshall (1920) maintained that
concentrations of firms in a similar industry give rise to localization economies in the form of
knowledge and information spillovers, labor pooling (advantages of thick markets for specialized
skills) and backward and forward linkages. Ohlin (1933) and Hoover (1937) distinguished between
urbanization and localization economies, the former pertaining to larger urban regions with a
diversified economy.
A main argument in the literature is the local environment as a source of knowledge and ideas
(Feldman 1999, Andersson and Johansson 2008). In particular, dense urban environments with
richness in knowledge sources are regarded as stimulating face-to-face interaction and localized
knowledge flows (Duranton and Puga 2001). These conjectures find support in ample empirical
analyses. Innovation activities are more concentrated in space than standard production activities
(Audretsch and Feldman 1996), patent citations are geographically localized (Jaffe et al. 1993) and
innovations tend to diffuse faster within clusters (Baptista 2000). Moreover, flows of labor and
technical personnel between firms tend to be greater in dense locations, thus stimulating the diffusion
of competencies and knowledge embodied in people (Almeida and Kogut 1999).
An interesting finding in the literature is that the local knowledge flows appear to be particularly
important for small firms. Acs et al. (1994) investigated the sources of innovation inputs for small
firms, since they produce innovation output with limited R&D resources compared to large firms. The
authors tested the hypothesis that small firms capitalize on flows of knowledge and information from
corporate R&D in large firms and universities, and that such flows are stimulated by their
geographical proximity. They applied the model developed in Jaffe (1989) in such a way that
innovation activity in US states was regressed on industry R&D, university R&D and an index of their
geographical coincidence. By partitioning each state’s total innovations into those developed by small
and large firms, they showed that the geographical coincidence index was only significant for small
firm innovations. Although they did not control for characteristics of the firms, as suggested by the
RBV and Schumpeterian literature, their findings indicate an importance of local knowledge and
information flows for innovation activity in small firms. Ample later studies find that the
characteristics of locations pertaining to the potential and frequency of such flows are important, not
only for innovations in small firms but also start-up activity. It is now established in the literature that

- 9 -
“…entrepreneurial activity will tend to be greater in contexts where investments in new knowledge are
relatively high, since the new firm will be started from knowledge that has spilled over from the
source actually producing that knowledge” (Acs et al. 2006, p.12).
In view of the arguments presented above, the empirical analysis includes basic agglomeration
measures reflecting the potential for knowledge and information flows as characteristics associated
with innovation in the region in which each firm is located. Sweden has one major functional regional
(Stockholm) and only two additional metropolitan regions with more than 300 000 inhabitants
(Goteborg and Malmo). We include three separate dummies for Sweden’s three metropolitan regions
with the purpose of ascertaining whether firms located in these regions have a higher propensity to
apply for patents and more patent applications than firms located elsewhere in Sweden. The literature
on agglomeration economies suggests a positive relationship between innovation and metro-regions.
The second agglomeration variable is regional employment fraction, which measures the size of the
sector the firm belongs to in the region where the firm is located, as a fraction of the region’s total
employment in private sectors. It is assumed to reflect the potential for external scale economies
associated with sectoral geographic concentration. The sectors are broadly defined and refer to the
four OECD sector aggregates in terms of technology level. We expect the employment fraction to
positively affect knowledge spillovers and patent activities.
2.3 Networks and linkages to foreign markets Firms engaged in international trade are regularly claimed to have better access to foreign knowledge
and technology, and such access may be important as domestic R&D is often a small fraction of the
‘global’ R&D stock. The literature on international knowledge spillovers (or technology diffusion)
suggests international trade as a conduit for flows of knowledge and technology (see e.g. Keller 2004).
Links to customers and suppliers in different markets may foster a firm’s accumulation of knowledge
about customer preferences, production techniques and technology, and as such stimulate innovation.
An important issue is that a firm’s international trade status may be endogenous to the firm’s
productivity and innovation. Several studies of international trade through the lens of the individual
firm find that, conditional on an extensive set of firm characteristics, firms that participate in
international trade are more productive (see Greenaway and Kneller 2007a or Wagner 2007 for
surveys). Recent evidence from Sweden is provided by Andersson, Lööf and Johansson (2008). The
literature offers two non-mutually exclusive hypotheses capable of explaining such a pattern. The first
is that firms engaged in international trade have ex ante productivity advantages, presumably based on
some form of innovation, enabling them to overcome sunk costs associated with foreign sales. The
second is ‘learning-by-exporting’ and rests precisely on the argument that firms that trade

- 10 -
internationally have better access to foreign knowledge and technology, which stimulates innovation
and productivity.
Much of the literature linking international trade to innovation focuses on imports and technology and
knowledge embodied in differentiated intermediate capital goods (cf. Rivera-Batiz and Romer 1991,
Coe and Helpman 1995). Domestic firms exploit foreign R&D by importing the intermediate product.
From this perspective trade linkages with R&D intensive economies, such as G7 countries accounting
for over 80 % of the total R&D investments in the world, are supposed to be an important source of
knowledge and technology (Acharya and Keller 2007). Lööf and Andersson (2009) find that the
fraction of G7 imports influences productivity at the level of individual firms.
Motivated by the arguments discussed above, our empirical analysis includes measures of the firms’
participation in international trade as innovation determinants. These measures are assumed to reflect
the potential for international knowledge flows. The first is exports and imports, to and from the G7
countries as fractions of total exports and total imports, respectively. The second variable is the
number of export destinations and import origin countries for the firms’ export and import flows.
Finally, we include dummies to indicate whether a trading firm (i) only imports, (ii) only exports or
(iii) imports and exports. The expectations regarding the trade variables are that trade in general and
G7 in particular are positively associated with innovation activity in both small and large firms.
3. DATA AND DESCRIPTIVE STATISTICS 3.1 Data The data source used is this study covers the period 2000-2006 and consists of about 160,000
observations of manufacturing firms in Sweden. The data set is unbalanced. In total 34,742 firms have
been observed, of which 40 % are in the sample for all seven years. About 80 % of the firms are
observed for three years or longer. Five sources of data have been matched, based on a unique
identification number of each firm. The basic data set contains compulsory and audited register
information on firm characteristics based on annual reports for all firms in Sweden. This data has been
merged with data on (i) educational statistics, (ii) trade statistics, (iii) regional characteristics and (iv)
patent applications. All the data originates from Statistics Sweden, the Swedish Customs Office and
the Swedish Patent Office (PRV).
To the best of our knowledge, this data is almost unique in terms of the extensive information on
patenting firms in general and patenting micro firms and small firms in particular. In total the data
comprises close to 8,000 patent applications from about 2,000 Swedish manufacturing firms,

- 11 -
representing more than 95 percent of all national patent applications by Swedish manufacturing firms
during the period 2000-2006.
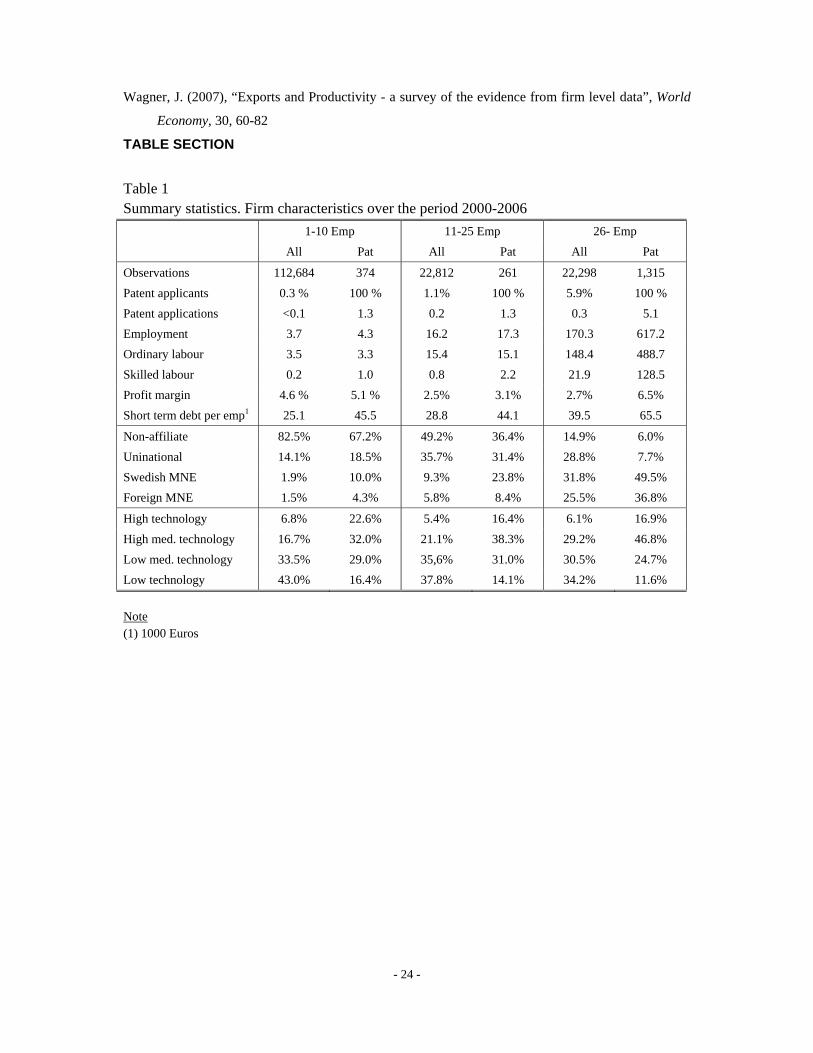
3.2 Descriptive statistics Table 1 presents the summary statistics of key firm characteristics over the period 2000-2006, as
motivated and defined in Section 2. The sample is separated into three size-classes: 1-10 employees,
11-25 employees and more than 25 employees. Several things stand out. First, the fraction of patent
applicants differs considerably across the size-classes. While only 0.3 % of the micro firms applied for
one or more patents during the period, the corresponding fraction for “large” (more than 25
employees) is 6 %. Second, within the three size-classes, patenting firms have 3-5 times more skilled
labour than non-patenting firms. Third, innovative firms (all size classes) are more profitable and have
better access to bank loans. Fourth, a considerably larger fraction of patent applicants is associated
with a Swedish MNE compared to non-patenting firms. Finally, patenting firms tend to be more
capital-intensive and technology-intensive than other firms.
Table 2 shows the descriptive statistics for the trade variables applied in the regression analysis. Two
interesting things should be noted. First, patenting micro firms have a six times larger G7 fraction in
their export-basket compared to other micro firms. They also import more from G7 and are much
more globally oriented than other micro firms. Second, G7 and the international market are of great
importance for all patent applicants, but the difference between patent applicants and others is smaller
for large firms compared to small firms. Overall, patenting firms are more internationalized than non-
patenting ones.
Table 3 reports descriptive statistics for regional characteristics over the period 2000-2006. Only
minor differences are found between patent applicants and others. Based on the previous literature on
agglomeration economies and innovation, one would expect patenting firms to be more frequent in the
metropolitan areas of Sweden. Surprisingly, it is shown that patenting firms are not overrepresented in
the three metropolitan regions of Sweden. Moreover, the statistics associated with the variable ‘Emp-
share LA region’, which measures the size of the sector in the region where the firms are located, also
suggest that patenting firms are not overrepresented in regions where the sector to which the firms
belong is large.
4. EMPIRICAL STRATEGY

- 12 -
We use two measures of patent applications: (i) an indicator variable showing whether firm i has
applied for a patent in year t, (ii) count-data reporting the number of patent applications by firm i in
year t. An application may have several applicants from different firms, motivating adjustment with
weights. However, this requires assumptions of the particular contribution from each of the firms.
Since our sensitivity analysis only shows marginal differences between weighted and non-weighted
applications in the econometric regressions, we apply the former.
In order to estimate the relationship between innovation activity, as evidenced by patent applications,
and the determinants in Section 2, we apply two classes of non-linear estimators. The first is a binary
outcome model and the second is count-data models. In the first model a dummy variable indicates
whether the firm applied for a patent in a given year. The descriptive statistics show that the average
fraction of patent applicants is 0.3% for micro firms, 1.1% for firms with 11-25 employees and 5.9%
for larger manufacturing firms. In the count data models, the dependent variable is the number of
patent applications by each firm. The typical small firm engaged in patent activities made 1
application and the typical firm with more than 25 employees made 5 applications or more over the
period 2000-2006.
The general model is a firm-specific-effects model and may be expressed as:
it i ity α ε′= + +itx β (1)
where yit denotes patent application by firm i in year t, itx a vector of regressors, iα firm-specific
effects that may be fixed-effects (FE) or random-effects (RE), and itε an idiosyncratic error. When a
pooled model is applied on the panel data we assume that the regressors are exogenous and ignore the
unobserved firm-specific effects.
The first empirical model we consider is a logit firm-specific model with which we show the
probability that a firm will apply for a patent. This binary model specifies that
´Pr( 1| , , ) ( )it it i i ity x xβ α α β= = Λ + (2)
where iα may be an FE or RE and Λ(z) =ez(1+ez)
The literature suggests several alternative estimators for count-data estimations. The leading example
is negative binominal models (Cameron and Trivedi 2008). Some of the standard complications in

- 13 -
analyzing count data include the presence of unobserved heterogeneity due to omitted variables, an
“excess” of zero observations and overdispersed data. The dependent variable patent application in
our data is considerably overdispersed because the sample variance is 42 times the sample mean. Our
strategy for dealing with these issues is to employ (i) the pooled zero-inflated negative binominal
estimator in order to account for the large fraction of zero patent applications among the observed
firms as well as overdispersion, and (ii) the panel-data negative binominal estimator to account for
both the overdispersed data and the unobserved firm-specific effects. The preferred count-data
estimator is the panel-data application of the negative binominal model.
A crucial issue is whether the fixed-effects (FE) or the random-effects (RE) is the appropriate model
for our panel-data logit and negative binominal estimators. In the FE model, the unobserved firm-
specific effects αi in (1) are permitted to be correlated with the regressors itx . In the RE model it is
assumed that αi is purely random, implying that it is uncorrelated with the regressors. We find that the
more relevant model for our data is the RE model. This estimator, which corrects for the panel
complication that the observations are correlated over time for a given firm, makes it possible to
estimate the coefficients of both time-invariant and time-varying regressors and can handle a large
amount of zero observations of the dependent variables.
5. RESULTS We now turn to the results of the binary and count-data models. The two dependent variables are the
propensity to apply for a patent and the number of patent applications. Our focus is on micro and small
firms and the coefficient estimates for these two groups are contrasted with the results for firms with
more than 25 employees.
As a point of departure we first consider the persistency in the sample from year to year: In the data,
more than 99% of small and large firms that did not apply for a patent one year did not apply the next.
Looking then at the applicants, 50% of firms with more than 25 employees that applied one year also
applied the next year. The corresponding figure for micro firms is 17%.
Estimates for the variables in the basic model are found in Table 4. This model is based on the neo-
Schumpeterian literature and the resource-based view of the firm (RBV) and includes financial
resources, physical capital, skilled labour as a proxy for R&D, firm size, corporate ownership
structure, sector classification and year dummies. The basic model is augmented in Tables 5 and 6
with export variables and import variables, respectively. Our last results are in Table 7, which shows
the estimated impact of location characteristics using the variables in the basic model as covariates.

- 14 -
The tables are organized in the following way: the first column reports the results for micro (1-10
employees), small (11-25 employees) and larger firms (more than 25 employees), using the logit panel
model with random firm-specific effects. Columns 2 and 3 report the count data results for the three
size-groups. Column 2 presents the results of the pooled zero-inflated negative binominal model,
while the results of the panel data negative binominal model, which controls for random firm-specific
effects, are displayed in column 3.
5.1 Basic model Based on the innovation literature, we expect profit to be a more important determinant than debt in
our innovation equations. We also suppose the link between profit margin and innovation activity to
be relatively stronger for smaller firms than larger ones, and the opposite for the relationship between
external debts, measured as short-term debt per employee. However, very few studies have
systematically analyzed the importance of various financial resources for very small innovative firms.
Thus, the general findings from previous research are not necessarily applicable to our data.
The upper part of Table 4 shows that the probability of applying for a patent (logit model) as well as
the number of applications are neutral with respect to profitability and external debt for micro firms.
For firms with 11-25 employees, however, the preferred negative binominal panel-data estimator
shows a positive and strong correlation between the number of patent applications and profitability,
albeit just outside the 5% significance level. No relationship between the financial resources of the
firm and the probability of applying for a patent can be found for this group. Looking then at larger
firms (> 25 employees), it is evident that the estimates associated with contemporaneous profit
margins are positive and significant for all three estimators. Ignoring the zero-inflated negative
binomial results, short-term debt appears to be irrelevant for patenting activity within the largest size-
group.
The lack of correlation between the financial situation and the innovation indicator for micro firms is
puzzling. A possible explanation might be internal support within the corporate group. The descriptive
statistics in section 2 show that 30% of innovative micro firms belong to a domestic-owned or foreign-
owned group.
The relationship between physical capital per employee and patent applications for micro firms and
for the larger firms is insignificant. Conflicting results are reported for the two count-data estimators
for firms with 11-25 employees, but, guided by the preferred estimator controlling for unobserved
firm-specific effects, we conclude that tangible capital is not closely associated with innovation
activity for any size category.

- 15 -
We next consider the estimated coefficients for skilled labour (employees with 3 years of education or
more). First, the logit model for whether a firm applies for a patent shows that the coefficient is
significantly different from zero at the 1% level for micro and small firms. By contrast it is only
significant at the 10% level for larger firms. Notably, the magnitude of the skill-coefficient is
considerable larger for micro firms compared to other firms. Second, the output-pattern of the count-
data models is almost identical to the binary outcome. At the margin, one more skilled worker is
considerable more important for micro firms than for other firms. It is also notable that the count
estimate for larger firms is highly significant in the zero-inflated model and non-significant in the
panel model.
Ordinary labour is considered to be an additional size-variable in the analysis. Our classification of
the firms into three different groups partly accounts for the size-effect. The estimated size-coefficients
for the two panel-data models are small and non-significant for micro firms, small and only weakly
significant for firms with 10-25 employees and small and highly significant when the largest size
group is considered.
The corporate ownership structure is assumed to be associated with knowledge spillovers and
domestic multinational firms have been found to be of particular importance in the so-called national
innovation system in Sweden (Johansson and Lööf, 2008). This paper confirms previous findings and
shows that the membership in a domestic MNE group is positively correlated to our measures of
patent activity for large firms, small firms and micro firms as well. Only among large firms do we
find a link between foreign ownership and patent application in Sweden, which suggests an
international technological diffusion.
The results for the smaller firms are interesting. Affiliation to a domestic-owned MNE increases the
innovation capacity. MNEs tend to concentrate their R&D activities to the home country partly
because of strong complementarities between the knowledge base of the MNE and the technological
competencies of the “innovation system” in the home country (Patel and Pavitt 1991). Naturally, this
system of innovation includes small innovative firms. Given that MNEs often buy small innovative
firms in order to acquire knowledge and technology, we interpret the results as meaning that domestic
MNEs are better equipped than foreign MNEs to scan the Swedish market and accumulate information
about small innovative firms as potential members of their corporate group. Notably, membership in a
uninational group is negatively associated with national patent application.

- 16 -
Finally, consistent with ample previous studies, the estimated coefficients for the sector dummies
show that innovation activity in the form of patent applications is more likely for firms active in high-
technology sectors. The results in Table 4 verify that this is also the case for small and micro firms.
5.2 International trade characteristics We now consider the basic model in Table 4 augmented with variables reflecting each firm’s
participation in international trade. These variables are motivated by the literature on trade as a conduit
for international knowledge flows. The estimates in the upper part of Table 5 indicate that a firm’s
fraction of exports to the most R&D-intensive countries in the world, G7-exports, is closely correlated
with innovation activity. The binary model and the two count models show a very robust pattern for
micro firms and large firms. The propensity to apply for a patent and the patent count increase
considerably with G7-trade. These results are consistent with the literature on ‘learning-by-exporting’
and international technology diffusion. Interestingly, no significant association between innovation
activity and G7 exports is found for firms in the size group 11-25 employees.
The three estimators produce very similar binary and count estimates for small and large firms
regarding the number of export destinations. Patent application is an increasing function of
international presence on different markets. Among micro firms, though, the number of destination
countries is insignificant.
The lower part of Table 5 presents coefficient estimates for three categories of dummy variables: firms
with only exports, firms with only imports and firms with both exports and imports. The typical
trading firm is engaged in exports as well as imports. Firms that both export and import are also
significantly more likely to be innovative, as approximated by patent applications; this holds across all
three size-classes. These firms have a two-pronged international link to both customers and suppliers
in different countries and thus many potential channels open for knowledge and information flows
from abroad.
Surprisingly, in contrast to G7-exports, we do not find that the fraction of G7 countries of the firm’s
total imports has any impact on patent applications among small firms with 1-10 employees (Table 6).
The coefficient estimate for G7 imports is significantly different from zero only for large firms. The
results of the number of import origins and the three dummy variables are similar to those in Table 5.
With the panel logit model the number of origin markets for imports is significant and positive for
firms of all size-classes. In the count data models, however, this variable is significant only for firms

- 17 -
with more than 10 employees. Finally, the results confirm the strong association between innovation
activity and a firm’s engagement in export and imports.
Overall, the results in Tables 5 and 6 suggest that the variables reflecting a firm’s participation in
international trade are significantly related with innovation activity. This is consistent with the
hypothesis that links to foreign markets are a conduit for international knowledge flows, which
stimulate innovation. The new finding is the important role of G7 for exporting micro firms.
5.3 The regional milieu The literature has convincingly shown that there is a positive inter-relationship of agglomeration and
innovation and productivity (see Section 2.2). Using cross-sectional CIS data for Sweden, Johansson
and Lööf (2008) find that there is a “Stockholm-effect” as regards productivity. Everything else equal,
firms in Stockholm are more productive than in the rest of Sweden. Based on arguments in the
literature on agglomeration economies, we now ask if there is a link between location and patent
activity similar to the one established for location and productivity.
Table 7 reports the estimated coefficients associated with the variables reflecting agglomeration
phenomena, i.e. the dummy variables for Sweden’s three metropolitan regions and the size of the
sector in the region. The latter variable is assumed to reflect the potential for external scale economies
associated with sectoral geographic concentration and may be considered as a specialisation indicator.
Starting with the metropolitan-variables, Table 7 shows no “Stockholm-effect” as regards firms’
patent activities. The estimated parameter is insignificant for all size-classes. For small firms the
results actually suggest a negative relationship between the propensity to apply for patents and
location in Gothenburg or Malmo. The count data coefficient for large Malmo-firms, however, is
positive and significant at the 5% level. Looking then at the importance of specialization, the results
shown at the bottom of Table 7 indicate an interesting difference between micro firms and small firms
on the one hand, and micro firms and larger firms on the other. The coefficients from the binary model
and the count data models also suggest that only larger firms with more than 25 employees benefit
from location in a region with the same specialization as the observed firm.
Based on a large and expanding literature on the advantages of agglomerations, we expect the
metropolitan variables to be correlated with patent application for the two smaller size-groups as well.
How can the surprising results be explained? One plausible interpretation is that we show that the

- 18 -
finding for innovative firms in general is not applicable to very small firms. This group of firms is
distinguished in many respects and, due to the lack of systematic studies, we implicitly assume that
what is true for large innovators is also true for small innovators. Another possible explanation might
be our choice of innovation proxy, i.e. patent applications. We consider applications not adjusted for
quality (by citations and oppositions, etc). Recent research on Swedish data shows that the
concentration of quality-adjusted patents to metropolitan regions is much higher than for raw counts of
patents (Ejermo 2007). However, since we are controlling for factors such as technology intensity,
research intensity (captured by skilled labours) and firm size, the differences in quality are at least
partly accounted for in the regressions.
- 19 -
6. SUMMARY AND CONCLUSIONS One out of three Swedish manufacturing firms applying for national patent protection is a micro firm
(1-10 employees) or a small firm (11-25 employees). The situation is similar in other countries and
reflects the importance of small firms in national innovation systems. Yet, despite broad agreement on
the strategic role of SMEs in industrial renewal processes there is a lack of systematized and
comprehensive information about the nature and level of the small innovative firm. In particular, there
is a ‘knowledge gap’ as regards characteristics of the small innovative firm. This bias is partly
explained by an empirical shadow created by the limited availability of detailed data on small firms for
comparable firm-level analysis.
Based on extensive, matched databases and unique identification of each firm, this paper adds to the
understanding of the roles of micro firms and other very small innovative firms in research-based as
well as tradition-based manufacture. We use patent applications as an indicator of innovative activities
and explain variations of innovation across firms with an extensive and almost unique set of
information on individual observations. The focus is on micro and small firms while firms with more
than 25 employees serve as a reference group. The data consists of close to 160 000 observations of
manufacturing firms in Sweden over the period 2000-2006.
Several interesting findings are reported in the descriptive statistics. First, the fraction of patent
applicants differs considerably across the size-classes. While only 0.3 % of the micro firms applied for
one or more patents during the period, the corresponding fraction for “large” (more than 25
employees) is 6 %. Second, within the three size-classes, patenting firms have 3-5 times more skilled
labor than non-patenting firms. Third, innovative firms (both small and larger) have larger profit
margins and better access to bank loans. Fourth, a substantially larger fraction of patent applicants is
associated with a Swedish MNE compared to non-patenting firms, and patenting firms tend to be more
high technology-intensive than other firms. We also find a large degree of persistency in the sample.
More than 99% of both small and large firms that did not apply for a patent one year did not apply the
next year. Considering patent applicants, 50% of firms with more than 25 employees that applied one
year also applied the next year. The corresponding figure for micro firms is 17%.
Based on patent applications, the empirical analysis applies non-linear binary and count-data models
to explain innovative activity across firms. We evaluate propositions and arguments in three strands of
the innovation literature. The first is the neo-Schumpeterian literature and the resource based view of
the firm (RBV), suggesting the importance of firm characteristics such as firm size, physical capital,
human capital, R&D, internal and external financial sources and industry classification. The second
strand is the branch of trade literature focusing on technological diffusion across borders through trade

- 20 -
and foreign direct investments. A third strand is the literature on agglomeration economies suggesting
the importance of proximity, clustering and face-to-face contacts for localized knowledge spillovers.
The following facts emerge: (i) The probability of applying for a patent and the number of
applications are neutral with respect to profitability, access to external financing, and physical capital
among micro firms (1-10 employees) and small firms (11-25 employees), (ii) at the margin, one more
skilled worker is much more important for micro firms than for other firms, (iii) the patent
performance of all size-categories of firms is closely correlated with a domestic multinational firm,
(iv) the propensity to apply for a patent and the number of applications are an increasing function of
the extension of exports to G7, the most R&D-region in the world, and (v) controlling for observable
and unobservable firm characteristics, no positive agglomeration-impact on patent application can be
found for micro firms or small firms.
The summarizing finding is that we provide new insights into the roles of innovative micro firms.
Successful results of their innovation activities are closely associated with links to both domestic
multinational firms and customers in the G7-region. A skilled labour force is crucial but we do not
find a significant role of either location or financial means. A possible explanation for the latter
finding might be internal support within the corporate group. We also show that innovative micro
firms are distinguished from other innovative firms in several respects.
The research in this paper can be extended in several ways. There is a need to better understand our
puzzling results regarding the importance of profitability, external financing and the local milieu for
patent applications among firms with less than 25 employees. Moreover, this paper focuses on the
association between various characteristics and innovation activity and does not try to assess the
direction of the relationships. One area for future research is thus to assess causality issues associated
with the characteristics considered in this paper. For instance, is the significant relationship between
affiliation to a domestic MNE and innovation in small firms due to the fact that domestic MNEs are
successful in acquiring already innovative firms, or is it due to such an affiliation stimulating
innovation in small firms? Similar questions apply to the firms’ participation in international trade.
Another area for further research is to extend the analysis beyond manufacturing firms. We have
focused on small firms in manufacturing sectors, but there is plenty of evidence that innovation in
service sectors, especially small knowledge-intensive business services (KIBS), plays an important
role in the contemporary economy, which to a large extent is characterized by advanced services.

- 21 -
REFERENCES
Acharya R.C. and W. Keller (2007), “Technology Transfer through Imports”, NBER Working Paper
Acs, Z. J. And D.B Audretsch (1988), “Innovation in Large and Small Firms: an empirical analysis”,
American Economic Review, 78, 678–690
Acs, Z. J. and D.B Audretsch (1991), “Innovation and Size at the Firm Level”, Southern Economic
Journal, 57, 739–744
Acs, Z. J., D.B Audretsch, and M.P Feldman (1994), “R&D Spillovers and Recipient Firm Size”,
Review of Economics and Statistics, 76, 336–340
Acs, Z. J., D.B Audretsch, P. Braunerhjelm and B. Carlsson (2006), “The Knowledge Spillover
Theory of Entrepreneurship”, CESIS WP, Royal Institute of Technology, Stockholm
Acs, Z., L. Anselin and A. Varga (2002), “Patents and Innovation Counts as Measures of Regional
Production of New Knowledge”, Research Policy, 31, 1069-1085
Almeida, P. and B. Kogut (1999), “The Localization of Knowledge and the Mobility of Engineers”,
Management Science, 45, 905–917
Andersson, M and B. Johansson (2008), “Innovation Ideas and Regional Characteristics – innovations
and export entrepreneurship by firms in Swedish regions”, Growth and Change, 39, 193-224
Andersson, M., H. Lööf and S. Johansson (2008), “Productivity and International Trade – firm-level
evidence from a small open economy”, Review of World Economics, 144, 774-801
Audretsch D.B and M.P Feldman (1996), “R&D Spillovers and the Geography of Innovation and
Production”, American Economic Review, 86, 630-640
Audretsch, D.B (2002). “The Dynamic Role of Small Firms – evidence from the US”, Small Business
Economics, 18, 13-40
Baptista, R. (2000), “Do Innovations Diffuse Faster within Geographical Clusters?”, International
Journal of Industrial Organization, 18, 515-535
Barney, J. (1991), “Firm Resources and Sustained Competitive Advantage”, Journal of Management,
17, 99-120
Bartel, A.P and F.R Lichtenberg (1987), “The Comparative Advantage of Educated Workers in
Implementing New Technology”, Review of Economics and Statistics, 69, 1-11
Baumol, W.J (2002), “Entrepreneurship, Innovation and Growth: the David-Goliath symbiosis,”
Journal of Entrepreneurial Finance and Business Ventures, 7, 1-10
Berman, E., J. Bound, Z. Griliches and S. Machin (1998), ”Implications of Skill Biased Technical
Change: international evidence”, Quarterly Journal of Economics, 113, 1245-1279
Cameron, C and P. Trivedi (2008), Applied Microeconometrics using STATA, STATA Press, New
York
Coe, D and E. Helpman (1995), “International R&D Spillovers”, European Economic Review, 39,
859-887

- 22 -
Cohen W (1995), “Empirical Studies in Innovative Activity”, in P Stoneman (ed), Handbook of the
Economics of Innovation and Technological Change, Blackwell, Oxford, 182-264
Cohen, W and D. Levinthal (1990), “Absorptive Capacity – a new perspective on learning and
innovation”, Administrative Science Quarterly, 35, 128-152
Crépon B., E. Duguet and J. Mairesse (1998), “Research, Innovation, and Productivity: an
econometric analysis at the firm level”, Economics of Innovation and New Technology, 7, 115-
156
Dachs, B., B. Ebersberger and H. Lööf (2008), “The Innovative Performance of Foreign-owned
Enterprises in Small Open Economies”, Journal of Technology Transfer, 33, 393-406
Davidsson, P., L. Lindmark and C. Olofsson (1994), “New Firm Formation and Regional
Development in Sweden”, Regional Studies, 28, 395-410
de Jong, P (2007), “The Relationship between Capital Investment and R&D Spending: a panel
cointegration analysis”, Applied Financial Economics, 17, 871-880
Duranton, G and D. Puga (2001), “Nursery Cities: urban diversity, process innovation, and the life
cycle of products”, American Economic Review, 91, 1454–1477
Ejermo, O (2007), “Regional Innovation Measured by Patent Data – does quality matter?”, CIRCLE
Working Paper 2007-8
Feldman, M (1999), “The New Economics of Innovation, Spillovers and Agglomeration – a review of
empirical studies”, Economics of Innovation and New Technology, 8, 5-25
Granstrand, O and S. Sjölander (1990), “The Acquisition of Technology and Small Firms by Large
Firms”, Journal of Economic Behavior and Organization, 13, 367-386
Greenaway, D and R. Kneller (2007a), “Firm Heterogeneity, Exporting and Foreign Direct
Investment”, Economic Journal, 117, 134-161
Griliches, Z (1990), “Patent Statistics as Economic Indicators – a survey”, Journal of Economic
Literature, 28, 1661-1707
Hall, B.H. (2005). “The Financing of Innovation,” in Shane, S. (ed.), Blackwell Handbook of
Technology and Innovation Management, Oxford: Blackwell Publishers, Ltd
Himmerlfarb, C and B. Petersen (1994), “R&D and Internal Finance – a panel study of small firms in
high-technology industries”, Review of Economics and Statistics, 76, 38-51
Hoover, E (1937), Location Theory and the Shoe and Leather Industries, Harvard University Press,
Cambridge
Hulten C.R (2002), “Total Factor Productivity: a short biography, in Dean E.R and M.J Harper (eds.)
New Developments in Productivity Analysis, National Bureau of Economic Research (Studies in
Income and Wealth)
Iversen, E.J., I. Mäkinen, H. Lööf, O. Dong-hyan, S.T Jespersen, M. Junge and J. Bech (2008), “Small
Nordic Enterprises - developing IPR in Global Competition”. Nordic Innovation Centre,
Research report.

- 23 -
Jaffe, A. (1989), “Real Effects of Academic Research”, American Economic Review, 79, 957–970.
Jaffe, A., M. Trajtenberg, M. and R. Henderson (1993), “Geographic Localization of Knowledge
Spillovers as Evidenced by Patent Citations”, Quarterly Journal of Economics, 63, 577–598.
Johansson, B and H. Lööf (2008), “Innovation Activities Explained by Firm Attributes and Location”,
Economics of Innovation and New Technology, 17, 533-552
Keller, W (2004), “International Technology Diffusion”, Journal of Economic Literature, 42, 752-782
Kleinknecht, A and P Mohnen (eds.) (2002) Innovation and Firm Performance: econometric
explorations of survey data, Palgrave, Basingstoke
Klette, T. J and S. Kortum (2004), “Innovating Firms and Aggregate Innovation”, Journal of Political
Economy, 112, 896-1018
Lööf, H and M. Andersson (2009), “Imports, Productivity and the Origin Markets – the role of
knowledge intensive economies”, World Economy, forthcoming
Machin, S and J. van Reenen (1998), “Technology and Changes in Skill Structure: Evidence from
Seven OECD Countries”, Quarterly Journal of Economics, 113, 1215-1244
Malerba, F and L. Orsenigo (1993), “Technological Regimes and Firm Behavior”, Industrial and
Corporate Change, 2, 45-74.
Marshall, A. (1920), Principles of Economics, MacMillan, London
Ohlin, B. (1933), Interregional and International Trade, Harvard University Press, Cambridge
Patel, P. and K. Pavitt, (1991), “Large Firms in the Production of the World's Technology: an
important case of non-globalization”, Journal of International Business Studies, 22, 1-21
Pavitt, K (1984), “Sectoral Patterns of Technical Change – towards a taxonomy and a theory”,
Research Policy, 134, 343-373
Penrose, E.T (1959), The Theory of the Growth of the Firm, John Wiley & Sons, New York
Pfaffermayr, M and C. Bellak (2002), “Why Foreign-owned Firms are Different: a conceptual
framework and empirical evidence for Austria”, in R. Jungnickel (ed.), Foreign-owned Firms:
are they different?, Palgrave Macmillan, 13-57
Rivera-Batiz, L and P. Romer (1991) “International Trade with Endogenous Technological Change”,
European Economic Review, 35, 971-1001
Rothwell, R (1989), “Small Firms, Innovation and Technological Change”, Small Business
Economics, 1, 51-64
Scherer F.M (1999), New Perspectives on Economic Growth and Technological Innovation,
Brookings Institution Press, Washington
Schumpeter, J. A. (1934). The Theory of Economic Development (8 ed.), Harvard University Press,
Cambridge
van Marrewijk (2002), International Trade and the World Economy, Oxford University Press, Oxford
Vernon, R (1966), “International Investment and International Trade in the Product Cycle”, Quarterly
Journal of Economics, 80, 190-207
- 24 -
Wagner, J. (2007), “Exports and Productivity - a survey of the evidence from firm level data”, World
Economy, 30, 60-82
TABLE SECTION
Table 1 Summary statistics. Firm characteristics over the period 2000-2006 1-10 Emp 11-25 Emp 26- Emp All Pat All Pat All Pat
Observations 112,684 374 22,812 261 22,298 1,315 Patent applicants 0.3 % 100 % 1.1% 100 % 5.9% 100 % Patent applications <0.1 1.3 0.2 1.3 0.3 5.1 Employment 3.7 4.3 16.2 17.3 170.3 617.2 Ordinary labour 3.5 3.3 15.4 15.1 148.4 488.7 Skilled labour 0.2 1.0 0.8 2.2 21.9 128.5 Profit margin 4.6 % 5.1 % 2.5% 3.1% 2.7% 6.5% Short term debt per emp1 25.1 45.5 28.8 44.1 39.5 65.5
Non-affiliate 82.5% 67.2% 49.2% 36.4% 14.9% 6.0% Uninational 14.1% 18.5% 35.7% 31.4% 28.8% 7.7% Swedish MNE 1.9% 10.0% 9.3% 23.8% 31.8% 49.5% Foreign MNE 1.5% 4.3% 5.8% 8.4% 25.5% 36.8%
High technology 6.8% 22.6% 5.4% 16.4% 6.1% 16.9% High med. technology 16.7% 32.0% 21.1% 38.3% 29.2% 46.8% Low med. technology 33.5% 29.0% 35,6% 31.0% 30.5% 24.7% Low technology 43.0% 16.4% 37.8% 14.1% 34.2% 11.6%
Note (1) 1000 Euros

- 25 -
Table 2 Summary statistics. Trade characteristics over the period 2000-2006 1-10 Emp 11-25 Emp 26- Emp All Pat All Pat All Pat
G7-exports/total exports, % 3.3 19.9 10.6 27.5 24.5 39.8 Export countries 0.7 3.0 3.4 12.6 14.7 36.5 Only exports, no imports, % 10.6 14.5 17.5 13.0 7.8 1.9 G7-imports/total imports, % 5.7 21.9 14.6 31.0 30.7 46.0 Import countries 0.5 1.5 1.9 4.3 7.9 17.4 Only imports, no exports, % 6.7 0.8 7.8 4.5 5.1 0.8 Exports and imports, % 12.4 45.4 41.5 74.3 78.7 96.5

- 26 -
Table 3 Summary statistics. Regional characteristics over the period 2000-2006 1-10 Emp 11-25 Emp 26- Emp All Pat All Pat All Pat
Stockholm 19.8 21.0 14.4 17.6 11.0 14.9 Gothenborg 9.8 10.8 8.8 5.7 8.4 9.4 Malmo 6.1 5.4 5.8 4.6 6.2 7.3 Emp-share LA region 11.2 10.9 12.5 11.4 13.8 13.5

- 27 -
Table 4 Patent application Basic model Model Logit
Zero-inflated
Negative binominal Negative binominal
Dep variable
Application dummy Number of applications Number of applications
Firm size 1-10 11-25 26- 1-10 11-25 26- 1-10 11-25 26-
Profit marg -0.287 0.820 1.940 A 0.168 0.504 2.421A -0.175 1.250 C 0.998 A
(0.489) (0.257) (0.000) (0.645) (0.474) (0.000) (0.646) (0.060) (0.000)
Short Debt 0.001 0.000 0.000 0.002 -0.001 0.007 A 0.001 0.001 0.000
(0.380) (0.875) (0.397) (0.132) (0.537) (0.000) (0.163) (0.359) (0.923)
Phys cap 0.000 -0.000 0.000 0.001 0.006 A 0.000 0.000 0.001 0.001
(0.920) (0.965) (0.587) (0.235) (0.007) (0.688) (0.836) (0.631) (0.212)
Skilled lab 0.753 A 0.221 A 0.000 C 0.584 A 0.124 B 0.002 A 0.600 A 0.191 A -0.000
(0.000) (0.000) (0.091) (0.000) (0.016) (0.000) (0.000) (0.000) (0.414)
Ordinary lab 0.014 0.036 C 0.001 A -0.1957 A -0.065 C 0.000 A 0.003 0.032 C 0.000 A
(0.640) (0.076) (0.000) (0.000) (0.084) (0.003) (0.913) (0.071) (0.000)
Dom-UNI 0.131 -0.026 -0.404 C 0.204 0.130 -0.617 A 0.152 -0.077 -0.420 B
(0.501) (0.897) (0.076) (0.184) (0.417) (0.000) (0.375) (0.678) (0.024)
Dom-MNE 1.053 A 0.720 A 1.118 A 0.814 A 0.681 A 0.712 A 1.076 A 0.528 A 0.904 A
(0.001) (0.004) (0.000) (0.002) (0.001) (0.000) (0.000) (0.021) (0.000)
For-MNE 0.251 0.111 1.125 A 0.280 0.276 0.359 B 0.167 0.124 0.869 A
(0.529) (0.753) (0.000) (0.399) (0.323) (0.017) (0.621) (0.689) (0.000)
High Tech 2.252 A 1.835 A 3.021 A 1.797 A 2.074 A 2.427 A 2.022 A 1.800 A 1.799 A
(0.000) (0.000) (0.000) (0.000) (0.000) (0.000) (0.000) (0.000) (0.000)
High-med 1.774 A 1.697 A 2.147 A 1.603 A 1.497 A 1.727 A 1.583 A 1.612 A 1.546 A
(0.000) (0.000) (0.000) (0.000) (0.000) (0.000) (0.000) (0.000) (0.000)
Low medium 1.090 A 0.994 A 1.297 A 0.977 A 0.945 A 1.172 A 0.940 A 0.962 A 0.947 A
(0.000) (0.000) (0.000) (0.000) (0.000) (0.000) (0.000) (0.000) (0.000)
Obs 112 684 22 812 22 298 112 684 22 812 22 298 112 684 22 812 22 298
Notes C significant at 10%; B significant at 5%; A significant at 1%. p values in parentheses. (1) Reference is domestic non-affiliate firms (2) Reference is low technology firms

- 28 -
Year dummies included

- 29 -
Table 5 Patent application Basic model augmented with export and other trade characteristics Model Logit
Zero-inflated
Negative binominal Negative binominal
Dep variable
Application dummy Number of applications Number of applications
Firm size 1-10 11-25 26- 1-10 11-25 26- 1-10 11-25 26-
G7-export 0.702 A 0.363 0.723 A 0.895 A 0.225 0.395 A 0.535B 0.197 0.426 A
(0.006) (0.243) (0.001) (0.000) (0.383) (0.006) (0.014) (0.479) (0.006)
Exp-c 0.023 0.071A 0.044 A 0.013 0.062 A 0.026 A 0.018 0.064 A 0.026 A
(0.166) (0.000) (0.000) (0.366) (0.000) (0.000) (0.258) (0.000)***
(0.000)***
Export dum 1.009 A 1.038 A 1.192 B 0.926 A 0.690 B -0.239 0.976 0.936 0.867
(0.000) (0.002) (0.016) (0.000) (0.011) (0.387) (0.000)***
(0.002)***
(0.029)**
Import dum 0.756 A 0.808 C 1.029 C 0.677 A 0.496 -0.474 0.731 0.593 0.611
(0.002) (0.051) (0.061) (0.002) (0.174) (0.147) (0.001)***
(0.118) (0.179)
Expimp dum 1.414 A 1.071 A 1.401 A 1.304 A 0.880 A -0.061 1.375 A 0.992 A 1.219 A
(0.000) (0.000) (0.001) (0.000) (0.000) (0.755) (0.000) (0.000) (0.000)
Obs 112 684 22 812 22 298 112 684 22 812 22 298 112 684 22 812 22 298
Notes C significant at 10%; B significant at 5%; A significant at 1%. p values in parentheses. Additional covariates included are profit margin, short-term debt per employee, physical capital per employee, skilled labour, ordinary labour, corporate ownership structure, sector dummies and year dummies. See Table 4.

- 30 -
Table 6 Patent application Basic model augmented with import and other trade characteristics Model Logit
Zero-inflated
Negative binominal Negative binominal
Dep variable
Application dummy Number of applications Number of applications
Firm size 1-10 11-25 26- 1-10 11-25 26- 1-10 11-25 26-
G7-imports 0.201 0.135 0.579 A -0.063 0.084 0.581 A 0.072 0.007 0.497 A
(0.385) (0.601) (0.001) (0.771) (0.705) (0.000) (0.717) (0.974) (0.000)
Imp-c 0.039 B 0.068 A 0.084 A 0.041 0.062 A 0.052 A 0.039 0.053 B 0.045 A
(0.329) (0.006) (0.000) (0.251) (0.005) (0.000) (0.325) (0.021) (0.000)
Export dum 1.171 A 1.332 A 1.565 A 1.086 A 0.959 A -0.070 1.102 A 1.191A 1.067 A
(0.000) (0.000) (0.002) (0.000) (0.000) (0.799) (0.000) (0.000) (0.007)
Import dum 0.616 B 0.595 0.655 0.613 A 0.312 -0.866 A 0.635 A 0.420 0.324
(0.019) (0.164) (0.245) (0.010) (0.412) (0.009) (0.007) (0.281) (0.482)
Expimp dum 1.509 A 1.413 A 1.430 A 1.496 A 1.209A -0.194 1.467 A 1.334 A 1.190 A
(0.000) (0.000) (0.001) (0.000) (0.000) (0.323) (0.000) (0.000) (0.001)
Obs 112 684 22 812 22 298 112 684 22 812 22 298 112 684 22 812 22 298
Notes C significant at 10%; B significant at 5%; A significant at 1%. p values in parentheses. Additional covariates included are profit margin, short-term debt per employee, physical capital per employee, skilled labour, ordinary labour, corporate ownership structure, sector dummies and year dummies. See Table 4.

- 31 -
Table 7 Patent application Basic model augmented with regional characteristics Model Logit
Zero-inflated
Negative binominal Negative binominal
Dep variable
Application dummy Number of applications Number of applications
Firm size 1-10 11-25 26- 1-10 11-25 26- 1-10 11-25 26-
Stockholm1 -0.166 -0.461 -0.123 -0.075 -0.076 0.167 -0.107 -0.277 0.021
(0.418) (0.110) (0.587) (0.637) (0.709) (0.164) (0.555) (0.269) (0.889)
Gothenborg1 -0.217 -1.012 A -0.104 -0.211 -1.033 A 0.045 -0.233 -1.025 A -0.241
(0.390) (0.009) (0.674) (0.290) (0.001) (0.747) (0.310) (0.004) (0.155)
Malmo1 -0.558 -0.894 B 0.425 -0.514 C -0.785 B -0.065 -0.493 -0.628 0.452 B
(0.102) (0.048) (0.110) (0.056) (0.027) (0.677) (0.111) (0.112) (0.021)
Emp-share 1.283 -1.104 1.325 C 0.946 -0.456 0.743 B 1.071 -0.769 1.029 B
(0.152) (0.342) (0.069) (0.175) (0.605) (0.047) (0.167) (0.459) (0.036)
Obs 112 684 22 812 22 298 112 684 22 812 22 298 112 684 22 812 22 298
Notes C significant at 10%; B significant at 5%; A significant at 1%. p values in parentheses. (1) Reference alternative is Rest of Sweden Additional covariates included are profit margin, short-term debt per employee, physical capital per employee,
skilled labour, ordinary labour, corporate ownership structure, sector dummies and year dummies. See Table 3.


