
KINETIC PARAMETER ESTIMATION IN AMMONIA
SYNTHESIS REACTION THROUGH NONLINEAR
REGRESSION.
DISSERTATION
DANESHWARAN SATIMURTY
CHEMICAL ENGINEERING DEPARTMENT
13784
May 2014
CERTIFICATION OF APPROVAL
KINETIC PARAMETER ESTIMATION IN AMMONIA SYNTHESIS REACTION
THROUGH NONLINEAR REGRESSION.
by
DANESHWARAN A/L SATIMURTY
A project dissertation submitted to the
Chemical Engineering Programme
Universiti Teknologi PETRONAS
in partial fulfilment of the requirement for the
BACHELOR OF ENGINEERING (Hons)
(CHEMICAL ENGINEERING)
Approved by,
(Dr ABRAR INAYAT)
Course coordinator FYP 2
UNIVERSITI TEKNOLOGI PETRONAS
TRONOH, PERAK
MAY 2014
CERTIFICATION OF ORIGINALITY
This is to certify that I am responsible for the work submitted in this project, that the original
work is my own except as specified in the references and acknowledgements, and that the
original work contained herein have not been undertaken or done by unspecified sources or
persons.
(DANESHWARAN A/L SATIMURTY
iv
TABLE OF CONTENTS
ABSTRACT ...................................................................................................................................................... 1
ACKNOWLEDGEMENT ................................................................................................................................... 1
INTRODUCTION ............................................................................................................................................. 2
PROBLEM STATEMENT .................................................................................................................................. 3
OBJECTIVE ..................................................................................................................................................... 3
SCOPE OF STUDY ........................................................................................................................................... 3
LITERATURE REVIEW ..................................................................................................................................... 4
METHODOLOGY ............................................................................................................................................ 6
PROJECT FLOW .......................................................................................................................................... 6
Modeling of Ammonia Synthesis Reactor ................................................................................................. 7
Rate expression ......................................................................................................................................... 9
Activity coefficient .................................................................................................................................... 9
Final expression ...................................................................................................................................... 10
Project activities and key milestones (FYP 1 and FYP 2) ......................................................................... 11
RESULTS AND DISCUSSION.......................................................................................................................... 12
CONCLUSION ............................................................................................................................................... 15
REFERENCES ................................................................................................................................................ 16
APPENDICES ................................................................................................................................................ 17
NOMENCLATURES ....................................................................................................................................... 18
NLR STATISTICS ........................................................................................................................................... 19

v
LIST OF FIGURES
Figure 1 Project flow of project 6
Figure 2 Parity diagram obtained for an ammonia synthesis reaction using 14
KMIR HaldorTops⊘e catalyst
Figure 3 Number of iterations estimated using PSO algorithm 14
LIST OF TABLES
Table 1 Activities and milestone (FYP1) 11
Table 2 Activities and milestone (FYP2) 11
Table 3 DGLCPSO parameters 13
Table 4 Estimated activation energy for an ammonia synthesis reaction 13

1
ABSTRACT
Ammonia synthesis optimization is of high interest in industry as market expands and
demand increases. The optimization is made possible through fractional conversion of nitrogen
in a reaction. Material balance is performed across bed of KMIR HaldorTopsoe catalyst before
model equation of reaction is obtained. Next part of this project is kinetic parameter estimation in
ammonia synthesis reaction. The two main parameters estimated are the pre- exponential factor
and activation energy. The rate expression is done through Temkin equation 1950. Transitional
state theory and statistical thermodynamics are used to obtain pre-exponential factor calculation.
Sackur- Tetrode equation is used to calculate translational entropy and Yamada and Gunn (1973)
correlation is used to calculate molar volume. The activation energy is calculated by minimizing
residual sum of squares errors between experimental data and model calculated values.
ACKNOWLEDGEMENT
First and foremost, I would like to thank Universiti Teknologi Petronas for providing me
with the opportunity to perform the final year project. I would also like to extend my highest
gratitude to my supervisor, Dr. Periyasamy Balasubramaniam, who throughout the duration of
my final year project has tirelessly aided and guided me for the project. Additionally, I am also
grateful to the post-graduate students who have helped me through guidance and advice for my
project. I would also like to thank my parents for their continuous support and encouragement
which enabled me to complete the project.

2
INTRODUCTION
Ammonia synthesis is an important process in chemical developments. Ammonia is the
initial chemical material for variety of industries. It is used in chemical fertilizers production,
explosive materials, polymers, acids and even coolers. Kinetic modeling can play an important
role to give an insight of the industrial units and hence modeling of Ammonia unit is very
important to help us investigate different operation modes of this unit which better understanding
off its bottleneck can led us to make the operation yield higher than before.
Supply for nitrogen based fertilizers was not able to meet the worldwide demand in
twentieth century. Scientists step up to solve the problem of the world’s dependence on fast
disappearing natural sources of ammonia. Processes such as thermal processing to mixed oxides
of nitrogen, cyanide formation, aluminum nitride formation and decomposition to ammonia
showed little commercial promise. In the end, Fritz Haber and Carl Bosch completed ammonia
synthesis.
Catalytic synthesis of ammonia was developed by Haber by utilizing hydrogen and
nitrogen gas which are abundant and inexpensive. (Rossignol, 2009) This synthesis could force
unreactive gases nitrogen and hydrogen to combine into ammonia using high temperature and
high pressure in reactor assisted by iron catalyst. The Haber-Bosch process for ammonia
synthesis was successfully operated in September 1913, was the decisive step into the age of
mineral fertilizers. This innovation became a key driver in the development of the industrialized
society and is still securing the nutrition of billions of people today. The realization of industrial
ammonia synthesis involved high entrepreneurial risks and demanded great staying power.
Process and equipment for this pioneering technology had to be developed from scratch.
Given the massive scale of ammonia production, tiny improvement in efficiency of
ammonia synthesis process can have massive implications for global energy demand. Researches
worldwide have tried to estimate kinetic parameters through various methods such as orthogonal
collocation method combined with Broyden method, polythermal-temperature-ramping reactor
(PTR), hybrid dynamic global and local combined particle swarm optimization. Activation
energy and pre-exponential factor are the two important parameters estimated through non-linear
regression.
3
PROBLEM STATEMENT
Yield of ammonia synthesis will remain the same for years if reaction is not optimized.
Efficiency of the reactor is the core factor that affects the yield of ammonia in a reaction. Hence,
kinetic model of reactor and the parameter of the reaction have to be developed and estimated to
improve overall efficiency of a fixed bed reactor in industrial ammonia synthesis. Previous
analysis is not sufficient to prove accuracy and consistency of experimental results obtained. As
a trial measure, non-linear regression is applied in ammonia synthesis estimation.
OBJECTIVE
To estimate kinetic parameters such as pre exponential factor and activation energy
included in an ammonia synthesis reaction.
SCOPE OF STUDY
Scope of study for this project involves ammonia synthesis reactor modeling and
calculation of frequency factor in rate expression of ammonia synthesis. Previously learned
knowledge on reaction engineering, transitional state-theory and statistical thermodynamics is
required. Once it is done, the kinetic parameter estimation of ammonia synthesis executed using
nonlinear regression. MATLAB tools are used in optimization of parameter estimation where the
calculations done are translated into computer codes.

4
LITERATURE REVIEW
Optimization of ammonia synthesis process highly relies on accurate system model.
Launching a proper mathematical model of ammonia synthesis process is a key problem of
operation optimization. It has received considerable attention since last century. Heterogeneous
simulation models imitating different types of ammonia synthesis reactors have been developed
for design, optimization and control. Through modeling of the reactor, temperature,
concentrations, and pressure profile is obtained. As industrial data is not available along the
length of bed, model testing based on mentioned parameters is achieved at the end of each bed.
As mentioned earlier, the rate of reaction is expressed through Temkin equation 1950.
in which
α : Constant which takes a value from 0.5 to 0.75 in literature
k : Rate constant for reverse reaction in N2 + 3H2 → 2NH3
Kα: Equilibrium constant
α i : Activity
Parameter estimation through non-linear regression was not involved in previous
researchers work. Researchers valued pre-exponential factors, A, and activation energies Ea, of
ammonia synthesis reaction by linear regression method in early stages, and advanced to
HDGLCPSO method which is available after 1995. On the other hand, A is calculated from
transitional state theory and statistical thermodynamics in this project. So,f
transl must first be
calculated before the next step can be taken. Critical properties of ammonia are required together
with aid of Sackur-Tetrode equation in calculating So,f
transl . The entropy at the standard
state,∆So,≠
is then one third of So,f
transl . This is because the molecule loses one degree of freedom
in the reverse reaction.
5
An accuracy of kinetic model generally functions of number of independent parameters.
Its popularity in relation to the process application is an indicative of its mathematical simplicity.
Undoubtedly, linear regression analysis has frequently been employed in accessing the kinetic
modeling of reactor and parameters estimation, primarily owing to its wide usefulness in variety
of modeling process. This reflects the appealing simplicity of its equation. However, during the
last few years, development interest in utilization of non-linear regression in optimization
modeling has been noted. A number of researchers have been sponsored to investigate efficiency
of linear and non-linear regression methods for kinetic parameter estimation in ammonia
synthesis reaction through application of Sackur Tetrode equation, Temkin equation, Levenberg-
Marquardt and Redlich-kwang equation.
6
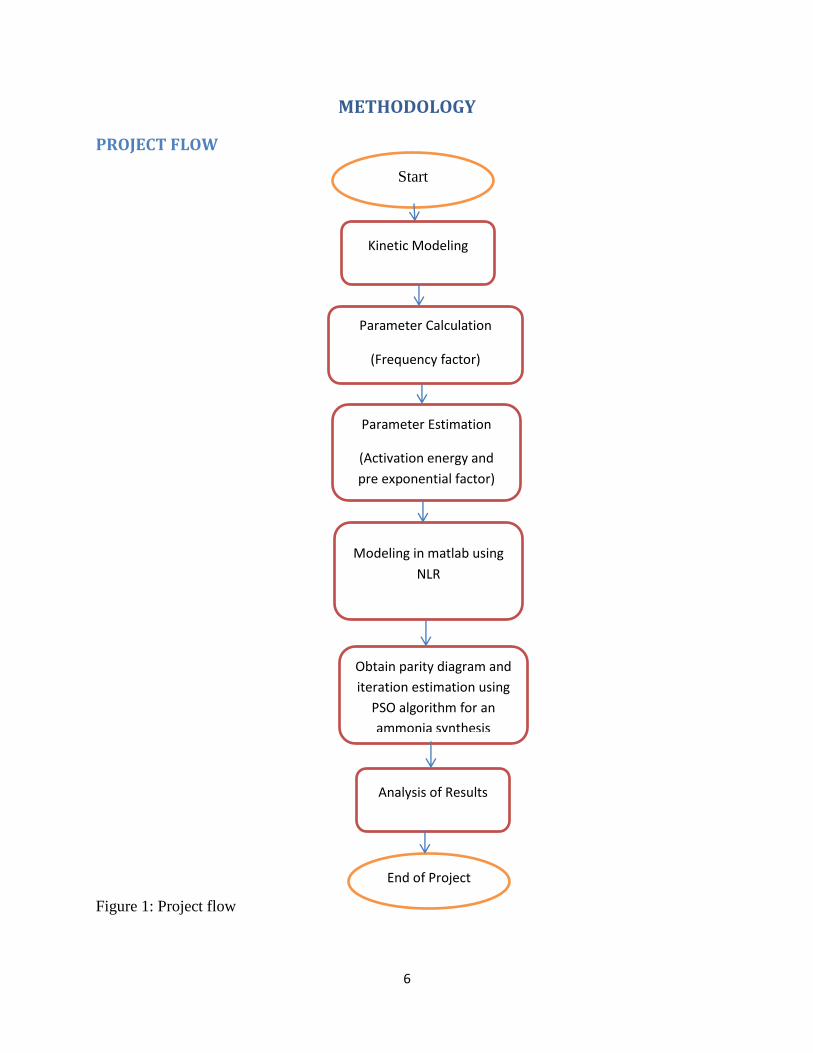
METHODOLOGY
PROJECT FLOW
Figure 1: Project flow
Start
Kinetic Modeling
Parameter Calculation
(Frequency factor)
Parameter Estimation
(Activation energy and
pre exponential factor)
Analysis of Results
End of Project
Modeling in matlab using
NLR
Obtain parity diagram and
iteration estimation using
PSO algorithm for an
ammonia synthesis
7
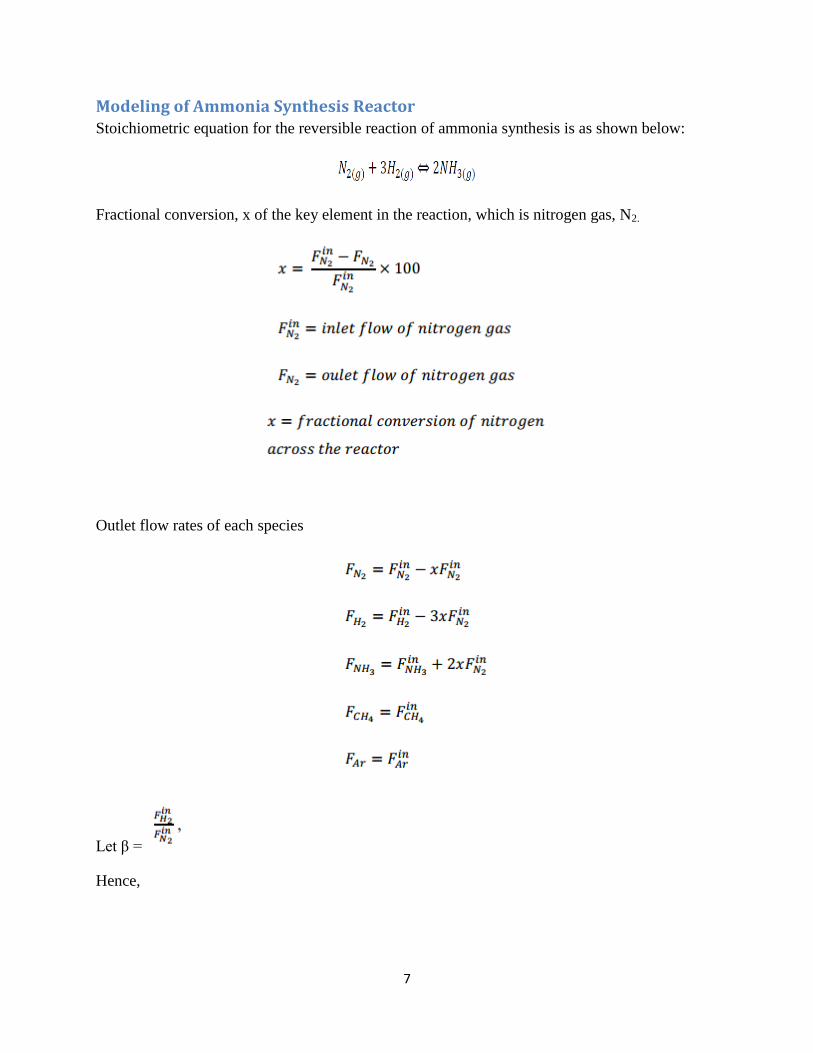
Modeling of Ammonia Synthesis Reactor Stoichiometric equation for the reversible reaction of ammonia synthesis is as shown below:
Fractional conversion, x of the key element in the reaction, which is nitrogen gas, N2.
Outlet flow rates of each species
Let β =
Hence,

8
Mole fraction of each individual component represented as:
Developed model equation is:

9
Rate expression
Temkin equation 1950 is the rate of equation for ammonia synthesis
Where constant α = 0.5
Activity coefficient
Activity coefficient is calculated as follows using the following formula:
ɑi = yi ɣi P
Activity coefficient for Nitrogen and Ammonia using Cooper and Newton correlation:
ɣN2 = 0.93431737 + 0.3101804 × 10⁻³
T + 0.295896 × 10⁻³
P – 0.2707279 × 10⁻⁶
T2 +
0.4775207 × 10⁻⁶
P2
ɣNH3 = 0.1438996 + 0.2028538 × 10⁻²
T – 0.4487672 × 10⁻³
P – 0.1142945 × 10⁻⁵
T2 +
0.2761216 × 10⁻⁶
P2
Activity coefficient for Hydrogen using Cooper and Shaw and Wones:
ɣH2 = exp [ exp (-3.8402T0.125
+ 0.541 ) P – exp ( -0.12635T0.5
- 15.98 ) P2
+ 3w ( exp ( -0.011901T -5.941) ] exp (-P/3w -1)]
10
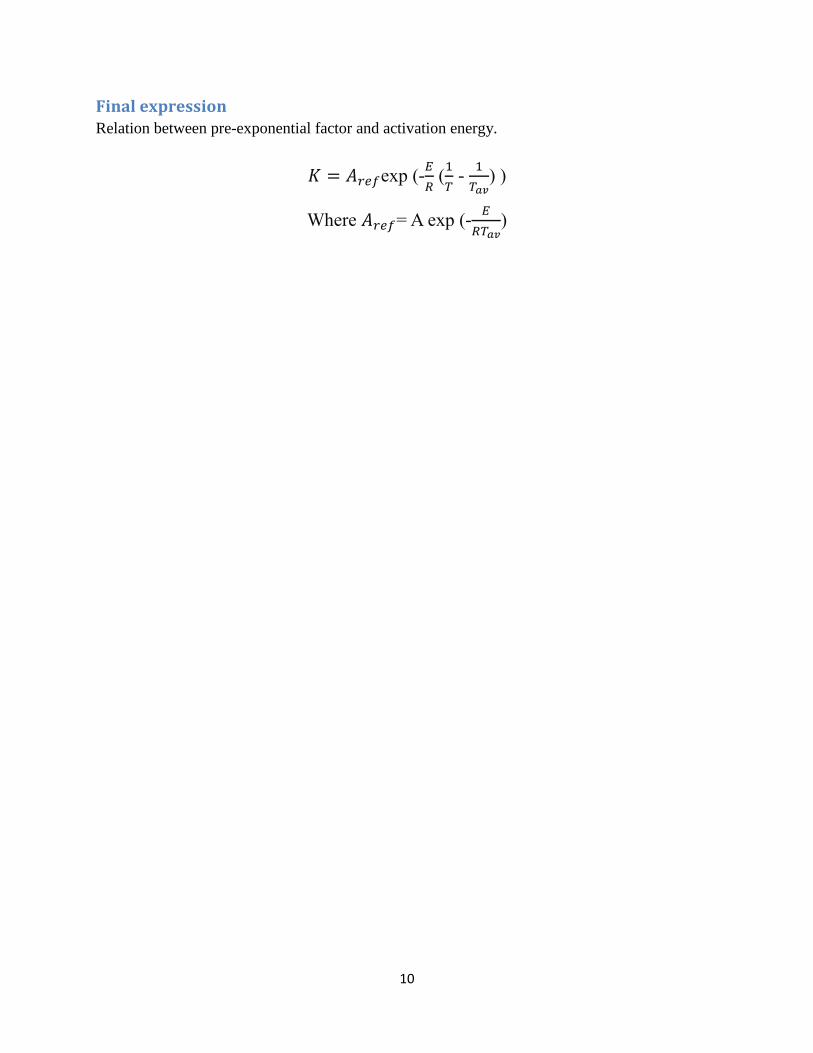
Final expression Relation between pre-exponential factor and activation energy.
𝐾 = 𝐴 exp (-
(
-
) )
Where 𝐴 = A exp (-
)
11
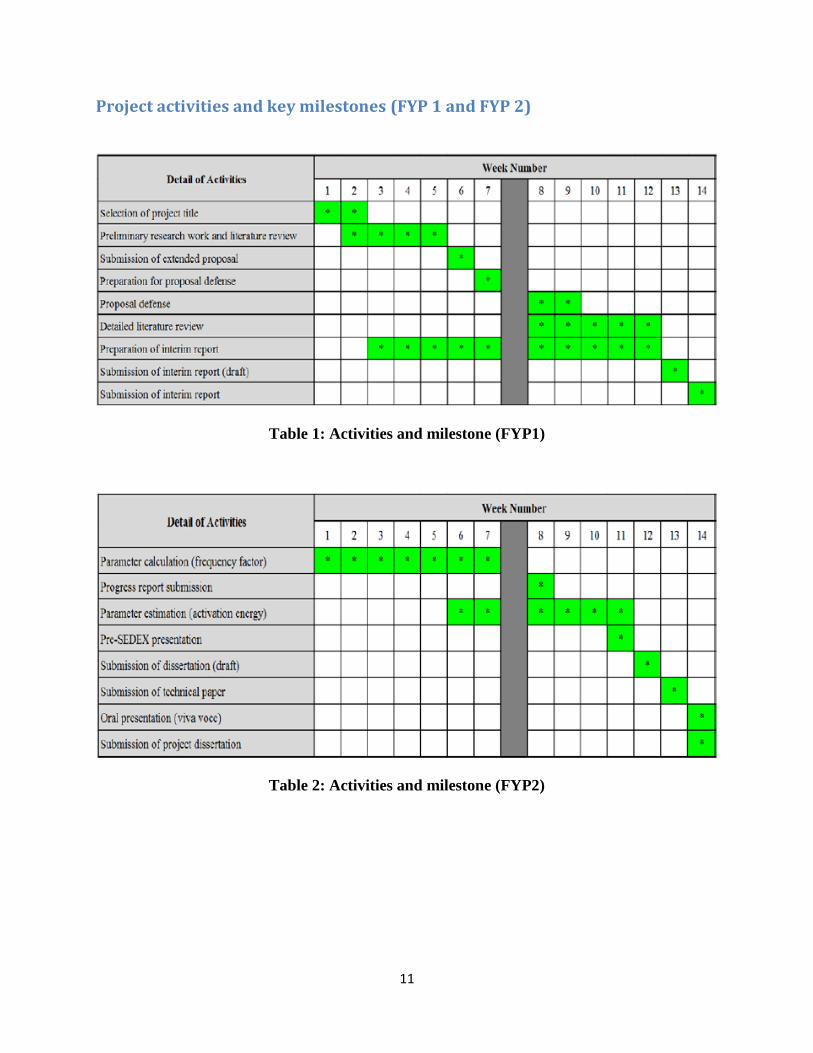
Project activities and key milestones (FYP 1 and FYP 2)
Table 1: Activities and milestone (FYP1)
Table 2: Activities and milestone (FYP2)

12
RESULTS AND DISCUSSION
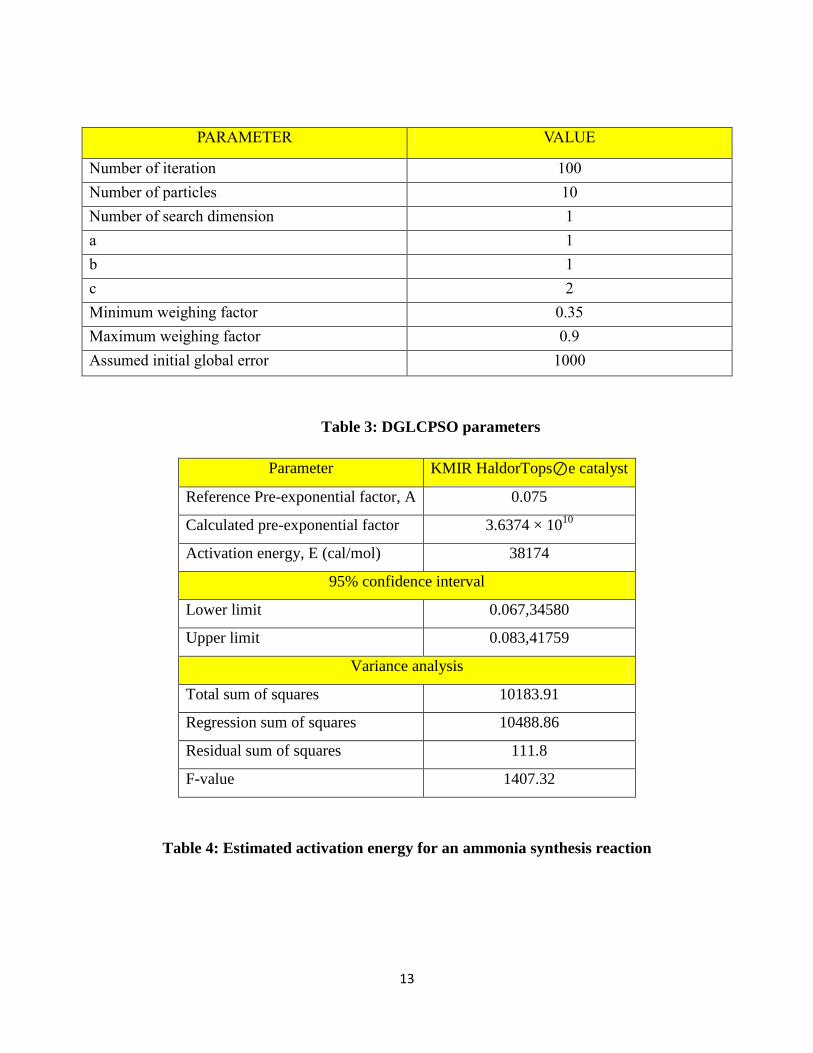
The non-linear regression parameters are presented in Table below. Model calculated
values are determined numerically solving mass balance equation under isothermal condition
using ode23s solver available in MATLAB. Effectiveness factor for commercial KMIR Haldor
Topsoe catalyst is equal to one for laboratory kinetic experimental data. α value is assumed 0.5
for the KMIR Haldor Topsoe catalyst according to Temkin, Dyson and Simon.
Kinetic model validated with Nelson et al. kinetic data using KMIR Haldor Topsoe
catalyst. This catalyst contains 95%Fe, 2%Al2O3, 1.5% K2O and 1.5% CaO with traces of MgO
and SiO2. Density of KMIR Haldor Topsoe catalyst is 2.35 g/cm3. The estimated activation
energy for an ammonia synthesis reaction using KMIR Haldor Topsoe catalyst is 38174 cal/mol.
The calculated pre-exponential factor is 3.6374 × 10 10.
Residual sum of squares obtained is high
and F-value is significant. The range of operating conditions covered by Nelson et al.
experiments is as follow:
Pressure: 149-309 atm
Temperature: 330-4950C
Space velocity: 13200-105600 V/V/h
Ratio H2:N2: 6.23-1.15.
The reported values for pre-exponential factor and activation energy for ammonia
synthesis reaction by Dyson and Simon are 8.849 × 10¹⁴
and 40765 cal/mol at α = 0.5. When
comparing results reported by Dyson and Simon with our obtained value, the estimated
activation energy and pre-exponential factor for KMIR HaldorTops⊘e catalyst through non-
linear regression is very close.
13
PARAMETER VALUE
Number of iteration 100
Number of particles 10
Number of search dimension 1
a 1
b 1
c 2
Minimum weighing factor 0.35
Maximum weighing factor 0.9
Assumed initial global error 1000
Table 3: DGLCPSO parameters
Parameter KMIR HaldorTops⊘e catalyst
Reference Pre-exponential factor, A 0.075
Calculated pre-exponential factor 3.6374 × 10¹⁰
Activation energy, E (cal/mol) 38174
95% confidence interval
Lower limit 0.067,34580
Upper limit 0.083,41759
Variance analysis
Total sum of squares 10183.91
Regression sum of squares 10488.86
Residual sum of squares 111.8
F-value 1407.32
Table 4: Estimated activation energy for an ammonia synthesis reaction

14
Figure 2 : Parity diagram obtained for an ammonia synthesis reaction using KMIR
HaldorTops⊘e catalyst
Figure 3: Number of iterations estimated using PSO algorithm
0 5 10 15 20 25 300
5
10
15
20
25
30
35
yexp
ymod
el
Parity diagram
0 10 20 30 40 50 60 70 80 90 1000
0.5
1
1.5
2
2.5
3
3.5
4x 10
4
Number of iterations
Par
amet
ers
15
CONCLUSION
The pre-exponential factor of reaction calculated through transition state theory and
statistical thermodynamics concept. Activation energy for decomposition of ammonia into
nitrogen and hydrogen is estimated using KMIR Haldor Topsoe catalyst through non-linear
regression. The future results obtained are expected to have high consistency when compared
with the data obtained from literature.
16
REFERENCES
Anders Nielsen, J.K. (1964). Rate Equation and Mechanism of Ammonia Synthesis at Industrial
Conditions. J.catal, 68-79.
Austin, G. (1984). Shreve’s Chemical Process Industries. New York: Mc-Graw-Hill.
Guacci, U., Traina, F., Buzzi Ferraris, G., & Barisone, R. (1977). Application of the Temkin
Equation in the evaluation of catalysts for ammonia synthesis. Ind.Eng.Chem.Process Des.Dev.,
166-176.
Roweis, S. (2002). Levenberg-Marquardt Optimization. Numerical Recipes in C, 683-685.
Singh, C., & Saraf, D. (1979). Simulation of ammonia synthesis reactors. Ind.Eng.Chem.Process
Des.Dev, 364-370.
Rossignol, R. L. (2009). Proffesional Chemist. ChemUCL Newsletter, 1884-1976.
University of Cambridge. (2010, November 17). New Revelations in Ammonia Synthesis.
Ali Dashti, K. K. (2006). Modeling and simulation of ammonia synthesis reactor. Petroleum and
Coal, 15-23.

17
APPENDICES
Dr Kennedy and Dr Eberhart in 1995 proposed the original PSO algorithm. (1)
𝑣𝑝,𝑑𝑘+1
=𝑤𝑣𝑝,𝑑𝑘+𝑐1𝑟1(𝑥𝑝,𝑑
𝑖𝑛𝑑−𝑥𝑝,𝑑𝑘)+𝑐2𝑟2(𝑥𝑑𝑔𝑙𝑜−𝑥𝑝,𝑑
𝑘) .......................... (i)
𝑥𝑝,+1
=𝑥𝑝,𝑑𝑘+𝑣𝑝,𝑑
𝑘+1………………….. (ii)
The rate of reaction can be written as the rate of disappearance of nitrogen gas or hydrogen gas
and this equal to the rate of formation of ammonia gas (2)
=
=
Mass balance calculation performed across catalyst bed. Volume of ∆V equal to catalyst bed. (3)
𝐹𝑁2|𝑉−𝐹𝑁2|𝑉+Δ𝑉+𝑟𝑁2𝜂Δ𝑉=0
Taking the limit of the equation above result in the relation below:
limΔ𝑉→0(
)=−𝑟𝑁2𝜂
= −𝑟𝑁2𝜂
Then,
= −
𝑟𝑁𝐻3𝜂since𝑟𝑁2=
18
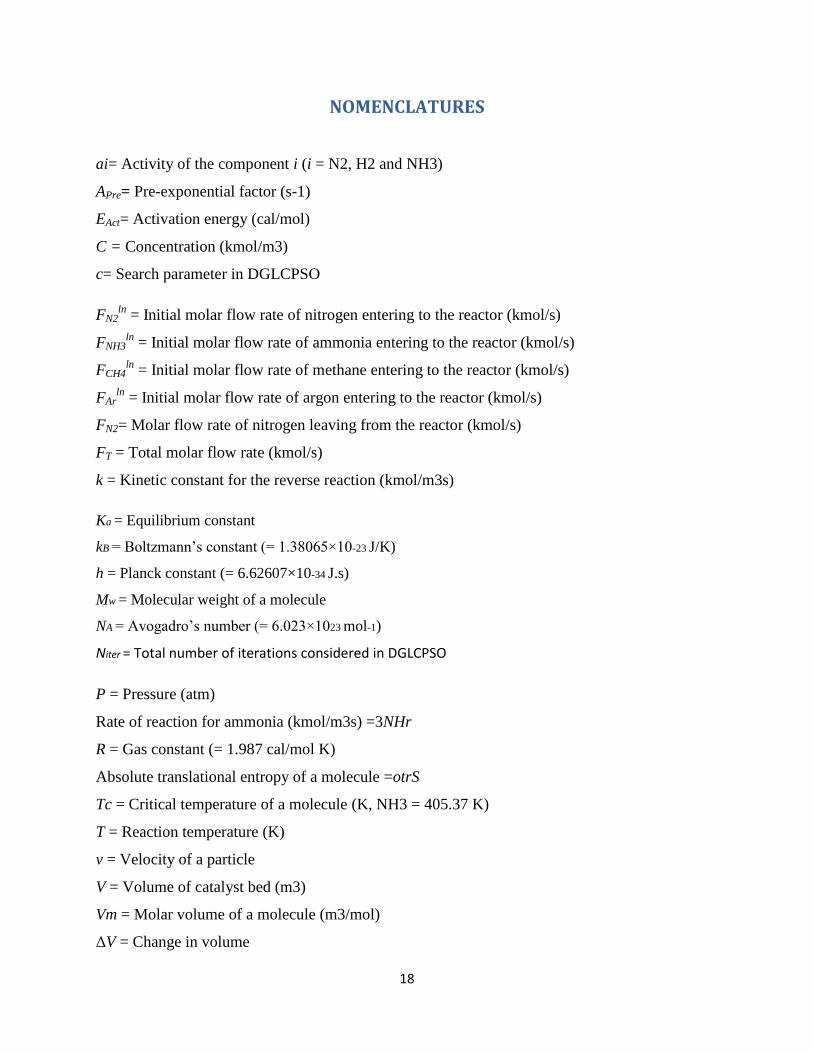
NOMENCLATURES
ai= Activity of the component i (i = N2, H2 and NH3)
APre= Pre-exponential factor (s-1)
EAct= Activation energy (cal/mol)
C = Concentration (kmol/m3)
c= Search parameter in DGLCPSO
FN2ln
= Initial molar flow rate of nitrogen entering to the reactor (kmol/s)
FNH3ln
= Initial molar flow rate of ammonia entering to the reactor (kmol/s)
FCH4ln
= Initial molar flow rate of methane entering to the reactor (kmol/s)
FArln
= Initial molar flow rate of argon entering to the reactor (kmol/s)
FN2= Molar flow rate of nitrogen leaving from the reactor (kmol/s)
FT = Total molar flow rate (kmol/s)
k = Kinetic constant for the reverse reaction (kmol/m3s)
Ka = Equilibrium constant
kB = Boltzmann’s constant (= 1.38065×10⁻²³ J/K)
h = Planck constant (= 6.62607×10⁻³⁴ J.s)
Mw = Molecular weight of a molecule
NA = Avogadro’s number (= 6.023×10²³ mol-1)
Niter = Total number of iterations considered in DGLCPSO
P = Pressure (atm)
Rate of reaction for ammonia (kmol/m3s) =3NHr
R = Gas constant (= 1.987 cal/mol K)
Absolute translational entropy of a molecule =otrS
Tc = Critical temperature of a molecule (K, NH3 = 405.37 K)
T = Reaction temperature (K)
v = Velocity of a particle
V = Volume of catalyst bed (m3)
Vm = Molar volume of a molecule (m3/mol)
ΔV = Change in volume
19
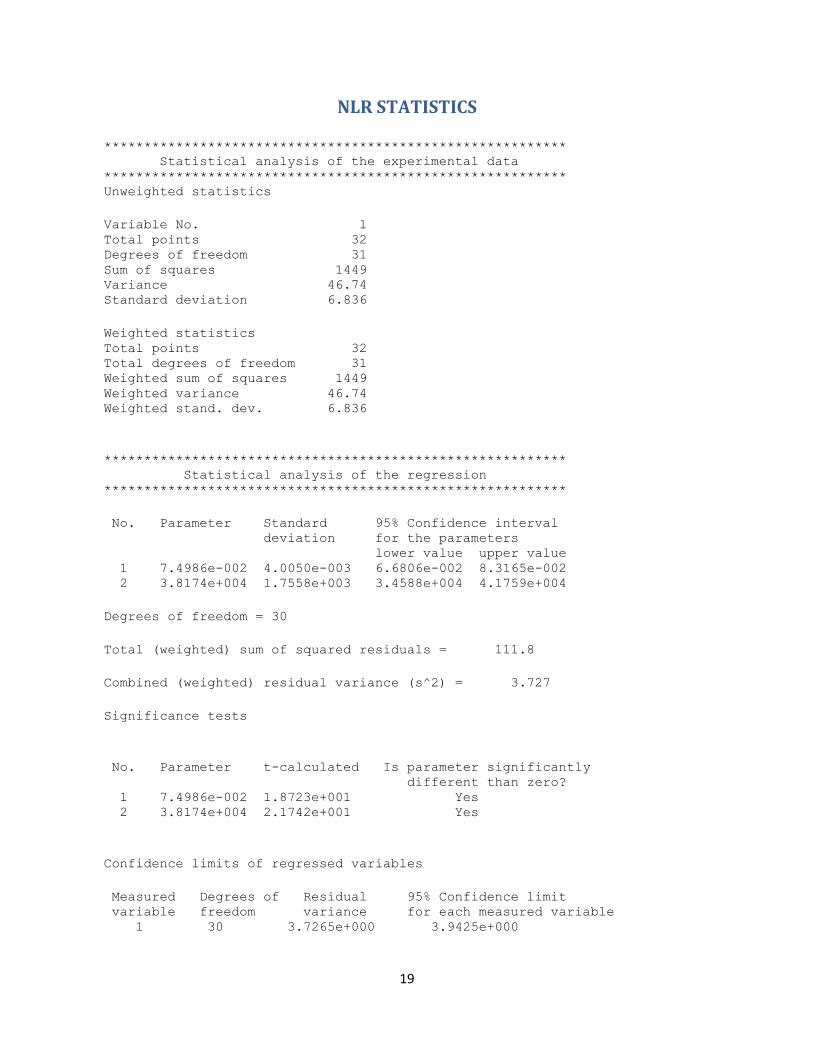
NLR STATISTICS ********************************************************** Statistical analysis of the experimental data ********************************************************** Unweighted statistics
Variable No. 1 Total points 32 Degrees of freedom 31 Sum of squares 1449 Variance 46.74 Standard deviation 6.836
Weighted statistics Total points 32 Total degrees of freedom 31 Weighted sum of squares 1449 Weighted variance 46.74 Weighted stand. dev. 6.836
********************************************************** Statistical analysis of the regression **********************************************************
No. Parameter Standard 95% Confidence interval deviation for the parameters lower value upper value 1 7.4986e-002 4.0050e-003 6.6806e-002 8.3165e-002 2 3.8174e+004 1.7558e+003 3.4588e+004 4.1759e+004
Degrees of freedom = 30
Total (weighted) sum of squared residuals = 111.8
Combined (weighted) residual variance (s^2) = 3.727
Significance tests
No. Parameter t-calculated Is parameter significantly different than zero? 1 7.4986e-002 1.8723e+001 Yes 2 3.8174e+004 2.1742e+001 Yes
Confidence limits of regressed variables
Measured Degrees of Residual 95% Confidence limit variable freedom variance for each measured variable 1 30 3.7265e+000 3.9425e+000
20
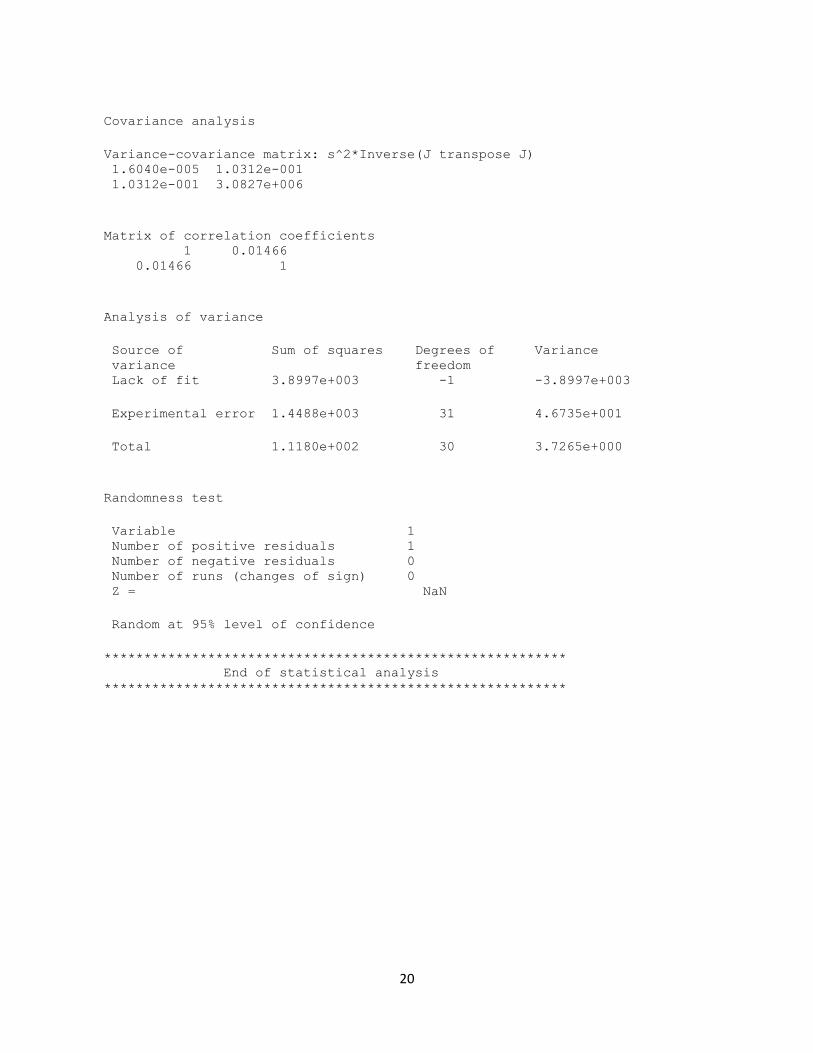
Covariance analysis
Variance-covariance matrix: s^2*Inverse(J transpose J) 1.6040e-005 1.0312e-001 1.0312e-001 3.0827e+006
Matrix of correlation coefficients 1 0.01466 0.01466 1
Analysis of variance
Source of Sum of squares Degrees of Variance variance freedom Lack of fit 3.8997e+003 -1 -3.8997e+003
Experimental error 1.4488e+003 31 4.6735e+001
Total 1.1180e+002 30 3.7265e+000
Randomness test
Variable 1 Number of positive residuals 1 Number of negative residuals 0 Number of runs (changes of sign) 0 Z = NaN
Random at 95% level of confidence
********************************************************** End of statistical analysis **********************************************************


