
KEEI
KEEI
KE
EI
Korea Energy Demand Outlook
ISSN 1599-9009
KoreaEnergy
Dem
andO
utlook December 2011
Decem
ber2011
Volume 13, No. 4QUARTERLY ENERGY OUTLOOK
Korea Energy Economic Institute132 Naesonsunhwan-ro, Uiwang-si, Gyeonggi-do
Phone: (031)420-2114
Fax: (031)422-4958
E-mail : [email protected]
Hompage : http://www.keei.re.kr
Korea
Energy
Econom
icInstitute
에너지수요전망 문13-4 2012.3.8 4:9 PM 페이지1 매일3 MAC2PDF_IN 600DPI 175LPI T

수요전망 내지13-4 문 2012.3.8 4:2 PM 페이지156 매일3 MAC2PDF_IN 600DPI 125LPI T

ISSN 1599-9009
December 2011
Volume 13, No. 4
KEEIKorea Energy Demand Outlook
수요전망 내지13-4 문 2012.3.8 4:2 PM 페이지1 매일3 MAC2PDF_IN 600DPI 125LPI T
·In charge of overall research Choi, Do-young ([email protected])
·Oil/International oil market Kim, Soo-il ([email protected])
·Electricity/Transformation Choi, Do-young ([email protected])
·Coal/International coal market Kim, Tae-heon ([email protected])
·Town gas/Thermal energy Lee, Sang-youl ([email protected])
·International LNG market Lee, Bo-hye ([email protected])
·Material/Research support Hwang, In-wook ([email protected])
·Statistical support Chung, Chang-bong ([email protected])
Phone: +82-31-420-2148, +82-31-420-2234
Fax: +82-31-420-2164
KEEI Korea Energy Demand Outlook
The 「KEEI Korea Energy Demand Outlook」is a report that analyzes trends in theinternational energy market and energy supply/demand trends in Korea, and makesshort-term forecasts on energy demand.
This report quickly identifies recent changes in energy supply and demand, thusproviding various energy supply/demand forecast indexes and information forgovernment policies. It is intended to contribute to government efforts in setting andadjusting an overall policy direction regarding energy supply and demand.
This report was written and edited by the Energy Demand and Supply ForecastTeam under the Center for Energy Information and Statistics of KEEI.
수요전망 내지13-4 문 2012.3.8 4:2 PM 페이지2 매일3 MAC2PDF_IN 600DPI 125LPI T
Summary ……………………………………………………………………………………… 7
Ⅰ. International Energy Market Trends……………………………………………… 33
1. Trends in the international oil market and oil exports/imports………………… 35
2. Trends in the international natural gas market ………………………………… 38
3. Trends in the international coal market…………………………………………… 41
Ⅱ. Economic and Energy Consumption Trends in Korea ……………………… 45
1. Economic trends in Korea ………………………………………………………… 47
2. Trends in primary energy consumption ………………………………………… 51
3. Trends in final energy consumption ……………………………………………… 58
4. Consumption trends of petroleum product ……………………………………… 68
5. Trends in electricity consumption ………………………………………………… 75
6. Trends in LNG and town gas consumption……………………………………… 82
7. Trends in coal and other energy consumption ………………………………… 88
Ⅲ. Energy Demand Outlook for 2012………………………………………………… 93
1. Outlook on the international energy market……………………………………… 95
2. Domestic economic outlook and outlook assumptions……………………… 103
3. Outlook on primary energy demand …………………………………………… 110
4. Outlook on final energy demand ………………………………………………… 116
5. Outlook on petroleum product demand………………………………………… 122
6. Outlook on electricity demand …………………………………………………… 125
7. Outlook on LNG and town gas demand ……………………………………… 130
8. Outlook on coal and other energy demand …………………………………… 134
9. Characteristics and implications ………………………………………………… 139
Reference ………………………………………………………………………………… 150
Appendix …………………………………………………………………………………… 151
Contents
3http://www.keei.re.kr
Summary
Table of Contents for Titles
수요전망 내지13-4 문 2012.3.8 4:2 PM 페이지3 매일3 MAC2PDF_IN 600DPI 125LPI T
KEEI Korea Energy Demand Outlook
4 KOREA ENERGY ECONOMICS INSTITUTE
<Table Ⅰ-1> International crude oil prices ………………………………………………………………35<Table Ⅰ-2> Consumer prices of petroleum products in Korea ……………………………………36<Table Ⅰ-3> Trends in international natural gas supply and demand ………………………………39<Table Ⅰ-4> Trends in international natural gas prices ………………………………………………40<Table Ⅰ-5> Trends in global coal consumption ………………………………………………………42<Table Ⅰ-6> Trends in global coal production …………………………………………………………44
<Table Ⅱ-1> Recent economic trends …………………………………………………………………48<Table Ⅱ-2> Composite index……………………………………………………………………………50<Table Ⅱ-3> Primary energy consumption trends ……………………………………………………53<Table Ⅱ-4> Level of contribution of each factor that led to a rise in primary energy
consumption from January through September 2011 ………………………………56<Table Ⅱ-5> Trends in final energy consumption………………………………………………………59<Table Ⅱ-6> Level of contribution of each factor that triggers a change in energy consumption
in the manufacturing industry from January through September 2011 ……………62<Table Ⅱ-7> Consumption trends of petroleum products by sector ………………………………69<Table Ⅱ-8> Consumption trends of key petroleum products ………………………………………70<Table Ⅱ-9> Trends in electricity consumption…………………………………………………………75<Table Ⅱ-10> Electricity supply and demand in the summer ………………………………………81<Table Ⅱ-11> Trends in LNG consumption ……………………………………………………………82<Table Ⅱ-12> Trends in town gas consumption ………………………………………………………86<Table Ⅱ-13> Trends in coal consumption ……………………………………………………………88<Table Ⅱ-14> Pig iron production and bituminous coal consumption for steel making …………89<Table Ⅱ-15> Trends in consumption of thermal energy, new & renewable energy, and other energy ……91
<Table Ⅲ-1> IEA’s global oil consumptions and forecasts……………………………………………95<Table Ⅲ-2> Oil price outlook by major overseas organizations in September ……………………96<Table Ⅲ-3> International natural gas consumption and outlook ……………………………………97<Table Ⅲ-4> International natural gas production and outlook ………………………………………98<Table Ⅲ-5> Outlook on international natural gas prices ……………………………………………99<Table Ⅲ-6> Outlook on global coal consumption …………………………………………………101<Table Ⅲ-7> Outlook on global coal production ……………………………………………………102<Table Ⅲ-8> Trends in international coal prices and outlook ………………………………………102<Table Ⅲ-9> Economic outlook for 2011 and 2012 …………………………………………………105<Table Ⅲ-10> Economic outlook by major organizations in Korea…………………………………107<Table Ⅲ-11> Economic growth rate assumptions …………………………………………………108
Table of Contents for Tables
수요전망 내지13-4 문 2012.3.8 4:2 PM 페이지4 매일3 MAC2PDF_IN 600DPI 125LPI T

SummaryContents
5http://www.keei.re.kr
<Table Ⅲ-12> Assumptions on temperature variables ………………………………………………108<Table Ⅲ-13> Outlook on primary energy demand …………………………………………………110<Table Ⅲ-14> Key indices related to energy consumption …………………………………………112<Table Ⅲ-15> Outlook on final energy demand………………………………………………………117<Table Ⅲ-16> Outlook on petroleum product demand by sector …………………………………123<Table Ⅲ-17> Outlook on demand for key petroleum products……………………………………124<Table Ⅲ-18> Outlook on electricity demand…………………………………………………………125<Table Ⅲ-19> Trends in GDP elasticity of electricity demand ………………………………………127<Table Ⅲ-20> Outlook on LNG demand………………………………………………………………131<Table Ⅲ-21> Outlook on town gas demand…………………………………………………………133<Table Ⅲ-22> Outlook on coal demand ………………………………………………………………134<Table Ⅲ-23> Outlook on thermal energy, new & renewable energy, and other energy demand …137<Table Ⅲ-24> Outlook on energy intensity ……………………………………………………………142
[Figure Ⅰ-1] Petroleum product import prices and consumer prices ………………………………37[Figure Ⅰ-2] Trends in international natural gas prices…………………………………………………40[Figure Ⅰ-3] International coal price trends………………………………………………………………43
[Figure Ⅱ-1] Business cycle clock ………………………………………………………………………50[Figure Ⅱ-2] Recent economic and primary energy consumption trends …………………………52[Figure Ⅱ-3] Trends in Dubai spot oil price………………………………………………………………54[Figure Ⅱ-4] Level of contribution to increase in primary energy consumption by each factor
from January through September 2011 …………………………………………………56[Figure Ⅱ-5] Trends in primary energy consumption increase rate …………………………………58[Figure Ⅱ-6] Final energy consumption by energy source from January through October 2011 …60[Figure Ⅱ-7] Rate of increase in value-added of each business type under the manufacturing
industry from January through September 2011 ………………………………………61[Figure Ⅱ-8] Level of contribution made by each factor that triggers a change in energy
consumption in the manufacturing industry from January through September ……63[Figure Ⅱ-9] Trends in consumer prices of oil for transport……………………………………………64[Figure Ⅱ-10] Trends in the rate of final energy consumption increase by sector …………………65[Figure Ⅱ-11] Level of contribution of each energy source to primary energy increase from
January through October 2011 …………………………………………………………67[Figure Ⅱ-12] Increase rate of petroleum product consumption by sector …………………………69[Figure Ⅱ-13] Gasoline consumption and increase rate ………………………………………………71
Table of Contents for Figures
수요전망 내지13-4 문 2012.3.8 4:2 PM 페이지5 매일3 MAC2PDF_IN 600DPI 125LPI T
KEEI Korea Energy Demand Outlook
6 KOREA ENERGY ECONOMICS INSTITUTE
[Figure Ⅱ-14] Consumption of diesel for transport and increase rate ………………………………71[Figure Ⅱ-15] Consumption of kerosene and diesel and increase rate………………………………72[Figure Ⅱ-16] Consumption of heavy oil and increase rate……………………………………………72[Figure Ⅱ-17] Consumption of naphtha and increase rate ……………………………………………73[Figure Ⅱ-18] LPG consumption and increase rate ……………………………………………………74[Figure Ⅱ-19] Recent manufacturing business trends and electricity consumption for industrial use…77[Figure Ⅱ-20] Rate of increase in industrial activity indexes and electricity consumption for industrial use…78[Figure Ⅱ-21] Share of manufacturing industry’s electricity consumption taken up by different
business types in the first half of 2011 (%) ……………………………………………79[Figure Ⅱ-22] Electricity consumption increase rate……………………………………………………80[Figure Ⅱ-23] Trends in LNG consumption increase rate per use……………………………………83[Figure Ⅱ-24] Monthly rate of increase in service industry production index ………………………84[Figure Ⅱ-25] Trends in town gas consumption by quarter …………………………………………86[Figure Ⅱ-26] Trends in the number of customers of town gas for industrial use …………………87
[Figure Ⅲ-1] Outlook on international natural gas prices ……………………………………………100[Figure Ⅲ-2] CDD and HDD and assumptions for outlook …………………………………………109[Figure Ⅲ-3] Forecasts on the economic growth rate and primary energy demand increase rate …111[Figure Ⅲ-4] Forecasts on energy intensity and per capita consumption …………………………112[Figure Ⅲ-5] Share of primary energy demand taken up by each energy source…………………115[Figure Ⅲ-6] Share of final energy demand occupied by each sector………………………………118[Figure Ⅲ-7] Share of final energy demand taken up by each energy source ……………………121[Figure Ⅲ-8] Forecasts on level of contribution of each energy source to increase in primary energy 122[Figure Ⅲ-9] Outlook on economic growth rate and electricity demand increase rate …………126[Figure Ⅲ-10] Outlook on electricity demand by sector………………………………………………128[Figure Ⅲ-11] Trends in electricity consumption share of each sector and forecasts ……………129[Figure Ⅲ-12] Trends in LNG demand per use and outlook…………………………………………131[Figure Ⅲ-13] Trends in town gas demand and outlook by use ……………………………………133[Figure Ⅲ-14] Coal demand trends and forecasts per use …………………………………………136[Figure Ⅲ-15] Thermal energy demand trends and outlook …………………………………………137[Figure Ⅲ-16] Trends and outlook on new & renewable energy and other energy demand ……138[Figure Ⅲ-17] Level of contribution of each factor towards a rise in primary energy consumption
from January through September 2011 ………………………………………………140[Figure Ⅲ-18] Level of contribution of each factor towards a change in manufacturing
industry consumption from January through September 2011 ……………………141[Figure Ⅲ-19] Changes in electricity demand sensitivity for temperatures …………………………145[Figure Ⅲ-20] Trends in oil dependence and forecasts ………………………………………………146[Figure Ⅲ-21] Level of contribution of each sector to a rise in final energy demand ……………149
수요전망 내지13-4 문 2012.3.8 4:2 PM 페이지6 매일3 MAC2PDF_IN 600DPI 125LPI T

Summary
7http://www.keei.re.kr
From January through October 2011(in terms of the total), primary energy consumption
tentatively reached 221.3 million TOE, a year-on-year rise of 3.3%.
From January through October, primary energy consumption indicated a gradual
increase in tandem with a slight slowdown in economic growth, despite the record-
breaking cold wave (a 5.4℃ drop from average year temperatures) in January.
- In the first quarter, the Korean economy recorded a growth rate of 4.2%, which is close
to the potential growth rate. However, the economy’s level of growth slowed down to
the mid-3% range in the second quarter and onwards.
- Energy consumption for industrial use led a rise in primary energy consumption from
January through October as a result of continued favorable conditions in industrial
production.
Notes: Values for the fourth quarter of 2011 are forecasts.
Energy consumption trends
Summary▶
[Recent economic and primary energy consumption trends]
수요전망 내지13-4 문 2012.3.8 4:2 PM 페이지7 매일3 MAC2PDF_IN 600DPI 125LPI T

Despite the simultaneous onset of major factors that trigger a rise in energy consumption
in the first quarter of 2011, such as an upswing in the economy and abnormally low
temperatures, primary energy consumption rose relatively gradually.
- This is a result of base effects from the high level of increase recorded in the same period
of the previous year (11.2%), a soar in international oil prices, and energy-saving policies,
including the measure on placing restrictions on heating temperatures in buildings.
Primary energy consumption recorded a year-on-year increase of a mere 0.5% in the
second quarter, but posted relatively high growth of 5.3% in the third quarter.
Notes: Values in parentheses refer to the year-on-year growth rate (%); p refers to tentative figures
8 KOREA ENERGY ECONOMICS INSTITUTE
KEEI Korea Energy Demand Outlook
Category2010 2011p
1/4 2/4 3/4 4/4 Annual 1/4 2/4 3/4 October January~October
<Primary energy consumption trends>
30.7 27.9 30.3 30.5 119.3 30.4 28.8 32.2 11.1 102.5(22.9) (11.2) (3.8) (4.5) (10.1) (-0.8) (3.1) (6.4) (12.1) (3.8)
23.3 21.7 24.5 24.3 93.8 24.2 22.3 25.8 8.8 81.1(14.3) (7.0) (3.6) (4.2) (7.0) (3.7) (2.6) (5.6) (11.8) (4.8)
198.8 193.5 191.8 210.3 794.3 205.0 181.5 199.3 66.3 652.1(-0.2) (0.5) (4.4) (3.5) (2.0) (3.1) (-6.2) (4.0) (0.3) (0.3)
117.6 111.3 108.8 124.7 462.5 116.3 97.7 108.7 36.7 359.3(0.0) (-1.0) (3.9) (3.1) (1.4) (-1.2) (-12.3) (-0.1) (-5.1) (-4.5)
11.0 6.7 5.7 9.7 33.1 12.2 7.3 6.3 2.5 28.3(28.8) (45.0) (24.7) (16.0) (26.8) (11.3) (9.1) (10.3) (7.9) (10.2)
1.2 1.6 2.3 1.4 6.5 1.6 1.9 3.4 0.4 7.2(47.9) (10.5) (-8.0) (55.7) (14.7) (27.2) (21.4) (44.5) (-19.1) (28.5)
36.0 36.5 37.5 38.5 148.6 37.5 38.6 38.2 12.0 126.3(-1.6) (-2.3) (0.9) (5.4) (0.6) (4.0) (5.8) (1.7) (-4.9) (2.9)
1.5 1.5 1.5 1.5 6.1 1.5 1.5 1.5 0.6 5.1(14.9) (14.4) (20.1) (-3.3) (10.7) (2.9) (0.8) (-3.9) (18.3) (1.7)
69.5 61.6 61.8 69.7 262.6 72.2 61.9 65.1 22.2 221.3(11.2) (8.2) (6.2) (6.1) (7.9) (3.8) (0.5) (5.3) (4.2) (3.3)
54.0 46.8 47.1 54.4 202.3 56.4 46.6 49.0 16.8 168.8
(10.4) (8.0) (6.6) (6.6) (7.9) (4.6) (-0.3) (4.0) (2.7) (2.8)
Coal(Million ton)
-Excluding coking coal
Oil(Million bbl)
-Excludingnaphtha
LNG(Million ton)
Hydro(TWh)
Nuclear power(TWh)
Other(Million TOE)
Primary energy(Million TOE)
Primary energy-Excludingfor raw materials
수요전망 내지13-4 문 2012.3.8 4:2 PM 페이지8 매일3 MAC2PDF_IN 600DPI 125LPI T

Level of contribution of each factor that led to an increase in primary energy consumption
from January through September 20111)
The level of contribution of economic growth to a rise in primary energy consumption is
estimated at 3.6%p (7.0 million TOE).
- It is assumed that primary energy consumption would have recorded a year-on-year
increase of 3.6% from January through September 2011 as a result of economic growth
if there were no changes in other factors that trigger a change in consumption.
The temperature effect contributed 0.7%p (1.3 million TOE) to a rise in primary energy
consumption.
- It is assumed that energy consumption rose 0.7% from January through September as a
result of a drop (1.2℃↓) in the average temperature in the first quarter, including the
record-breaking cold wave in 48 years that took place in January 2011.
Energy consumption went down 1.1%p as a result of changes in other factors such as
energy efficiency improvements and a rise in oil prices.
Notes: Other effects include all factors that cause changes in consumption, excluding the temperature effect andeconomic growth effect. Examples are improvements in energy efficiency, changes in industrial structure, andchanges in energy prices.
9http://www.keei.re.kr
Summary
1) GDP is announced by quarter. For this reason, an analysis of the level of contribution made to a rise inconsumption is limited to January through September.
CategoryAmount of contribution to a rise in consumption
(1,000 TOE)
Rate of contribution to a rise in
consumption (%)
Level of contribution to rateof increase in primary energy consumption
Growth effect 6,985 112.7 3.6%p
Temperature effect 1,296 20.9 0.7%p
Other effects -2,084 -33.6 -1.1%p
Total effects 6,197 100.0 3.2%
<Level of contribution of each factor that led to a rise in primary energy consumption from January through September 2011>
수요전망 내지13-4 문 2012.3.8 4:2 PM 페이지9 매일3 MAC2PDF_IN 600DPI 125LPI T

Trends in consumption of each energy source from January through October 2011
Petroleum product consumption showed little change (0.3% increase) from the same
period of the previous year, influenced by sluggish consumption (-6.2%) in the second
quarter.
- Consumption of fuel for transport remained stagnant and consumption of heavy oil for
industrial fuel decreased. In contrast, naphtha consumption for industrial raw material
use went up 7.0% year-on-year as a result of increased production activities in the
petrochemical industry. As of 2010, naphtha consumption for industrial raw material
use accounted for 42% of total oil consumption.
Coal consumption witnessed a year-on-year rise of 3.8%.
- Coal consumption soared (10.1%) in 2010. However, the level of increase substantially
slowed down from January through October 2011 as a result of a mere 0.1% rise in
bituminous coal consumption for steel making, which accounted for 21.4% of total
consumption in 2010.
Natural gas (LNG) consumption rose 26.8% in 2010, followed by two-digit growth
(10.2%) from January through October 2011.
- From January through October, LNG consumption for power generation recorded high
growth of 11.8% year-on-year, attributable to an increase in electricity demand and
shortage of base-load power generation facilities, despite the operation of Singori
Nuclear Power Plant Unit 1.
- LNG consumption for production of town gas increased 9.3%, which meant a
slowdown from the level of increase (12.4%) witnessed in 2010.
From January through October 2011, the level of nuclear power generation rose 2.9%
year-on-year as a result of operation of Singori Nuclear Power Plant Unit 12).
From January through October 2011, final energy consumption rose by 3.1% year-on-year
to stand at 163.2 million TOE, according to tentative figures.
10 KOREA ENERGY ECONOMICS INSTITUTE
KEEI Korea Energy Demand Outlook
2) Korea’s 21st nuclear power plant. Began commercial operation on February 28, 2011.
수요전망 내지13-4 문 2012.3.8 4:2 PM 페이지10 매일3 MAC2PDF_IN 600DPI 125LPI T

Notes: Values in parentheses are the year-on-year growth rate (%); p refers to tentative figures.
11http://www.keei.re.kr
Summary
Category2010 2011p
1/4 2/4 3/4 4/4 Annual 1/4 2/4 3/4 October January~October
<Trends in final energy consumption>
29.0 28.5 27.8 29.9 115.2 29.7 29.0 30.1 10.3 99.1(14.2) (9.2) (4.4) (6.7) (8.5) (2.4) (1.8) (8.4) (8.4) (4.6)
13.5 13.7 13.1 14.6 54.8 14.0 13.7 14.0 4.9 46.6(14.1) (9.4) (3.7) (9.0) (9.0) (3.9) (0.4) (7.2) (7.4) (4.1)
8.6 9.3 9.5 9.6 36.9 8.8 8.7 9.8 3.1 30.4(1.2) (2.3) (4.8) (2.8) (2.8) (2.8) (-5.8) (2.6) (-2.0) (-0.4)
13.3 7.6 6.1 10.3 37.3 14.0 7.4 6.1 2.4 30.0
(4.9) (9.6) (3.9) (0.2) (4.3) (5.4) (-2.5) (1.1) (-1.0) (1.9)
1.2 1.0 1.0 1.2 4.5 1.3 1.0 1.1 0.4 3.7(7.6) (2.3) (1.8) (5.2) (4.4) (4.0) (-4.4) (7.7) (-0.8) (2.2)
52.1 46.4 44.3 51.0 193.8 53.8 46.2 47.0 16.1 163.2(9.2) (7.7) (4.3) (4.5) (6.5) (3.3) (-0.6) (6.1) (4.6) (3.1)
36.6 31.6 29.6 35.7 133.5 38.1 30.9 31.0 10.8 110.7
(7.3) (7.0) (4.0) (4.5) (5.7) (4.2) (-2.3) (4.5) (2.3) (2.2)
7.6 4.2 2.6 5.4 20.0 8.1 4.5 3.0 1.3 16.9(10.8) (17.9) (-0.9) (3.2) (8.3) (6.2) (5.5) (14.8) (12.3) (7.9)
188.7 187.7 186.7 204.3 767.4 194.7 178.1 195.7 65.2 633.7(0.8) (0.9) (3.1) (3.2) (2.0) (3.1) (-5.1) (4.8) (0.2) (0.9)
107.6 105.6 103.7 118.7 435.6 106.0 94.2 105.0 35.6 340.9(1.7) (-0.4) (1.6) (2.6) (1.4) (-1.5) (-10.8) (1.3) (-5.4) (-3.9)
112.5 103.6 109.1 109.0 434.2 121.4 109.0 112.5 35.6 378.5(12.2) (10.3) (10.2) (7.7) (10.1) (7.9) (5.1) (3.2) (6.1) (5.5)
11.3 10.4 9.5 10.7 41.8 10.6 10.7 10.7 3.9 36.0(37.0) (26.1) (0.4) (6.5) (16.4) (-5.5) (3.0) (13.0) (15.6) (4.2)
3.9 4.2 3.7 4.5 16.3 4.4 4.2 4.3 1.7 14.6(6.6) (22.0) (-5.4) (7.8) (7.3) (12.5) (-0.1) (17.9) (19.3) (10.7)
2,114 1,557 1,409 1,985 7,064 2,203 1,612 1,417 609 5,841
(13.0) (11.9) (15.2) (2.6) (10.1) (4.2) (3.6) (0.6) (12.4) (3.9)
Industry(Million TOE)
-Excluding forraw materials
Transport(Million TOE)
Residential/commercial(Million TOE)
Public/other(Million TOE)
Total(Million TOE)
Total-Excluding forraw materials
Town gas(Billion m3)
Oil(Million bbl)
-Excludingnaphtha
Electricity(TWh)
Coal(Million ton)
-Excludingcoking coal
Thermal andother
(Thousand TOE)
수요전망 내지13-4 문 2012.3.8 4:2 PM 페이지11 매일3 MAC2PDF_IN 600DPI 125LPI T
Energy consumption in the industrial sector indicated a year-on-year rise of 4.6%, thus
leading an increase in final energy consumption. Consumption in the
residential/commercial and transport sector rose 1.9% and -0.4%, respectively.
Energy consumption in the manufacturing industry, which accounts for more than 95%
of energy consumption in the industrial sector, went up 4.4% year-on-year. This is
attributable to a rise in production activities in the fabricated metal, metal product (steel),
and petrochemical industries.
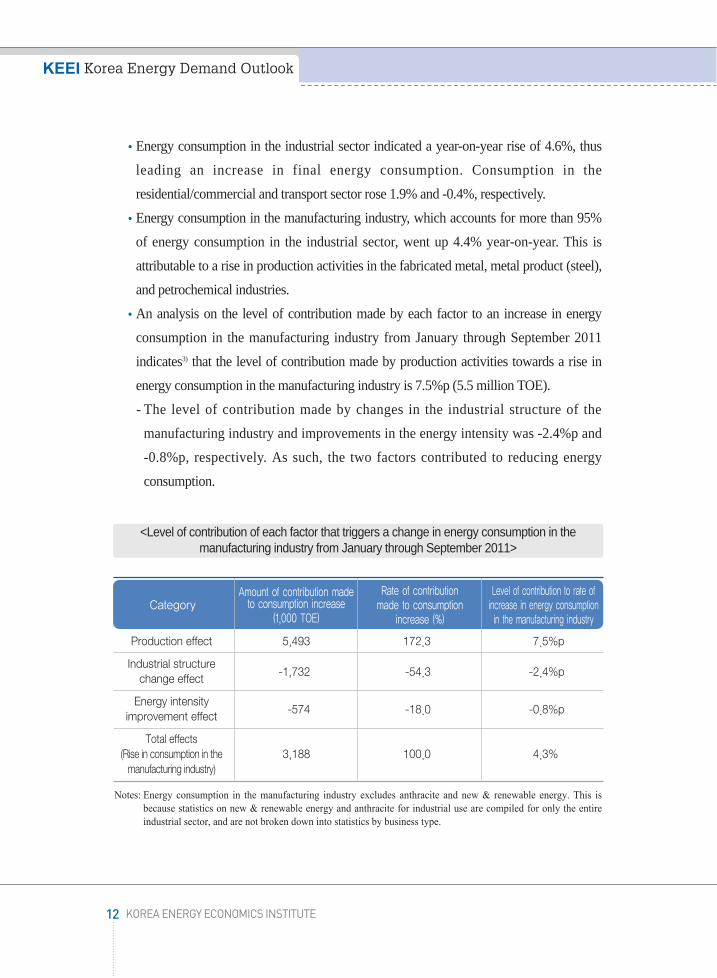
An analysis on the level of contribution made by each factor to an increase in energy
consumption in the manufacturing industry from January through September 2011
indicates3) that the level of contribution made by production activities towards a rise in
energy consumption in the manufacturing industry is 7.5%p (5.5 million TOE).
- The level of contribution made by changes in the industrial structure of the
manufacturing industry and improvements in the energy intensity was -2.4%p and
-0.8%p, respectively. As such, the two factors contributed to reducing energy
consumption.
Notes: Energy consumption in the manufacturing industry excludes anthracite and new & renewable energy. This isbecause statistics on new & renewable energy and anthracite for industrial use are compiled for only the entireindustrial sector, and are not broken down into statistics by business type.
12 KOREA ENERGY ECONOMICS INSTITUTE
KEEI Korea Energy Demand Outlook
CategoryAmount of contribution made
to consumption increase(1,000 TOE)
Rate of contribution made to consumption
increase (%)
Level of contribution to rate ofincrease in energy consumptionin the manufacturing industry
Production effect 5,493 172.3 7.5%p
Industrial structure -1,732 -54.3 -2.4%pchange effect
Energy intensity -574 -18.0 -0.8%pimprovement effect
Total effects(Rise in consumption in the 3,188 100.0 4.3%manufacturing industry)
<Level of contribution of each factor that triggers a change in energy consumption in themanufacturing industry from January through September 2011>
수요전망 내지13-4 문 2012.3.8 4:2 PM 페이지12 매일3 MAC2PDF_IN 600DPI 125LPI T

Trends in final energy consumption by energy source from January through October 2011
By energy source, there was a rapid increase in consumption of naphtha for raw material
use in the petrochemical industry (7.0%) and electricity consumption (5.5%), as a result
of continued favorable conditions in industries that consume great amounts of energy
and the cold wave.
- An analysis of the share of final energy consumption taken up by different uses and
energy sources from January through October 2011 indicates that the share taken up by
energy for industrial raw material use (naphtha, coking coal) was the highest at 32.1%.
It was followed by petroleum for fuel (27.8%), electricity (20.0%), and town gas
(10.9%).
In terms of oil, consumption of petroleum products for transport, including gasoline,
diesel for transport, and LPG, declined 0.6%. Consumption for heating in the
residential/commercial sector also went down 2.3%. In contrast, naphtha consumption
went up considerably as a result of favorable conditions in the petrochemical industry.
Town gas consumption for industrial use went up 12.7% to lead an increase in overall
town gas consumption. Consumption for residential/commercial use and public use also
indicated sound growth of 4.9%.
Coal consumption dropped 5.5%, influenced by a decrease (-15.1%) in bituminous coal
consumption for steel making in the first quarter. It turned around afterwards and
indicated a year-on-year rise of 4.2%.
Electricity consumption recorded year-on-year growth of 5.5%, attributable to continued
strong consumption of electricity for industrial use (year-on-year rise of 9.3%).
Level of contribution of each final energy source to an increase in primary energy
consumption from January through October 2011
- The level of contribution of electricity(triggering energy consumption for power
13http://www.keei.re.kr
Summary
3) The added value of each business type under the manufacturing industry is announced by quarter. For thisreason, an analysis of the level of contribution made to a rise in consumption is limited to January throughSeptember.
수요전망 내지13-4 문 2012.3.8 4:2 PM 페이지13 매일3 MAC2PDF_IN 600DPI 125LPI T

generation) and energy for industrial raw material use(naphtha, coking coal) stood at
41.4% and 34.8%, respectively, as a result of an upswing in production in industries
that consume great amounts of energy.
- The level of contribution made by town gas, a major source of energy for heating, was
25.0% as a result of the cold weather in the first quarter.
14 KOREA ENERGY ECONOMICS INSTITUTE
KEEI Korea Energy Demand Outlook
[Contribution rate of each energy source to primary energy increase from January through October 2011]
수요전망 내지13-4 문 2012.3.8 4:2 PM 페이지14 매일3 MAC2PDF_IN 600DPI 125LPI T

Primary energy demand is expected to rise 3.3% in 2011 and 3.0% in 2012.
Primary energy demand from 2011 to 2012 is expected to become stabilized due to a
slowdown in the nation’s economic growth.
* Economic growth rate assumption: (Year 2010) 6.2% → (Year 2011) 3.8% → (Year
2012) 3.7%
Notes: Values in parentheses refer to the year-on-year growth rate (%); p refers to tentative figures; e refers to forecasts.
15http://www.keei.re.kr
Summary
Outlook on primary energy demand
Category2011 2012
1/4p 2/4p 3/4p 4/4e Annual (e) First half of the year (e)
Second halfof the year (e) Annual (e)
30.4 28.8 32.2 31.5 122.9 60.8 64.6 125.4(-0.8) (3.1) (6.4) (3.3) (3.0) (2.7) (1.4) (2.0)
24.2 22.3 25.8 25.0 97.3 47.4 51.0 98.4(3.7) (2.6) (5.6) (2.7) (3.7) (2.1) (0.4) (1.2)
205.0 181.5 199.3 211.8 797.7 392.9 410.5 803.5(3.1) (-6.2) (4.0) (0.7) (0.4) (1.7) (-0.2) (0.7)
116.3 97.7 108.7 122.2 444.8 214.9 225.8 440.7(-1.2) (-12.3) (-0.1) (-2.1) (-3.8) (0.4) (-2.2) (-0.9)
12.2 7.3 6.3 10.6 36.4 20.2 18.0 38.2(11.3) (9.1) (10.3) (9.4) (10.1) (3.4) (6.7) (5.0)
1.6 1.9 3.4 1.4 8.2 3.6 4.6 8.2(27.2) (21.4) (44.5) (3.2) (27.0) (4.8) (-2.9) (0.3)
37.5 38.6 38.2 40.1 154.4 82.2 86.4 168.6(4.0) (5.8) (1.7) (4.1) (3.9) (8.0) (10.3) (9.2)
1.5 1.5 1.5 1.7 6.2 3.3 3.4 6.7(2.9) (0.8) (-3.9) (11.0) (2.7) (7.1) (6.7) (6.9)
72.2 61.9 65.1 72.3 271.4 138.3 141.3 279.6(3.8) (0.5) (5.3) (3.7) (3.3) (3.2) (2.9) (3.0)
56.4 46.6 49.0 56.2 208.3 106.2 108.2 214.4
(4.6) (-0.3) (4.0) (3.3) (2.9) (3.1) (2.8) (2.9)
<Outlook on primary energy demand>
Coal(Million ton)
-Excludingcoking coal
Oil(Million bbl)
-Excludingnaphtha
LNG(Million ton)
Hydro(TWh)
Nuclear power(TWh)
Other(Million TOE)
Primary energy(Million TOE)
Primary energy-Excludingfor raw materials
수요전망 내지13-4 문 2012.3.8 4:2 PM 페이지15 매일3 MAC2PDF_IN 600DPI 125LPI T
Major energy sources for power generation, including nuclear energy and LNG, are
forecast to indicate a relatively high increase in demand, attributable to continually
strong electricity demand and the operation of new nuclear power plants (Singori
Nuclear Power Plant Unit 2, Sinwolseong Nuclear Power Plant Unit 1).
Energy demand for raw material use (naphtha, coking coal) is expected to go up 4.6% in
2011 owing to an upswing in industrial production activities. Its level of increase will
likely drop to 3.4% in 2012, reflecting a downturn in the petrochemical industry.
- Energy for raw material use is forecast to account for 23.3% of primary energy demand
in 2012.
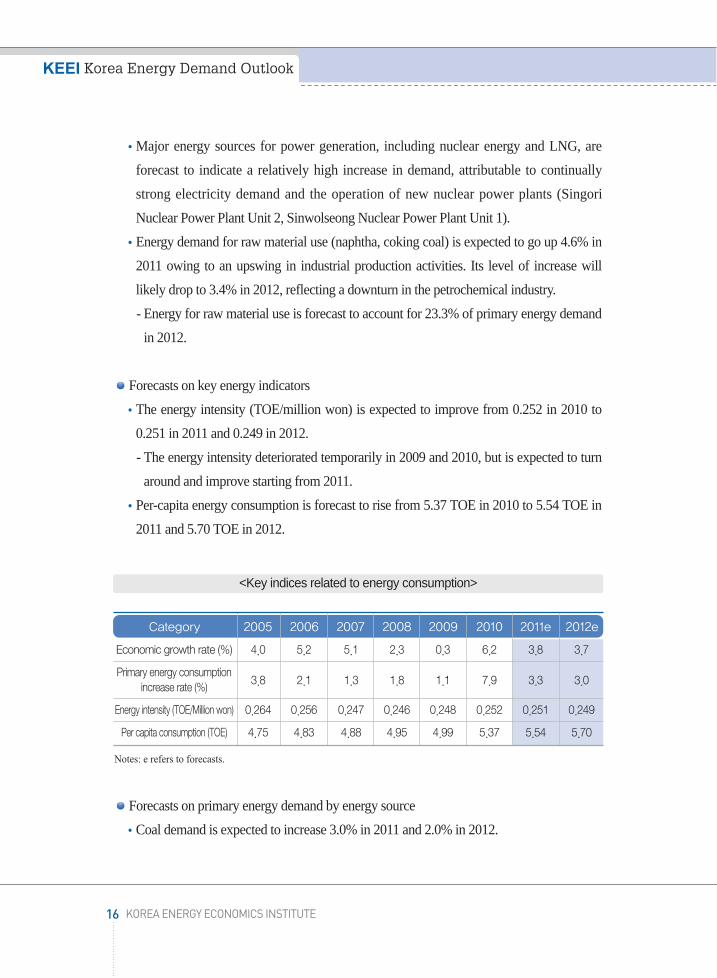
Forecasts on key energy indicators
The energy intensity (TOE/million won) is expected to improve from 0.252 in 2010 to
0.251 in 2011 and 0.249 in 2012.
- The energy intensity deteriorated temporarily in 2009 and 2010, but is expected to turn
around and improve starting from 2011.
Per-capita energy consumption is forecast to rise from 5.37 TOE in 2010 to 5.54 TOE in
2011 and 5.70 TOE in 2012.
Notes: e refers to forecasts.
Forecasts on primary energy demand by energy source
Coal demand is expected to increase 3.0% in 2011 and 2.0% in 2012.
16 KOREA ENERGY ECONOMICS INSTITUTE
KEEI Korea Energy Demand Outlook
Category 2005 2006 2007 2008 2009 2010 2011e 2012e
Economic growth rate (%) 4.0 5.2 5.1 2.3 0.3 6.2 3.8 3.7
Primary energy consumption3.8 2.1 1.3 1.8 1.1 7.9 3.3 3.0 increase rate (%)
Energy intensity (TOE/Million won) 0.264 0.256 0.247 0.246 0.248 0.252 0.251 0.249
Per capita consumption (TOE) 4.75 4.83 4.88 4.95 4.99 5.37 5.54 5.70
<Key indices related to energy consumption>
수요전망 내지13-4 문 2012.3.8 4:2 PM 페이지16 매일3 MAC2PDF_IN 600DPI 125LPI T

17http://www.keei.re.kr
Summary
- In 2011, coal demand is expected to show gradual growth of approximately 3.0%,
attributable to a slowdown in coal consumption for power generation (no new
facilities) and base effects from a high increase in coking coal consumption (22.6%) in
the previous year.
- In 2012, coal consumption for power generation is expected to show little change since
no new facilities were built. Coking coal consumption is expected to turn around and
indicate an upward trend in 2012.
Oil demand is expected to indicate extremely gradual growth of 0.4% in 2011 and 0.7%
in 2012.
- In 2011, oil demand is expected to indicate little change despite a rapid rise (6.4%) in
naphtha consumption for raw material use. This is owing to a considerable drop in
demand for use as industrial fuel as a result of continued high oil prices and demand for
heating in the residential and commercial sector.
- A 0.7% rise from 2011 is expected for 2012 to reach 803.5 million barrels, owing to
recovery of demand for transport and a slowdown in the downward trend in fuel for
industrial use.
LNG demand is forecast to record growth of 10.1% in 2011 and 5.0% in 2012.
- LNG demand for power generation, which accounted for 46% of overall consumption
in 2010, is expected to rise 12.5% in 2011 and 5.1% in 2012, thus leading an overall
increase in LNG demand.
- LNG demand for power generation and demand for town gas production both go up in
case of an abnormal cold wave in the winter. For this reason, there is a need to
thoroughly examine LNG supply and demand conditions in the winter.
The amount of nuclear power generation is forecast to go up 3.9% in 2011 and 9.2% in
2012 with the operation of new facilities.
- Following the operation of Singori Unit 1 in (February) 2011, commercial operation of
Singori Unit 2 and Sinwolseong Unit 1 is planned for early 2012.
- At the end of 2012, there will likely be a substantial rise in the amount of nuclear
power generation in tandem with facility expansion of around 2 million kW(10.7%)
from the previous year.
수요전망 내지13-4 문 2012.3.8 4:2 PM 페이지17 매일3 MAC2PDF_IN 600DPI 125LPI T

Final energy demand is forecast to record a year-on-year increase of 3.1% in 2011 and
2.9% in 2012.
Energy consumption soared in all demand sectors in 2010. However, the level of
consumption increase is expected to slow down from 2011 to 2012 due to base effects, a
slowdown in economic growth, and continued high oil prices.
- In 2011, consumption in the industrial sector is expected to record relatively high
growth of 4.6%, but consumption in the residential/commercial/public sector and
transport sector is forecast to go up only by a small extent.
- In 2012, the level of increase in demand in the industrial sector is expected to go down
compared to the previous year as a result of a slowdown in the level of increase in
demand for naphtha and electricity for industrial use. The level of increase in demand
in the residential/commercial/public sector is also forecast to be more gradual.
18 KOREA ENERGY ECONOMICS INSTITUTE
KEEI Korea Energy Demand Outlook
Outlook on final energy demand
수요전망 내지13-4 문 2012.3.8 4:2 PM 페이지18 매일3 MAC2PDF_IN 600DPI 125LPI T

Notes: Values in parentheses are the year-on-year growth rate (%); p refers to tentative figures; e refers to forecasts.
19http://www.keei.re.kr
Summary
Category2011 2012
1/4p 2/4p 3/4p 4/4e Annual (e) First half of the year (e)
Second halfof the year (e) Annual (e)
29.7 29.0 30.1 31.6 120.5 61.8 63.7 125.4(2.4) (1.8) (8.4) (6.0) (4.6) (5.1) (3.2) (4.1)
14.0 13.7 14.0 15.6 57.3 29.6 30.5 60.2(3.9) (0.4) (7.2) (6.8) (4.6) (6.8) (3.2) (4.9)
8.8 8.7 9.8 9.7 37.0 17.8 19.6 37.3(2.8) (-5.8) (2.6) (1.7) (0.3) (1.2) (0.4) (0.8)
15.3 8.4 7.2 11.5 42.4 24.0 19.0 42.9
(5.3) (-2.7) (2.0) (0.1) (1.6) (1.1) (1.3) (1.2)
53.8 46.2 47.0 52.9 199.9 103.5 102.2 205.7(3.3) (-0.6) (6.1) (3.8) (3.1) (3.5) (2.3) (2.9)
38.1 30.9 31.0 36.9 136.8 71.4 69.1 140.4
(4.2) (-2.3) (4.5) (3.3) (2.5) (4.7) (5.7) (2.7)
8.1 4.5 3.0 5.9 21.5 13.4 9.3 22.6(6.2) (5.5) (14.8) (8.2) (7.7) (5.9) (3.9) (5.1)
194.7 178.1 195.7 206.0 774.4 380.2 401.1 781.3(3.1) (-5.1) (4.8) (0.8) (0.9) (2.0) (-0.1) (0.9)
106.0 94.2 105.0 116.3 421.5 202.2 216.5 418.7(-1.5) (-10.8) (1.3) (-0.2) (-3.2) (1.0) (8.7) (-0.7)
121.4 109.0 112.5 113.7 456.6 237.9 239.3 477.3(7.9) (5.1) (3.2) (4.4) (5.2) (3.3) (5.8) (4.5)
10.6 10.7 10.7 11.7 43.7 22.7 23.3 46.0(-5.5) (3.0) (13.0) (9.6) (4.6) (6.4) (4.1) (5.2)
4.4 4.2 4.3 5.2 18.1 9.4 9.7 19.1(12.5) (-0.1) (17.9) (14.5) (11.0) (8.9) (2.3) (5.5)
2,203 1,612 1,417 2,163 7,395 3,991 3,768 7,758
(4.2) (3.6) (0.6) (9.0) (4.7) (4.6) (5.2) (4.9)
<Outlook on final energy demand>
Industry(Million TOE)
-Excluding forraw materials
Transport(Million TOE)
Residential/commercial/public
(Million TOE)
TotalMillion TOE
Total-Excluding forraw materials
Town gas(Billion m3)
Oil(Million bbl)
-Excludingnaphtha
Electricity(TWh)
Coal(Million ton)
--Excludingcoking coal
Thermal andother
(Thousand TOE)
수요전망 내지13-4 문 2012.3.8 4:2 PM 페이지19 매일3 MAC2PDF_IN 600DPI 125LPI T

With regards to final energy demand by energy source, the level of increase recorded by
major energy sources in 2012 will likely maintain the 2011 level or slightly slow down.
Town gas for industrial use is forecast to lead an overall rise in demand. The demand
increase rate is forecast to stand at 7.7% in 2011 and 5.1% in 2012.
Oil demand is forecast to indicate an increase rate of less than 1% in both 2011 and 2012.
- Oil demand for transport is expected to go up 0.1% in 2011 and 0.4% in 2012 despite
continued high oil prices. This is attributable to a steady rise in automobile sales, a rise
in fuel demand for road freight since the second half of 2011, and an increase in
international transport.
- Oil demand in the industrial sector is forecast to go up 2.2% in 2011 and 2.0% in 2012.
Demand for industrial raw material use is expected to lead a rise in overall demand as it
is forecast that there will be an increase in production activities in the petroleum
refining and petrochemical sector in 2012 as well.
Electricity will likely indicate relatively high growth of 5.2% in 2011 and 4.5% in 2012
resulting from several factors: a rise in industrial production activities, low charge,
increased dissemination of equipment that use electricity, and convenience in use.
Coal consumption is forecast to record a sound increase rate that is in the low 5% range
in 2012 as it is expected that the high growth in anthracite demand for industrial use will
continue and coking coal demand will bounce back and slightly go up.
Forecasts on level of contribution made by each final energy source to primary energy
demand
Electricity, which triggers energy input for power generation in the transformation sector,
is forecast to contribute to around half of the amount of primary energy increase
recorded in 2012.
The level of contribution made by energy demand for industrial raw material use is
expected to slightly go down from the 2011 level to stand at 25.9% in 2012.
The level of contribution made by town gas is expected to be 14.7% in 2012. Final
petroleum products for fuel, excluding naphtha, are expected to contribute to a 3.8%
reduction in primary energy demand as decreased consumption is expected in 2012.
20 KOREA ENERGY ECONOMICS INSTITUTE
KEEI Korea Energy Demand Outlook
수요전망 내지13-4 문 2012.3.8 4:2 PM 페이지20 매일3 MAC2PDF_IN 600DPI 125LPI T

From January through October 2011, primary energy consumption rose 3.3%, recording a
lower increase rate than the economic growth rate (3.7%) from the first through the third
quarter of 2011.
From January through October, primary energy consumption indicated gradual growth
as the level of economic growth somewhat slowed down. This is despite a rise in energy
demand for heating purposes owing to the record-breaking cold wave in January.
A soar in international oil prices and strengthening of energy-saving policies contributed
to the stabilization of energy consumption.
The speed of industrial production increase (7.4%) exceeded the level of economic
growth (3.7%). Energy consumption for industrial use (4.6% increase) led a rise in
primary energy consumption from January through October.
21http://www.keei.re.kr
Summary
[Forecasts on contribution rate of each energy source to increase in primary energy]
Major characteristics
수요전망 내지13-4 문 2012.3.8 4:2 PM 페이지21 매일3 MAC2PDF_IN 600DPI 125LPI T
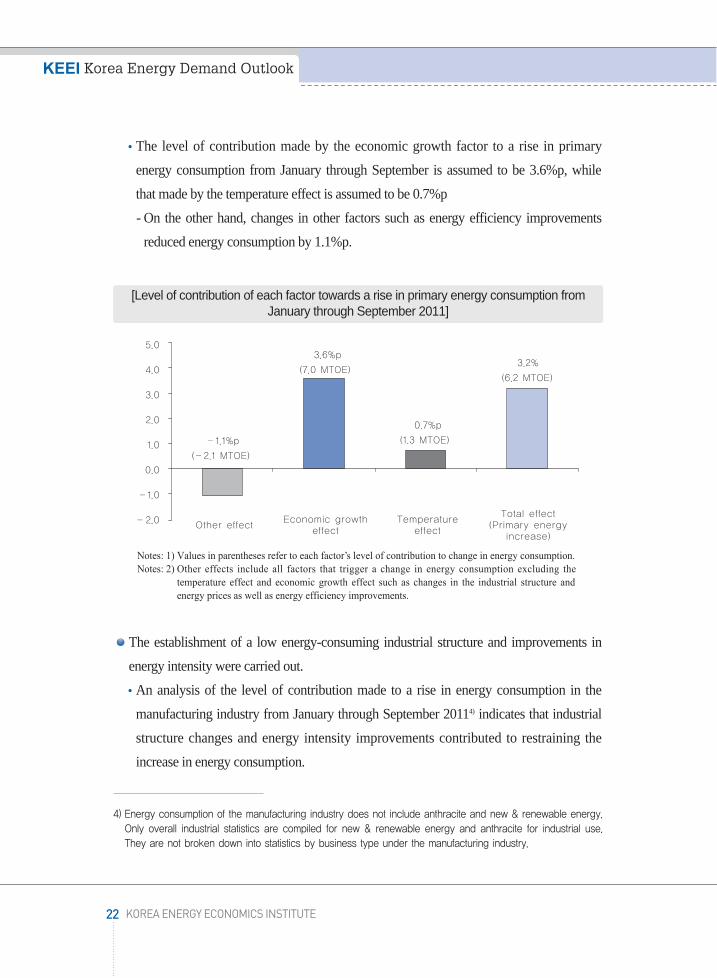
The level of contribution made by the economic growth factor to a rise in primary
energy consumption from January through September is assumed to be 3.6%p, while
that made by the temperature effect is assumed to be 0.7%p
- On the other hand, changes in other factors such as energy efficiency improvements
reduced energy consumption by 1.1%p.
Notes: 1) Values in parentheses refer to each factor’s level of contribution to change in energy consumption.Notes: 2) Other effects include all factors that trigger a change in energy consumption excluding the
temperature effect and economic growth effect such as changes in the industrial structure andenergy prices as well as energy efficiency improvements.
The establishment of a low energy-consuming industrial structure and improvements in
energy intensity were carried out.
An analysis of the level of contribution made to a rise in energy consumption in the
manufacturing industry from January through September 20114) indicates that industrial
structure changes and energy intensity improvements contributed to restraining the
increase in energy consumption.
22 KOREA ENERGY ECONOMICS INSTITUTE
KEEI Korea Energy Demand Outlook
4) Energy consumption of the manufacturing industry does not include anthracite and new & renewable energy.Only overall industrial statistics are compiled for new & renewable energy and anthracite for industrial use.They are not broken down into statistics by business type under the manufacturing industry.
[Level of contribution of each factor towards a rise in primary energy consumption fromJanuary through September 2011]
수요전망 내지13-4 문 2012.3.8 4:2 PM 페이지22 매일3 MAC2PDF_IN 600DPI 125LPI T
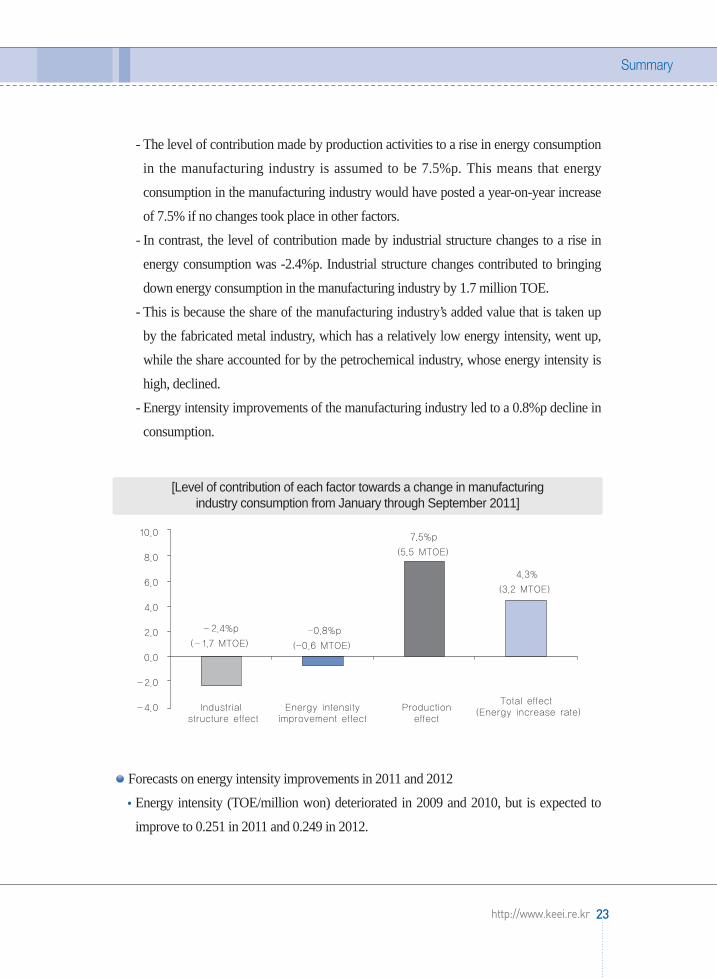
- The level of contribution made by production activities to a rise in energy consumption
in the manufacturing industry is assumed to be 7.5%p. This means that energy
consumption in the manufacturing industry would have posted a year-on-year increase
of 7.5% if no changes took place in other factors.
- In contrast, the level of contribution made by industrial structure changes to a rise in
energy consumption was -2.4%p. Industrial structure changes contributed to bringing
down energy consumption in the manufacturing industry by 1.7 million TOE.
- This is because the share of the manufacturing industry’s added value that is taken up
by the fabricated metal industry, which has a relatively low energy intensity, went up,
while the share accounted for by the petrochemical industry, whose energy intensity is
high, declined.
- Energy intensity improvements of the manufacturing industry led to a 0.8%p decline in
consumption.
Forecasts on energy intensity improvements in 2011 and 2012
Energy intensity (TOE/million won) deteriorated in 2009 and 2010, but is expected to
improve to 0.251 in 2011 and 0.249 in 2012.
23http://www.keei.re.kr
Summary
[Level of contribution of each factor towards a change in manufacturing industry consumption from January through September 2011]
수요전망 내지13-4 문 2012.3.8 4:2 PM 페이지23 매일3 MAC2PDF_IN 600DPI 125LPI T

The worsened energy intensity in 2009 and 2010 seems to be temporary amid mid- to
long-term energy efficiency improvements.
- The worsened energy intensity of 2009 resulted from the level of increase in primary
energy consumption (1.1%) exceeding the economic growth rate (0.3%), owing to
operation of new facilities in industries that consume a great amount of energy and a
rise in energy transformation loss as a result of a rapid increase in electricity
consumption5).
- The worsened energy intensity of 2010 mainly resulted from base effects from sluggish
consumption witnessed in the previous year, a soar in energy consumption for
industrial use owing to a rapid economic upswing, and an increase in energy
consumption for cooling and heating purposes as a result of abnormal climate
conditions throughout all seasons.
Continued rapid increase in electricity consumption is expected
Electricity is forecast to maintain a rapid increase in consumption due to several factors:
24 KOREA ENERGY ECONOMICS INSTITUTE
KEEI Korea Energy Demand Outlook
5) Final energy consumption went down 0.3% in 2009 but electricity consumption indicated relatively highgrowth at 2.4%.
[Forecasts on energy intensity and per-capita consumption]
수요전망 내지13-4 문 2012.3.8 4:2 PM 페이지24 매일3 MAC2PDF_IN 600DPI 125LPI T

low charge; continued upswing in production in industries that consume a great amount
of electricity; increased propagation of electric equipment; and convenience in use.
- Electricity consumption indicated annual average growth of 6.1% in the 2000s, the
highest among major final energy sources. It is forecast to record relatively rapid
growth of 5.2% in 2011 and 4.5% in 2012.
A rise in electricity consumption expands energy conversion loss, thus triggering an
increase in primary energy demand6).
- The level of contribution made by electricity towards a rise in primary energy
consumption is forecast to be 49.4% in 2011 and 50.9% in 2012. It is forecast that
around half of the primary energy increase will be accounted for by electricity demand.
- Strong electricity demand is expected to continue for the time being as a result of sound
growth of industries that consume great amounts of electricity and changes in lifestyles
triggered by technological development.
The supplied reserve level is steadily decreasing
Since 2000, peak electricity demand has been quickly increasing, faster than the speed at
which power generation facilities were built. For this reason, spare electricity is steadily
declining.
From 2000 through 2011, peak electricity demand in the summer indicated annual
average growth of 5.3%. In contrast, total capacity and supply capacity recorded an
annual average increase of a mere 4.7% and 4.9%, respectively. The supplied reserve
level in the summer substantially dropped.
Peak demand in the winter (December - February) indicated annual average growth of
6.2% during the past decade, thus recording a faster increase rate than peak demand in
the summer. Power generation capacity at the point of winter peak demand recorded an
annual average increase of 4.6%. This means that reserve power at the point of winter
peak demand quickly went down.
25http://www.keei.re.kr
Summary
6) There is an energy loss of 63.6% in the power generation sector (as of 2010). This is why 2.74 TOE ofprimary energy is needed to produce 1 TOE of electricity.
수요전망 내지13-4 문 2012.3.8 4:2 PM 페이지25 매일3 MAC2PDF_IN 600DPI 125LPI T

Increase in the range of fluctuation in energy demand caused by temperature changes
Temperature changes have had increasing influence on changes in energy consumption
in the 2000s.
- Energy consumption is substantially influenced by temperature changes in tandem with
increased dissemination and use of cooling and heating equipment and frequent
occurrence of abnormal climate conditions.
Electricity demand in the winter is especially becoming more sensitive to temperatures
and the range of fluctuation in demand is widening in tandem with increased
dissemination of electric heating equipment.
- An analysis of how sensitive electricity demand was towards changes in HDD in a 10-
year period after 1985 (movement to recent year by one year on an annual basis)7)
indicates that electricity demand is becoming more sensitive to temperatures as time
passes.
- This shows that electricity is quickly replacing oil as energy for heating.
26 KOREA ENERGY ECONOMICS INSTITUTE
KEEI Korea Energy Demand Outlook
7) Sensitivity analysis model (Monthly data used): InE=α+β1InGDP+β2CDD+β3HDD+e(E refers to electricity, CDD refers to Cooling Degree Days, HDD refers to Heating Degree Days)
[Changes in electricity demand sensitivity for temperatures]
수요전망 내지13-4 문 2012.3.8 4:2 PM 페이지26 매일3 MAC2PDF_IN 600DPI 125LPI T

Oil dependence regarding primary energy consumption is forecast to continually drop.
The share of primary energy taken up by oil decreased to less than 40% in 2010, and will
likely go down further to 37.7% in 2012.
When excluding non-energy oil for industrial raw material use (naphtha, asphalt, etc.),
the share of primary energy taken up by oil used as an energy source is expected to
decrease from 21.8% in 2010 to 19.6% in 2012.
The decrease in the Korean economy’s dependence on energy oil is the result of
continued high oil prices and relative prices among energy sources in Korea.
- A rise in oil prices has led to a slowdown in the level of increase in fuel consumption
for transport and continued downward trend in consumption for power generation. Oil
is being steadily replaced by other energy sources such as electricity.
There is a need to examine whether the speed at which the share taken up by energy oil
is dropping is appropriate when Korea establishes energy supply and demand policies.
- Considering Korea’s industrial structure, where the level of contribution of the
petrochemical industry to the economy is high, the nation’s oil dependence target
should be set targeting oil for fuel.
27http://www.keei.re.kr
Summary
[Trends in oil dependence and forecasts]
수요전망 내지13-4 문 2012.3.8 4:2 PM 페이지27 매일3 MAC2PDF_IN 600DPI 125LPI T

Continually implement measures to stabilize winter and summer electricity supply and
demand in 2012.
Due to limited expansion of base-load power generation facilities (nuclear power,
bituminous coal), electricity supply and demand conditions that were witnessed in 2011
will likely continue in 2012.
- Commercial operation is planned for two nuclear power plants (Singori Nuclear Power
Plant Unit 2, Sinwolseong Nuclear Power Plant Unit 1) in the first half of 2012, but
there are no plans for additional bituminous coal-based power generation facilities.
- Base-load power generation facility capacity (as of the end of the year) in 2012 will
record a year-on-year rise of a mere 4.8%. The level of increase will be similar to that
of electricity demand (4.5% increase).
As such, strong measures on stabilizing supply and demand need to be continually
implemented in 2012 in order to stabilize electricity supply and demand.
- There is a need to continually move forward with reform into a cost principle-based
charge system. At the same time, there is a need to come up with a mid- to long-term
roadmap that would reduce the economic shock caused by the change in the charge
system and would allow electricity consumers, including the industrial sector, to
prepare for the change.
- There is a need to examine the matter of putting off the shutdown of power plants and
engaging in early construction of new power plants in order to secure more supply
capacity between now and 2015, when there is no spare electricity.
- If needed, current electricity supply/demand stabilization measures (reduce peak
demand, place a restriction on heating temperatures, etc.) should be improved and
continually executed.
- PR activities should be strengthened so that information is delivered to the general
public on how to use electricity efficiently and the importance of reducing energy
consumption.
28 KOREA ENERGY ECONOMICS INSTITUTE
KEEI Korea Energy Demand Outlook
Policy implications
수요전망 내지13-4 문 2012.3.8 4:2 PM 페이지28 매일3 MAC2PDF_IN 600DPI 125LPI T

There is a need to pay more caution to electricity supply/demand management when there
is a change in the season.
There is a possibility that difficulties will be experienced in electricity supply in the event
of a soar in electricity demand as a result of abnormal climate conditions when there is a
change in the season.
- The shortage of reserve power in the summer and winter is forecast to continue for the
time being. Repair of power plants needs to be carried out mainly in the spring and
autumn.
- There is a possibility of power load temporarily rising in the event of simultaneous
occurrence of abnormal climate conditions and load shifting of industries when there is
a change in the season.
- In case of simultaneous occurrence of a drop in supply capacity and a rise in power
load, as such was the case on September 15, 2011, there is a possibility of imbalance
between supply and demand in the short term.
There is a need to improve Korea’s industrial structure into a low energy-consuming
structure.
Energy demand in the industrial sector rose 8.5% in 2010. It is forecast to go up 4.6% in
2011 and 4.1% in 2012, thus leading a rise in final energy consumption.
* Rate of increase in final energy demand: (’10) 6.5% → (’11) 3.1% → (’12) 2.9%
- As a result, the share of final energy accounted for by consumption in the industrial
sector is expected to continually increase and reach 61% in 2012.
The rapid increase in demand in the industrial sector is attributable to continued rapid
growth of leading industries that consume a great amount of energy, including the steel
and petrochemical industries, as well as the fabricated metal industry that mainly uses
electricity, including semiconductors, machinery, and automobiles.
- In 2010, there was a substantial rise (12.9%) in electricity demand for industrial use as
a result of construction of large steel making facilities (total capacity of 19,000
thousand tons)8) that consume a great amount of electricity, including Blast Furnace #1
and #2 of Hyundai Steel
29http://www.keei.re.kr
Summary
수요전망 내지13-4 문 2012.3.8 4:2 PM 페이지29 매일3 MAC2PDF_IN 600DPI 125LPI T

The level of contribution made by the industrial sector to a rise in final energy
consumption has been on an upward trend since 2009.
- In 2012, energy consumption in the industrial sector is expected to increase by 5.0
million TOE, accounting for 86.2% of final energy demand increase (5.8 million TOE).
The level of contribution of energy for industrial raw material use (naphtha, coking
coal) towards a rise in final energy is expected to reach 37.2%.
- In 2012, the level of contribution of the transport sector and residential/commercial and
public/other sector is forecast to be low at 5.0% and 8.8%, respectively.
Roles performed by the industrial sector are important in reducing energy demand in
Korea, but there is a restriction on reducing demand in the short term9). For this reason,
industrial structure improvements should be continually implemented as a mid- to long-
term task.
30 KOREA ENERGY ECONOMICS INSTITUTE
KEEI Korea Energy Demand Outlook
8) This accounts for 8.8% of the total steel making facility capacity (216,667 thousand tons) recorded in 2010.9) Energy for raw material use accounts for 52.4% (as of 2010) of energy consumption in the industrial sector.
[Contribution rate of each sector to a rise in final energy demand]
수요전망 내지13-4 문 2012.3.8 4:2 PM 페이지30 매일3 MAC2PDF_IN 600DPI 125LPI T

Energy Demand Outlook for 2012
수요전망 내지13-4 문 2012.3.8 4:2 PM 페이지31 매일3 MAC2PDF_IN 600DPI 125LPI T

수요전망 내지13-4 문 2012.3.8 4:2 PM 페이지32 매일3 MAC2PDF_IN 600DPI 125LPI T

ChapterⅠInternational Energy
Market Trends
1. Trends in the international oil market and oil exports/imports
2. Trends in the international natural gas market
3. Trends in the international coal market
수요전망 내지13-4 문 2012.3.8 4:2 PM 페이지33 매일3 MAC2PDF_IN 600DPI 125LPI T

수요전망 내지13-4 문 2012.3.8 4:2 PM 페이지34 매일3 MAC2PDF_IN 600DPI 125LPI T

A. Trends in international oil prices and domestic petroleum product prices
International oil prices have been indicating a downward trend since April. Despite
geopolitical tension in the Middle East and improvements in economic indicators in the
US, international oil prices recorded a 2.2% drop from the previous month to stand at
$105.5/barrel (Dubai oil) in December 2011. This is attributable to anxiety over Europe’s
financial crisis, weak manufacturing industry indicators in China, and a rise in crude oil
inventory in the US.
Notes: Values in parentheses indicate the year-on-year increase rate (%).
ChapterⅠ International Energy Market Trends
35http://www.keei.re.kr
Trends in the international oil market and oil exports/imports1
(Unit: $/Bbl, %)
Category WTI Brent Dubai
2008 99.92 (27.21) 97.47 (24.85) 94.29 (25.86)
2009 61.94 (-37.98) 61.73 (-35.74) 61.92 (-32.37)
2010 79.49 (17.55) 79.66 (17.93) 78.13 (16.21)
January 89.54 (14.30) 96.78 (26.69) 92.55 (20.59)
February 89.66 (17.28) 103.90 (40.75) 100.24 (36.20)
March 102.97 (26.73) 114.64 (45.21) 108.53 (40.33)
April 109.96 (30.13) 123.26 (45.17) 115.76 (38.40)
May 101.29 (37.42) 114.27 (51.91) 108.04 (40.60)
2011June 96.26 (27.85) 113.97 (52.12) 107.50 (45.17)
July 97.30 (27.52) 116.82 (54.32) 110.15 (51.70)
August 86.32 (12.67) 110.11 (42.68) 105.00 (41.57)
September 85.58 (13.73) 111.52 (43.23) 105.75 (40.63)
October 86.51 (5.58) 109.13 (31.20) 103.54 (28.97)
November 97.27 (15.28) 110.53 (28.90) 107.91 (29.11)
December 98.72 (10.72) 107.74 (17.41) 105.51 (18.62)
<Table Ⅰ-1> International crude oil prices
수요전망 내지13-4 문 2012.3.8 4:2 PM 페이지35 매일3 MAC2PDF_IN 600DPI 125LPI T

B. Trends in petroleum product prices in Korea
In December 2011, consumer prices of gasoline and diesel in Korea recorded a year-on-
year increase of 9.7% and 14.2%, respectively. Consumer prices of butane for vehicles
went up 8.2%.
The relative price of diesel against gasoline continually dropped after April. As of
December, it skyrocketed to 92.5%, influenced by a rise in international product prices
of diesel.
Notes: Values in parentheses indicate the relative price against gasoline prices (%).
Consumer prices of petroleum products in Korea are roughly 2.4 times (gasoline) and 2.0
times (diesel) higher than prices in the Singapore spot market around two weeks earlier.
36 KOREA ENERGY ECONOMICS INSTITUTE
KEEI Korea Energy Demand Outlook
(Unit: Won/liter, Won/kg, %)
Category Gasoline Diesel Butane for transport
2008 1,692.14 1,614.44 (95.4) 1,009.04 (59.6)
2009 1,600.72 1,397.47 (87.3) 828.70 (51.8)
2010 1,710.41 1,502.80 (87.9) 952.16 (55.7)
January 1,825.4 1,621.7 (88.8) 1,068.1 (58.5)
February 1,850.0 1,651.7 (89.3) 1,068.8 (57.8)
March 1,939.0 1,755.9 (90.6) 1,068.9 (55.1)
April 1,951.2 1,792.8 (91.9) 1,068.3 (54.8)
May 1,938.5 1,772.9 (91.5) 1,068.0 (55.1)
2011June 1,915.4 1,736.3 (90.6) 1,120.9 (58.5)
July 1,934.7 1,754.4 (90.7) 1,099.9 (56.9)
August 1,945.2 1,757.9 (90.4) 1,081.5 (55.6)
September 1,944.4 1,746.3 (89.8) 1,081.1 (55.6)
October 1,978.3 1,772.5 (89.6) 1,080.8 (54.6)
November 1,981.0 1,788.0 (90.3) 1,060.0 (53.5)
December 1,943.0 1,792.3 (92.2) 1,052.4 (54.2)
<TableⅠ-2> Consumer prices of petroleum products in Korea
수요전망 내지13-4 문 2012.3.8 4:2 PM 페이지36 매일3 MAC2PDF_IN 600DPI 125LPI T

Notes: Gasoline (92RON) and diesel (0.05%) prices were calculated by using the weekly average price of theSingapore spot market and the weekly average exchange rate.
C. Trends in crude oil and petroleum product exports/imports
In October 2011, the crude oil import volume stood at 83.0 million barrels, recording a
year-on-year rise of 8.3%. The import value (based on CIF) rose 51.4% to reach 9.02
billion dollars.
The import volume from January through October 2011 posted 773.4 million barrels, a
year-on-year rise of 7.8%, while the value posted a rise of 49.5% to stand at 83.14 billion
dollars.
Crude oil imports maintained a high level of increase from the same period of the
previous year, attributable to the Great East Japan Earthquake and the resulting upswing
in oil demand in the region as well as a continued increase in production and exports of
products, triggered by a rise in the refining margin.
From January through October 2011, petroleum product imports recorded a year-on-year
drop of 1.7% to stand at 229.0 million barrels. In contrast, petroleum product exports
ChapterⅠ International Energy Market Trends
37http://www.keei.re.kr
[FigureⅠ-1] Petroleum product import prices and consumer prices
수요전망 내지13-4 문 2012.3.8 4:2 PM 페이지37 매일3 MAC2PDF_IN 600DPI 125LPI T

witnessed a year-on-year rise of 19.6% to reach 335.4 million barrels.
Petroleum product imports went down from the same period of the previous year, owing
to a drop in naphtha imports despite a rise in LPG imports. Petroleum product exports
substantially rose as a result of improvements in the refining margin as well as the Great
East Japan Earthquake and the resulting upswing in oil demand in the region.
A. Trends in supply and demand
International natural gas demand went up 7.4% in 2010, but the level of increase slowed
down to 4.1% in 2011 to record total consumption of 3,382.2 billion m3. This is a result of
a slowdown in economic growth of OECD countries and reduced consumption in
Western Europe.
In 2010, Russia’s natural gas consumption reached 467.3 billion m3, a year-on-year
increase of 6.3%, owing to the economic recovery and cold winter. It is estimated that
consumption rose by 3.2% in 2011 to stand at 482.3 billion m3.
Europe’s consumption of natural gas increased 7.5% in 2010, but declined 2.5% in 2011
to stand at 573.5 billion m3, owing to weak economic activity in the eurozone and warm
winter temperatures.
Natural gas consumption in Asia recorded a year-on-year rise of 11.8% to reach 639.1
billion m3 in 2011, attributable to increased consumption in Korea (12.6%), Japan
(10.9%), China (23.3%), and India (18.9%).
International natural gas production went up 7.2% in 2010 to 3,232.1 billion m3, but the
rate of growth slightly went down in 2011 as a result of reduced production in Europe. It
38 KOREA ENERGY ECONOMICS INSTITUTE
KEEI Korea Energy Demand Outlook
Trends in the international natural gas market2
수요전망 내지13-4 문 2012.3.8 4:2 PM 페이지38 매일3 MAC2PDF_IN 600DPI 125LPI T

posted year-on-year growth of 4.5% to stand at 3,376.2 billion m3.
In 2011, the US produced 621.9 billion m3 of natural gas, a year-on-year increase of
6.7%, resulting from increased production in the interior regions. Production in Canada
continually went down but turned around and indicated a year-on-year rise of 2.0% to
post 155.4 billion m3.
Natural gas production in Western Europe indicated a downward trend for a long period,
but turned around in 2010 and posted a year-on-year increase of 2.5% to record 305.2
billion m3, owing to increased production in the Netherlands (8.0%) and Norway (2.8%).
However, it dropped 4.5% year-on-year to stand at 291.5 billion m3 in 2011.
Qatar, which is the largest LNG-producing country, indicated high production increase
of 30.7% in 2010. Natural gas production also went up 29.6% in 2011 to reach 151.2
billion m3.
Notes: Values in parentheses indicate the year-on-year growth rate (%), p indicates tentative valuesSource: EIU, World commodity forecasts: Industrial raw materials, January 2012
B. Price trends
The US Henry hub natural gas price began to decline in the second quarter of 2011 as a
result of abundant supply and a warm winter. The annual average price dropped 5.0%
year-on-year to stand at 4.17US$/mBtu.
ChapterⅠ International Energy Market Trends
39http://www.keei.re.kr
(Unit: Billion m3)
Category Consumption Production
2009 3,023.2 (-3.7) 3,014.9 (-3.1)
2010 3,248.2 (7.4) 3,232.1 (7.2)
2011p 3,382.2 (4.1) 3,376.2 (4.5)
<TableⅠ-3> Trends in international natural gas supply and demand
수요전망 내지13-4 문 2012.3.8 4:2 PM 페이지39 매일3 MAC2PDF_IN 600DPI 125LPI T

Notes: 1) Values in parentheses indicate the year-on-year growth rate (%), p indicates tentative values.2) Natural gas prices for the US are based on Henry hub, while prices for Europe (excluding the UK) are based
on import border prices. Prices for Japan are LNG import prices. Source: EIU, World commodity forecasts: Industrial raw materials, January 2012
Europe’s natural gas prices continually went up starting from the second quarter of 2010.
In 2011, a year-on-year increase of 25.6% was recorded to reach 10.41US$/mBtu.
Japan’s LNG import prices indicated high year-on-year growth of 21.4% in 2010. In 2011,
Japan’s LNG import prices went up 35.32% to post US$ 14.68/mBtu.
Notes: Natural gas prices for the US are based on Henry hub, while prices for Europe (excluding the UK) arebased on import border prices. Prices for Japan are LNG import prices.
Source: World Bank Commodity Price Data
40 KOREA ENERGY ECONOMICS INSTITUTE
KEEI Korea Energy Demand Outlook
(Unit: US$/mBtu)
Category2010 2011Annual 1/4 2/4 3/4 4/4p Annual (p)
US4.39 4.18 4.37 4.12 4.00 4.17(11.1) (-18.8) (1.2) (-3.7) (5.3) (-5.0)
Europe8.29 9.45 10.31 10.88 11.00 10.41(-4.8) (6.9) (37.3) (31.7) (28.8) (25.6)
Japan10.85 11.99 13.71 16.37 16.65 14.68(21.4) (16.2) (25.2) (45.9) (52.6) (35.3)
<TableⅠ-4> Trends in international natural gas prices
[FigureⅠ-2] Trends in international natural gas prices
수요전망 내지13-4 문 2012.3.8 4:2 PM 페이지40 매일3 MAC2PDF_IN 600DPI 125LPI T

International coal prices have been continuing an upward trend since March 2009 owing
to a rise in demand resulting from the global economic recovery. During the last winter
season, international coal prices remained strong, resulting from localized heavy rain in
coal exporting countries and an abnormal cold wave in the northern hemisphere.
What mainly led the rise in prices was the demand in emerging Asian countries such as
China and India.
- Accounting for 46% of global coal consumption, China shifted into a pure importer of
steam coal in 2007. It imported 90 million tons in 2010, and became the world’s No. 2
steam coal importer, following Japan.
- It is assumed that coal consumption in China went up 8% in 2011.
- India witnessed a rise in imports in tandem with a 10.8% increase in coal consumption
in 2010. It imported 45 million tons in 2010 (world’s No. 5 importer).
- It is assumed that India’s coal consumption recorded a year-on-year rise of 8.6% in
2011, resulting in a rapid rise in imports.
ChapterⅠ International Energy Market Trends
41http://www.keei.re.kr
Trends in the international coal market3
수요전망 내지13-4 문 2012.3.8 4:2 PM 페이지41 매일3 MAC2PDF_IN 600DPI 125LPI T

Notes: Values in parentheses indicate the year-on-year growth rate. e refers to forecasts.Source: EIU, World commodity forecasts: Industrial raw materials, January 2012
The rise in prices at the end of 2010 and early 2011 is mainly attributable to heavy
rainfall in coal exporting countries and an abnormal cold wave in the northern
hemisphere.
- La Nina caused localized heavy rain in major coal exporting countries - Australia,
Indonesia, Republic of South Africa, and Venezuela. This led to issues in production
and shipment.
- The abnormal cold wave in the northern hemisphere is further aggravating coal
supply/demand conditions. Strengthened export control by the Indonesian government
and a rise in railroad freight charges in the Republic of South Africa also contributed to
the rise in prices.
- The Great East Japan Earthquake in March 2011 resulted in a rise in demand for steam
coal as a replacement for nuclear power generation, leading to continued high prices.
42 KOREA ENERGY ECONOMICS INSTITUTE
KEEI Korea Energy Demand Outlook
(Unit: Million tons)
Category 2009 2010 2011e
China3,152 3,387 3,658(15.6) (7.5) (8.0)
US908 951 937(-10.7) (4.7) (-1.5)
EU719 718 754(-8.6) (-0.1) (5.0)
India622 689 748(8.4) (10.8) (8.6)
Russia202 206 209(-11.0) (2.0) (1.5)
Japan165 188 186(-10.8) (13.9) (-1.1)
Global total6,874 7,289 7,681(3.2) (6.0) (5.4)
<TableⅠ-5> Trends in global coal consumption
수요전망 내지13-4 문 2012.3.8 4:2 PM 페이지42 매일3 MAC2PDF_IN 600DPI 125LPI T

Source: IMF (Primary Commodity Price)
In 2010, global coal production went up 6.2% year-on-year owing to high prices and
increased demand. It is estimated that global coal production increased 6.2% in 2011.
China and Indonesia led the increase in production, recording a 8.9% and 18.9% rise,
respectively, in 2010. It is estimated that production rose 11.0% and 10.9%, respectively, in 2011.
ChapterⅠ International Energy Market Trends
43http://www.keei.re.kr
[FigureⅠ-3] International coal price trends
수요전망 내지13-4 문 2012.3.8 4:2 PM 페이지43 매일3 MAC2PDF_IN 600DPI 125LPI T

Notes: Values in parentheses indicate the year-on-year growth rate. e refers to forecasts.Source: EIU, World commodity forecasts: Industrial raw materials, January 2012
44 KOREA ENERGY ECONOMICS INSTITUTE
KEEI Korea Energy Demand Outlook
(Unit: Million tons)
구 분 2009 2010 2011e
China3,050 3,321 3,687(8.9) (8.9) (11.0)
US973 985 980(-8.5) (1.2) (-0.5)
India555 569 557(7.6) (2.5) (-2.1)
Australia399 407 415(0.3) (2.0) (2.0)
Russia298 311 322(-2.6) (4.7) (3.5)
Indonesia302 359 398(10.2) (18.9) (10.9)
Global total6,967 7,401 7,861(2.3) (6.2) (6.2)
<TableⅠ-6> Trends in global coal production
수요전망 내지13-4 문 2012.3.8 4:2 PM 페이지44 매일3 MAC2PDF_IN 600DPI 125LPI T

ChapterⅡEconomic and Energy
Consumption Trends in Korea
1. Economic trends in Korea
2. Trends in primary energy consumption
3. Trends in final energy consumption
4. Consumption trends of petroleum product
5. Trends in electricity consumption
6. Trends in LNG and town gas consumption
7. Trends in coal and other energy consumption
수요전망 내지13-4 문 2012.3.8 4:2 PM 페이지45 매일3 MAC2PDF_IN 600DPI 125LPI T

수요전망 내지13-4 문 2012.3.8 4:2 PM 페이지46 매일3 MAC2PDF_IN 600DPI 125LPI T
Outline
According to Industry Activity Trends announced by Statistics Korea in November
2011, total industrial production went up 3.1% year-on-year in November.
- The mining/manufacturing industry, service industry, and retail sales went up from the
same month of the previous year, but slightly declined from the previous month.
The cyclical component of coincident index and leading index’s year-on-year
comparison went down from the previous month.
Production trends
Mining/manufacturing industry production went up 5.6% from the same month of the
previous year, thanks to favorable conditions in semiconductors and parts (21.7%) and in
the automobile industry (14.4%). This is despite a decline in image/sound/communication
equipment (-17.8%) and machinery and equipment (-5.0%).
The average operating rate in the manufacturing industry dropped 0.7%p from the
previous month to stand at 79.0%.
In terms of the service industry, there was a decrease in real estate/lease (-5.6%) and
association/repair/personal (-0.8%), but a rise in finance/insurance (5.2%),
wholesale/retail (2.2%), and health/social welfare (6.2%), etc. led to an overall increase
of 2.6% from the same month of the previous year.
Consumption trends
Retail sales witnessed a year-on-year rise of 0.5% owing to a rise in sales of durables
(5.8%), including computers/telecommunication equipment, despite a drop in quasi-
durables (-2.4%) such as clothes and nondurables (-2.0%) such as car fuel.
ChapterⅡ Economic and Energy Consumption Trends in Korea
47http://www.keei.re.kr
Economic trends in Korea10)1
10) Summary of Industry Activity Trends (November 2011) of Statistics Korea.
수요전망 내지13-4 문 2012.3.8 4:2 PM 페이지47 매일3 MAC2PDF_IN 600DPI 125LPI T

Notes: p refers to tentative figures.Source: Statistics Korea, Industrial Activity Trends (November 2011), December 2011The Bank of Korea, Economic
Statistics System (Price index)
48 KOREA ENERGY ECONOMICS INSTITUTE
KEEI Korea Energy Demand Outlook
(Compared to the same period (month) last year, %)
Category2010 2011
Annual 3/4 November 2/4 3/4 September October (p) November (p)
Production
Consumption
Investment
Prices
Sales of consumer goods(compared to the same
month (period))
Consumer prices
Producer prices
Mining/manu
facturingindustry
Production(Compared tosame month(period))
(Automobiles)
Shipment
·Exports
Inventory
Average operating rateProductioncapacity
Facility investmentindex
Domestic ordersfor machinery
Constructioncompleted in Korea
Construction orders in Korea
·Domestic demand
·Manufacturing sector( I C T )
Manufacturingindustry
Facility
Construction
16.2
16.7
25.2
23.1
14.4
11.5
18.2
17.4
81.2
7.2
6.6
25.1
11.2
-3.3
-18.7
3.0
3.8
10.9
11.2
19.1
11.3
9.9
6.6
14.5
19.1
81.2
7.8
7.5
29.3
-0.2
-6.8
-3.6
2.9
3.6
11.2
11.4
13.3
6.9
11.7
9.7
14.5
16.9
80.5
7.5
6.9
13.1
-9.2
-7.6
-48.7
3.0
4.9
7.2
7.4
10.5
12.1
7.2
3.8
11.6
10.0
81.4
5.8
5.7
4.8
8.2
-6.6
-3.3
4.0
6.4
5.1
5.1
5.4
16.2
5.0
2.6
7.9
10.7
81.3
3.9
4.4
-3.5
1.3
-8.4
0.9
4.3
6.2
6.9
7.0
10.1
15.5
7.5
4.2
11.8
10.7
81.3
3.8
2.8
-4.1
3.3
-0.9
-5.0
3.8
5.7
6.3
6.5
17.1
12.0
4.3
0.5
9.2
14.6
79.7
4.0
2.2
-11.4
15.7
2.7
56.3
3.6
5.6
5.6
5.9
13.4
14.4
3.0
-0.9
8.0
18.4
79.0
4.0
0.5
-3.7
31.5
-8.6
15.0
4.2
5.1
<TableⅡ-1> Recent economic trends
수요전망 내지13-4 문 2012.3.8 4:2 PM 페이지48 매일3 MAC2PDF_IN 600DPI 125LPI T

- In terms of different retail business types, there was a decrease in department stores and
specialized retail stores, but a rise in convenience stores, nonstore retailing, and large
discount stores.
Investment trends
Facility investments saw a year-on-year drop of 3.7% due to a decrease in investments in
general machinery and automobiles, despite an increase in investments in precision
instruments and other transportation equipment.
The number of domestic orders for machinery went up 31.5% year-on-year, attributable
to a rise in orders in the electricity industry in the public sector, as well as the electronics
and image/sound/communication equipment manufacturing industry and
telecommunications industry in the private sector.
Completed construction witnessed a year-on-year drop of 8.6% owing to decreased
performance in construction and public works.
Construction orders (at current prices) posted a year-on-year rise of 15.0%, owing to
increased orders in the public sector for apartment houses, public offices, roads, and
power generation; and in the private sector for commercial buildings, plants, and
communication.
Business indices
The cyclical component of coincident index went down 0.6p from the previous month,
attributable to a drop in service industry activity, domestic shipment index, and import
value.
The leading index’s year-on-year comparison, which is indicative of future economic
conditions, recorded a 0.1%p increase from the previous month, owing to a rise in the
consumer expectation index, value of orders made for machinery, and liquidity of
financial institutions, despite a drop in the value of construction orders, inventory cycle
index, and net barter terms of trade.
ChapterⅡ Economic and Energy Consumption Trends in Korea
49http://www.keei.re.kr
수요전망 내지13-4 문 2012.3.8 4:2 PM 페이지49 매일3 MAC2PDF_IN 600DPI 125LPI T
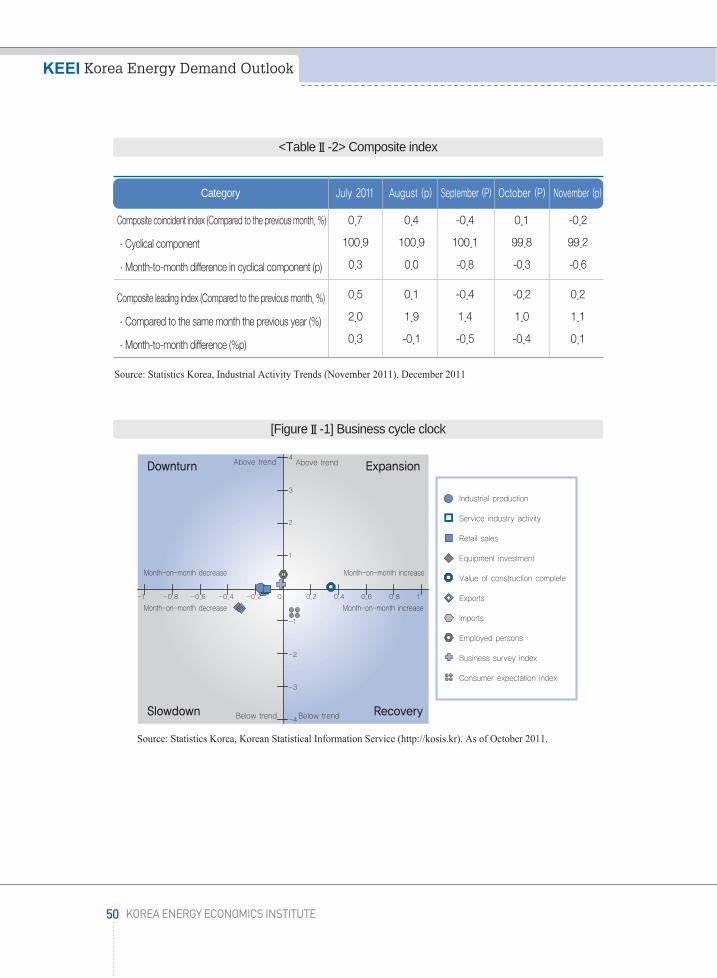
Source: Statistics Korea, Industrial Activity Trends (November 2011), December 2011
Source: Statistics Korea, Korean Statistical Information Service (http://kosis.kr). As of October 2011.
50 KOREA ENERGY ECONOMICS INSTITUTE
KEEI Korea Energy Demand Outlook
Category July 2011 August (p) September (P) October (P) November (p)
0.7 0.4 -0.4 0.1 -0.2
100.9 100.9 100.1 99.8 99.2
0.3 0.0 -0.8 -0.3 -0.6
0.5 0.1 -0.4 -0.2 0.2
2.0 1.9 1.4 1.0 1.1
0.3 -0.1 -0.5 -0.4 0.1
<TableⅡ-2> Composite index
Composite coincident index (Compared to the previous month, %)
·Cyclical component
·Month-to-month difference in cyclical component (p)
Composite leading index (Compared to the previous month, %)
·Compared to the same month the previous year (%)
·Month-to-month difference (%p)
[FigureⅡ-1] Business cycle clock
수요전망 내지13-4 문 2012.3.8 4:2 PM 페이지50 매일3 MAC2PDF_IN 600DPI 125LPI T
Business cycle
According to the Business Cycle Clock (BCC) in October 2011, the value of
construction complete and the number of employed persons are indicating an upward
trend. Imports and the business survey index are in the slowdown phase.
Industrial production, service industry activity, retail sales, equipment investment, and
exports are on a downward trend, while the consumer expectation index is in a recovery
phase.
Compared to September, the value of construction complete, number of employed
persons, and consumer expectation index slightly went up.
In contrast, imports, the business survey index, industrial production, service industry
activity, retail sales, equipment investment, and exports dropped.
From January through October 2011 (in terms of the total), primary energy consumption
tentatively reached 221.3 million TOE, a year-on-year rise of 3.3%.
From January through October, primary energy consumption indicated a gradual
increase in tandem with a slight slowdown in economic growth, despite the record-
breaking cold wave (a 5.4℃ drop from average year temperatures) in January.
- In the first quarter, Korea recorded a growth rate of 4.2%, which was close to the
potential growth rate. However, the economy’s level of growth slowed down to the
mid-3% range in the second quarter and onwards.
- Energy consumption for industrial use led a rise in primary energy consumption from
January through October as a result of continued favorable conditions in industrial
production.
* Economic growth rate by quarter in 2011: (First quarter) 4.2% → (Second quarter)
3.4% → (Third quarter) 3.5%
ChapterⅡ Economic and Energy Consumption Trends in Korea
51http://www.keei.re.kr
Trends in primary energy consumption2
수요전망 내지13-4 문 2012.3.8 4:2 PM 페이지51 매일3 MAC2PDF_IN 600DPI 125LPI T

* Industrial activity (industrial production) from January through October 2011: Year-
on-year growth of 7.4%
- The rate of increase in energy consumption was higher than the economic growth rate
from the second quarter of 2009 through the fourth quarter of 2010. However, the
relationship between the two indexes tended to take a twist in 2011.
Notes: Values for the fourth quarter of 2011 are forecasts.
52 KOREA ENERGY ECONOMICS INSTITUTE
KEEI Korea Energy Demand Outlook
[FigureⅡ-2] Recent economic and primary energy consumption trends
수요전망 내지13-4 문 2012.3.8 4:2 PM 페이지52 매일3 MAC2PDF_IN 600DPI 125LPI T
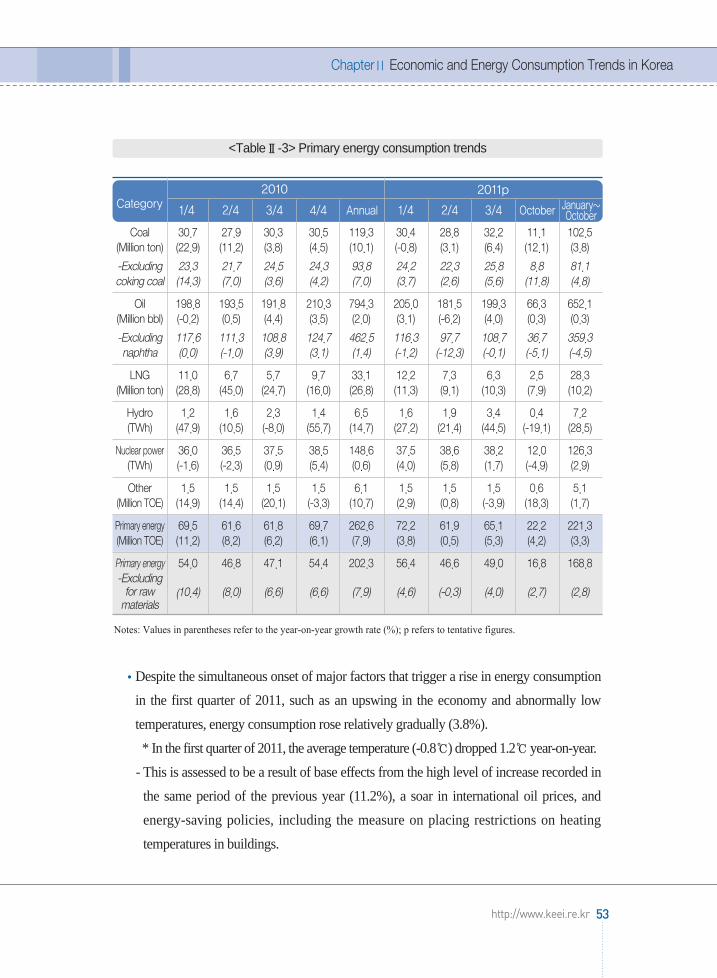
Notes: Values in parentheses refer to the year-on-year growth rate (%); p refers to tentative figures.
Despite the simultaneous onset of major factors that trigger a rise in energy consumption
in the first quarter of 2011, such as an upswing in the economy and abnormally low
temperatures, energy consumption rose relatively gradually (3.8%).
* In the first quarter of 2011, the average temperature (-0.8℃) dropped 1.2℃ year-on-year.
- This is assessed to be a result of base effects from the high level of increase recorded in
the same period of the previous year (11.2%), a soar in international oil prices, and
energy-saving policies, including the measure on placing restrictions on heating
temperatures in buildings.
ChapterⅡ Economic and Energy Consumption Trends in Korea
53http://www.keei.re.kr
Category2010 2011p
1/4 2/4 3/4 4/4 Annual 1/4 2/4 3/4 October January~October
<TableⅡ-3> Primary energy consumption trends
30.7 27.9 30.3 30.5 119.3 30.4 28.8 32.2 11.1 102.5(22.9) (11.2) (3.8) (4.5) (10.1) (-0.8) (3.1) (6.4) (12.1) (3.8)
23.3 21.7 24.5 24.3 93.8 24.2 22.3 25.8 8.8 81.1(14.3) (7.0) (3.6) (4.2) (7.0) (3.7) (2.6) (5.6) (11.8) (4.8)
198.8 193.5 191.8 210.3 794.3 205.0 181.5 199.3 66.3 652.1(-0.2) (0.5) (4.4) (3.5) (2.0) (3.1) (-6.2) (4.0) (0.3) (0.3)
117.6 111.3 108.8 124.7 462.5 116.3 97.7 108.7 36.7 359.3(0.0) (-1.0) (3.9) (3.1) (1.4) (-1.2) (-12.3) (-0.1) (-5.1) (-4.5)
11.0 6.7 5.7 9.7 33.1 12.2 7.3 6.3 2.5 28.3(28.8) (45.0) (24.7) (16.0) (26.8) (11.3) (9.1) (10.3) (7.9) (10.2)
1.2 1.6 2.3 1.4 6.5 1.6 1.9 3.4 0.4 7.2(47.9) (10.5) (-8.0) (55.7) (14.7) (27.2) (21.4) (44.5) (-19.1) (28.5)
36.0 36.5 37.5 38.5 148.6 37.5 38.6 38.2 12.0 126.3(-1.6) (-2.3) (0.9) (5.4) (0.6) (4.0) (5.8) (1.7) (-4.9) (2.9)
1.5 1.5 1.5 1.5 6.1 1.5 1.5 1.5 0.6 5.1(14.9) (14.4) (20.1) (-3.3) (10.7) (2.9) (0.8) (-3.9) (18.3) (1.7)
69.5 61.6 61.8 69.7 262.6 72.2 61.9 65.1 22.2 221.3(11.2) (8.2) (6.2) (6.1) (7.9) (3.8) (0.5) (5.3) (4.2) (3.3)
54.0 46.8 47.1 54.4 202.3 56.4 46.6 49.0 16.8 168.8
(10.4) (8.0) (6.6) (6.6) (7.9) (4.6) (-0.3) (4.0) (2.7) (2.8)
Coal(Million ton)
-Excluding coking coal
Oil(Million bbl)
-Excludingnaphtha
LNG(Million ton)
Hydro(TWh)
Nuclear power(TWh)
Other(Million TOE)
Primary energy(Million TOE)
Primary energy-Excludingfor raw materials
수요전망 내지13-4 문 2012.3.8 4:2 PM 페이지53 매일3 MAC2PDF_IN 600DPI 125LPI T

* Measure on placing restrictions on heating temperatures in buildings (January 24 -
February 18): A total 441 large buildings were made to keep heating temperatures at
20℃ or lower.
* Emergency energy-saving measure (February 27 and onwards): Restrictions were
placed on outdoor lighting of 2,603 public facilities and the license plate rationing
system was implemented.
* A 32% rise in average Dubai oil prices ($/bbl): (First quarter of 2010) 75.90 → (First
quarter of 2011) 100.44
Primary energy consumption recorded a year-on-year increase of a mere 0.5% in the
second quarter, but posted relatively high growth of 5.3% in the third quarter.
- The major cause of the slowdown in the level of increase in energy consumption in the
second quarter is assumed to be reduced consumption (-7.3%) of gasoline and diesel
for transport in the second quarter in tandem with oil companies’ policy on adjusting
the supplied volume.11)
- It is presumed that oil companies reduced the volume supplied to gas stations from
early April through early July with the reduction in prices of gasoline and diesel for
54 KOREA ENERGY ECONOMICS INSTITUTE
KEEI Korea Energy Demand Outlook
[FigureⅡ-3] Trends in Dubai spot oil price
수요전망 내지13-4 문 2012.3.8 4:2 PM 페이지54 매일3 MAC2PDF_IN 600DPI 125LPI T

transport (100 won/ℓ) during the same period.
- In the third quarter, after price reductions came to an end, consumption of gasoline and
diesel for transport rose 4.6% year-on-year and contributed to a rise in the level of
increase in primary energy consumption in the same period.
Level of contribution of each factor that led to an increase in primary energy consumption
from January through September 201112)
Regarding the level of contribution of each factor that led to a rise in primary energy
consumption from January through September 2011, the level of contribution of
economic growth reached 112.7%. The level of contribution of the temperature effect
was also high at 20.9%.
The level of contribution of economic growth to a rise in primary energy consumption is
estimated at 3.6%p (7.0 million TOE).
- It is assumed that primary energy consumption would have recorded a year-on-year
increase of 3.6% from January through September 2011 as a result of economic growth
if there were no changes in other factors that trigger a change in consumption such as
temperature and energy efficiency improvement.
The temperature effect contributed 0.7%p (1.3 million TOE) to a rise in primary energy
consumption.
- It is assumed that energy consumption rose 0.7% from January through September as a
result of a year-on-year drop in the average temperature in the first quarter, including
the record-breaking cold wave in 48 years that took place in January 2011.
- The amount of increase in consumption triggered by the temperature effect reached 1.3
million TOE.
ChapterⅡ Economic and Energy Consumption Trends in Korea
55http://www.keei.re.kr
11) Oil supply and demand statistics are supply statistics. For this reason, they may not reflect actualconsumption based on inventory changes. It is assessed that this led to a reduction in consumption of oil fortransport.
12) GDP is announced by quarter. For this reason, an analysis of the level of contribution made to a rise inconsumption is limited to January through September.
수요전망 내지13-4 문 2012.3.8 4:2 PM 페이지55 매일3 MAC2PDF_IN 600DPI 125LPI T

* Average temperature in the first quarter: (Year 2010) 0.4℃ → (Year 2011) -0.8℃;
Increase of 6.9% in HDD
* Average temperature in January: (Year 2010) -4.5℃ → (Year 2011) -7.2℃; Increase
of 11.9% in HDD
In contrast, energy consumption went down 1.1%p (2.1 million TOE) as a result of
changes in other factors such as energy efficiency improvements and a rise in oil prices.
Notes: Figures in parentheses refer to the amount of contribution made by each factor to changes in energyconsumption.
Notes: Other effects include all factors that cause changes in consumption, excluding the temperature effect andeconomic growth effect. Examples are improvements in energy efficiency, changes in industrial structure, andchanges in energy prices.
56 KOREA ENERGY ECONOMICS INSTITUTE
KEEI Korea Energy Demand Outlook
[FigureⅡ-4] Level of contribution to increase in primary energy consumption by each factor from January through September 2011
CategoryAmount of contribution to a rise in consumption
(1,000 TOE)
Rate of contribution to a rise in
consumption (%)
Level of contribution to rateof increase in primary energy consumption
Growth effect 6,985 112.7 3.6%p
Temperature effect 1,296 20.9 0.7%p
Other effects -2,084 -33.6 -1.1%p
Total effects 6,197 100.0 3.2%
<TableⅡ-4> Level of contribution of each factor that led to a rise in primary energy consumption from January through September 2011
수요전망 내지13-4 문 2012.3.8 4:2 PM 페이지56 매일3 MAC2PDF_IN 600DPI 125LPI T

Trends in consumption of each energy source from January through October 2011
Petroleum product consumption showed little change and posted a year-on-year rise of
0.3%, influenced by sluggish consumption (-6.2%) in the second quarter.
- Consumption of fuel for transport was stagnant and consumption of heavy oil for
industrial fuel decreased. In contrast, naphtha consumption for industrial raw material
use went up 7.0% year-on-year as a result of increased production activities in the
petrochemical industry. As of 2010, naphtha consumption for industrial raw material
use accounted for 42% of total oil consumption.
- When excluding naphtha, petroleum product consumption went down 4.5% year-on-year.
Coal consumption witnessed a year-on-year rise of 3.8%.
- Coal consumption soared (10.1%) in 2010. However, the level of increase substantially
slowed down afterwards as a result of a mere 0.1% rise in bituminous coal
consumption for steelmaking from January through October 2011. Bituminous coal
consumption for steelmaking accounted for 21.4% of total consumption in 2010.
- Coal consumption for power generation went up 8.9% in 2010, and also rose 3.6%
from January through October 2011. This is attributable to the continued use of power
generation facilities at the highest level, notwithstanding zero facility expansion after
the construction of Unit 8 of the Hadong Thermal Power Plant in 2009.
Natural gas (LNG) consumption rose 26.8% in 2010, followed by two-digit growth
(10.2%) from January through October 2011.
- From January through October, LNG consumption for power generation recorded high
growth of 11.8% year-on-year, attributable to an increase in electricity demand (5.5%)
and shortage of base-load power generation facilities, despite the operation of Singori
Nuclear Power Plant Unit 1.
- LNG consumption for production of town gas increased 9.3%, which meant a slight
slowdown from the level of increase (12.4%) witnessed in 2010.
From January through October 2011, the level of nuclear power generation rose 2.9%
year-on-year as a result of operation of Singori Nuclear Power Plant Unit 113).
ChapterⅡ Economic and Energy Consumption Trends in Korea
57http://www.keei.re.kr
13) Korea’s 21st nuclear power plant. Began commercial operation on February 28, 2011.
수요전망 내지13-4 문 2012.3.8 4:2 PM 페이지57 매일3 MAC2PDF_IN 600DPI 125LPI T

From January through October 2011, final energy consumption rose by 3.1% year-on-year
to stand at 163.2 million TOE, according to tentative figures.
58 KOREA ENERGY ECONOMICS INSTITUTE
KEEI Korea Energy Demand Outlook
[FigureⅡ-5] Trends in primary energy consumption increase rate
Trends in final energy consumption3
수요전망 내지13-4 문 2012.3.8 4:2 PM 페이지58 매일3 MAC2PDF_IN 600DPI 125LPI T

Notes: Values in parentheses are the year-on-year growth rate (%); p refers to tentative figures.
ChapterⅡ Economic and Energy Consumption Trends in Korea
59http://www.keei.re.kr
Category2010 2011p
1/4 2/4 3/4 4/4 Annual 1/4 2/4 3/4 October January~October
<TableⅡ-5> Trends in final energy consumption
29.0 28.5 27.8 29.9 115.2 29.7 29.0 30.1 10.3 99.1(14.2) (9.2) (4.4) (6.7) (8.5) (2.4) (1.8) (8.4) (8.4) (4.6)
13.5 13.7 13.1 14.6 54.8 14.0 13.7 14.0 4.9 46.6(14.1) (9.4) (3.7) (9.0) (9.0) (3.9) (0.4) (7.2) (7.4) (4.1)
8.6 9.3 9.5 9.6 36.9 8.8 8.7 9.8 3.1 30.4(1.2) (2.3) (4.8) (2.8) (2.8) (2.8) (-5.8) (2.6) (-2.0) (-0.4)
13.3 7.6 6.1 10.3 37.3 14.0 7.4 6.1 2.4 30.0
(4.9) (9.6) (3.9) (0.2) (4.3) (5.4) (-2.5) (1.1) (-1.0) (1.9)
1.2 1.0 1.0 1.2 4.5 1.3 1.0 1.1 0.4 3.7(7.6) (2.3) (1.8) (5.2) (4.4) (4.0) (-4.4) (7.7) (-0.8) (2.2)
52.1 46.4 44.3 51.0 193.8 53.8 46.2 47.0 16.1 163.2(9.2) (7.7) (4.3) (4.5) (6.5) (3.3) (-0.6) (6.1) (4.6) (3.1)
36.6 31.6 29.6 35.7 133.5 38.1 30.9 31.0 10.8 110.7
(7.3) (7.0) (4.0) (4.5) (5.7) (4.2) (-2.3) (4.5) (2.3) (2.2)
7.6 4.2 2.6 5.4 20.0 8.1 4.5 3.0 1.3 16.9(10.8) (17.9) (-0.9) (3.2) (8.3) (6.2) (5.5) (14.8) (12.3) (7.9)
188.7 187.7 186.7 204.3 767.4 194.7 178.1 195.7 65.2 633.7(0.8) (0.9) (3.1) (3.2) (2.0) (3.1) (-5.1) (4.8) (0.2) (0.9)
107.6 105.6 103.7 118.7 435.6 106.0 94.2 105.0 35.6 340.9(1.7) (-0.4) (1.6) (2.6) (1.4) (-1.5) (-10.8) (1.3) (-5.4) (-3.9)
112.5 103.6 109.1 109.0 434.2 121.4 109.0 112.5 35.6 378.5(12.2) (10.3) (10.2) (7.7) (10.1) (7.9) (5.1) (3.2) (6.1) (5.5)
11.3 10.4 9.5 10.7 41.8 10.6 10.7 10.7 3.9 36.0(37.0) (26.1) (0.4) (6.5) (16.4) (-5.5) (3.0) (13.0) (15.6) (4.2)
3.9 4.2 3.7 4.5 16.3 4.4 4.2 4.3 1.7 14.6(6.6) (22.0) (-5.4) (7.8) (7.3) (12.5) (-0.1) (17.9) (19.3) (10.7)
2,114 1,557 1,409 1,985 7,064 2,203 1,612 1,417 609 5,841
(13.0) (11.9) (15.2) (2.6) (10.1) (4.2) (3.6) (0.6) (12.4) (3.9)
Industry(Million TOE)
-Excluding forraw materials
Transport(Million TOE)
Residential/commercial(Million TOE)
Public/other(Million TOE)
Total(Million TOE)
Total-Excluding forraw materials
Town gas(Billion m3)
Oil(Million bbl)
-Excludingnaphtha
Electricity(TWh)
Coal(Million ton)
-Excludingcoking coal
Thermal andother
(Thousand TOE)
수요전망 내지13-4 문 2012.3.8 4:2 PM 페이지59 매일3 MAC2PDF_IN 600DPI 125LPI T

From January through October 2011, the industrial, residential/commercial, and
public/other sector recorded a level of increase of 4.6%, 1.9%, and 2.2%, respectively. In
contrast, consumption in the transport sector went down 0.4%.
- Sluggish consumption in the transport sector is a result of a decrease (-6.2%) in
consumption of oil for transport in the second quarter.
- Despite abnormally low temperatures in the first quarter, energy consumption in the
residential/commercial sector and public/other sector, which are highly influenced by
the weather, was unprecedentedly low.
By energy source, there was a rapid increase in consumption of naphtha for raw material
use in the petrochemical industry (7.0%) and electricity consumption (5.5%), as a result
of continued favorable conditions in industries that consume great amounts of energy
and the cold wave.
- An analysis of the share of final energy consumption taken up by different uses and
energy sources from January through October 2011 indicates that the share taken up by
energy for industrial raw material use (naphtha, coking coal) was the highest at 32.1%.
- It was followed by petroleum for fuel (27.8%), electricity (20.0%), and town gas
(10.9%).
60 KOREA ENERGY ECONOMICS INSTITUTE
KEEI Korea Energy Demand Outlook
[FigureⅡ-6] Final energy consumption by energy source from January through October 2011
수요전망 내지13-4 문 2012.3.8 4:2 PM 페이지60 매일3 MAC2PDF_IN 600DPI 125LPI T

Final energy consumption trends by sector from January through October 2011
Energy consumption in the industrial sector indicated a year-on-year rise of 4.6%, thus
leading an increase in final energy consumption.
- Energy consumption in the manufacturing industry, which accounts for more than 95%
of energy consumption in the industrial sector, went up 4.4% year-on-year. This is
attributable to continued favorable conditions in the fabricated metal, metal product
(steel), and petrochemical industries.
- In terms of the rate of increase in value-added of different business types from January
through September compared to the same period of the previous year, the fabricated
metal industry recorded 10.3%, the metal product (steel) industry, 7.5%, and the
petrochemical industry, 4.6%.
Source: Statistics Korea, Korean Statistical Information Service (http://kosis.kr)
Level of contribution made to increase in energy consumption in the manufacturing
industry from January through September 201114)
- The level of contribution made by production activities towards a rise in energy
consumption in the manufacturing industry is estimated at 7.5%p. A rise in production
activities contributed to a 5.5 million TOE increase in energy consumption in the
ChapterⅡ Economic and Energy Consumption Trends in Korea
61http://www.keei.re.kr
[FigureⅡ-7] Rate of increase in value-added of each business type under the manufacturing industry from January through September 2011
수요전망 내지13-4 문 2012.3.8 4:2 PM 페이지61 매일3 MAC2PDF_IN 600DPI 125LPI T

manufacturing industry from January through September 2011.
- The level of contribution made by the industrial structure change effect was -2.4%p. It
contributed to decreasing energy consumption in the manufacturing industry by 1.7 million
TOE. This is because the share of manufacturing industry added value taken up by the
fabricated metal industry, whose energy intensity is relatively low, increased, while the
share taken up by the petrochemical industry, whose energy intensity is high, went down.
* Share of added value accounted for by the fabricated metal industry: (January through
September 2010) 56.9% → (January through September 2011) 58.4%
* Share of added value accounted for by the petrochemical industry: (January through
September 2010) 14.9% → (January through September 2011) 14.5%
- It is estimated that the reduced energy intensity of the manufacturing industry had a
consumption-reducing effect of 0.8%p (0.6 million TOE).
Notes: Energy consumption in the manufacturing industry excludes anthracite and new & renewable energy. This isbecause statistics on new & renewable energy and anthracite for industrial use are compiled for only the entireindustrial sector, and are not broken down into statistics by business type.
62 KOREA ENERGY ECONOMICS INSTITUTE
KEEI Korea Energy Demand Outlook
14) The added value of each business type under the manufacturing industry is announced by quarter. For thisreason, an analysis of the level of contribution made to a rise in consumption is limited to January throughSeptember.
CategoryAmount of contribution made
to consumption increase(1,000 TOE)
Rate of contribution made to consumption
increase (%)
Level of contribution to rate ofincrease in energy consumptionin the manufacturing industry
Production effect 5,493 172.3 7.5%p
Industrial structure -1,732 -54.3 -2.4%pchange effect
Energy intensity -574 -18.0 -0.8%pimprovement effect
Total effects(Rise in consumption in the 3,188 100.0 4.3%manufacturing industry)
<TableⅡ-6> Level of contribution of each factor that triggers a change in energy consumption inthe manufacturing industry from January through September 2011
수요전망 내지13-4 문 2012.3.8 4:2 PM 페이지62 매일3 MAC2PDF_IN 600DPI 125LPI T

In the 2000s, consumption in the transport sector rapidly stabilized15). It recorded a year-
on-year drop of 0.4% from January through October 2011.
- A sound increase of 2.8% was recorded in the first quarter. However, consumption
went down by a great extent (-5.8%) in the second quarter due to a decrease in the
shipment volume of gasoline and diesel for transport16).
- As a measure against high oil prices, oil companies temporarily reduced prices (100
won/ℓ) of gasoline and diesel for transport in the second quarter, but consumption
actually went down. This is presumed to be a result of a contraction in consumption
from high oil prices and adjustment of the shipment volume by oil companies with the
price reduction.
ChapterⅡ Economic and Energy Consumption Trends in Korea
63http://www.keei.re.kr
[FigureⅡ-8] Level of contribution made by each factor that triggers a change in energyconsumption in the manufacturing industry from January through September
15) Energy consumption in the transport sector recorded high growth of an annual average 7.9% in the 1990s.However, it posted low growth of an annual average 1.7% in the 2000s.
16) Oil supply/demand statistics are statistics on oil supplied and sold by oil companies, rather than statisticsthat reflect actual consumption. The supply volume is identified as the amount of consumption.
수요전망 내지13-4 문 2012.3.8 4:2 PM 페이지63 매일3 MAC2PDF_IN 600DPI 125LPI T

From January through October 2011, consumption in the residential/commercial sector
indicated steady growth of 1.9% year-on-year despite abnormally low temperatures17) in
the first quarter.
- Consumption in the residential/commercial sector, where energy consumption for
heating takes up a high share, indicated low growth because of a soar in oil prices and a
certain degree of influence by energy-saving policies, such as the measure on placing
restrictions on heating temperatures in buildings. These measures were implemented to
manage electricity demand in the winter.
- Another major reason was because of a slowdown in the level of increase in
consumption for cooling purposes in the third quarter, owing to a lower average
summer temperature than the average year.
Energy consumption in the public/other sector18) rose 4.4% in 2010, but went up only
2.2% from January through October 2011.
64 KOREA ENERGY ECONOMICS INSTITUTE
KEEI Korea Energy Demand Outlook
17) Average temperature dropped -1.2℃ and HDD increased 6.9% compared to the same period of the previousyear.
[FigureⅡ-9] Trends in consumer prices of oil for transport
수요전망 내지13-4 문 2012.3.8 4:2 PM 페이지64 매일3 MAC2PDF_IN 600DPI 125LPI T

- It is presumed that the emergency energy-saving measure19) that was implemented in
response to a soar in international oil prices somewhat contributed to a contraction in
consumption in this sector.
Trends in final energy consumption by energy source from January through October 2011
With continued favorable conditions in industrial activities, energy sources for industrial
use led a rise in consumption from January through October.
- In terms of oil, consumption of petroleum products for transport, including gasoline,
diesel for transport, and LPG declined 0.6%. Consumption for heating in the
residential/commercial sector also went down 2.3%. In contrast, naphtha consumption
went up 7.0% as a result of favorable conditions in the petrochemical industry.
ChapterⅡ Economic and Energy Consumption Trends in Korea
65http://www.keei.re.kr
18) Consumption in this sector includes energy consumption by government offices, for military purposes, andby public service providers such as those in charge of water supply.
19) The energy crisis level was raised to caution on February 27, when international oil prices exceeded 100dollars per barrel for more than five days. Afterwards, restrictions were placed on outdoor lighting at 2,603public facilities. In addition, outdoor nighttime lighting at 92 thousand or so private business sites was turnedoff, and the license plate rationing system was implemented.
[FigureⅡ-10] Trends in the rate of final energy consumption increase by sector
수요전망 내지13-4 문 2012.3.8 4:2 PM 페이지65 매일3 MAC2PDF_IN 600DPI 125LPI T
- Town gas consumption for industrial use went up 12.7% to lead an increase in overall
town gas consumption. Consumption for residential/commercial use and public use
also indicated sound growth of 4.9%.
- Coal consumption dropped 5.5%, influenced by a decrease (-15.1%) in bituminous
coal consumption for steel making in the first quarter. It turned around afterwards and
indicated a year-on-year rise of 4.2%.
- Electricity consumption recorded year-on-year growth of 5.5%, attributable to
continued strong consumption of electricity for industrial use (year-on-year rise of
9.3%). Electricity consumption for industrial use continued high growth of more than
7.0% every month from October 2010 through October 2011, owing to an upswing in
production activities in industries that consume great amounts of electricity (machinery
and equipment, chemical products, automobiles, steel, etc.).
Level of contribution of each final energy source to an increase in primary energy
consumption from January through October 2011
- The level of contribution of electricity (triggering energy consumption for power
generation) and energy for industrial raw material use (naphtha, coking coal) stood at
41.4% and 34.8%, respectively, as a result of an upswing in production in industries
that consume great amounts of energy.
- Electricity consumption, which triggers considerable energy conversion loss, indicated
a relatively high level of increase (5.5%) compared to other energy sources. The level
of contribution made by electricity was the highest.
- The level of contribution made by energy for raw material use was high from January
through October 2011 in tandem with a rise in naphtha consumption (7.0%).
- The level of contribution made by town gas, a major source of energy for heating, was
25.0% as a result of the cold weather in the first quarter.
66 KOREA ENERGY ECONOMICS INSTITUTE
KEEI Korea Energy Demand Outlook
수요전망 내지13-4 문 2012.3.8 4:2 PM 페이지66 매일3 MAC2PDF_IN 600DPI 125LPI T

ChapterⅡ Economic and Energy Consumption Trends in Korea
67http://www.keei.re.kr
[FigureⅡ-11] Level of contribution of each energy source to primary energy increase from January through October 2011
수요전망 내지13-4 문 2012.3.8 4:2 PM 페이지67 매일3 MAC2PDF_IN 600DPI 125LPI T

A. Consumption trends of petroleum products by sector
Total petroleum product consumption in October 2011 was estimated at around 66.3
million barrels, a year-on-year rise of 0.3%. Total petroleum product consumption from
January through October reached 652.1 million barrels, a year-on-year rise of 0.3%.
Naphtha consumption indicated a year-on-year rise of 7.0%, leading overall oil
consumption. In contrast, consumption of other petroleum products decreased 4.6%
year-on-year as a result of a rise in prices and weakened price competitiveness.
With regards to petroleum product consumption by sector from January through October
2011, consumption went down in all sectors, except for consumption for industrial raw
materials (excluding LPG used to replace naphtha) and consumption for gas production.
The transport sector indicated a 0.6% decrease year-on-year in tandem with reduced
consumption of diesel and LPG, which take up a high share of oil consumption in the
transport sector. This is despite a rise in heavy oil and jet oil consumption in tandem with
a rise in exports and overseas traveling.
The industrial sector recorded a year-on-year increase of 2.2% despite reduced
consumption for use as fuel. This resulted from increased naphtha consumption,
triggered by an upswing in production in the petrochemical industry.
- Petroleum consumption for fuel, including LPG for naphtha replacement, went down
12.4% year-on-year. However, naphtha consumption rose 7.0%, leading to 371.7
million bbl of oil consumed in the industrial sector.
The residential/commercial/public sector recorded a decrease of 2.3% year-on-year,
resulting from a rise in average temperatures in the second quarter and high oil prices.
The transformation sector witnessed a 15.8% drop year-on-year, owing to a substantial
decrease in heavy oil consumption for power generation despite a rise in propane
demand for production of town gas.
68 KOREA ENERGY ECONOMICS INSTITUTE
KEEI Korea Energy Demand Outlook
Consumption trends of petroleum product4
수요전망 내지13-4 문 2012.3.8 4:2 PM 페이지68 매일3 MAC2PDF_IN 600DPI 125LPI T
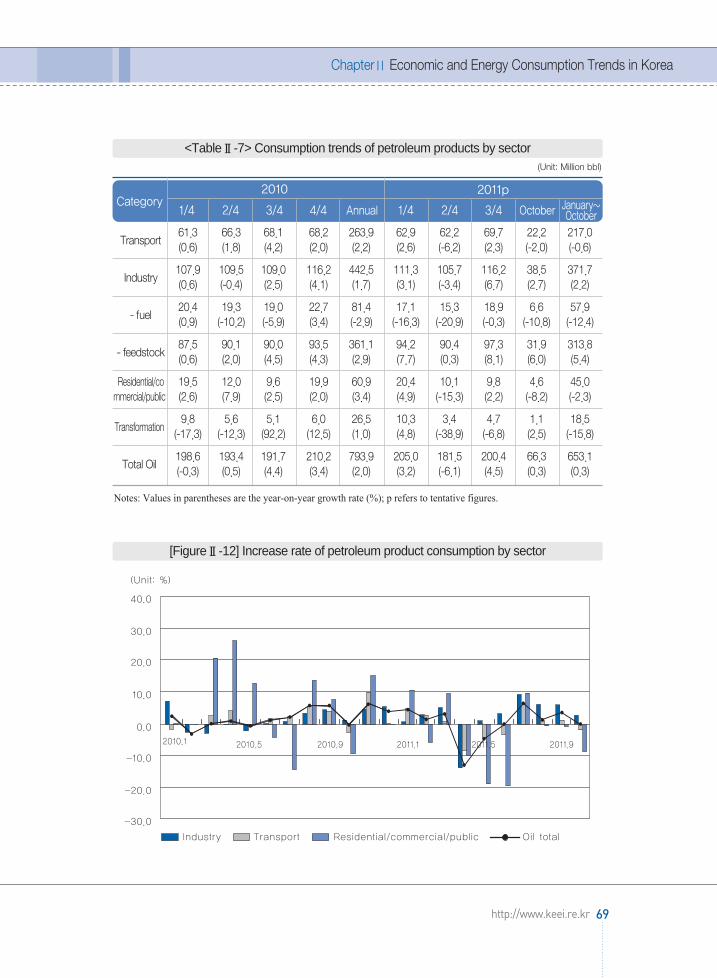
Notes: Values in parentheses are the year-on-year growth rate (%); p refers to tentative figures.
ChapterⅡ Economic and Energy Consumption Trends in Korea
69http://www.keei.re.kr
(Unit: Million bbl)
Category2010 2011p
1/4 2/4 3/4 4/4 Annual 1/4 2/4 3/4 October January~October
<TableⅡ-7> Consumption trends of petroleum products by sector
Transport61.3 66.3 68.1 68.2 263.9 62.9 62.2 69.7 22.2 217.0(0.6) (1.8) (4.2) (2.0) (2.2) (2.6) (-6.2) (2.3) (-2.0) (-0.6)
Industry107.9 109.5 109.0 116.2 442.5 111.3 105.7 116.2 38.5 371.7(0.6) (-0.4) (2.5) (4.1) (1.7) (3.1) (-3.4) (6.7) (2.7) (2.2)
- fuel20.4 19.3 19.0 22.7 81.4 17.1 15.3 18.9 6.6 57.9(0.9) (-10.2) (-5.9) (3.4) (-2.9) (-16.3) (-20.9) (-0.3) (-10.8) (-12.4)
- feedstock87.5 90.1 90.0 93.5 361.1 94.2 90.4 97.3 31.9 313.8(0.6) (2.0) (4.5) (4.3) (2.9) (7.7) (0.3) (8.1) (6.0) (5.4)
Residential/co 19.5 12.0 9.6 19.9 60.9 20.4 10.1 9.8 4.6 45.0mmercial/public (2.6) (7.9) (2.5) (2.0) (3.4) (4.9) (-15.3) (2.2) (-8.2) (-2.3)
Transformation9.8 5.6 5.1 6.0 26.5 10.3 3.4 4.7 1.1 18.5
(-17.3) (-12.3) (92.2) (12.5) (1.0) (4.8) (-38.9) (-6.8) (2.5) (-15.8)
Total Oil 198.6 193.4 191.7 210.2 793.9 205.0 181.5 200.4 66.3 653.1(-0.3) (0.5) (4.4) (3.4) (2.0) (3.2) (-6.1) (4.5) (0.3) (0.3)
[FigureⅡ-12] Increase rate of petroleum product consumption by sector
수요전망 내지13-4 문 2012.3.8 4:2 PM 페이지69 매일3 MAC2PDF_IN 600DPI 125LPI T

B. Consumption trends of key petroleum products
With regards to trends in oil consumption by key product from January through October
2011, consumption of naphtha for industrial raw material use and LPG for gas production
went up. On the other hand, consumption of LPG for industrial raw material use and
products for transport and heating went down.
Notes: Values in parentheses are the year-on-year growth rate (%); p refers to tentative figures.
Consumption of gasoline posted a year-on-year increase of 0.6%, but consumption of
diesel for transport recorded a 1.0% decline to stand at 86.3 million barrels.
- Consumption went down in the first half of the year as a result of a contraction in
consumption in tandem with high oil prices. However, it turned around and recorded a
rise compared to the same period of the previous year in the third quarter. From
January through October, gasoline consumption rose 0.6% year-on-year to reach 57.5
70 KOREA ENERGY ECONOMICS INSTITUTE
KEEI Korea Energy Demand Outlook
(Unit: Million bbl)
Category2010 2011p
1/4 2/4 3/4 4/4 Annual 1/4 2/4 3/4 October January~October
<TableⅡ-8> Consumption trends of key petroleum products
Gasoline15.9 16.9 18.5 17.7 68.9 16.3 16.3 19.1 5.8 57.5
(4.6) (2.8) (8.1) (3.1) (4.6) (2.8) (-3.5) (3.2) (-1.6) (0.6)
Diesel for 24.0 27.2 26.6 27.4 105.2 24.3 24.6 28.1 9.3 86.3transport (0.5) (0.4) (2.8) (0.5) (1.1) (1.2) (-9.5) (5.6) (-1.0) (-1.0)
17.7 10.8 10.1 20.1 58.7 18.6 9.4 10.1 4.8 43.0
(6.4) (5.6) (17.3) (7.8) (8.5) (5.1) (-13.1) (0.0) (-16.2) (-3.3)
19.8 15.0 13.7 16.5 65.0 19.3 11.5 12.8 3.4 45.8
(-17.0) (-12.2) (13.6) (0.1) (-6.5) (-2.2) (-23.3) (-6.3) (-23.9) (-14.0)
Naphtha81.1 82.1 83.0 85.6 331.8 88.7 83.9 90.7 29.6 292.8
(-0.3) (2.6) (5.1) (4.0) (2.9) (9.3) (2.1) (9.2) (7.9) (7.0)
26.5 26.1 25.6 27.0 105.2 24.6 22.3 25.6 8.5 81.0
(1.3) (0.1) (-6.2) (0.8) (-1.0) (-7.0) (-14.8) (0.2) (9.5) (-5.7)
LPG(including for
power generation)
Heavy oil(including for
power generation)
Kerosene+Diesel(including for
power generation)
수요전망 내지13-4 문 2012.3.8 4:2 PM 페이지70 매일3 MAC2PDF_IN 600DPI 125LPI T

million barrels. Consumption of diesel for transport reached 86.3 million barrels,
indicating a substantial reduction in the level of decrease.
ChapterⅡ Economic and Energy Consumption Trends in Korea
71http://www.keei.re.kr
[FigureⅡ-14] Consumption of diesel for transport and increase rate
[FigureⅡ-13] Gasoline consumption and increase rate
수요전망 내지13-4 문 2012.3.8 4:2 PM 페이지71 매일3 MAC2PDF_IN 600DPI 125LPI T

Consumption of kerosene and diesel, excluding diesel for transport, witnessed a 3.3%
decline year-on-year owing to a considerable drop in consumption for heating purposes
due to a rise in average temperatures and weakened price competitiveness.
Consumption of heavy oil posted a year-on-year drop of 14.0% to stand at 45.8 million barrels,
attributable to a decrease in consumption for industrial and power generation purposes,
notwithstanding a rise in consumption for transport in tandem with an upswing in exports.
72 KOREA ENERGY ECONOMICS INSTITUTE
KEEI Korea Energy Demand Outlook
[FigureⅡ-16] Consumption of heavy oil and increase rate
[FigureⅡ-15] Consumption of kerosene and diesel and increase rate
수요전망 내지13-4 문 2012.3.8 4:2 PM 페이지72 매일3 MAC2PDF_IN 600DPI 125LPI T

Naphtha consumption recorded a year-on-year rise of 7.0% to reach 292.8 million
barrels as a result of a rapid increase in consumption, owing to a boom in the
petrochemical industry.
- Due to decreased consumption of petroleum products, with the exception of naphtha,
the share of total oil consumption taken up by naphtha consumption continually rose
and reached an unprecedented high at 44.9%.
LPG consumption recorded a year-on-year decrease of 5.7%, owing to a drop in
consumption for naphtha replacement and for transport, despite a substantial rise in
propane demand in the gas production sector.
ChapterⅡ Economic and Energy Consumption Trends in Korea
73http://www.keei.re.kr
[FigureⅡ-17] Consumption of naphtha and increase rate
수요전망 내지13-4 문 2012.3.8 4:2 PM 페이지73 매일3 MAC2PDF_IN 600DPI 125LPI T
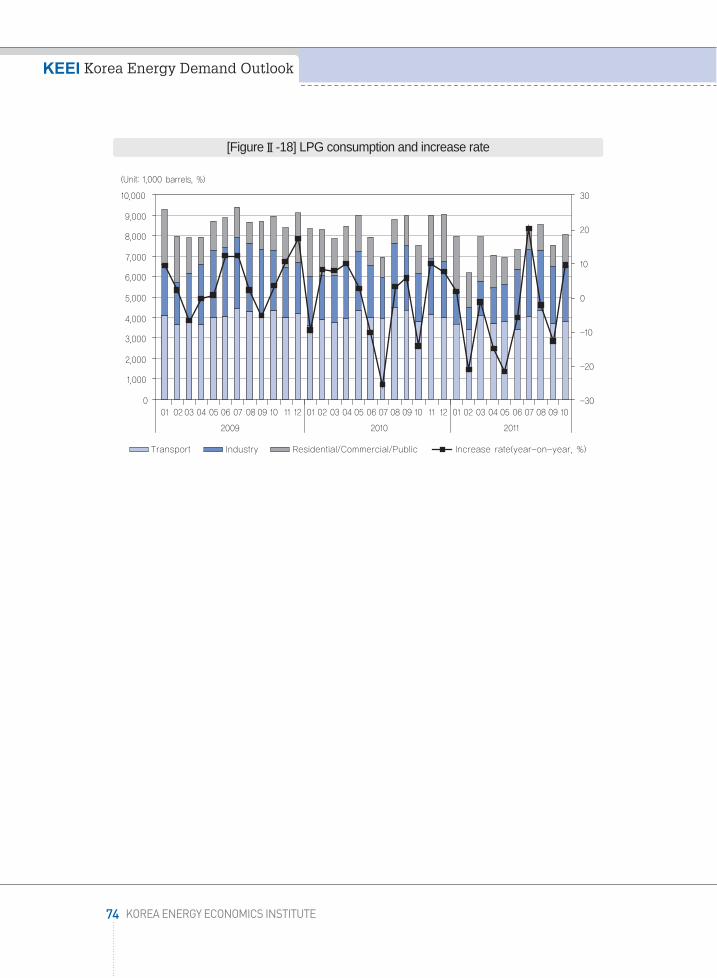
74 KOREA ENERGY ECONOMICS INSTITUTE
KEEI Korea Energy Demand Outlook
[FigureⅡ-18] LPG consumption and increase rate
수요전망 내지13-4 문 2012.3.8 4:2 PM 페이지74 매일3 MAC2PDF_IN 600DPI 125LPI T

Electricity consumption recorded a year-on-year rise of 5.5% from January through
October 2011 to reach 378.5 TWh.
There were several factors that would have triggered a rise in electricity demand such as
continued favorable conditions in the economy and the abnormal cold wave in the first
quarter of 2011. Notwithstanding, there was a relatively stable increase in consumption.
- In the same period, electricity consumption for industrial use continued high growth at
9.3%. In contrast, the rate of increase in consumption for residential and commercial
use substantially slowed down compared to 2010.
- This is partly because of government policies, such as the measure on placing
restrictions on heating temperatures in buildings (January 24-February 18, 2011). The
measures were implemented to respond to a rise in international oil prices as well as a
soar in electricity demand in the first half of the year.
- What is unusual is that consumption for residential and commercial use recorded minus
growth as a result of low temperatures in the third quarter, when there is usually
electricity demand for cooling purposes.
Notes: 1) Values in parentheses are the year-on-year growth rate (%); p refers to tentative figures.2) ‘For commercial use’ means for the service industry and for public use.
ChapterⅡ Economic and Energy Consumption Trends in Korea
75http://www.keei.re.kr
Trends in electricity consumption5
(Unit: TWh)
Category2010 2011p
1/4 2/4 3/4 4/4 Annual 1/4 2/4 3/4 October January~October
<TableⅡ-9> Trends in electricity consumption
Residential15.7 14.5 16.2 14.9 61.2 16.2 14.7 15.7 4.7 51.3 (5.3) (5.0) (11.3) (3.3) (6.2) (3.3) (1.2) (-2.8) (0.4) (0.5)
Commercial42.7 34.2 37.0 36.0 149.8 45.1 34.4 36.5 10.6 126.6 (8.2) (7.7) (9.9) (4.7) (7.7) (5.7) (0.8) (-1.3) (1.3) (1.9)
Industrial54.1 55.0 56.0 58.1 223.2 60.1 59.9 60.3 20.3 200.6 (17.8) (13.4) (10.0) (10.8) (12.9) (11.0) (8.9) (7.8) (10.4) (9.3)
Total112.5 103.6 109.1 109.0 434.2 121.4 109.0 112.5 35.6 378.5 (12.2) (10.3) (10.2) (7.7) (10.1) (7.9) (5.1) (3.2) (6.1) (5.5)
수요전망 내지13-4 문 2012.3.8 4:2 PM 페이지75 매일3 MAC2PDF_IN 600DPI 125LPI T
Electricity consumption for industrial use witnessed a year-on-year rise of 9.3% to reach
200.6 TWh, owing to continued favorable conditions in industrial production.
* Industrial activity (industrial production) from January through October 2011: Year-
on-year increase of 7.4%
- A relatively high increase in demand continued in industries that consume a great
amount of electricity, including machinery and equipment (19.1%), steel (12.2%), and
automobile (12.1%).
From January through October, the level of increase in consumption for residential and
commercial use substantially slowed down as a result of low temperatures in July and
August, despite a record-breaking cold wave in January (5.4℃ drop compared to
average year temperatures).
- From January through October, electricity consumption for commercial and residential
use went up a mere 1.9% and 0.5%, respectively.
Electricity demand by sector
From January through October 2011, the rate of increase in electricity demand for
industrial use somewhat slowed down compared to 2010, but still remained high. It was
between 9 and 10%.
- The sharp rise in electricity consumption for industrial use after 2009 is attributable to a
substantial rise in facility investments and production activities in the manufacturing
sector, especially industries that consume a great amount of electricity.
76 KOREA ENERGY ECONOMICS INSTITUTE
KEEI Korea Energy Demand Outlook
수요전망 내지13-4 문 2012.3.8 4:2 PM 페이지76 매일3 MAC2PDF_IN 600DPI 125LPI T

Source: Statistics Korea, Korean Statistical Information Service (http://kostat.go.kr/portal/korea)
- Electricity demand for industrial use substantially rose as a result of large-scale (Total capacity
of 19 million tons20)) expansion of steelmaking facilities that consume a great amount of
electricity, such as the construction of Hyundai Steel Blast Furnace #1 and #2, in 2010 alone.
- Electricity consumption for industrial use reached bottom in the first quarter of 2009.
The level of increase in consumption between then and the third quarter of 2011 is
lower than the rate of increase in manufacturing industry production and facility
investments in the same period.
·Between the first quarter of 2009 and the third quarter of 2011, the manufacturing
industry production index and plant & equipment investment index went up 44.0% and
44.9%, respectively, while electricity consumption for industrial use went up 31.3%.
·As such, the recent soar in electricity consumption is a result of influence from an
upswing in relevant industrial activities.
ChapterⅡ Economic and Energy Consumption Trends in Korea
77http://www.keei.re.kr
[FigureⅡ-19] Recent manufacturing business trends and electricity consumption for industrial use
20) This accounts for 8.8% of total steelmaking facility capacity (216,667 thousand tons) as of 2010.
수요전망 내지13-4 문 2012.3.8 4:2 PM 페이지77 매일3 MAC2PDF_IN 600DPI 125LPI T

- From January through October 2011, electricity demand in the manufacturing industry,
agriculture/forestry/fishing industry, and mining industry posted year-on-year growth
of 9.4%, 6.1%, and 16.8%, respectively.
·In the manufacturing industry, the rate of increase in electricity consumption by the
basic metal industry, which includes the steel industry, was the highest at 12.2%. The
cause was favorable conditions in the steel business and the operation of new facilities
by steel companies. The petrochemical industry also recorded a rate of increase of
11.3% and reflected an upswing in the industry.
·During the same period, consumption in the fabricated metal sector posted a year-on-
year rise of 10.3%, thanks to continued favorable conditions in production in the
automobile manufacturing industry and ICT industry.
·In the first half of 2011, the share of total manufacturing industry electricity
consumption that was taken up by three major electricity-consuming sectors -
fabricated metal, basic metal, and petrochemical industries - reached 78.9%.
78 KOREA ENERGY ECONOMICS INSTITUTE
KEEI Korea Energy Demand Outlook
[FigureⅡ-20] Rate of increase in industrial activity indexes and electricity consumption for industrial use(First quarter of 2009 - Third quarter of 2011)
수요전망 내지13-4 문 2012.3.8 4:2 PM 페이지78 매일3 MAC2PDF_IN 600DPI 125LPI T

From January through October 2011, electricity demand for commercial and residential
use rose 1.9% and 0.5%, respectively, year-on-year to reach 126.6TWh and 51.3TWh.
- In the first quarter of 2011, the consumption increase rate stood at 5.7% for commercial
use and 3.3% for residential use. It is presumed that there was an increase in the use of
electric equipment for heating. This was caused by the weather, which was colder than
that experienced in the same period of 2010 (average temperature drop of 1.2℃), when
abnormally low temperatures were recorded.
- In the second quarter, the consumption increase rate substantially slowed down to 0.8%
for commercial use and 1.2% for residential use, resulting from base effects. Electricity
consumption for commercial use and residential use soared as a result of abnormally
low temperatures in the second quarter of 2010.
- As a result of a contraction in demand for cooling purposes, owing to low temperatures
in the third quarter, consumption went down in the sector compared to the same period
of the previous year.
ChapterⅡ Economic and Energy Consumption Trends in Korea
79http://www.keei.re.kr
[FigureⅡ-21] Share of manufacturing industry’s electricity consumption taken up by different business types in the first half of 2011 (%)
수요전망 내지13-4 문 2012.3.8 4:2 PM 페이지79 매일3 MAC2PDF_IN 600DPI 125LPI T

Electricity supply and demand in 2011
From 2010 to 2011, peak demand in the summer indicated annual average growth of 5.3%,
whereas total capacity and power supply capacity only rose an annual average 4.7% and
4.9%, respectively. As such, the supplied reserve level21) substantially decreased.
In the summer of 2011, peak demand was 72.19 million kW (on August 31). The power
supply capacity stood at 77.64 million kW and the supplied reserve level stood at 5.44
million kW (supplied reserve margin of 7.5%).
- In the summer, peak demand indicated a mere 3.3% rise from the previous year,
attributable to low temperatures in August, whereas power supply capacity went up
4.4% from the previous year.
- A rolling blackout took place on September 15 as a result of abnormally high temperatures
in early September. Electricity demand reached 67.26 million kW, but power supply
capacity remained at 67.52 million kW. Reserve power dropped to 240 thousand kW.
80 KOREA ENERGY ECONOMICS INSTITUTE
KEEI Korea Energy Demand Outlook
21) Supplied reserve level = Power supply capacity-Peak demandSupplied reserve margin = 100×(Power supply capacity-Peak demand)/Peak demand
[FigureⅡ-22] Electricity consumption increase rate
수요전망 내지13-4 문 2012.3.8 4:2 PM 페이지80 매일3 MAC2PDF_IN 600DPI 125LPI T
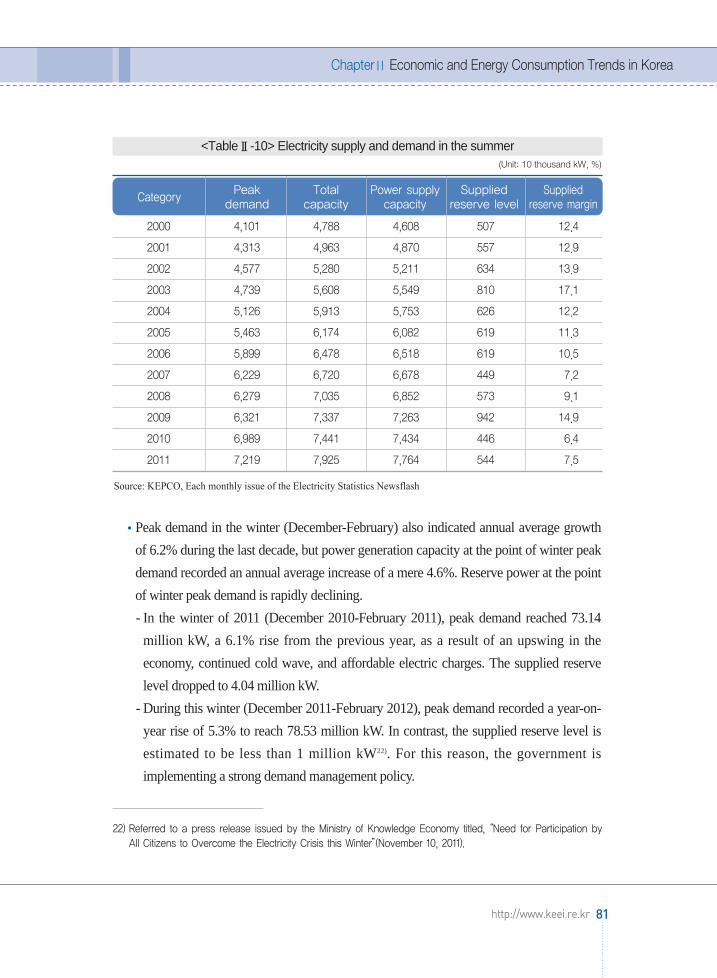
Source: KEPCO, Each monthly issue of the Electricity Statistics Newsflash
Peak demand in the winter (December-February) also indicated annual average growth
of 6.2% during the last decade, but power generation capacity at the point of winter peak
demand recorded an annual average increase of a mere 4.6%. Reserve power at the point
of winter peak demand is rapidly declining.
- In the winter of 2011 (December 2010-February 2011), peak demand reached 73.14
million kW, a 6.1% rise from the previous year, as a result of an upswing in the
economy, continued cold wave, and affordable electric charges. The supplied reserve
level dropped to 4.04 million kW.
- During this winter (December 2011-February 2012), peak demand recorded a year-on-
year rise of 5.3% to reach 78.53 million kW. In contrast, the supplied reserve level is
estimated to be less than 1 million kW22). For this reason, the government is
implementing a strong demand management policy.
ChapterⅡ Economic and Energy Consumption Trends in Korea
81http://www.keei.re.kr
(Unit: 10 thousand kW, %)
Category Peakdemand
Totalcapacity
Power supplycapacity
Suppliedreserve level
Suppliedreserve margin
2000 4,101 4,788 4,608 507 12.4
2001 4,313 4,963 4,870 557 12.9
2002 4,577 5,280 5,211 634 13.9
2003 4,739 5,608 5,549 810 17.1
2004 5,126 5,913 5,753 626 12.2
2005 5,463 6,174 6,082 619 11.3
2006 5,899 6,478 6,518 619 10.5
2007 6,229 6,720 6,678 449 7.2
2008 6,279 7,035 6,852 573 9.1
2009 6,321 7,337 7,263 942 14.9
2010 6,989 7,441 7,434 446 6.4
2011 7,219 7,925 7,764 544 7.5
<TableⅡ-10> Electricity supply and demand in the summer
22) Referred to a press release issued by the Ministry of Knowledge Economy titled, “Need for Participation byAll Citizens to Overcome the Electricity Crisis this Winter”(November 10, 2011).
수요전망 내지13-4 문 2012.3.8 4:2 PM 페이지81 매일3 MAC2PDF_IN 600DPI 125LPI T

A. Trends in LNG consumption
From January through October 2011, LNG consumption saw a year-on-year rise of 10.2%
to reach 28,281 thousand tons, triggered by continued growth in LNG consumption for
power generation.
LNG consumption for gas production marked year-on-year growth of 9.3% to reach
14,666 thousand tons, resulting from a steady rise in town gas demand.
LNG consumption for power generation recorded a year-on-year increase of 12.3%,
owing to a rapid increase in electricity demand and limited expansion of base-load
power generation facilities.
- In the third quarter, the level of increase in LNG consumption for power generation
somewhat slowed down to 4.2% in tandem with a relatively steady rise (3.2%) in
electricity demand.
Notes: 1. Values in parentheses are the year-on-year growth rate (%); p refers to tentative figures.2. LNG for power generation includes LNG consumed for district heating.3. LNG total refers to the total amount of primary energy, including internal consumption and gas production losses.
82 KOREA ENERGY ECONOMICS INSTITUTE
KEEI Korea Energy Demand Outlook
Trends in LNG and town gas consumption6
(Unit: 1,000 tons)
Category2010 2011p
1/4 2/4 3/4 4/4 Annual 1/4 2/4 3/4 October January~October
<TableⅡ-11> Trends in LNG consumption
Gas 6,655 3,289 2,352 5,274 17,571 7,071 3,436 2,841 1,318 14,666production (15.1) (22.2) (6.8) (6.4) (12.4) (6.2) (4.5) (20.8) (17.4) (9.3)
Power 4,002 3,261 3,187 4,199 14,648 4,835 3,698 3,321 1,090 12,944generation (61.2) (83.0) (40.9) (32.1) (50.9) (20.8) (13.4) (4.2) (0.9) (12.3)
LNG total 10,997 6,706 5,682 9,699 33,083 12,243 7,314 6,270 2,454 28,281(28.8) (45.0) (24.7) (16.0) (26.8) (11.3) (9.1) (10.3) (7.9) (10.2)
수요전망 내지13-4 문 2012.3.8 4:2 PM 페이지82 매일3 MAC2PDF_IN 600DPI 125LPI T

With regards to trends in the level of increase in LNG consumption by use, LNG
consumption for gas production, which has been continuing steady growth, soared starting
from the third quarter of 2011, thus leading a rise in overall LNG consumption.
Compared to electricity demand, which indicated a relatively low increase rate in the
third quarter, town gas demand for commercial and industrial use sharply rose. The level
of increase in consumption for gas production exceeded the level of increase in
consumption for power generation for the first time since 2010.
Notes: Data labels are the level of increase in LNG consumption for power generation.Source: Monthly Report on Energy Statistics
ChapterⅡ Economic and Energy Consumption Trends in Korea
83http://www.keei.re.kr
[FigureⅡ-23] Trends in LNG consumption increase rate per use
수요전망 내지13-4 문 2012.3.8 4:2 PM 페이지83 매일3 MAC2PDF_IN 600DPI 125LPI T

B. Trends in town gas consumption
From January through October 2011, town gas consumption recorded a year-on-year rise
of 7.9% to reach 16,905 million , resulting from a high rise in consumption for industrial
use, which has been continuing since the economic recovery in 2010.
Consumption for residential and commercial use indicated sound growth of 4.9% year-
on-year, despite base effects from the previous year, when consumption soared as a
result of the cold wave and abnormally low temperatures.
- In the third quarter, there was a substantial rise in consumption for commercial use,
from the previous year, during the peak season in the service industry (summer
vacation and the Chuseok holiday), leading to high growth in consumption of 14.5%.
- Consumption showed little change from the previous year in October, when
temperatures were average year temperatures and when the peak season in the service
industry came to an end.
Notes: Data labels are based on the seasonal adjustment index.Source: National statistics portal
84 KOREA ENERGY ECONOMICS INSTITUTE
KEEI Korea Energy Demand Outlook
[FigureⅡ-24] Monthly rate of increase in service industry production index
수요전망 내지13-4 문 2012.3.8 4:2 PM 페이지84 매일3 MAC2PDF_IN 600DPI 125LPI T

Town gas consumed for industrial use is used for fuel and for heating at manufacturing
processes in the industrial sector23). Town gas consumption for industrial use marked a
year-on-year increase of 12.4% to reach 6,257 million m 3, owing to continued favorable
conditions in industrial production.
- Recovery of the overall manufacturing industry somewhat slowed down in the third
quarter. However, an upswing in production activities in the heavy chemical industry
led to continued high growth in town gas consumption for industrial use.
Rate of increase in industrial production index of the heavy chemical industry in 2011
(Compared to the previous quarter): (Second quarter) 8.5% → (Third quarter) 5.9% →
(October) 7.9%
- In October, consumption for industrial use indicated high growth of 23.0% year-on-
year, attributable to favorable conditions in the heavy chemical industry and
manufacturing industry ICT.
Town gas consumption for transport indicated steady growth in tandem with CNG bus
expansion projects. From January through October, it recorded a year-on-year increase
of 6.0% to reach 922 million m3.
- Local governments have been continually propagating CNG buses since 2000 to
alleviate air pollution. The central government is providing financial support to
purchase buses as well as tax support.
ChapterⅡ Economic and Energy Consumption Trends in Korea
85http://www.keei.re.kr
23) Use of town gas for industrial purposes (http://www.samchully.co.kr/): ① Heating furnace (forging furnace,rolling furnace, soaking furnace, preheating furnace, welding and cutting) ② Melting furnace (reverberatoryfurnace, crucible furnace, holding furnace, water-soaking type melting furnace, bottom-heating type meltingfurnace, electric furnace for steelmaking) ③ Heat treatment furnace (quenching furnace, annealing furnace,carburizing furnace, homogenization furnace, aging furnace, annealing furnace, shielding gas generationfurnace) ④ Drying furnace (dry off oven, solvent drying furnace, adhesive drying furnace, shell moulddrying, baking oven, etc.)
수요전망 내지13-4 문 2012.3.8 4:2 PM 페이지85 매일3 MAC2PDF_IN 600DPI 125LPI T
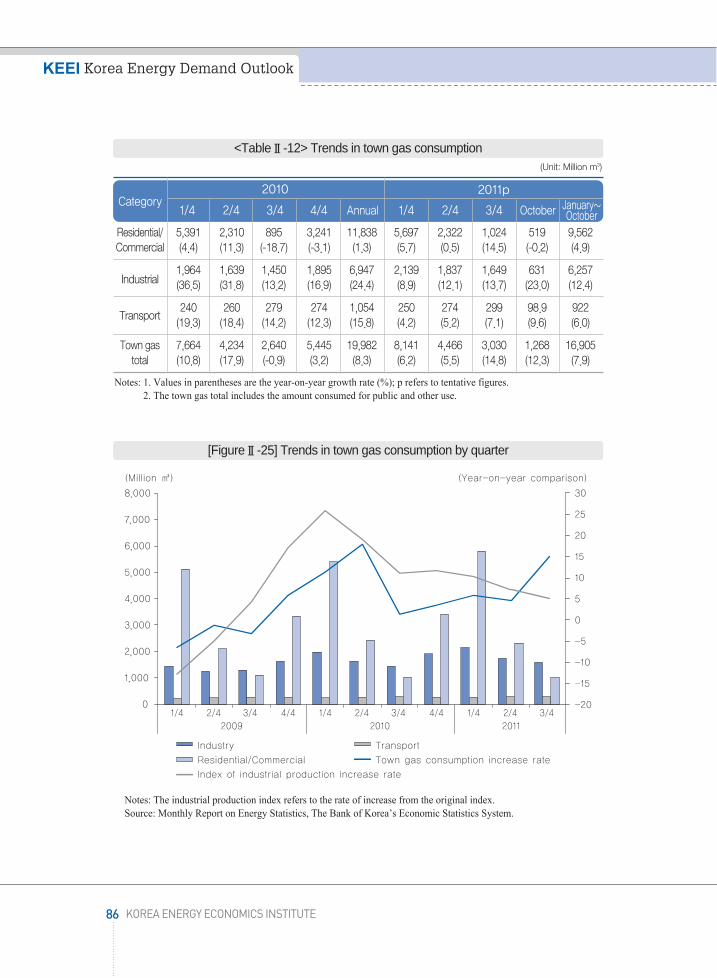
Notes: 1. Values in parentheses are the year-on-year growth rate (%); p refers to tentative figures.2. The town gas total includes the amount consumed for public and other use.
Notes: The industrial production index refers to the rate of increase from the original index.Source: Monthly Report on Energy Statistics, The Bank of Korea’s Economic Statistics System.
86 KOREA ENERGY ECONOMICS INSTITUTE
KEEI Korea Energy Demand Outlook
(Unit: Million m3)
Category2010 2011p
1/4 2/4 3/4 4/4 Annual 1/4 2/4 3/4 October January~October
<TableⅡ-12> Trends in town gas consumption
Residential/ 5,391 2,310 895 3,241 11,838 5,697 2,322 1,024 519 9,562Commercial (4.4) (11.3) (-18.7) (-3.1) (1.3) (5.7) (0.5) (14.5) (-0.2) (4.9)
Industrial1,964 1,639 1,450 1,895 6,947 2,139 1,837 1,649 631 6,257(36.5) (31.8) (13.2) (16.9) (24.4) (8.9) (12.1) (13.7) (23.0) (12.4)
Transport240 260 279 274 1,054 250 274 299 98.9 922(19.3) (18.4) (14.2) (12.3) (15.8) (4.2) (5.2) (7.1) (9.6) (6.0)
Town gas 7,664 4,234 2,640 5,445 19,982 8,141 4,466 3,030 1,268 16,905total (10.8) (17.9) (-0.9) (3.2) (8.3) (6.2) (5.5) (14.8) (12.3) (7.9)
[FigureⅡ-25] Trends in town gas consumption by quarter
수요전망 내지13-4 문 2012.3.8 4:2 PM 페이지86 매일3 MAC2PDF_IN 600DPI 125LPI T

A review of recent trends in town gas consumption indicates that the level of increase in
town gas consumption changes similarly with changes in the industrial production index in
tandem with a rise in the share accounted for by town gas consumption for industrial use.
Consumption for residential and commercial use, where the number of customers has
almost reached the state of saturation, is clearly seasonal as it is influenced by
temperatures. Relatively stable consumption patterns are indicated.
- According to the Korea City Gas Association, the propagation rate of town gas for
residential use in 2011 is estimated at 88.5% for the metropolitan area.
Unlike consumption for residential and commercial use, town gas consumption for
industrial use reacts sensitively to industrial production activities, which are based on
business fluctuations.
- Preference towards clean fuel is growing in the industrial sector. As such, there is an
expansion in the shift from oil and other energy sources to town gas. For this reason,
consumption for industrial use is more quickly rising.
Source: Korea City Gas Association
ChapterⅡ Economic and Energy Consumption Trends in Korea
87http://www.keei.re.kr
[FigureⅡ-26] Trends in the number of customers of town gas for industrial use
수요전망 내지13-4 문 2012.3.8 4:2 PM 페이지87 매일3 MAC2PDF_IN 600DPI 125LPI T

A. Trends in coal consumption
Coal demand for industrial use went up 4.5% from January through October as a result of
rapid growth in the industrial sector (13.2%) in the third quarter of 2011. Consumption for
power generation also went up 3.6%. Overall, coal consumption posted a year-on-year
rise of 3.8% to reach 102,524 thousand tons.
Notes: Values in parentheses are the year-on-year growth rate (%); p refers to tentative figures.
88 KOREA ENERGY ECONOMICS INSTITUTE
KEEI Korea Energy Demand Outlook
Trends in coal and other energy consumption7
(Unit: 1,000 tons)
Category2010 2011p
1/4 2/4 3/4 4/4 Annual 1/4 2/4 3/4 October January~October
<TableⅡ-13> Trends in coal consumption
Anthracite2,540 2,463 2,264 2,836 10,103 2,806 2,289 2,708 1,037 8,838(-1.3) (31.7) (-12.6) (3.4) (3.3) (10.5) (-7.1) (19.6) (16.5) (8.4)
Residential/ 563 236 218 842 1,859 550 172 225 314 1,261commercial (-8.9) (14.6) (-4.8) (-5.2) (-4.2) (-2.3) (-27.1) (3.2) (4.7) (-4.3)
Industrial1,758 2,045 1,834 1,768 7,406 2,117 1,988 2,035 683 7,113(8.5) (51.7) (-8.7) (18.0) (14.4) (20.4) (-2.8) (11.0) (36.3) (15.9)
Power 219 182 212 226 839 139 129 156 40 464generation (-34.4) (-42.4) (-39.9) (-36.7) (-38.3) (-36.5) (-29.1) (-26.4) (-55.1) (-33.9)
Bituminous 28,122 25,434 28,014 27,647 109,218 27,615 26,483 29,504 10,084 93,686coal (25.7) (9.6) (5.3) (4.6) (10.8) (-1.8) (4.1) (5.3) (11.6) (3.4)
steel 7,354 6,176 5,809 6,163 25,502 6,240 6,491 6,378 2,275 21,384manufacturing (61.6) (29.1) (4.4) (5.6) (23.0) (-15.1) (5.1) (9.8) (13.0) (0.1)
cement933 1,317 1,077 1,237 4,564 1,052 1,423 1,228 474 4,177(12.7) (-2.7) (-2.9) (5.5) (2.3) (12.8) (8.0) (14.0) (21.2) (12.3)
other 665 592 559 661 2,478 689 605 570 193 2,057industries (9.0) (12.4) (1.3) (5.8) (7.1) (3.6) (2.2) (1.9) (-4.6) (1.9)
power 19,170 17,349 20,569 19,586 76,674 19,634 17,964 21,328 7,142 66,068generation (17.0) (4.9) (6.2) (8.4) (7.9) (2.4) (3.5) (3.7) (11.1) (4.0)
Coal 30,662 27,898 30,278 30,484 119,321 30,421 28,772 32,211 11,120 102,524total (22.9) (11.2) (3.8) (4.5) (10.1) (-0.8) (3.1) (6.4) (12.1) (3.8)
수요전망 내지13-4 문 2012.3.8 4:2 PM 페이지88 매일3 MAC2PDF_IN 600DPI 125LPI T

From January through October, bituminous coal consumption for power generation and
for industrial use went up 4.0% and 2.0%, respectively. Overall bituminous coal
consumption posted a 3.4% rise year-on-year to reach 93,686 thousand tons.
Consumption of bituminous coal for steel production, which takes up the highest
percentage (62%) of coal consumption for industrial use, recorded 21,384 thousand tons,
which is similar to the consumed amount recorded in the same period of the previous
year, owing to base effects.
- Bituminous coal consumption for steel making recorded high growth in the first half of
2010, thus leading an overall rise in coal consumption. However, the level of increase
has been slowing down substantially since the third quarter of 2010.24)
Notes: Values in parentheses are the year-on-year growth rate (%); p refers to tentative figures.Source: Korea Iron & Steel Association (steeldata DB), Monthly Report on Energy Statistics
Consumption of bituminous coal in the cement industry continued a downward trend
starting from the first quarter of 2010. However, it indicated a rapid increase from
January through October 2011, posting a year-on-year rise of 12.3% to reach 4,177
thousand tons.
ChapterⅡ Economic and Energy Consumption Trends in Korea
89http://www.keei.re.kr
Category2010p 2011p
1/4 2/4 3/4 4/4 Annual 1/4 2/4 3/4
(Unit: 1,000 tons, %)
Pig iron 8,266 8,788 8,411 9,600 35,065 10,240 10,540 10,675 production (42.9) (35.9) (15.2) (24.2) (28.5) (23.9) (19.9) (26.9)
Consumptionof bituminous 7,354 6,176 5,810 6,084 25,424 6,240 6,491 6,378coal for steel (61.6) (29.1) (4.4) (4.3) (22.6) (-15.1) (5.1) (9.8)production
<TableⅡ-14> Pig iron production and bituminous coal consumption for steel making
24) Such recent trends in bituminous coal consumption for steel making have a huge gap with the industry'senergy intensity - the ratio of bituminous coal consumption for steel making to pig iron production - whichmaintained a certain ratio. As such, there is a possibility of an error in compiling statistics.
수요전망 내지13-4 문 2012.3.8 4:2 PM 페이지89 매일3 MAC2PDF_IN 600DPI 125LPI T

- Bituminous coal consumption in the cement industry rapidly rose from January
through October 2011 because the import price of bituminous coal is continually going
up, and cement manufacturers are importing more bituminous coal before import prices
go up further25).
From January through October 2011, bituminous coal consumption for power generation
posted a year-on-year rise of 4.0% to reach 66,068 thousand tons.
- No new bituminous coal-based power generation facilities were built after the
construction of Yeongheung Thermal Power Plant Unit 4 and Hadong Thermal Power
Plant Unit 8 in 2009. However, existing facilities were continually used at the
maximum level.
From January through October, anthracite consumption marked a year-on-year increase
of 8.4% to reach 8,838 thousand tons.
- Anthracite consumption for residential/commercial use and for power generation
posted a year-on-year drop of 4.3% and 33.9%, respectively.
- Consumption for industrial use, which accounts for the highest percentage of overall
consumption, indicated rapid growth and recorded a year-on-year increase of 15.9%.
- Anthracite consumption for residential/commercial use has continuously been on a
downward trend after the second quarter of 2010, when it posted a rapid increase
because of abnormally low temperatures.
- Anthracite consumption for industrial use, which is used as fuel for co-generation, is on
an upward trend.
90 KOREA ENERGY ECONOMICS INSTITUTE
KEEI Korea Energy Demand Outlook
25) Coal statistics are based on domestic import statistics. As such, changes in statistics may be somewhatdifferent from business conditions in the short term according to the industry’s inventory and productionactivity.
수요전망 내지13-4 문 2012.3.8 4:2 PM 페이지90 매일3 MAC2PDF_IN 600DPI 125LPI T

B. Trends in consumption of thermal energy, new & renewable energy, and other energy
From January through October 2011, thermal energy consumption indicated year-on-year
growth of 3.1% to reach 1,280 thousand TOE.
The amount of consumption is steadily rising despite a slight slowdown in the
dissemination of district heating, a result of the sluggish construction business. This is
due to charges that are more affordable than other sources of energy and continued
economic recovery.
- Heating prices were raised 6.9% in September, but remain affordable compared to
other energy sources. The increase in prices is assessed as having little impact on
reducing consumption.
It is estimated that consumption of new & renewable energy and other energy recorded a
year-on-year rise of 4.1% to reach 4,561 thousand TOE from January through October
2011.
Notes: Values in parentheses are the year-on-year growth rate (%); p refers to tentative figures.
ChapterⅡ Economic and Energy Consumption Trends in Korea
91http://www.keei.re.kr
(Unit: 1,000 TOE)
Category2010 2011p
1/4 2/4 3/4 4/4 Annual 1/4 2/4 3/4 October January~October
<TableⅡ-15> Trends in consumption of thermal energy, new & renewable energy, and other energy
Thermal 805 254 93 566 1,718 835 243 110 91 1,280energy (12.4) (25.2) (4.0) (4.4) (10.8) (3.8) (-4.3) (18.5) (1.0) (3.1)
New &renewable 1,309 1,303 1,316 1,418 5,346 1,368 1,368 1,307 518 4,561energy/Other (13.4) (9.7) (16.1) (2.0) (9.9) (4.5) (5.0) (-0.7) (14.6) (4.1)energy
수요전망 내지13-4 문 2012.3.8 4:2 PM 페이지91 매일3 MAC2PDF_IN 600DPI 125LPI T

수요전망 내지13-4 문 2012.3.8 4:2 PM 페이지92 매일3 MAC2PDF_IN 600DPI 125LPI T
ChapterⅢ
Energy Demand Outlook for 2012
1. Outlook on the international energy market
2. Domestic economic outlook and outlook assumptions
3. Outlook on primary energy demand
4. Outlook on final energy demand
5. Outlook on petroleum product demand
6. Outlook on electricity demand
7. Outlook on LNG and town gas demand
8. Outlook on coal and other energy demand
9. Characteristics and implications
수요전망 내지13-4 문 2012.3.8 4:2 PM 페이지93 매일3 MAC2PDF_IN 600DPI 125LPI T

수요전망 내지13-4 문 2012.3.8 4:2 PM 페이지94 매일3 MAC2PDF_IN 600DPI 125LPI T

A. Outlook on global oil supply and demand
In the November 2011 issue of the “Oil Market Report”, IEA forecasted that global oil
demand will be roughly 89.2 million b/d, a year-on-year rise of around 900 thousand b/d,
in 2011 and that it will be approximately 90.5 million b/d, a year-on-year increase of 1.3
million b/d, in 2012.
Forecasted global oil demand was decreased 70 thousand b/d (Year 2011) and 20
thousand b/d (Year 2012) from the previous month’s forecasts owing to increased
uncertainty over the global economy and continued high oil prices.
Non-OPEC supply and OPEC NGL supply are forecast to be around 52.8 million b/d and
5.9 million b/d (a year-on-year rise of 100 thousand b/d and 600 thousand b/d),
respectively, in 2011 and around 53.8 million b/d and 6.3 million b/d, respectively, in 2012.
Demand for OPEC oil is forecast to be around 30.5 million to 30.6 million b/d.
Notes: Asia* refers to Asian developing countries excluding China; e refers to forecasts.Source: IEA, Oil Market Report, November issue.
ChapterⅢ Energy Demand Outlook for 2012
95http://www.keei.re.kr
Outlook on the international energy market1
(Unit: Million b/d)
Category2011
20102012e
1/4 2/4 3/4 4/4 Annual average 1/4 2/4 3/4 4/4 Annual
average
OECD 46.2 46.3 44.5 45.9 46.4 45.8 46.1 44.4 45.6 46.0 45.5
North America 23.8 23.8 23.3 23.5 23.5 23.5 23.5 23.1 23.5 23.5 23.4Europe 14.6 14.2 14.1 14.7 14.6 14.4 14.0 13.9 14.6 14.5 14.3
Asia Pacific 7.8 8.3 7.1 7.7 8.3 7.9 8.6 7.4 7.5 8.1 7.9
Non OECD 42.1 42.6 43.4 43.7 43.8 43.4 44.1 45.0 45.3 45.3 44.9China 9.1 9.5 9.5 9.3 9.8 9.5 9.9 10.1 9.9 10.2 10.0Asia* 10.4 10.7 10.8 10.5 10.9 10.7 11.0 11.1 10.8 11.2 11.0
World 88.3 88.9 87.9 89.6 90.2 89.2 90.2 89.4 90.9 91.4 90.5
<TableⅢ-1> IEA’s global oil consumptions and forecasts
수요전망 내지13-4 문 2012.3.8 4:2 PM 페이지95 매일3 MAC2PDF_IN 600DPI 125LPI T
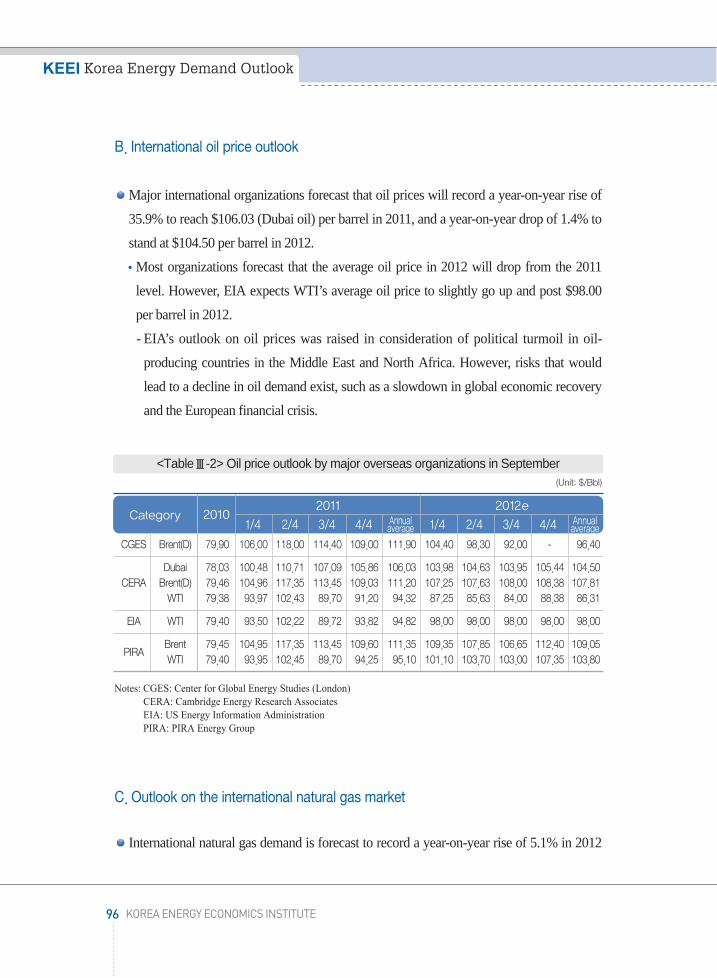
B. International oil price outlook
Major international organizations forecast that oil prices will record a year-on-year rise of
35.9% to reach $106.03 (Dubai oil) per barrel in 2011, and a year-on-year drop of 1.4% to
stand at $104.50 per barrel in 2012.
Most organizations forecast that the average oil price in 2012 will drop from the 2011
level. However, EIA expects WTI’s average oil price to slightly go up and post $98.00
per barrel in 2012.
- EIA’s outlook on oil prices was raised in consideration of political turmoil in oil-
producing countries in the Middle East and North Africa. However, risks that would
lead to a decline in oil demand exist, such as a slowdown in global economic recovery
and the European financial crisis.
Notes: CGES: Center for Global Energy Studies (London)CERA: Cambridge Energy Research AssociatesEIA: US Energy Information AdministrationPIRA: PIRA Energy Group
C. Outlook on the international natural gas market
International natural gas demand is forecast to record a year-on-year rise of 5.1% in 2012
96 KOREA ENERGY ECONOMICS INSTITUTE
KEEI Korea Energy Demand Outlook
(Unit: $/Bbl)
Category2011
20102012e
1/4 2/4 3/4 4/4 Annual average 1/4 2/4 3/4 4/4 Annual
averageCGES Brent(D) 79.90 106.00 118.00 114.40 109.00 111.90 104.40 98.30 92.00 - 96.40
Dubai 78.03 100.48 110.71 107.09 105.86 106.03 103.98 104.63 103.95 105.44 104.50CERA Brent(D) 79.46 104.96 117.35 113.45 109.03 111.20 107.25 107.63 108.00 108.38 107.81
WTI 79.38 93.97 102.43 89.70 91.20 94.32 87.25 85.63 84.00 88.38 86.31
EIA WTI 79.40 93.50 102.22 89.72 93.82 94.82 98.00 98.00 98.00 98.00 98.00
PIRABrent 79.45 104.95 117.35 113.45 109.60 111.35 109.35 107.85 106.65 112.40 109.05WTI 79.40 93.95 102.45 89.70 94.25 95.10 101.10 103.70 103.00 107.35 103.80
<TableⅢ-2> Oil price outlook by major overseas organizations in September
수요전망 내지13-4 문 2012.3.8 4:2 PM 페이지96 매일3 MAC2PDF_IN 600DPI 125LPI T

to reach 3,555.2 billion m 3 as a result of efforts made by countries all across the globe to
cut down CO2 emissions and a rise in LNG demand in Asia.
A rise in natural gas consumption is expected in tandem with efforts made by
governments throughout Europe to cut down CO2 emissions and the movement to
replace nuclear power generation with natural gas. However, the possibility of an
increase in prices triggered by reduced supply and the economic downturn in the euro
zone will likely limit a rise in consumption.
Japan made known its intention to make spot purchase of LNG. The country is expected
to substantially increase natural gas consumption in 2012 to replace the damaged nuclear
power plants. China and Korea are also expected to witness a considerable rise in natural
gas consumption.
Notes: 1) Values in parentheses indicate the year-on-year growth rate (%); e refers to forecasts.2) Australasia: A region of Oceania comprising Australia, New Zealand, the island of New Guinea, and
neighboring islands in the Pacific Ocean.Source: EIU, World commodity forecasts: Industrial raw materials, January 2012
ChapterⅢ Energy Demand Outlook for 2012
97http://www.keei.re.kr
(Unit: Billion m3)
Category 2011e 2012e
North America855.3 888.7(3.3) (3.9)
East Europe / 674.2 698.0Commonwealth of Independent States (3.6) (3.5)
West Europe573.5 581.0(-2.5) (1.3)
Asia/Australasia639.1 712.2(11.8) (11.4)
Middle East386.2 410.1(5.5) (6.2)
Latin America140.5 146.8(4.0) (4.5)
Africa113.4 118.4(4.3) (4.4)
Worldwide3,382.2 3,555.2(4.1) (5.1)
<TableⅢ-3> International natural gas consumption and outlook
수요전망 내지13-4 문 2012.3.8 4:2 PM 페이지97 매일3 MAC2PDF_IN 600DPI 125LPI T

In 2012, international natural gas production is forecast to stand at 3,530 billion m3, a
year-on-year rise of 4.6%, attributable to increased production of natural gas in North
America, the Middle East, and Africa.
Most of the natural gas produced in the Middle East will be from South Pars in Qatar
and North Dome in Iran. Russia plans to increase production by developing Yamal,
which holds Russia’s biggest natural gas reserves.
The US plans to increase natural gas production and reduce imports while substantially
increasing exports to Korea, Japan, India, Brazil, and other countries.
Russia’s Sakhalin, Indonesia’s Tangguh, and Yemen are emerging as new natural gas
exporting areas. Australia is also expanding facilities to increase exports.
Notes: 1) Values in parentheses indicate the year-on-year growth rate (%); e refers to forecasts.2) Australasia: A region of Oceania comprising Australia, New Zealand, the island of New Guinea, and
neighboring islands in the Pacific Ocean.Source: EIU, World commodity forecasts: Industrial raw materials, January 2012.
98 KOREA ENERGY ECONOMICS INSTITUTE
KEEI Korea Energy Demand Outlook
(Unit: Billion m3)
Category 2011e 2012e
North America871.1 910.3(5.4) (4.5)
East Europe / 844.8 882.8Commonwealth of Independent States (4.1) (4.5)
West Europe291.5 293.4(-4.5) (0.7)
Asia/Australasia489.5 515.5(4.7) (5.3)
Middle East504.2 530.4(9.5) (5.2)
Africa219.0 230.4(3.2) (5.2)
Latin America156.2 167.3(5.0) (7.1)
Worldwide3,376.2 3,530.0(4.5) (4.6)
<TableⅢ-4> International natural gas production and outlook
수요전망 내지13-4 문 2012.3.8 4:2 PM 페이지98 매일3 MAC2PDF_IN 600DPI 125LPI T

In 2012, the LNG price in Japan is forecast to record US$ 16.7/mBtu in the first quarter
and then slightly go down. However, the annual average price will likely go up to US$
15.98/mBtu, a year-on-year increase of 8.8%, owing to demand that is increasing at a
faster pace than production.
The natural gas price (Henry hub) in the US, which is relatively less influenced by
international circumstances, is forecast to continually rise in 2012 and reach US$
4.63/mBtu, an annual increase of 11.0%.
The natural gas price in Europe in 2012 is forecast to reach US$ 10.64/mBtu, a 2.2% rise
from the previous year. It will be placed under pressure to go up by strong natural gas
demand in Asia.
Notes: 1) Values in parentheses indicate the year-on-year growth rate (%); e refers to forecasts.2) The natural gas price in the US is based on the Henry hub. The price in Europe (excluding the UK) is the
import border price. The price in Japan is the LNG import price.Source: EIU, World commodity forecasts: Industrial raw materials, January 2012
ChapterⅢ Energy Demand Outlook for 2012
99http://www.keei.re.kr
(Unit: US $/mBtu)
Category2012e2011
Annual 1/4 2/4 3/4 4/4 Annual
US4.17 4.30 4.45 4.65 5.10 4.63(-5.0) (2.9) (1.8) (12.9) (27.5) (11.0)
Europe10.41 10.70 10.45 10.65 10.75 10.64(25.6) (13.2) (1.4) (-2.1) (-2.3) (2.2)
Japan14.68 16.70 16.00 15.50 15.70 15.98(35.3) (39.3) (16.7) (-5.3) (-5.7) (8.8)
<TableⅢ-5> Outlook on international natural gas prices
수요전망 내지13-4 문 2012.3.8 4:2 PM 페이지99 매일3 MAC2PDF_IN 600DPI 125LPI T

Notes: The natural gas price in the US is based on the Henry hub. The price in Europe (excluding the UK) is theimport border price. The price in Japan is the LNG import price.
Source: EIU, World commodity forecasts: Industrial raw materials, January 2012
D. Outlook on the international coal market
Coal demand in China and India, which recently led a rise in global coal demand, is
expected to continually go up in 2012.
Coal demand in China and India is expected to record continued high growth of around
6% and 8%, respectively, attributable to economic growth and the resulting power
generation demand.
Coal demand is forecast to remain at the current level in the US and European countries
as a result of strengthened environmental regulations. Demand for coal-based power
generation in Germany and Japan is forecast to slightly go up, influenced by Japan’s
nuclear energy crisis.
Australia is planning the adoption of the carbon tax in July 2012, but its effect on coal
demand is forecast to be limited.
100 KOREA ENERGY ECONOMICS INSTITUTE
KEEI Korea Energy Demand Outlook
[FigureⅢ-1] Outlook on international natural gas prices
수요전망 내지13-4 문 2012.3.8 4:2 PM 페이지100 매일3 MAC2PDF_IN 600DPI 125LPI T

Notes: Values in parentheses refer to the rate of increase from the previous year; e refers to forecasts.Source: EIU, World commodity forecasts: Industrial raw materials, January 2012.
Coal demand is expected to somewhat slow down in 2012. Accordingly, the rate of
increase in coal production will likely slow down by a small margin.
Coal production will likely indicate year-on-year growth of between 4% and 5%.
China and Indonesia will lead increased production in 2012 and are expected to account
for more than 53% of global coal production.
ChapterⅢ Energy Demand Outlook for 2012
101http://www.keei.re.kr
(Unit: Million ton)
Category 2010 2011e 2012e
China3,387 3,658 3,896(7.5) (8.0) (6.5)
US951 937 904(4.7) (-1.5) (-3.5)
EU718 754 746(-0.1) (5.0) (-1.1)
India689 748 810(10.8) (8.6) (8.3)
Russia206 209 213(2.0) (1.5) (1.9)
Japan188 186 193(13.9) (-1.1) (3.8)
Global total7,289 7,681 7,995(6.0) (5.4) (4.1)
<TableⅢ-6> Outlook on global coal consumption
수요전망 내지13-4 문 2012.3.8 4:2 PM 페이지101 매일3 MAC2PDF_IN 600DPI 125LPI T

Notes: Values in parentheses refer to the year-on-year growth rate; e refers to forecasts.Source: EIU, World commodity forecasts: Industrial raw materials, January 2012
International coal prices are expected to slightly decline in 2012 as a result of the global
economic downturn. However, they will likely remain high.
Notes: 1) Values in parentheses refer to year-on-year growth.2) Coal prices are those of Australian thermal coal.
Source: EIU, World commodity forecasts: Industrial raw materials, January 2012.
102 KOREA ENERGY ECONOMICS INSTITUTE
KEEI Korea Energy Demand Outlook
(Unit: Million ton)
Category 2010 2011e 2012e
China3,321 3,687 3,945(8.9) (11.0) (7.0)
US985 980 950(1.2) (-0.5) (-3.1)
India569 557 574(2.5) (-2.1) (3.1)
Australia407 415 432(2.0) (2.0) (4.1)
Russia311 322 335(4.7) (3.5) (4.0)
Indonesia359 398 426(18.9) (10.9) (7.0)
Global total7,401 7,861 8,207(6.2) (6.2) (4.4)
<TableⅢ-7> Outlook on global coal production
(Unit: US $/ton)
Category 1/4 2/4 3/4 4/4 Annual
201095.19 99.49 93.55 107.63 98.97(32.3) (49.7) (31.2) (38.6) (37.8)
2011128.99 120.00 120.61 115.00 121.15(35.5) (20.6) (28.9) (6.8) (22.4)
2012110 107 105 105 106.75
(-14.7) (-10.8) (-12.9) (-8.7) (-11.9)
<TableⅢ-8> Trends in international coal prices and outlook
수요전망 내지13-4 문 2012.3.8 4:2 PM 페이지102 매일3 MAC2PDF_IN 600DPI 125LPI T

A. Outlook on the domestic economy26)
Economic growth rate
The Korean economy is expected to record annual growth of 3.7% in 2012, influenced
by the global economic downturn and uncertainty.
- In the first half of the year, the economy will likely post a growth rate that is less than
1% from the previous term, attributable to economic stagnancy and uncertainty in
advanced countries.
- When detailed solutions for the European financial crisis are devised, the Korean
economy will likely record its potential growth rate in the second half of the year.
Private consumption
Private consumption in 2012 is expected to rise 3.1% as a result of improvements in real
purchasing power resulting from such factors as stable oil prices.
- Real purchasing power is expected to improve as a result of a slowdown in the upward
trend in prices, against the backdrop of continued employment recovery.
- Trade conditions will likely be similar to conditions witnessed in 2011 owing to a
slowdown in the upward trend in raw material prices, resulting in a reduced gap between
the rate of increase in the net income (Gross National Income) and growth rate.
Investments
Construction investments are forecast to be less sluggish, especially for building
construction. The rate of increase in facility investments is forecast to go down as a result
of lack of investors’ confidence triggered by external uncertainty.
ChapterⅢ Energy Demand Outlook for 2012
103http://www.keei.re.kr
Domestic economic outlook and outlook assumptions2
26) The information is based on the 「Economic Outlook for 2012」(December 2011) issued by the Ministry ofStrategy and Finance.
수요전망 내지13-4 문 2012.3.8 4:2 PM 페이지103 매일3 MAC2PDF_IN 600DPI 125LPI T

Facility investments are forecast to record annual growth of 3.3%, attributable to
worsened investment conditions, including a slowdown in the level of increase in
exports and a downward trend in corporate profitability.
- There will likely be a lack of investors’ confidence among companies. For example,
the forecasted Business Survey Index (BSI) on facility investments in the
manufacturing industry is less than the base value (100).
- The level of increase in leading indicators will likely slow down, including orders for
machinery, machinery imports, and facility investment adjustment pressure.
Construction investments are expected to turn around from the downward trend of the
previous year to post an annual increase of 2.9% in 2012.
- Housing construction is forecast to recover from its recent slump as a result of
improvements in the housing market, including a decrease in unsold houses, a rise in
the number of apartments sold, and a rise in the expected number of housing units
available for move-in.
- In terms of construction of buildings for non-residential use, relatively favorable
investment conditions are expected as a result of a drop in vacancies and relocation of
public institutions. However, a slowdown in economic recovery will likely function as
a constraint.
- In the area of civil engineering and construction, sluggishness will likely continue as a
result of a reduction in the SOC budget, triggered by the completion of large national
projects, such as the Four Major Rivers Restoration Project.
104 KOREA ENERGY ECONOMICS INSTITUTE
KEEI Korea Energy Demand Outlook
수요전망 내지13-4 문 2012.3.8 4:2 PM 페이지104 매일3 MAC2PDF_IN 600DPI 125LPI T

Notes: p refers to preliminary figures; e refers to forecasts.Source: Ministry of Strategy and Finance, Economic Outlook for 2012, December 12, 2011
Exports, imports, and current account
In 2012, exports (based on customs clearance) are expected to record an annual increase
of 7.4% owing to an economic slowdown in advanced countries and a slowdown in the
level of increase in the global trade volume.
- Overall export conditions are expected to deteriorate as a result of the global financial
crisis and economic slowdown in advanced countries.
- A low increase rate is expected in the first half of the year, but a two-digit increase rate
is likely to be recorded in the second half of the year and onwards once there is less
external uncertainty.
In 2012, imports are forecast to post an annual 8.4% increase owing to reduced
investment demand and a drop in the unit price of imports.
- Imports of raw materials and subsidiary materials for exports account for 40% of total
imports. For this reason, import demand slows down when exports slow down.
ChapterⅢ Energy Demand Outlook for 2012
105http://www.keei.re.kr
(Year-on-year comparison, %, 100 million dollars)
Category 2010 2012e2011
1/4p 2/4p 3/4p Annual (e)
GDP 6.2 4.2 3.4 3.5 3.8 3.7
Private consumption 4.1 2.8 3.0 2.0 2.5 3.1
Facility investment 25.0 11.7 7.5 1.0 4.3 3.3
Construction investment -1.4 -11.9 -6.8 -4.6 -5.4 2.9
Current account 294 26 55 69 250 160
Goods account balance 401 58 77 72 305 250
- Exports (customs clearance) 28.3 29.6 18.7 21.4 19.2 7.4
- Imports (customs clearance) 31.6 26.1 27.2 27.7 23.2 8.4
Service balance, primary income-107 -32 -22 -3 -55 -90balance, secondary income balance
Consumer price 3.0 3.8 4.0 4.3 4.0 3.2
<TableⅢ-9> Economic outlook for 2011 and 2012
수요전망 내지13-4 문 2012.3.8 4:2 PM 페이지105 매일3 MAC2PDF_IN 600DPI 125LPI T
- The unit price of imports, which considerably rose in 2011, is expected to slightly decline
in tandem with a slowdown in the level of increase in international raw material prices.
The current account surplus is expected to be a mere 16 billion dollars annually, attributable
to a reduction in the goods account surplus and a rise in the service account deficit.
Consumer price
The rate of increase in consumer prices is forecast to remain somewhat high in the first
half of the year. The rate of increase will likely steadily decrease in the second half of the
year and onwards as a result of base effects.
- Consumer price pressure on the supply side will likely decrease as a result of stable
supply of agricultural products and a slowdown in the level of increase in international
raw material prices. Pressure on the demand side is expected to steadily decrease as a
result of the economic slowdown.
Comparison among economic forecasts made by major organizations
According to economic outlook data released by the government and major
organizations in consideration of recent changes in domestic and overseas economic
conditions, Korea’s economic growth rate is expected to stand at 3.8% in 2011 and in the
mid- to high 3% range in 2012.
- Government-run organizations, such as the Ministry of Strategy and Finance, the Bank
of Korea, and KDI forecast that the economic growth rate in 2012 will be 3.7 to 3.8%.
Private organizations, such as the LG Economic Research Institute, expect the
economic growth rate to be in the mid 3% range.
The rate of increase in consumer prices is expected to slow down from approximately
4% in 2011 to the low 3% range in 2012.
The current account surplus in 2012 is expected to go down from the previous year to
record around 15 billion dollars.
106 KOREA ENERGY ECONOMICS INSTITUTE
KEEI Korea Energy Demand Outlook
수요전망 내지13-4 문 2012.3.8 4:2 PM 페이지106 매일3 MAC2PDF_IN 600DPI 125LPI T
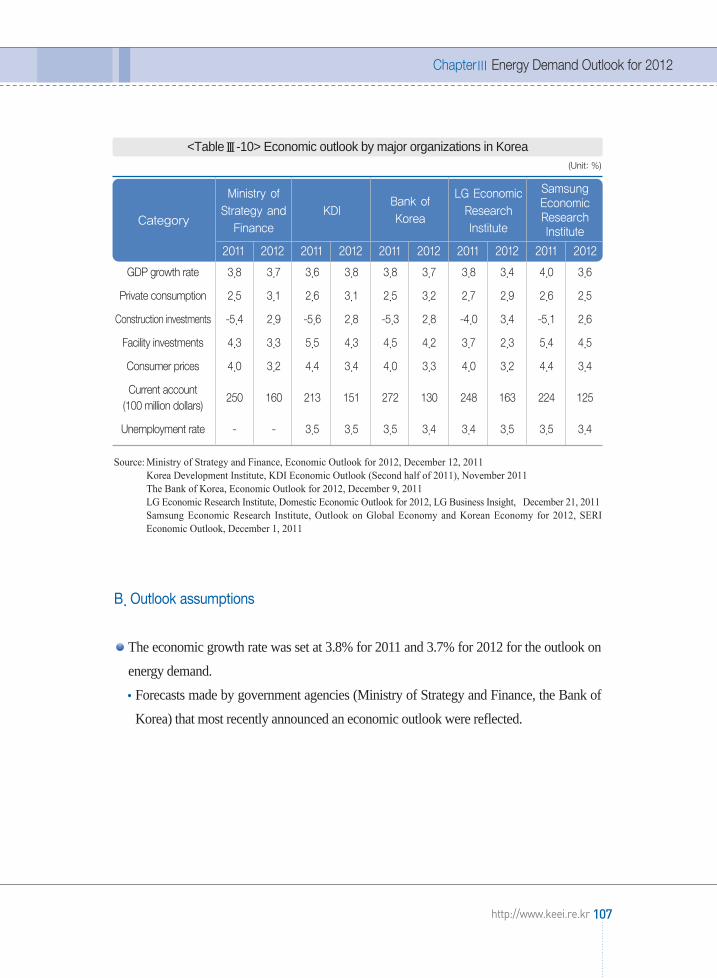
Source: Ministry of Strategy and Finance, Economic Outlook for 2012, December 12, 2011Korea Development Institute, KDI Economic Outlook (Second half of 2011), November 2011The Bank of Korea, Economic Outlook for 2012, December 9, 2011LG Economic Research Institute, Domestic Economic Outlook for 2012, LG Business Insight, December 21, 2011Samsung Economic Research Institute, Outlook on Global Economy and Korean Economy for 2012, SERIEconomic Outlook, December 1, 2011
B. Outlook assumptions
The economic growth rate was set at 3.8% for 2011 and 3.7% for 2012 for the outlook on
energy demand.
Forecasts made by government agencies (Ministry of Strategy and Finance, the Bank of
Korea) that most recently announced an economic outlook were reflected.
ChapterⅢ Energy Demand Outlook for 2012
107http://www.keei.re.kr
(Unit: %)
Category
SamsungEconomicResearchInstitute
Ministry ofStrategy and
FinanceKDI
Bank ofKorea
LG EconomicResearchInstitute
2011 2012 2011 2012 2011 2012 2011 2012 2011 2012
GDP growth rate 3.8 3.7 3.6 3.8 3.8 3.7 3.8 3.4 4.0 3.6
Private consumption 2.5 3.1 2.6 3.1 2.5 3.2 2.7 2.9 2.6 2.5
Construction investments -5.4 2.9 -5.6 2.8 -5.3 2.8 -4.0 3.4 -5.1 2.6
Facility investments 4.3 3.3 5.5 4.3 4.5 4.2 3.7 2.3 5.4 4.5
Consumer prices 4.0 3.2 4.4 3.4 4.0 3.3 4.0 3.2 4.4 3.4
Current account 250 160 213 151 272 130 248 163 224 125
(100 million dollars)
Unemployment rate - - 3.5 3.5 3.5 3.4 3.4 3.5 3.5 3.4
<TableⅢ-10> Economic outlook by major organizations in Korea
수요전망 내지13-4 문 2012.3.8 4:2 PM 페이지107 매일3 MAC2PDF_IN 600DPI 125LPI T
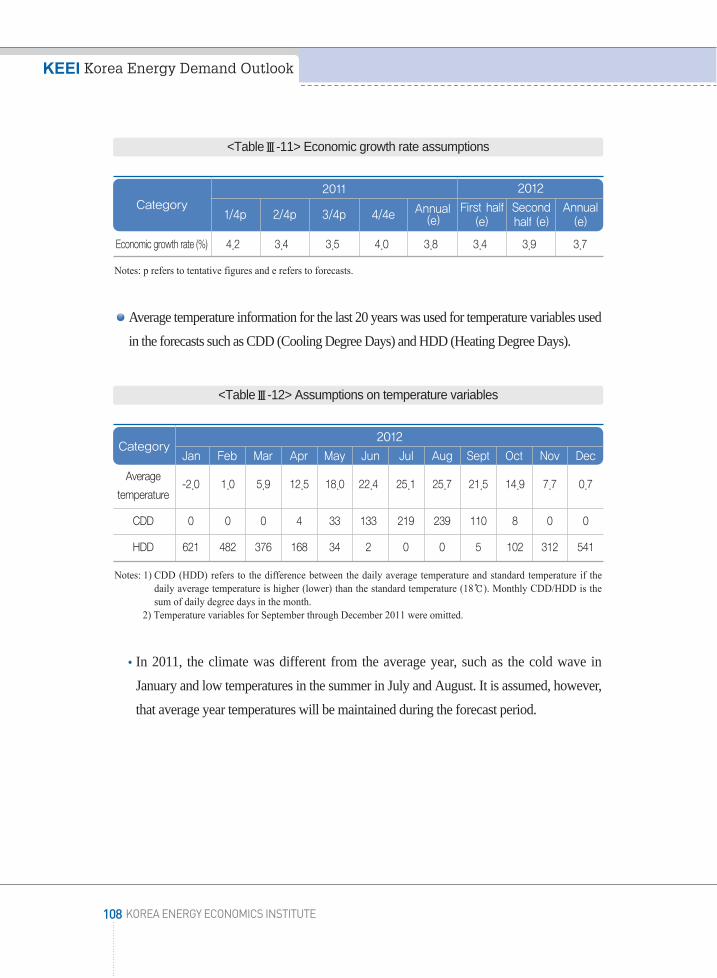
Notes: p refers to tentative figures and e refers to forecasts.
Average temperature information for the last 20 years was used for temperature variables used
in the forecasts such as CDD (Cooling Degree Days) and HDD (Heating Degree Days).
Notes: 1) CDD (HDD) refers to the difference between the daily average temperature and standard temperature if thedaily average temperature is higher (lower) than the standard temperature (18℃). Monthly CDD/HDD is thesum of daily degree days in the month.
2) Temperature variables for September through December 2011 were omitted.
In 2011, the climate was different from the average year, such as the cold wave in
January and low temperatures in the summer in July and August. It is assumed, however,
that average year temperatures will be maintained during the forecast period.
108 KOREA ENERGY ECONOMICS INSTITUTE
KEEI Korea Energy Demand Outlook
Category20122011
1/4p 2/4p 3/4p 4/4e Annual(e)
First half(e)
Secondhalf (e)
Annual (e)
Economic growth rate (%) 4.2 3.4 3.5 4.0 3.8 3.4 3.9 3.7
<TableⅢ-11> Economic growth rate assumptions
Category2012
Jan Feb Mar Apr May Jun Jul Aug Sept Oct Nov Dec
Average-2.0 1.0 5.9 12.5 18.0 22.4 25.1 25.7 21.5 14.9 7.7 0.7
temperature
CDD 0 0 0 4 33 133 219 239 110 8 0 0
HDD 621 482 376 168 34 2 0 0 5 102 312 541
<TableⅢ-12> Assumptions on temperature variables
수요전망 내지13-4 문 2012.3.8 4:2 PM 페이지108 매일3 MAC2PDF_IN 600DPI 125LPI T

ChapterⅢ Energy Demand Outlook for 2012
109http://www.keei.re.kr
[FigureⅢ-2] CDD and HDD and assumptions for outlook
수요전망 내지13-4 문 2012.3.8 4:2 PM 페이지109 매일3 MAC2PDF_IN 600DPI 125LPI T

Primary energy demand is expected to rise 3.3% in 2011 and 3.0% in 2012.
Primary energy demand from 2011 to 2012 is expected to become stabilized due to a
slowdown in the nation’s economic growth.
* Economic growth rate assumption: (Year 2010) 6.2% → (Year 2011) 3.8% → (Year 2012) 3.7%
Notes: Values in parentheses refer to the year-on-year growth rate (%); p refers to tentative figures; e refers to forecasts.
110 KOREA ENERGY ECONOMICS INSTITUTE
KEEI Korea Energy Demand Outlook
Outlook on primary energy demand3
Category2011 2012
1/4p 2/4p 3/4p 4/4e Annual (e) First half of the year (e)
Second halfof the year (e) Annual (e)
30.4 28.8 32.2 31.5 122.9 60.8 64.6 125.4(-0.8) (3.1) (6.4) (3.3) (3.0) (2.7) (1.4) (2.0)
24.2 22.3 25.8 25.0 97.3 47.4 51.0 98.4(3.7) (2.6) (5.6) (2.7) (3.7) (2.1) (0.4) (1.2)
205.0 181.5 199.3 211.8 797.7 392.9 410.5 803.5(3.1) (-6.2) (4.0) (0.7) (0.4) (1.7) (-0.2) (0.7)
116.3 97.7 108.7 122.2 444.8 214.9 225.8 440.7(-1.2) (-12.3) (-0.1) (-2.1) (-3.8) (0.4) (-2.2) (-0.9)
12.2 7.3 6.3 10.6 36.4 20.2 18.0 38.2(11.3) (9.1) (10.3) (9.4) (10.1) (3.4) (6.7) (5.0)
1.6 1.9 3.4 1.4 8.2 3.6 4.6 8.2(27.2) (21.4) (44.5) (3.2) (27.0) (4.8) (-2.9) (0.3)
37.5 38.6 38.2 40.1 154.4 82.2 86.4 168.6(4.0) (5.8) (1.7) (4.1) (3.9) (8.0) (10.3) (9.2)
1.5 1.5 1.5 1.7 6.2 3.3 3.4 6.7(2.9) (0.8) (-3.9) (11.0) (2.7) (7.1) (6.7) (6.9)
72.2 61.9 65.1 72.3 271.4 138.3 141.3 279.6(3.8) (0.5) (5.3) (3.7) (3.3) (3.2) (2.9) (3.0)
56.4 46.6 49.0 56.2 208.3 106.2 108.2 214.4
(4.6) (-0.3) (4.0) (3.3) (2.9) (3.1) (2.8) (2.9)
<TableⅢ-13> Outlook on primary energy demand
Coal(Million ton)
-Excludingcoking coal
Oil(Million bbl)
-Excludingnaphtha
LNG(Million ton)
Hydro(TWh)
Nuclear power(TWh)
Other(Million TOE)
Primary energy(Million TOE)
Primary energy-Excludingfor raw materials
수요전망 내지13-4 문 2012.3.8 4:2 PM 페이지110 매일3 MAC2PDF_IN 600DPI 125LPI T

Major energy sources for power generation, including nuclear energy and LNG, are
forecast to indicate a relatively high increase in demand, attributable to continually
strong electricity demand and the operation of new nuclear power plants (Singori
Nuclear Power Plant Unit 2, Sinwolseong Nuclear Power Plant Unit 1).
* Rate of increase in amount of nuclear power generation: (Year 2010) 0.6% → (Year
2011) 3.9% → (Year 2012) 9.2%
* Rate of increase in LNG demand: (Year 2010) 26.8% → (Year 2011) 10.1% → (Year
2012) 5.0%
Energy demand for raw material use (naphtha, coking coal) is expected to go up 4.6% in
2011 owing to an upswing in industrial production activities. Its level of increase will
likely drop to 3.4% in 2012, reflecting a downturn in the petrochemical industry.
- Energy for raw material use is forecast to account for 23.3% of primary energy demand in 2012.
Forecasts on key energy indicators
The energy intensity (TOE/million won) is expected to improve from 0.252 in 2010 to
0.251 in 2011 and 0.249 in 2012.
- The energy intensity deteriorated temporarily in 2009 and 201027), but is expected to
turn around and improve starting from 2011.
ChapterⅢ Energy Demand Outlook for 2012
111http://www.keei.re.kr
[FigureⅢ-3] Forecasts on the economic growth rate and primary energy demand increase rate
수요전망 내지13-4 문 2012.3.8 4:2 PM 페이지111 매일3 MAC2PDF_IN 600DPI 125LPI T

Per-capita energy consumption is forecast to rise from 5.37 TOE in 2010 to 5.54 TOE in
2011 and 5.70 TOE in 2012.
Notes: e refers to forecasts.
112 KOREA ENERGY ECONOMICS INSTITUTE
KEEI Korea Energy Demand Outlook
Category 2005 2006 2007 2008 2009 2010 2011e 2012e
Economic growth rate (%) 4.0 5.2 5.1 2.3 0.3 6.2 3.8 3.7
Primary energy consumption3.8 2.1 1.3 1.8 1.1 7.9 3.3 3.0 increase rate (%)
Energy intensity (TOE/Million won) 0.264 0.256 0.247 0.246 0.248 0.252 0.251 0.249
Per capita consumption (TOE) 4.75 4.83 4.88 4.95 4.99 5.37 5.54 5.70
<TableⅢ-14> Key indices related to energy consumption
27) The deterioration of energy intensity in 2009 is a result of the rate of increase in primary energy consumption(1.1%) exceeding the economic growth rate (0.3%), owing to a rise in the energy conversion loss triggered bya sharp rise in electricity consumption and the operation of new facilities in industries that consume largeamounts of energy. The worsened intensity in 2010 mainly resulted from a soar in energy consumption forindustrial use, owing to a favorable turn in the economy and base effects, as well as a rise in energyconsumption for cooling and heating purposes resulting from abnormal weather in the winter and summer.
[FigureⅢ-4] Forecasts on energy intensity and per capita consumption
수요전망 내지13-4 문 2012.3.8 4:2 PM 페이지112 매일3 MAC2PDF_IN 600DPI 125LPI T
Forecasts on primary energy demand by energy source
Coal demand is expected to increase 3.0% in 2011 and 2.0% in 2012.
- In 2011, coal demand is expected to show gradual growth of approximately 3.0%,
attributable to a slowdown in coal consumption for power generation (no new
facilities) and base effects from a high increase in coking coal consumption (22.6%) in
the previous year.
- In 2012, coal consumption for power generation is expected to show little change since
no new facilities were built. Coking coal consumption is expected to turn around and
indicate an upward trend in 2012.
Oil demand is expected to indicate extremely gradual growth of 0.4% in 2011 and 0.7%
in 2012.
- In 2011, oil demand is expected to indicate little change despite a rapid rise (6.4%) in
naphtha consumption for raw material use. This is owing to a considerable drop in
demand for use as industrial fuel as a result of continued high oil prices and demand for
heating in the residential and commercial sector.
- A 0.7% rise from 2011 is expected for 2012 to reach 803.5 million barrels, owing to
recovery of demand for transport and a slowdown in the downward trend in fuel for
industrial use.
- Demand for naphtha, which accounts for 42% of total oil consumption (as of 2010), is
expected to post an increase rate of 2.7% in 2012 as it is forecast that the upswing in
the petrochemical industry and petroleum refining will slow down.
LNG demand is forecast to record growth of 10.1% in 2011 and 5.0% in 2012.
- LNG demand for power generation, which accounted for 46% of overall consumption
in 2010, is expected to rise 12.5% in 2011 and 5.1% in 2012, thus leading an overall
increase in LNG demand.
- Demand for LNG for power generation is expected to indicate sound growth as it is
forecast that there will be a rapid increase in electricity demand, notwithstanding the 3
million kW (three nuclear power plants) capacity expansion from the establishment of
base-load power generation facilities from 2011 to 2012.
- LNG demand for power generation and demand for town gas production both go up in
ChapterⅢ Energy Demand Outlook for 2012
113http://www.keei.re.kr
수요전망 내지13-4 문 2012.3.8 4:2 PM 페이지113 매일3 MAC2PDF_IN 600DPI 125LPI T

case of an abnormal cold wave in the winter. For this reason, there is a need to
thoroughly examine LNG supply and demand conditions in the winter.
The amount of nuclear power generation is forecast to go up 3.9% in 2011 and 9.2% in
2012 with the operation of new facilities.
- Following the operation of Singori Unit 1 in (February) 2011, commercial operation of
Singori Unit 2 and Sinwolseong Unit 1 is planned for early 2012.
- At the end of 2012, there will likely be a substantial rise in the amount of nuclear
power generation in tandem with facility expansion of around 2 million kW (10.7%)
from the previous year.
Forecasts on percentage of total consumption taken up by each energy source
The percentage of total consumption taken up by oil decreased to less than 50% in 2002,
and continued to go down. It is forecast to stand at 38.5% in 2011 and 37.7% in 2012.
The percentage of total consumption occupied by coal continually increased from 23.0%
in 2001 to 28.9% in 2010, gaining strength from a steady rise in coking coal
consumption for industrial use and consumption for power generation.
- The percentage of total consumption occupied by coal will likely indicate a downward
trend in 2011 and 2012 for the first time in the 2000s, owing to no additional
construction of coal-based power generation facilities and a slowdown in the level of
increase in demand for industrial use.
The share occupied by LNG has been continually rising in tandem with a steady rise in
demand for power generation, resulting from limited expansion of base-load power
generation facilities.
- The share occupied by LNG is expected to rise from 16.4% in 2010 to 17.8% in 2012
because not enough base-load power generation facilities will be built to address the
increase in electricity demand in 2011 and 2012.
The share of primary energy occupied by nuclear power went up to 16.1% in 2005, and then
continued a downward trend as no new facility expansions took place through 2010. The
share occupied by nuclear power is expected to rise to 13.0% in 2012, as a result of the
construction of Singori Units 1 and 2 (2 million kW) and Sinwolseong Unit 1 (1 million kW).
114 KOREA ENERGY ECONOMICS INSTITUTE
KEEI Korea Energy Demand Outlook
수요전망 내지13-4 문 2012.3.8 4:2 PM 페이지114 매일3 MAC2PDF_IN 600DPI 125LPI T

ChapterⅢ Energy Demand Outlook for 2012
115http://www.keei.re.kr
[FigureⅢ-5] Share of primary energy demand taken up by each energy source
수요전망 내지13-4 문 2012.3.8 4:2 PM 페이지115 매일3 MAC2PDF_IN 600DPI 125LPI T

Final energy demand is forecast to record a year-on-year increase of 3.1% in 2011 and
2.9% in 2012.
Energy consumption soared in all demand sectors in 2010. However, the level of
consumption increase is expected to slow down from 2011 to 2012 due to base effects, a
slowdown in economic growth, and continued high oil prices.
- In 2011, consumption in the industrial sector is expected to record relatively high
growth of 4.6%, but consumption in the residential/commercial/public sector and
transport sector is forecast to go up only by a small extent.
- In 2012, the level of increase in demand in the industrial sector is expected to go down
compared to the previous year as a result of a slowdown in the level of increase in
demand for naphtha and electricity. The level of increase in demand in the
residential/commercial/public sector is also forecast to be more gradual.
Energy demand in the industrial sector is expected to indicate sound growth, mainly for
major energy sources, including electricity, energy for raw material use, and town gas.
This is despite base effects from a substantial rise in consumption (7.9%) in 2010.
Energy demand in the transport sector slowed down in 2011 due to the slowdown in the
economy and continued high oil prices. It is forecast to record a low increase rate of less
than 1% in 2012.
Energy demand in the residential/commercial/public sector is forecast to indicate steady
growth of 1.6% in 2011 and 1.2% in 2012, attributable to a slowdown in the level of
increase in income levels in case abnormal climate conditions do not arise.
116 KOREA ENERGY ECONOMICS INSTITUTE
KEEI Korea Energy Demand Outlook
Outlook on final energy demand4
수요전망 내지13-4 문 2012.3.8 4:2 PM 페이지116 매일3 MAC2PDF_IN 600DPI 125LPI T

Notes: Values in parentheses are the year-on-year growth rate (%); p refers to tentative figures; e refers to forecasts.
ChapterⅢ Energy Demand Outlook for 2012
117http://www.keei.re.kr
Category2011 2012
1/4p 2/4p 3/4p 4/4e Annual (e) First half of the year (e)
Second halfof the year (e) Annual (e)
29.7 29.0 30.1 31.6 120.5 61.8 63.7 125.4(2.4) (1.8) (8.4) (6.0) (4.6) (5.1) (3.2) (4.1)
14.0 13.7 14.0 15.6 57.3 29.6 30.5 60.2(3.9) (0.4) (7.2) (6.8) (4.6) (6.8) (3.2) (4.9)
8.8 8.7 9.8 9.7 37.0 17.8 19.6 37.3(2.8) (-5.8) (2.6) (1.7) (0.3) (1.2) (0.4) (0.8)
15.3 8.4 7.2 11.5 42.4 24.0 19.0 42.9
(5.3) (-2.7) (2.0) (0.1) (1.6) (1.1) (1.3) (1.2)
53.8 46.2 47.0 52.9 199.9 103.5 102.2 205.7(3.3) (-0.6) (6.1) (3.8) (3.1) (3.5) (2.3) (2.9)
38.1 30.9 31.0 36.9 136.8 71.4 69.1 140.4
(4.2) (-2.3) (4.5) (3.3) (2.5) (4.7) (5.7) (2.7)
8.1 4.5 3.0 5.9 21.5 13.4 9.3 22.6(6.2) (5.5) (14.8) (8.2) (7.7) (5.9) (3.9) (5.1)
194.7 178.1 195.7 206.0 774.4 380.2 401.1 781.3(3.1) (-5.1) (4.8) (0.8) (0.9) (2.0) (-0.1) (0.9)
106.0 94.2 105.0 116.3 421.5 202.2 216.5 418.7(-1.5) (-10.8) (1.3) (-0.2) (-3.2) (1.0) (8.7) (-0.7)
121.4 109.0 112.5 113.7 456.6 237.9 239.3 477.3(7.9) (5.1) (3.2) (4.4) (5.2) (3.3) (5.8) (4.5)
10.6 10.7 10.7 11.7 43.7 22.7 23.3 46.0(-5.5) (3.0) (13.0) (9.6) (4.6) (6.4) (4.1) (5.2)
4.4 4.2 4.3 5.2 18.1 9.4 9.7 19.1(12.5) (-0.1) (17.9) (14.5) (11.0) (8.9) (2.3) (5.5)
2,203 1,612 1,417 2,163 7,395 3,991 3,768 7,758
(4.2) (3.6) (0.6) (9.0) (4.7) (4.6) (5.2) (4.9)
<TableⅢ-15> Outlook on final energy demand
Industry(Million TOE)
-Excluding forraw materials
Transport(Million TOE)
Residential/commercial/public
(Million TOE)
TotalMillion TOE
Total-Excluding forraw materials
Town gas(Billion m3)
Oil(Million bbl)
-Excludingnaphtha
Electricity(TWh)
Coal(Million ton)
--Excludingcoking coal
Thermal andother
(Thousand TOE)
수요전망 내지13-4 문 2012.3.8 4:2 PM 페이지117 매일3 MAC2PDF_IN 600DPI 125LPI T

Final energy consumption structure by sector
The share of energy consumption taken up by the industrial sector remained at around
55% up until 2005, but continued to rise afterwards and will likely reach 61% in 2012.
- The increase in the share taken up by the industrial sector is a result of steady growth of
industries that consume large amounts of energy such as the steel and petrochemical
industries, as well as sharp growth in the fabricated metal industry, which consumes a
great amount of electricity.
The share of consumption occupied by the transport sector stood at 21.0% in 2006 but
continued to decrease afterwards. It is expected to go down to 18.1% in 2012.
- The drop in the share of consumption occupied by the transport sector is the result of a
substantial slowdown in the rate of increase in petroleum product consumption for
transport, against the backdrop of high international oil prices, which began to soar in 2003.
The share of consumption occupied by the residential/commercial/public sector, where
energy is mostly consumed for heating and cooling purposes, tends to go up and down
according to temperature fluctuations in the summer and winter.
- The percentage of consumption accounted for by the sector indicated a steady
downward trend in tandem with strong energy consumption by the industrial sector
since 2005. This trend is forecast to continue during the forecast period.
118 KOREA ENERGY ECONOMICS INSTITUTE
KEEI Korea Energy Demand Outlook
[FigureⅢ-6] Share of final energy demand occupied by each sector
수요전망 내지13-4 문 2012.3.8 4:2 PM 페이지118 매일3 MAC2PDF_IN 600DPI 125LPI T

With regards to final energy demand by energy source, the level of increase recorded by
major energy sources in 2012 will likely maintain the 2011 level or slightly slow down.
Town gas for industrial use is forecast to lead an overall rise in demand. The demand
increase rate is forecast to stand at 7.7% in 2011 and 5.1% in 2012.
- Demand for industrial use will likely indicate high growth of 11.9% in 2011. The level
of increase is expected to somewhat slow down to between 9 and 10% in 2012.
- Demand for residential/commercial use is forecast to record a comparatively high
increase rate of 5.2% in 2011 owing to the cold weather in the first quarter. The level of
increase will likely slow down to 2.0% if average year temperatures are recorded in 2012.
Oil demand is forecast to indicate an increase rate of less than 1% in both 2011 and
2012.
- Oil demand for transport is expected to go up 0.1% in 2011 and 0.4% in 2012 despite
continued high oil prices. This is attributable to a steady rise in automobile sales, a rise
in fuel demand for road freight since the second half of 2011, and an increase in
international transport.
- Oil demand in the industrial sector is forecast to go up 2.2% in 2011 and 2.0% in 2012.
Demand for industrial raw material use is expected to lead a rise in overall demand as it
is forecast that there will be an increase in production activities in the petrochemical
sector and petroleum refining in 2012 as well.
- By product, demand for naphtha and gasoline is expected to indicate relatively rapid
growth. Kerosene and diesel for heating, heavy oil, and LPG are forecast to continue
the downward trend that they recorded in 2011 in 2012 as well.
Electricity will likely indicate relatively high growth of 5.2% in 2011 and 4.5% in 2012
resulting from several factors: a rise in industrial production activities, low charge, and
increased dissemination of equipment that use electricity.
- In 2011, electricity demand for residential/commercial use is forecast to go up a mere
1.5% as a result of base effects from the rapid increase recorded in the previous year
and electricity-saving policies. In contrast, demand for industrial use is expected to go
up 8.7% and lead an overall rise in electricity demand in 2011.
- In 2012, the level of increase in demand for industrial use is expected to slow down. In
ChapterⅢ Energy Demand Outlook for 2012
119http://www.keei.re.kr
수요전망 내지13-4 문 2012.3.8 4:2 PM 페이지119 매일3 MAC2PDF_IN 600DPI 125LPI T

contrast, demand for residential/commercial use will likely record an increase rate of
3.0%, owing to base effects from sluggish consumption witnessed in the summer of 2011.
Coal consumption in the final sector is forecast to record a year-on-year rise of 4.6% in
2011 owing to a rise in anthracite consumption for industrial use (18.6%). This is despite
reduced demand for cement production and a slowdown in bituminous coal demand for
steel making as a result of base effects.
- Coal consumption is forecast to record a sound increase rate that is in the low 5% range
in 2012 as it is expected that the high growth in anthracite demand for industrial use
will continue and coking coal demand will bounce back and slightly go up.
Final energy consumption structure by energy source
Oil’s share of final energy consumption has been continually dropping and will likely go
down to 49.7% in 2012.
In contrast, all other energy sources are indicating an upward trend in terms of their share
of consumption as a result of the decreased share taken up by oil. In particular,
electricity’s share of consumption is rising extremely quickly. Electricity’s share of
consumption is expected to reach 20% in 2012.
- A rise in electricity consumption expands energy conversion loss, thus triggering a
rapid increase in primary energy supply. Unlike other final energy sources, a rise in
electricity consumption incurs additional energy expenses at the national level.
- There is a need to identify various policy measures for efficient consumption of
electricity in order to curtail social costs that arise from an unnecessary rise in
electricity demand and to stabilize national energy supply and demand.
The share of consumption occupied by town gas is steadily rising in the 2000s as well,
owing to a continued expansion in the number of customers and the development of new
areas of use such as for transport and cooling.
120 KOREA ENERGY ECONOMICS INSTITUTE
KEEI Korea Energy Demand Outlook
수요전망 내지13-4 문 2012.3.8 4:2 PM 페이지120 매일3 MAC2PDF_IN 600DPI 125LPI T

Forecasts on level of contribution made by each final energy source to primary energy demand
Results of analyzing the level of contribution made by demand for each final energy
source to the increase in primary energy demand indicate that the level of contribution
made by electricity and energy for raw material use (naphtha, coking coal) is absolute.
Electricity, which triggers energy input for power generation in the transformation sector,
is forecast to contribute to around half of the amount of primary energy increase in 2012.
- Electrification of energy consumption is the result of convenience in electricity use,
increased diversity and propagation of electric equipment, and continuously low
electricity charge.
The level of contribution made by energy demand for industrial raw material use is
expected to slightly go down from the 2011 level to stand at 25.9% in 2012.
The level of contribution made by town gas to an increase in primary energy demand is
expected to be 14.7% in 2012. Final petroleum products for fuel, excluding naphtha, are
expected to reduce primary energy demand by 3.8% as decreased consumption is
expected in 2012.
The level of contribution made by new and renewable energy is forecast to be
approximately 4% in 2012, and is expected to continue to slightly go up starting in 2010.
ChapterⅢ Energy Demand Outlook for 2012
121http://www.keei.re.kr
[FigureⅢ-7] Share of final energy demand taken up by each energy source
수요전망 내지13-4 문 2012.3.8 4:2 PM 페이지121 매일3 MAC2PDF_IN 600DPI 125LPI T

In 2011, oil demand is expected to see a year-on-year increase of a mere 0.4%, attributable
to a decline in demand for heating in the residential/commercial sector and in demand for
use as fuel in the industrial sector owing to fuel replacement, triggered by continued high
oil prices as well as a slowdown in economic activity. In 2012, oil demand is forecast to
increase 0.7% to reach 803.5 million barrels, owing to a slowdown in the level of drop in
demand for use as fuel in the industrial sector and in the transformation sector.
Oil demand for transport is expected to rise 0.1% in 2011 and 0.4% in 2012, owing to a
steady rise in automobile sales despite continued high oil prices, a rise in fuel demand for
road freight since the second half of 2011, and a rise in international transport.
122 KOREA ENERGY ECONOMICS INSTITUTE
KEEI Korea Energy Demand Outlook
Outlook on petroleum product demand5
[FigureⅢ-8] Forecasts on level of contribution of each energy source to increase in primary energy
수요전망 내지13-4 문 2012.3.8 4:2 PM 페이지122 매일3 MAC2PDF_IN 600DPI 125LPI T

Notes: Values in parentheses refer to the year-on-year growth rate (%); p refers to tentative figures; e refers to forecasts.
Oil demand for feedstock in the industrial sector will likely continue to lead an increase
in overall oil demand as it is forecast that conditions in the petrochemical industry and
petroleum refining will continue to improve through 2012.
- The downward trend in oil demand for fuel is forecast to slow down in 2012 as a result
of base effects from the sharp drop recorded in 2011. Oil demand in the industrial
sector is forecast to record a year-on-year increase of 2.0% in 2012.
By product, naphtha and gasoline are expected to lead a rise in oil demand. Demand for
heavy oil and kerosene/diesel used for heating and for use as fuel in the industrial sector
is expected to continually drop. For this reason, overall oil demand is expected to go up a
mere 0.7%.
20121/4p 2/4p 3/4p 4/4e Annual (e) First half of
the year (e)Second half ofthe year (e) Annual (e)
2011Category
ChapterⅢ Energy Demand Outlook for 2012
123http://www.keei.re.kr
(Unit: Million bbl)
Transport62.9 62.2 69.7 69.4 264.2 126.2 139.0 265.2(2.6) (-6.2) (2.3) (1.7) (0.1) (0.8) (-0.1) (0.4)
Industry111.3 105.7 116.2 118.9 452.2 224.5 236.5 461.0(3.1) (-3.4) (6.7) (2.4) (2.2) (3.5) (0.6) (2.0)
- fuel17.1 15.3 18.9 21.1 72.4 33.4 36.2 69.7(-16.3) (-20.9) (-0.3) (-7.1) (-11.1) (3.3) (-9.5) (-3.8)
- feedstock94.2 90.4 97.3 97.8 379.8 191.1 200.3 391.4(7.7) (0.3) (8.1) (4.7) (5.2) (3.5) (2.6) (3.0)
Residential/com 20.4 10.1 9.8 17.6 58.0 29.5 25.6 55.1mercial/public (4.9) (-15.3) (2.2) (-11.2) (-4.8) (-3.7) (-6.6) (-5.1)
Transformation10.3 3.4 3.6 5.9 23.2 12.8 9.4 22.2(2.6) (-39.8) (-28.6) (-3.0) (-13.6) (-7.1) (-1.0) (-4.6)
Total oil205.0 181.5 199.3 211.8 797.7 392.9 410.5 803.5(3.1) (-6.2) (4.0) (0.7) (0.4) (1.7) (-0.2) (0.7)
<TableⅢ-16> Outlook on petroleum product demand by sector
수요전망 내지13-4 문 2012.3.8 4:2 PM 페이지123 매일3 MAC2PDF_IN 600DPI 125LPI T

Notes: Kerosene+Diesel: Sum of diesel (excluding for transport), indoor kerosene, and boiler kerosene consumption.Values in parentheses refer to the year-on-year growth rate (%); p refers to tentative figures; e refers to forecasts.
- Naphtha is forecast to record an annual average increase rate of 2.7% in 2012 as a
result of continued favorable conditions in the petrochemical industry, but the speed of
increase will likely slow down steadily.
- Diesel for transport is expected to continue the upward trend witnessed in the second
half of 2011 in the first half of 2012 and record an annual 0.6% rise in 2012.
- Oil for use as fuel, including kerosene, diesel, and heavy oil, is expected to continue a
downward trend across all sectors, including the transformation sector, owing to high
oil prices.
124 KOREA ENERGY ECONOMICS INSTITUTE
KEEI Korea Energy Demand Outlook
20121/4p 2/4p 3/4p 4/4e Annual (e) First half of
the year (e)Second half ofthe year (e) Annual (e)
2011Category
(Unit: Million bbl)
Gasoline16.3 16.3 19.1 18.1 69.8 33.6 37.2 70.8(2.8) (-3.5) (3.2) (2.2) (1.2) (2.9) (0.2) (1.5)
Diesel for 24.3 24.6 28.1 28.1 105.1 49.9 55.8 105.7transport (1.2) (-9.5) (5.6) (2.5) (-0.1) (2.0) (-0.6) (0.6)
Kerosene+Diesel18.6 9.4 10.1 17.4 55.6 27.7 26.1 53.9(including for(5.0) (-13.2) (0.1) (-13.0) (-5.4) (-1.0) (-5.3) (-3.2)power generation)
Heavy oil19.3 11.5 11.5 15.4 57.8 28.5 26.0 54.5(including for(-3.1) (-23.5) (-16.0) (-7.1) (-11.5) (-7.6) (-3.3) (-5.6)power generation)
Naphtha88.7 83.9 90.7 89.7 352.9 178.0 184.6 362.6(9.3) (2.1) (9.2) (4.8) (6.4) (3.2) (2.4) (2.7)
LPG24.6 22.3 25.6 26.8 99.3 47.1 49.1 96.2(including for(-7.0) (-14.8) (0.3) (-0.8) (-5.6) (0.4) (-6.3) (-3.1)power generation)
<TableⅢ-17> Outlook on demand for key petroleum products
수요전망 내지13-4 문 2012.3.8 4:2 PM 페이지124 매일3 MAC2PDF_IN 600DPI 125LPI T
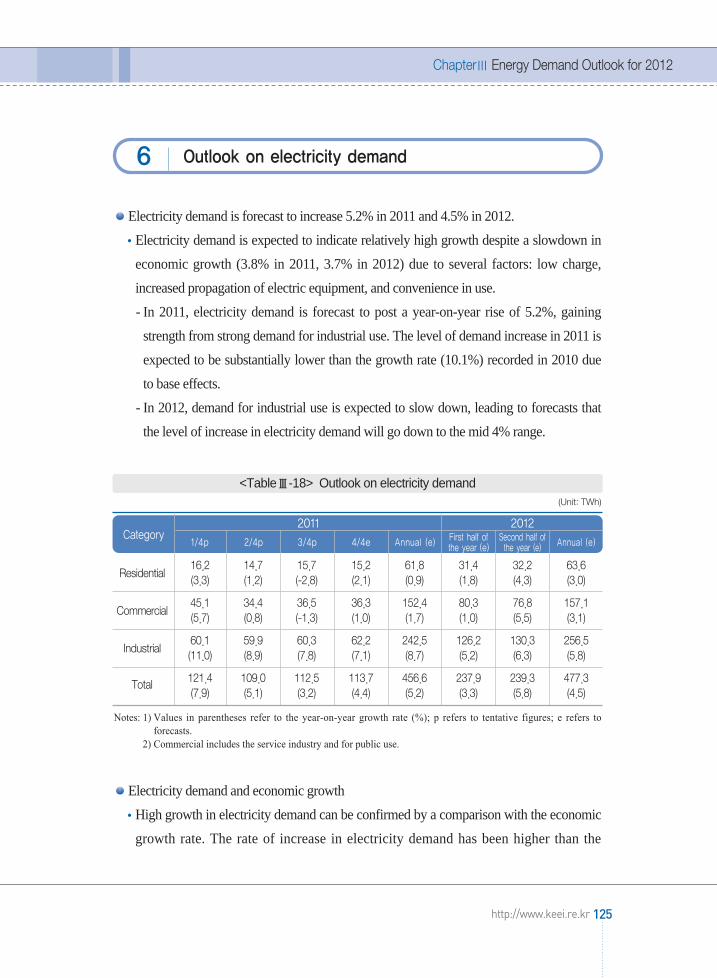
Electricity demand is forecast to increase 5.2% in 2011 and 4.5% in 2012.
Electricity demand is expected to indicate relatively high growth despite a slowdown in
economic growth (3.8% in 2011, 3.7% in 2012) due to several factors: low charge,
increased propagation of electric equipment, and convenience in use.
- In 2011, electricity demand is forecast to post a year-on-year rise of 5.2%, gaining
strength from strong demand for industrial use. The level of demand increase in 2011 is
expected to be substantially lower than the growth rate (10.1%) recorded in 2010 due
to base effects.
- In 2012, demand for industrial use is expected to slow down, leading to forecasts that
the level of increase in electricity demand will go down to the mid 4% range.
Notes: 1) Values in parentheses refer to the year-on-year growth rate (%); p refers to tentative figures; e refers toforecasts.
2) Commercial includes the service industry and for public use.
Electricity demand and economic growth
High growth in electricity demand can be confirmed by a comparison with the economic
growth rate. The rate of increase in electricity demand has been higher than the
ChapterⅢ Energy Demand Outlook for 2012
125http://www.keei.re.kr
Outlook on electricity demand6
20121/4p 2/4p 3/4p 4/4e Annual (e) First half of
the year (e)Second half ofthe year (e) Annual (e)
2011Category
(Unit: TWh)
Residential16.2 14.7 15.7 15.2 61.8 31.4 32.2 63.6 (3.3) (1.2) (-2.8) (2.1) (0.9) (1.8) (4.3) (3.0)
Commercial45.1 34.4 36.5 36.3 152.4 80.3 76.8 157.1 (5.7) (0.8) (-1.3) (1.0) (1.7) (1.0) (5.5) (3.1)
Industrial60.1 59.9 60.3 62.2 242.5 126.2 130.3 256.5 (11.0) (8.9) (7.8) (7.1) (8.7) (5.2) (6.3) (5.8)
Total 121.4 109.0 112.5 113.7 456.6 237.9 239.3 477.3 (7.9) (5.1) (3.2) (4.4) (5.2) (3.3) (5.8) (4.5)
<TableⅢ-18> Outlook on electricity demand
수요전망 내지13-4 문 2012.3.8 4:2 PM 페이지125 매일3 MAC2PDF_IN 600DPI 125LPI T

economic growth rate since 2000 (excluding 2006).
- The GDP elasticity of total electricity consumption is expected to steadily decrease
from 1.62 in 2010 to 1.36 in 2011 and 1.22 in 2012.
- The GDP elasticity of consumption for industrial use, which sensitively responds to
economic growth, is expected to go up from 2.07 in 2010 to 2.28 in 2011 and then
decline to 1.56 in 2012.
- The level of increase in electricity consumption for industrial use showed similar trends
as the economic growth rate in the early 2000s. However, the level of growth has been
much higher than the economic growth rate since 2006.
- In particular, there has been a huge gap between the rate of increase in electricity
consumption and the economic growth rate since 2009 owing to favorable conditions
in industries that consume great amounts of electricity and expansion of facilities in the
steel industry28).
- In addition, the relatively low charge for electricity for industrial use in Korea (continued
drop in real prices) likely contributed to a soar in consumption for industrial use.29)
126 KOREA ENERGY ECONOMICS INSTITUTE
KEEI Korea Energy Demand Outlook
[FigureⅢ-9] Outlook on economic growth rate and electricity demand increase rate
28) Electric furnace steel factory of Dongbu Steel (annual production capacity of 3 million tons, July 2009), HyundaiSteel Blast Furnace #1 and #2 (total annual production capacity of 8 million tons, January and December 2010),thick plate factory of Dongkuk Steel (annual production capacity of 1.5 million tons, May 2010), etc.
29) Increased consumption from price effect, fuel (facility) replacement (oil → electricity), reduced self powergeneration (increased electricity purchasing)
수요전망 내지13-4 문 2012.3.8 4:2 PM 페이지126 매일3 MAC2PDF_IN 600DPI 125LPI T

Notes: e refers to forecasts.
Electricity demand by sector
Electricity demand for industrial use is forecast to go up 8.7% in 2011 and 5.8% in 2012.
- The fabricated metal (machinery, equipment, automobiles, etc.), basic metal, and
petrochemical industries are forecast to lead the increase in demand in 2012 as well.
- Electricity demand for industrial use is expected to steadily slow down in tandem with
the completion of large facility expansions.
ChapterⅢ Energy Demand Outlook for 2012
127http://www.keei.re.kr
Category Economic growth rate (%)
Rate of increase in electricityconsumption (%)
GDP elasticity of electricityconsumption
Total electricity For industrial use Total electricity For industrial use
2000 8.8 11.8 9.4 1.34 1.07
2001 4.0 7.6 2.7 1.91 0.67
2002 7.2 8.0 6.4 1.12 0.89
2003 2.8 5.4 4.1 1.94 1.47
2004 4.6 6.3 5.3 1.36 1.14
2005 4.0 6.5 5.4 1.65 1.36
2006 5.2 4.9 4.7 0.94 0.90
2007 5.1 5.7 6.6 1.12 1.30
2008 2.3 4.5 4.5 1.94 1.96
2009 0.3 2.4 1.6 8.14 5.33
2010 6.2 10.1 12.9 1.62 2.07
2011e 3.8 5.2 8.7 1.36 2.28
2012e 3.7 4.5 5.8 1.22 1.56
<TableⅢ-19> Trends in GDP elasticity of electricity demand
수요전망 내지13-4 문 2012.3.8 4:2 PM 페이지127 매일3 MAC2PDF_IN 600DPI 125LPI T

Electricity demand for commercial use is forecast to rise 1.7% in 2011 and 3.1% in 2012.
- The slowdown in demand for commercial use in 2011 resulted from a drop in demand
for cooling owing to low temperatures in the summer and electricity-saving policies,
such as the measure on placing restrictions on heating temperatures that was enforced
in January and February 201130). From January through October 2011, electricity
consumption for commercial use rose merely 1.9% from the same period of the
previous year.
Electricity demand for residential use will likely go up 0.9% in 2011 and 3.0% in 2012,
thus indicating a similar pattern with demand for commercial use.
- Electricity consumption for residential use from January through October 2011
indicated year-on-year growth of merely 0.5%, a result of decreased consumption in
July and August. The rate of increase is expected to slightly go up in 2012 as a result of
base effects from stagnant consumption in 2011.
128 KOREA ENERGY ECONOMICS INSTITUTE
KEEI Korea Energy Demand Outlook
30) It was carried out for 441 large buildings for four weeks in January and February in tandem with the coldwave in the winter and a rise in international oil prices.
[FigureⅢ-10] Outlook on electricity demand by sector
수요전망 내지13-4 문 2012.3.8 4:2 PM 페이지128 매일3 MAC2PDF_IN 600DPI 125LPI T
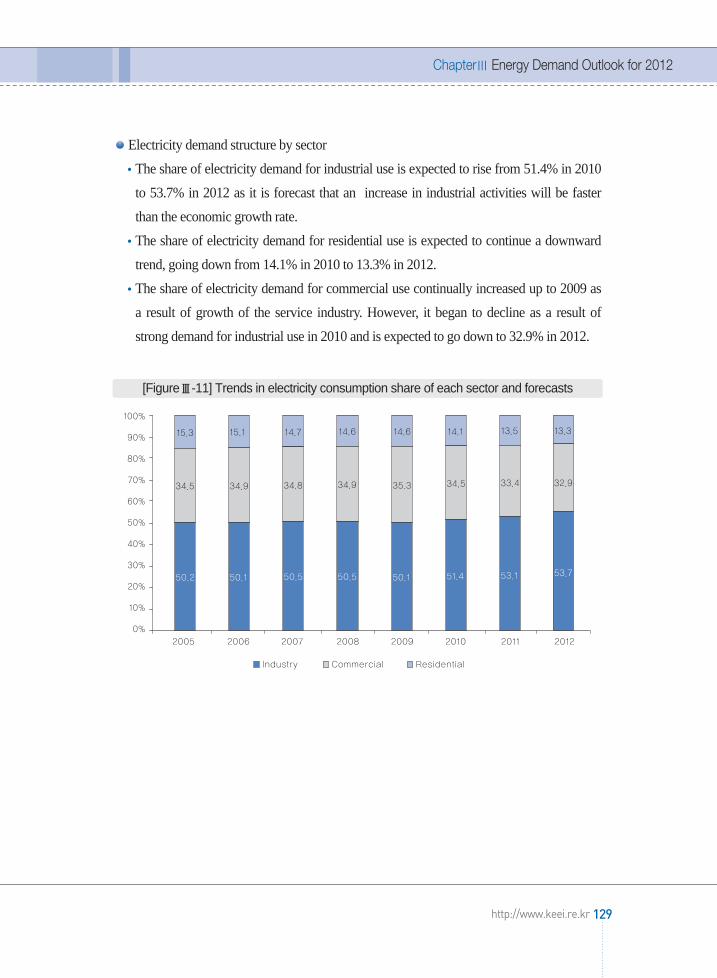
Electricity demand structure by sector
The share of electricity demand for industrial use is expected to rise from 51.4% in 2010
to 53.7% in 2012 as it is forecast that an increase in industrial activities will be faster
than the economic growth rate.
The share of electricity demand for residential use is expected to continue a downward
trend, going down from 14.1% in 2010 to 13.3% in 2012.
The share of electricity demand for commercial use continually increased up to 2009 as
a result of growth of the service industry. However, it began to decline as a result of
strong demand for industrial use in 2010 and is expected to go down to 32.9% in 2012.
ChapterⅢ Energy Demand Outlook for 2012
129http://www.keei.re.kr
[FigureⅢ-11] Trends in electricity consumption share of each sector and forecasts
수요전망 내지13-4 문 2012.3.8 4:2 PM 페이지129 매일3 MAC2PDF_IN 600DPI 125LPI T

A. Outlook on LNG demand
In 2011 and 2012, LNG demand is expected to continue sound growth, gaining strength
from a steady rise in demand for power generation.
In 2011, LNG demand will likely continue the high growth recorded in the previous
year. It is forecast to post a year-on-year rise of 10.1% to reach 36,435 thousand tons.
- The sharp rise in LNG demand for power generation will somewhat slow down due to
base effects. It will, however, continue high growth and record a level of increase of
13.0% from the previous year.
- LNG consumption for production of town gas is expected to record 19,015 thousand
tons, a year-on-year rise of 8.2%, attributable to continued favorable conditions in the
economy despite base effects.
In 2012, LNG demand is expected to record a year-on-year increase of 5.0% to reach
38,239 thousand tons, gaining strength from continued growth in demand for power
generation.
- LNG demand for power generation is forecast to record considerable growth in
consideration of the outlook on electricity demand based on economic growth, despite
the planned operation of new base-load power generation facilities such as Singori
Power Plant Unit 2 (1,000MW) and Sinwolseong Power Plant Unit 2 (1,000MW).
- LNG demand for gas production is forecast to continue sound growth and record a
year-on-year rise of 4.8% to reach 19,933 thousand tons. This is based on the economic
outlook and temperature assumptions.
130 KOREA ENERGY ECONOMICS INSTITUTE
KEEI Korea Energy Demand Outlook
Outlook on LNG and town gas demand7
수요전망 내지13-4 문 2012.3.8 4:2 PM 페이지130 매일3 MAC2PDF_IN 600DPI 125LPI T

Notes: 1) Values in parentheses refer to the year-on-year growth rate (%); p refers to tentative figures; e refers to forecasts.2) LNG for power generation includes LNG input for district heating.3) Total LNG refers to the total amount of primary energy that includes gas production loss and internal
consumption.
LNG consumption for power generation accounted for only 33% of overall LNG
consumption in 2001. Its share is forecast to go up to approximately 46% in 2012.
An examination of LNG consumption for different uses since 2001 indicates that the
increase or decrease in the share occupied by consumption for power generation
determines the total LNG consumption increase rate.
ChapterⅢ Energy Demand Outlook for 2012
131http://www.keei.re.kr
20121/4p 2/4p 3/4p 4/4e Annual (e) First half of
the year (e)Second half ofthe year (e) Annual (e)
2011Category
(Unit: 1,000 tons)
Gas 7,071 3,436 2,841 5,667 19,015 11,094 8,840 19,933production (6.2) (4.5) (20.8) (7.4) (8.2) (5.6) (3.9) (4.8)
Power 4,835 3,698 3,321 4,702 16,556 8,604 8,823 17,427generation (20.8) (13.4) (4.2) (12.0) (13.0) (0.8) (10.0) (5.3)
Total LNG12,243 7,314 6,270 10,608 36,435 20,359 18,157 38,239(11.3) (9.1) (10.3) (9.4) (10.1) (3.4) (6.7) (5.0)
<Table Ⅲ-20> Outlook on LNG demand
[FigureⅢ-12] Trends in LNG demand per use and outlook
수요전망 내지13-4 문 2012.3.8 4:2 PM 페이지131 매일3 MAC2PDF_IN 600DPI 125LPI T

- Unlike town gas demand, which increases relatively stably, demand for power
generation, which is used to handle peak load, fluctuates greatly and influences
changes in the total LNG consumption increase rate.
B. Outlook on town gas demand
In 2011 and 2012, town gas demand is expected to record sound growth in tandem with
continued increase in demand for industrial use, which has been leading overall demand.
In 2011, town gas demand is expected to record a year-on-year increase of 7.7% to post
21,526 million m 3 .
- Consumption for residential/commercial use is forecast to post a year-on-year rise of
5.2% to record 12,452 million m 3 as a result of an increase in consumption for
commercial use in tandem with an upswing in the service industry.
- Demand for industrial use is expected to record a year-on-year rise of 11.9% to stand at
7,776 million m 3, attributable to a continued upswing in the heavy chemical industry.
In 2012, town gas demand is expected to reach 22,617 million m 3, a year-on-year
increase of 5.1%.
- Demand for residential/commercial use is expected to indicate gradual growth of 2.0%
compared to the previous year and stand at 12,695 million m3, assuming average year
temperatures and an economic slowdown.
- Demand for industrial use is forecast to continue sound growth, posting a year-on-year
rise of 9.5% to reach 8,519 million m 3.
·In 2012, domestic demand in the manufacturing industry is forecast to somewhat
slow down owing to a downturn in consumer confidence and a slowdown in
economic recovery. However, industries that consume large amounts of energy,
including the steel and petrochemical industries, are likely to witness a continued
increase in demand for exports, leading to forecasts of continued favorable conditions
in production.
132 KOREA ENERGY ECONOMICS INSTITUTE
KEEI Korea Energy Demand Outlook
수요전망 내지13-4 문 2012.3.8 4:2 PM 페이지132 매일3 MAC2PDF_IN 600DPI 125LPI T

Notes: 1) Values in parentheses refer to the year-on-year growth rate (%); p refers to tentative figures.2) Town gas total includes the amount used for transport and cogeneration.
ChapterⅢ Energy Demand Outlook for 2012
133http://www.keei.re.kr
[FigureⅢ-13] Trends in town gas demand and outlook by use
20121/4p 2/4p 3/4p 4/4e Annual (e) First half of
the year (e)Second half ofthe year (e) Annual (e)
2011Category
(Unit: Million)
Residential/ 5,697 2,322 1,024 3,409 12,452 8,234 4,461 12,695commercial (5.7) (0.5) (14.5) (5.2) (5.2) (2.7) (0.6) (2.0)
Industrial2,139 1,837 1,649 2,151 7,776 4,441 4,077 8,519(8.9) (12.1) (13.7) (13.5) (11.9) (11.7) (7.3) (9.5)
Transport250 274 299 282 1,105 567 625 1,192(4.2) (5.2) (7.1) (2.8) (4.9) (8.2) (7.5) (7.9)
Town gas 8,141 4,466 3,030 5,889 21,526 13,353 9,263 22,617total (6.2) (5.5) (14.8) (8.2) (7.7) (5.9) (3.9) (5.1)
<TableⅢ-21> Outlook on town gas demand
수요전망 내지13-4 문 2012.3.8 4:2 PM 페이지133 매일3 MAC2PDF_IN 600DPI 125LPI T
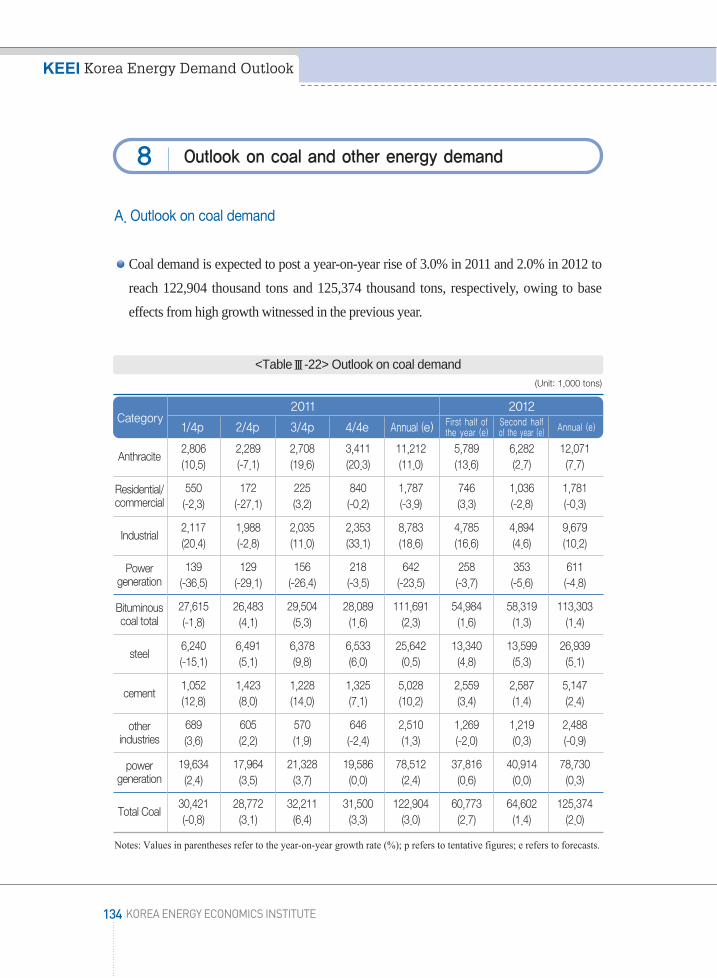
A. Outlook on coal demand
Coal demand is expected to post a year-on-year rise of 3.0% in 2011 and 2.0% in 2012 to
reach 122,904 thousand tons and 125,374 thousand tons, respectively, owing to base
effects from high growth witnessed in the previous year.
Notes: Values in parentheses refer to the year-on-year growth rate (%); p refers to tentative figures; e refers to forecasts.
134 KOREA ENERGY ECONOMICS INSTITUTE
KEEI Korea Energy Demand Outlook
Outlook on coal and other energy demand8
(Unit: 1,000 tons)
Category2011 2012
1/4p 2/4p 3/4p 4/4e Annual (e) First half of the year (e)
Second halfof the year (e) Annual (e)
Anthracite2,806 2,289 2,708 3,411 11,212 5,789 6,282 12,071(10.5) (-7.1) (19.6) (20.3) (11.0) (13.6) (2.7) (7.7)
Residential/ 550 172 225 840 1,787 746 1,036 1,781commercial (-2.3) (-27.1) (3.2) (-0.2) (-3.9) (3.3) (-2.8) (-0.3)
Industrial2,117 1,988 2,035 2,353 8,783 4,785 4,894 9,679(20.4) (-2.8) (11.0) (33.1) (18.6) (16.6) (4.6) (10.2)
Power 139 129 156 218 642 258 353 611generation (-36.5) (-29.1) (-26.4) (-3.5) (-23.5) (-3.7) (-5.6) (-4.8)
Bituminous 27,615 26,483 29,504 28,089 111,691 54,984 58,319 113,303coal total (-1.8) (4.1) (5.3) (1.6) (2.3) (1.6) (1.3) (1.4)
steel6,240 6,491 6,378 6,533 25,642 13,340 13,599 26,939(-15.1) (5.1) (9.8) (6.0) (0.5) (4.8) (5.3) (5.1)
cement1,052 1,423 1,228 1,325 5,028 2,559 2,587 5,147(12.8) (8.0) (14.0) (7.1) (10.2) (3.4) (1.4) (2.4)
other 689 605 570 646 2,510 1,269 1,219 2,488industries (3.6) (2.2) (1.9) (-2.4) (1.3) (-2.0) (0.3) (-0.9)
power 19,634 17,964 21,328 19,586 78,512 37,816 40,914 78,730generation (2.4) (3.5) (3.7) (0.0) (2.4) (0.6) (0.0) (0.3)
Total Coal30,421 28,772 32,211 31,500 122,904 60,773 64,602 125,374(-0.8) (3.1) (6.4) (3.3) (3.0) (2.7) (1.4) (2.0)
<TableⅢ-22> Outlook on coal demand
수요전망 내지13-4 문 2012.3.8 4:2 PM 페이지134 매일3 MAC2PDF_IN 600DPI 125LPI T
Bituminous coal consumption is forecast to record a year-on-year increase of 2.3% in
2011 and 1.4% in 2012 to reach 111,691 thousand tons and 113,303 thousand tons,
respectively. This is attributable to a slowdown in the rise in bituminous coal demand for
steel making and a slowdown in demand for power generation.
- Bituminous coal demand for steel making is forecast to post a year-on-year rise of
0.5% in 2011 and 5.1% in 2012 to reach 25,642 thousand tons and 26,939 thousand
tons, respectively, despite the launch of operation of Hyundai Steel Blast Furnace #2.
This is attributable to the expected slowdown in demand in major steel-demand
industries and base effects from the previous year.
- Bituminous coal consumption in the cement industry indicated a rapid decrease during
the last two years. It recorded high growth of 12.3% from January through October
2011 due to base effects. It is forecast to post a year-on-year rise of 10.2% in 2011, and
2.4% in 2012 owing to an economic decline.
- Since no new coal-based thermal power plants were built, bituminous coal demand for
power generation will likely maintain the level witnessed in the previous year, when
the maximum operation rate was recorded.
Anthracite consumption is expected to rise 11.0% in 2011 and 7.7% in 2012 to reach
11,212 thousand tons and 12,071 thousand tons, respectively, despite a drop in
consumption for residential/commercial use and power generation. This is owing to a
rapid increase in anthracite consumption for industrial use.
With regards to coal consumption trends by usage, coal consumption for power
generation indicated rapid growth up to 2010 and led overall coal consumption. It is
forecast to rise 2.1% in 2011 and maintain the consumption level witnessed in 2011 in
2012 as well.
- Coal consumption for industrial use is repeatedly going up and down according to the
economic flow. In contrast, coal consumption for power generation has been steadily
rising owing to a continued increase in electricity demand.
ChapterⅢ Energy Demand Outlook for 2012
135http://www.keei.re.kr
수요전망 내지13-4 문 2012.3.8 4:2 PM 페이지135 매일3 MAC2PDF_IN 600DPI 125LPI T

B. Outlook on thermal energy, new & renewable energy, and other energy
In 2011 and 2012, thermal energy demand is expected to record a year-on-year increase of
3.9% and 1.5%, respectively, based on forecasts on the construction business in the private
sector and assuming that average year temperatures will be recorded.
The thermal energy charge31) was raised 6.9% in September 2011 and was raised again
by 4.9% in December, but this is expected to have not much influence.
- Despite the price increase on two occasions, thermal energy still remains affordable
compared to other sources of energy. In addition, community energy supply systems
will be established for residential districts. For this reason, thermal energy demand is
expected to gradually go up.
136 KOREA ENERGY ECONOMICS INSTITUTE
KEEI Korea Energy Demand Outlook
[FigureⅢ-14] Coal demand trends and forecasts per use
31) Heating price adjustments are made on a quarterly basis in accordance with the fuel adjustmentmechanism. Measures were taken to freeze the price (four times) and reduce the price (twice) betweenNovember 2009 and September 2011.
수요전망 내지13-4 문 2012.3.8 4:2 PM 페이지136 매일3 MAC2PDF_IN 600DPI 125LPI T
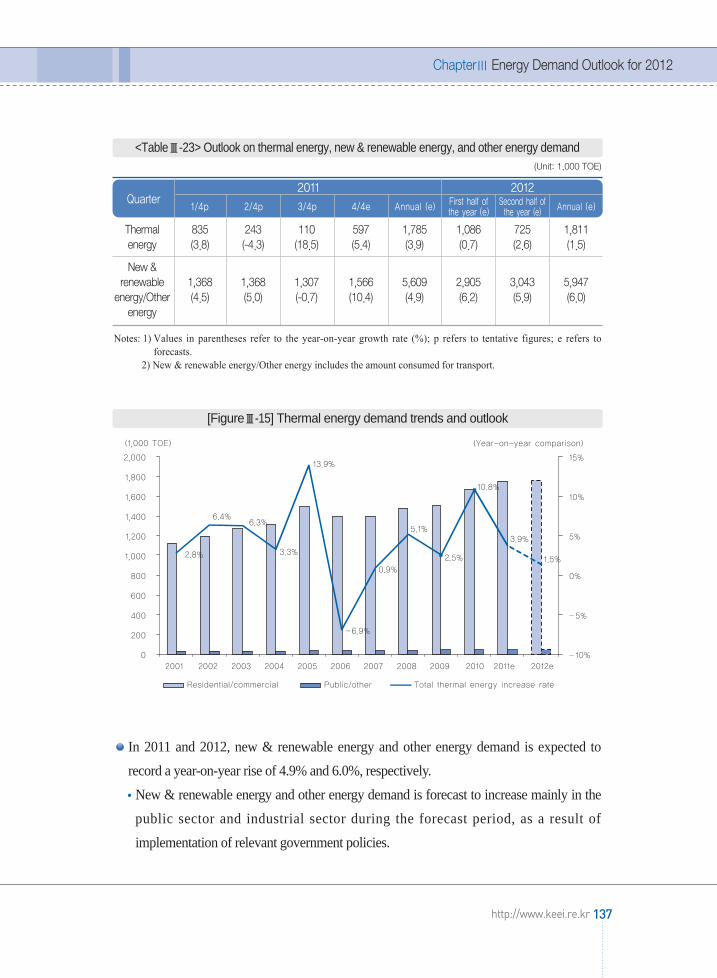
Notes: 1) Values in parentheses refer to the year-on-year growth rate (%); p refers to tentative figures; e refers toforecasts.
2) New & renewable energy/Other energy includes the amount consumed for transport.
In 2011 and 2012, new & renewable energy and other energy demand is expected to
record a year-on-year rise of 4.9% and 6.0%, respectively.
New & renewable energy and other energy demand is forecast to increase mainly in the
public sector and industrial sector during the forecast period, as a result of
implementation of relevant government policies.
ChapterⅢ Energy Demand Outlook for 2012
137http://www.keei.re.kr
20121/4p 2/4p 3/4p 4/4e Annual (e) First half of
the year (e)Second half ofthe year (e) Annual (e)
2011Quarter
(Unit: 1,000 TOE)
Thermal 835 243 110 597 1,785 1,086 725 1,811energy (3.8) (-4.3) (18.5) (5.4) (3.9) (0.7) (2.6) (1.5)
New & renewable 1,368 1,368 1,307 1,566 5,609 2,905 3,043 5,947
energy/Other (4.5) (5.0) (-0.7) (10.4) (4.9) (6.2) (5.9) (6.0)energy
<TableⅢ-23> Outlook on thermal energy, new & renewable energy, and other energy demand
[FigureⅢ-15] Thermal energy demand trends and outlook
수요전망 내지13-4 문 2012.3.8 4:2 PM 페이지137 매일3 MAC2PDF_IN 600DPI 125LPI T

The industrial sector is forecast to actively move forward with increasing use of new &
renewable energy and other energy based on use of waste gas resources, etc. in response
to the Renewable Portfolio Standard (RPS) planned for adoption in 2012.
138 KOREA ENERGY ECONOMICS INSTITUTE
KEEI Korea Energy Demand Outlook
[FigureⅢ-16] Trends and outlook on new & renewable energy and other energy demand
수요전망 내지13-4 문 2012.3.8 4:2 PM 페이지138 매일3 MAC2PDF_IN 600DPI 125LPI T

A. Major characteristics
From January through October 2011, primary energy consumption rose 3.3%, recording a
lower increase rate than cumulative economic growth (3.7%) from the first through the
third quarter of 2011.
From January through October, primary energy consumption indicated gradual growth
as the level of economic growth somewhat slowed down. This is despite a rise in energy
demand for heating purposes owing to the record-breaking cold wave in January32).
A soar in international oil prices in the first quarter and strengthening of energy-saving
policies33) likely contributed to the stabilization of energy consumption.
* A 32% rise in average Dubai oil prices ($/bbl): (First quarter of 2010) 75.90 → (First
quarter of 2011) 100.44
The speed of industrial production increase exceeded the level of economic growth
(3.7%). Energy consumption for industrial use (4.6% increase) led a rise in primary
energy consumption from January through October.
* From January through October 2011, industrial production recorded a year-on-year
increase of 7.4%.
The level of contribution made by the economic growth factor to a rise in primary
energy consumption from January through September is assumed to be 3.6%p, while
that made by the temperature effect is assumed to be 0.7%p34).
- On the other hand, changes in other factors such as energy efficiency improvements
and a rise in oil prices reduced energy consumption by 1.1%p.
ChapterⅢ Energy Demand Outlook for 2012
139http://www.keei.re.kr
32) The average temperature in January (-7.2℃) was the lowest in 48 years (5.4℃ lower than the average yeartemperature).
33) Measure on placing restrictions on heating temperatures in buildings (January 24-February 18), emergencymeasure on saving energy (February 27 and onwards), etc.
34) GDP is announced by quarter. For this reason, an analysis of the level of contribution made to a rise inconsumption is limited to January through September.
Characteristics and implications9
수요전망 내지13-4 문 2012.3.8 4:2 PM 페이지139 매일3 MAC2PDF_IN 600DPI 125LPI T

Notes: 1) Values in parentheses refer to each factor’s level of contribution to change in energy consumption.2) Other effects include all factors that trigger a change in energy consumption excluding the
temperature effect and economic growth effect such as changes in the industrial structure andenergy prices as well as energy efficiency improvements.
The establishment of a low energy-consuming industrial structure and improvements in
energy intensity were carried out amid strong demand in the industrial sector.
From January through October 2011, energy consumption in the manufacturing industry,
which accounts for more than 95% of energy consumption in the industrial sector,
recorded sound growth of 4.4% year-on-year owing to continued favorable conditions in
the fabricated metal, metal product (steel), and petrochemical industries.
An analysis of the level of contribution made to a rise in energy consumption in the
manufacturing industry from January through September 201135) indicates that industrial
structure changes and energy intensity improvements contributed to restraining the
increase in energy consumption.
140 KOREA ENERGY ECONOMICS INSTITUTE
KEEI Korea Energy Demand Outlook
[FigureⅢ-17] Level of contribution of each factor towards a rise in primary energyconsumption from January through September 2011
35) The added value of each business type is announced by quarter. This is why an analysis of the level ofcontribution to a rise in consumption is carried out for January through September only. Energy consumption ofthe manufacturing industry does not include anthracite and new & renewable energy. Only overall industrialstatistics are compiled for new & renewable energy and anthracite for industrial use. They are not brokendown into statistics by business type under the manufacturing industry.
수요전망 내지13-4 문 2012.3.8 4:2 PM 페이지140 매일3 MAC2PDF_IN 600DPI 125LPI T

- The level of contribution made by production activities to a rise in energy consumption
in the manufacturing industry is assumed to be 7.5%p. This means that energy
consumption in the manufacturing industry would have posted a year-on-year increase
of 7.5% if no changes took place in other factors.
- In contrast, the level of contribution made by industrial structure changes to a rise in
energy consumption was -2.4%p. Industrial structure changes contributed to bringing
down energy consumption in the manufacturing industry by 1.7 million TOE.
- This is because the share of the manufacturing industry’s added value that is taken up
by the fabricated metal industry, which has a relatively low energy intensity, went up,
while the share accounted for by the petrochemical industry, whose energy intensity is
high, declined.
- Energy intensity improvements of the manufacturing industry led to a 0.8%p decline in
consumption.
Forecasts on energy intensity improvements in 2011 and 2012
Energy intensity (TOE/million won) deteriorated in 2009 and 2010, but is expected to
improve to 0.251 in 2011 and 0.249 in 2012.
ChapterⅢ Energy Demand Outlook for 2012
141http://www.keei.re.kr
[FigureⅢ-18] Level of contribution of each factor towards a change in manufacturing industry consumption from January through September 2011
수요전망 내지13-4 문 2012.3.8 4:2 PM 페이지141 매일3 MAC2PDF_IN 600DPI 125LPI T

The worsened energy intensity in 2009 and 2010 seems to be temporary amid mid- to
long-term energy efficiency improvements.
- The worsened energy intensity of 2009 resulted from the level of increase in primary
energy consumption (1.1%) exceeding the economic growth rate (0.3%), owing to
operation of new facilities in industries that consume a great amount of energy and a
rise in energy transformation loss as a result of a rapid increase in electricity
consumption36).
- The worsened energy intensity of 2010 mainly resulted from base effects from sluggish
consumption witnessed in the previous year, a soar in energy consumption for
industrial use owing to a rapid economic upswing, and an increase in energy
consumption for cooling and heating purposes as a result of abnormal climate
conditions throughout all seasons.
Notes: e refers to forecasts.
Continued rapid increase in electricity consumption is expected
Electricity is forecast to maintain a rapid increase in consumption due to several factors:
low charge; continued upswing in production in industries that consume a great amount
of electricity; increased propagation of electric equipment; and convenience in use.
142 KOREA ENERGY ECONOMICS INSTITUTE
KEEI Korea Energy Demand Outlook
36) Final energy consumption went down 0.3% in 2009 but electricity consumption indicated relatively highgrowth at 2.4%.
Category 2005 2006 2007 2008 2009 2010 2011e 2012e
Economic growth rate (%) 4.0 5.2 5.1 2.3 0.3 6.2 3.8 3.7
Primary energy consumption3.8 2.1 1.3 1.8 1.1 7.9 3.3 3.0increase rate (%)
Energy intensity 0.264 0.256 0.247 0.246 0.248 0.252 0.251 0.249(TOE/Million won)
<TableⅢ-24> Outlook on energy intensity
수요전망 내지13-4 문 2012.3.8 4:2 PM 페이지142 매일3 MAC2PDF_IN 600DPI 125LPI T

- Electricity consumption indicated annual average growth of 9.8% in the 1990s, and
continued an annual average increase of 6.1% in the 2000s, the highest among major
final energy sources.
- Electricity consumption rose 10.1% in 2010, attributable to the economic recovery and
temperature effects. It is forecast to record relatively rapid growth of 5.2% in 2011 and
4.5% in 2012.
A rise in electricity consumption expands energy conversion loss, thus triggering an
increase in primary energy demand37).
- The level of contribution made by electricity towards a rise in primary energy
consumption is forecast to be 49.4% in 2011 and 50.9% in 2012. It is forecast that
around half of the primary energy increase will be accounted for by electricity demand.
- Strong electricity demand is expected to continue for the time being as a result of sound
growth of industries that consume great amounts of electricity and changes in lifestyles
triggered by technological development.
The supplied reserve level is steadily decreasing
Since 2000, peak electricity demand has been quickly increasing, faster than the speed at
which power generation facilities were built. For this reason, spare electricity is steadily
declining.
From 2000 through 2011, peak electricity demand in the summer indicated annual
average growth of 5.3%. In contrast, total capacity and supply capacity recorded an
annual average increase of a mere 4.7% and 4.9%, respectively. The supplied reserve
level in the summer substantially dropped.
- In 2011, summer peak demand (72.19 million kW) recorded a year-on-year rise of only
3.3% owing to low temperatures in August, resulting in a supplied reserve level of 5.44
million kW. However, abnormally high temperatures continued in early September,
resulting in a decline in reserve power to 240 thousand kW and the rolling blackout.38)
ChapterⅢ Energy Demand Outlook for 2012
143http://www.keei.re.kr
37) There is an energy loss of 63.6% in the power generation sector (as of 2010). This is why 2.74 TOE ofprimary energy is needed to produce 1 TOE of electricity.
수요전망 내지13-4 문 2012.3.8 4:2 PM 페이지143 매일3 MAC2PDF_IN 600DPI 125LPI T
Peak demand in the winter (December - February) indicated annual average growth of
6.2% during the past decade, thus recording a faster increase rate than peak demand in
the summer. Power generation capacity at the point of winter peak demand recorded an
annual average increase of 4.6%. This means that reserve power at the point of winter
peak demand quickly went down.
- Winter peak demand in 2011 (December 2010~February 2011) stood at 73.14 million
kW, a year-on-year rise of 6.1%, as a result of the economic upswing, continued cold
wave, and affordable electricity charge. The supplied reserve level declined to 4.04
million kW.
Increase in the range of fluctuation in energy demand caused by temperature changes
Temperature changes have had increasing influence on changes in energy consumption
in the 2000s.
- Energy consumption is substantially influenced by temperature changes in tandem with
increased dissemination and use of cooling and heating equipment and frequent
occurrence of abnormal climate conditions.
Electricity demand in the winter is especially becoming more sensitive to temperatures
and the range of fluctuation in demand is widening in tandem with increased
dissemination of electric heating equipment.
- An analysis of how sensitive electricity demand was towards changes in HDD in a 10-
year period after 1985 (movement to recent year by one year on an annual basis)39)
indicates that electricity demand is becoming more sensitive to temperatures as time
passes.
- This shows that electricity is quickly replacing oil as energy for heating.
144 KOREA ENERGY ECONOMICS INSTITUTE
KEEI Korea Energy Demand Outlook
38) Electricity demand was 67.26 million kW and supply capacity was 67.52 million kW.39) Sensitivity analysis model (Monthly data used): InE=α+β1InGDP+β2CDD+β3HDD+e
(E refers to electricity, CDD refers to Cooling Degree Days, HDD refers to Heating Degree Days)
수요전망 내지13-4 문 2012.3.8 4:2 PM 페이지144 매일3 MAC2PDF_IN 600DPI 125LPI T

Oil dependence regarding primary energy consumption is forecast to continually drop.
The share of primary energy taken up by oil decreased to less than 40% in 2010, and will
likely go down further to 37.7% in 2012.
When excluding non-energy oil for industrial raw material use (naphtha, asphalt, etc.),
the share of primary energy taken up by oil used as an energy source is expected to
decrease from 21.8% in 2010 to 19.6% in 2012.
- The share of primary energy taken up by non-energy oil stood at 17.9% in 2010 and
will likely go up slightly to 18.1% in 2012.
The decrease in the Korean economy’s dependence on energy oil is likely the result of
continued high oil prices and relative prices among energy sources in Korea.
- A rise in oil prices has led to a slowdown in the level of increase in fuel consumption
for transport and continued downward trend in consumption for power generation. Oil
is being steadily replaced by other energy sources such as electricity.
ChapterⅢ Energy Demand Outlook for 2012
145http://www.keei.re.kr
[FigureⅢ-19] Changes in electricity demand sensitivity for temperatures
수요전망 내지13-4 문 2012.3.8 4:2 PM 페이지145 매일3 MAC2PDF_IN 600DPI 125LPI T

There is a need to examine whether the speed at which the share taken up by energy oil
is dropping is appropriate when Korea establishes energy supply and demand policies.
- Considering Korea’s industrial structure, where the level of contribution made by the
petrochemical industry to the economy is high, the nation’s oil dependence target
should be set targeting oil for fuel.
B. Policy implications
Continually implement measures to stabilize winter and summer electricity supply and
demand in 2012.
Due to limited expansion of base-load power generation facilities (nuclear power,
bituminous coal), electricity supply and demand conditions that were witnessed in 2011
will likely continue in 2012.
- Commercial operation is planned for two nuclear power plants (Singori Nuclear Power
Plant Unit 2, Sinwolseong Nuclear Power Plant Unit 1) in the first half of 2012, but
there are no plans for additional bituminous coal-based power generation facilities.
146 KOREA ENERGY ECONOMICS INSTITUTE
KEEI Korea Energy Demand Outlook
[FigureⅢ-20] Trends in oil dependence and forecasts
수요전망 내지13-4 문 2012.3.8 4:2 PM 페이지146 매일3 MAC2PDF_IN 600DPI 125LPI T
- Base-load power generation facility capacity in 2012 (as of the end of the year) will
record a year-on-year rise of a mere 4.8%. The level of increase will be similar to that
of electricity demand (4.5% increase).
As such, strong measures on stabilizing supply and demand need to be continually
implemented in 2012 in order to stabilize electricity supply and demand.
- There is a need to continually move forward with reform into a cost principle-based
charge system. At the same time, there is a need to come up with a mid- to long-term
roadmap that would reduce the economic shock caused by the change in the charge
system and would allow electricity consumers, including the industrial sector, to
prepare for the change.
- There is a need to examine the matter of putting off the shutdown of power plants and
engaging in early construction of new power plants in order to secure more supply
capacity between now and 2015, when there is no spare electricity.
- If needed, current electricity supply/demand stabilization measures (reduce peak
demand, place a restriction on heating temperatures, etc.) should be improved and
continually executed.
- PR activities should be strengthened so that information is delivered to the general
public on how to use electricity efficiently and the importance of reducing energy
consumption.
There is a need to pay more caution to electricity supply/demand management when there
is a change in the season.
There is a possibility that difficulties will be experienced in electricity supply in the event
of a soar in electricity demand as a result of abnormal climate conditions when there is a
change in the season.
- The shortage of reserve power in the summer and winter is forecast to continue for the time
being. Repair of power plants needs to be carried out mainly in the spring and autumn.
- There is a possibility of power load temporarily rising in the event of simultaneous
occurrence of abnormal climate conditions and load shifting of industries when there is
a change in the season.
ChapterⅢ Energy Demand Outlook for 2012
147http://www.keei.re.kr
수요전망 내지13-4 문 2012.3.8 4:2 PM 페이지147 매일3 MAC2PDF_IN 600DPI 125LPI T

- In case of simultaneous occurrence of a drop in supply capacity and a rise in power
load, as such was the case on September 15, 2011, there is a possibility of imbalance
between supply and demand in the short term.
There is a need to improve Korea’s industrial structure into a low energy-consuming
structure.
Energy demand in the industrial sector rose 8.5% in 2010. It is forecast to go up 4.6% in
2011 and 4.1% in 2012, thus leading a rise in final energy consumption.
* Rate of increase in final energy demand: (’10) 6.5% → (’11) 3.1% → (’12) 2.9%
As a result, the share of final energy accounted for by consumption in the industrial
sector is expected to continually increase and reach 61% in 2012.
The rapid increase in demand in the industrial sector is attributable to continued rapid
growth of leading industries that consume a great amount of energy, including the steel
and petrochemical industries, as well as the fabricated metal industry that mainly uses
electricity, including semiconductors, machinery, and automobiles.
- In 2010, there was a substantial rise (12.9%) in electricity demand for industrial use as
a result of construction of large steel making facilities (total capacity of 19,000
thousand tons) that consume a great amount of electricity, including Blast Furnace #1
and #2 of Hyundai Steel40).
The level of contribution made by the industrial sector to a rise in final energy
consumption has been on an upward trend since 2009.
- In 2012, energy consumption in the industrial sector is expected to increase by 5.0
million TOE, accounting for 86.2% of final energy demand increase (5.8 million TOE).
The level of contribution of energy for industrial raw material use (naphtha, coking
coal) towards a rise in final energy demand is expected to reach 37.2%.
- In 2012, the level of contribution of the transport sector and residential/commercial and
public/other sector is forecast to be low at 5.0% and 8.8%, respectively.
148 KOREA ENERGY ECONOMICS INSTITUTE
KEEI Korea Energy Demand Outlook
40) This accounts for 8.8% of the total steel making facility capacity (216,667 thousand tons) recorded in 2010.
수요전망 내지13-4 문 2012.3.8 4:2 PM 페이지148 매일3 MAC2PDF_IN 600DPI 125LPI T
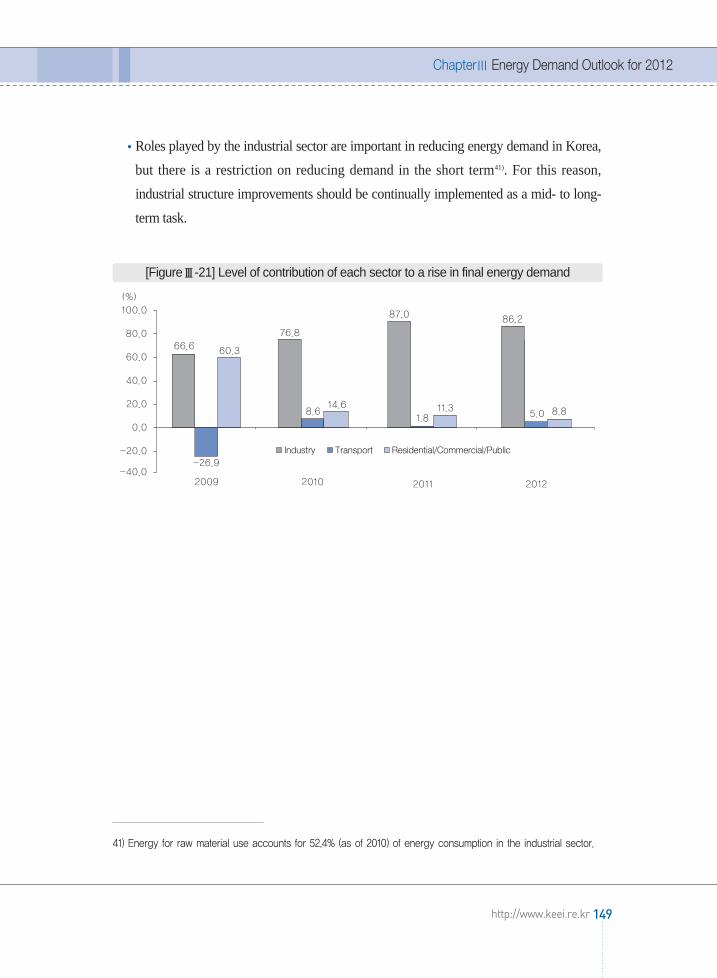
Roles played by the industrial sector are important in reducing energy demand in Korea,
but there is a restriction on reducing demand in the short term41). For this reason,
industrial structure improvements should be continually implemented as a mid- to long-
term task.
ChapterⅢ Energy Demand Outlook for 2012
149http://www.keei.re.kr
41) Energy for raw material use accounts for 52.4% (as of 2010) of energy consumption in the industrial sector.
[FigureⅢ-21] Level of contribution of each sector to a rise in final energy demand
수요전망 내지13-4 문 2012.3.8 4:2 PM 페이지149 매일3 MAC2PDF_IN 600DPI 125LPI T

Ministry of Strategy and Finance, Economic Outlook for 2012, December 12, 2011
Korea Institute for Industrial Economics & Trade, Economic and Industrial Outlook for 2012,
November 2011
Korea Institute for Industrial Economics & Trade, KIET Industry Trend Brief, December 2011
Samsung Economic Research Institute, Global Economy and Korean Economy Outlook for 2012,
SERI Economic Outlook, December 1, 2011
Korea Energy Economics Institute, Material published on http://www.kesis.net
LG Economic Research Institute, Domestic Economy Outlook for 2012, LG Business Insight,
December 21, 2011
Statistics Korea, Industrial Activity Trends (November 2011), December 2011
Statistics Korea, Korean Statistical Information Service (http://kosis.kr)
POSCO Research Institute, Outlook on Steel Supply and Demand, October 2011
POSCO Research Institute, Economic and Industrial Outlook and Issues in 2012, October 2011
Korea Development Institute, KDI Economic Outlook (Second half of 2011), November 2011
Korea City Gas Association, City Gas Business Manual, 2010
Korea City Gas Association, Monthly Report on City Gas Business Statistics for October 2011,
December 2011
Korea National Oil Corporation, Material published on http://www.petronet.co.kr
Korea Cement Association, Cement Statistical Yearbook for 2010, 2011
Korea Cement Association, http://www.cement.or.kr/
The Bank of Korea, Economic Outlook for 2012, December 9, 2011
The Bank of Korea, Economic Statistics System (http://www.ecos.bok.or.kr]
Korea Iron & Steel Association, Outlook on Steel Supply and Demand in 2012, November 2011
Korea Iron & Steel Association, http://www.kosa.or.kr
IEA, Oil Market Report, November 2011
EIA, Short-term Energy Outlook, December 2011
The Economist Intelligence Unit, World commodity forecasts: Industrial raw materials, January 2012
International Monetary Fund, www.imf.org
150 KOREA ENERGY ECONOMICS INSTITUTE
KEEI Korea Energy Demand Outlook
Reference
수요전망 내지13-4 문 2012.3.8 4:2 PM 페이지150 매일3 MAC2PDF_IN 600DPI 125LPI T

ChapterⅢ Energy Demand Outlook for 2012
151http://www.keei.re.kr
Appendix
(Basic unit)
CategoryCoal (1,000 tons) Oil
(1,000 bbl)LNG
(1,000 tons)Hydro(GWh)
Nuclear power(GWh)
New & renewable/Other
(1,000 TOE)Bituminous coal Anthracite
2000 1/4 15,486 14,065 1,421 203,178 5,136 1,202 27,047 4872/4 16,574 15,229 1,345 175,718 2,597 1,130 25,467 5323/4 16,899 15,417 1,481 171,102 2,337 2,072 28,630 5094/4 17,566 15,617 1,949 192,559 4,487 1,206 27,820 601
2001 1/4 15,389 13,710 1,679 200,942 5,977 733 28,164 5652/4 17,671 16,126 1,545 174,533 2,795 1,009 27,072 6113/4 18,562 16,960 1,602 171,503 2,468 1,655 28,856 5854/4 19,200 16,891 2,310 196,689 4,750 754 28,041 695
2002 1/4 17,917 16,103 1,815 204,409 5,733 768 29,229 6032/4 18,426 16,872 1,554 174,647 3,105 1,280 28,992 7033/4 18,862 17,177 1,684 176,594 3,085 2,306 30,686 7514/4 20,747 18,113 2,633 207,217 5,846 955 30,195 870
2003 1/4 19,662 17,350 2,312 206,380 6,337 961 32,617 7542/4 19,237 17,286 1,951 175,959 3,881 1,794 28,337 8003/4 19,449 17,652 1,798 172,665 2,896 2,950 34,470 7664/4 20,771 18,252 2,520 207,938 5,496 1,182 34,235 920
2004 1/4 20,430 18,284 2,145 200,603 7,896 776 30,052 9102/4 19,487 17,753 1,735 176,569 4,400 1,201 30,823 9923/4 20,446 18,540 1,907 176,204 3,504 2,864 35,539 9534/4 21,753 19,402 2,351 198,953 6,009 1,021 34,302 1,121
2005 1/4 20,110 17,942 2,167 202,297 8,263 711 35,507 9972/4 20,134 18,429 1,705 180,118 3,918 1,247 37,630 9663/4 22,121 19,891 2,230 177,345 3,795 2,101 36,472 9224/4 22,459 19,527 2,932 196,943 7,374 1,130 37,169 1,133
2006 1/4 21,775 19,204 2,571 199,351 8,750 576 35,666 1,0242/4 20,660 18,421 2,239 180,475 5,144 1,254 36,161 1,0553/4 22,590 20,240 2,350 179,653 4,048 2,574 39,302 1,0074/4 22,802 20,133 2,669 206,041 6,676 814 37,620 1,271
2007 1/4 22,557 20,007 2,549 207,910 8,592 685 35,948 1,1372/4 22,218 19,991 2,227 191,921 5,340 1,013 34,219 1,1913/4 24,211 22,272 1,939 188,207 4,603 2,383 36,736 1,1154/4 25,143 22,160 2,983 206,908 8,128 961 36,034 1,386
2008 1/4 25,016 22,266 2,750 204,812 10,007 945 39,913 1,1842/4 25,116 22,705 2,410 182,864 5,244 1,292 36,231 1,2373/4 27,201 25,009 2,192 182,908 4,651 2,413 37,519 1,1804/4 26,866 24,003 2,863 190,057 7,537 913 37,295 1,475
2009 1/4 24,950 22,378 2,572 199,077 8,538 829 36,626 1,3022/4 25,080 23,210 1,870 192,507 4,625 1,410 37,340 1,3293/4 29,182 26,592 2,590 183,649 4,556 2,527 37,216 1,2584/4 29,166 26,422 2,744 203,247 8,364 875 36,588 1,590
2010 1/4 30,662 28,122 2,540 198,769 10,997 1,226 36,024 1,497 2/4 27,898 25,434 2,463 193,459 6,706 1,558 36,473 1,520 3/4 30,278 28,014 2,264 191,754 5,682 2,326 37,549 1,510 4/4 30,484 27,647 2,836 210,296 9,699 1,362 38,550 1,538
2011 1/4 30,420 27,615 2,806 204,964 12,243 1,559 37,459 1,539 2/4 28,772 26,483 2,289 181,521 7,314 1,891 38,594 1,532 3/4 32,211 29,504 2,708 199,336 6,270 3,361 38,195 1,451
Primary energy consumption
수요전망 내지13-4 문 2012.3.8 4:2 PM 페이지151 매일3 MAC2PDF_IN 600DPI 125LPI T

152 KOREA ENERGY ECONOMICS INSTITUTE
KEEI Korea Energy Demand Outlook
(1,000 TOE)
CategoryCoal
Oil LNG Hydro Nuclear power
New & renewable/Other
TotalBituminous coal Anthracite
2000 1/4 9,979 9,283 696 27,397 6,677 301 6,762 488 51,6022/4 10,726 10,051 675 23,817 3,376 283 6,367 532 45,1003/4 10,915 10,176 740 23,098 3,038 518 7,157 509 45,2364/4 11,291 10,307 983 25,969 5,833 302 6,955 601 50,950
2001 1/4 9,902 9,049 854 27,102 7,770 183 7,041 565 52,5632/4 11,445 10,643 802 23,626 3,634 252 6,768 611 46,3363/4 12,037 11,193 844 23,114 3,209 414 7,214 585 46,5734/4 12,326 11,148 1,178 26,543 6,174 189 7,010 695 52,937
2002 1/4 11,593 10,628 965 27,483 7,453 192 7,307 603 54,6302/4 11,958 11,135 823 23,476 4,037 320 7,248 703 47,7403/4 12,232 11,337 895 23,585 4,010 577 7,672 751 48,8264/4 13,313 11,955 1,359 27,871 7,599 239 7,549 870 57,440
2003 1/4 12,683 11,451 1,232 27,730 8,238 240 8,154 754 57,8002/4 12,443 11,409 1,034 23,599 5,046 449 7,084 800 49,4213/4 12,618 11,650 968 23,063 3,765 738 8,618 766 49,5684/4 13,372 12,046 1,326 27,987 7,144 296 8,559 920 58,278
2004 1/4 13,198 12,068 1,131 26,891 10,264 194 7,513 911 58,9702/4 12,635 11,717 918 23,607 5,720 300 7,706 992 50,9603/4 13,263 12,236 1,027 23,470 4,555 716 8,885 953 51,8424/4 14,032 12,805 1,227 26,671 7,812 255 8,576 1,121 58,467
2005 1/4 12,984 11,841 1,142 27,660 10,742 178 8,877 940 61,3802/4 13,061 12,163 898 24,090 5,094 312 9,408 966 52,9303/4 14,334 13,128 1,206 23,510 4,933 525 9,118 922 53,3424/4 14,409 12,887 1,522 26,266 9,586 283 9,292 1,133 60,969
2006 1/4 14,024 12,674 1,350 26,602 11,375 144 8,917 1,024 62,0862/4 13,366 12,158 1,208 23,988 6,688 314 9,040 1,055 54,4513/4 14,621 13,358 1,263 23,733 5,263 644 9,825 1,007 55,0934/4 14,675 13,288 1,387 27,507 8,679 203 9,405 1,271 61,741
2007 1/4 14,248 12,820 1,428 27,724 11,169 147 7,729 1,137 62,1532/4 14,137 12,815 1,322 25,469 6,942 218 7,357 1,191 55,3133/4 15,399 14,249 1,149 24,825 5,984 512 7,898 1,115 55,7334/4 15,871 14,184 1,687 27,476 10,567 207 7,747 1,386 63,253
2008 1/4 15,787 14,269 1,518 27,082 13,009 203 8,581 1,200 65,8622/4 16,008 14,548 1,459 24,040 6,817 278 7,790 1,246 56,1783/4 17,284 15,979 1,306 23,925 6,047 519 8,067 1,191 57,0334/4 16,981 15,359 1,622 25,124 9,799 196 8,018 1,561 61,680
2009 1/4 15,750 14,239 1,512 26,304 11,099 178 7,875 1,302 62,5092/4 15,902 14,773 1,129 25,334 6,013 303 8,028 1,329 56,9093/4 18,521 16,932 1,589 23,955 5,923 543 8,002 1,258 58,2014/4 18,430 16,848 1,582 26,743 10,873 188 7,867 1,590 65,692
2010 1/4 19,549 18,024 1,525 26,155 14,296 264 7,745 1,497 69,505 2/4 17,803 16,263 1,540 25,379 8,717 335 7,842 1,520 61,595 3/4 19,240 17,833 1,407 25,101 7,387 500 8,073 1,510 61,811 4/4 19,305 17,634 1,670 27,666 12,608 293 8,288 1,538 69,697
2011 1/4 19,335 17,620 1,714 26,979 15,916 335 8,054 1,540 72,1592/4 18,383 16,939 1,444 23,756 9,508 407 8,298 1,532 61,8843/4 20,507 18,803 1,704 26,024 8,150 723 8,212 1,451 65,067
Primary energy consumption
수요전망 내지13-4 문 2012.3.8 4:2 PM 페이지152 매일3 MAC2PDF_IN 600DPI 125LPI T

ChapterⅢ Energy Demand Outlook for 2012
153http://www.keei.re.kr
(Basic unit)
CategoryCoal (1,000 tons) Oil
(1,000 bbl)Town gas(Million m3)
Electricity(GWh)
Thermal energy
(1,000 TOE)Bituminous coal Anthracite
2000 1/4 7,032 6,310 723 191,711 4,871 58,391 519 4872/4 7,485 6,844 641 165,308 2,406 57,911 157 5323/4 7,473 6,794 680 161,426 1,425 62,431 63 5094/4 8,380 7,077 1,303 180,265 3,261 60,802 380 601
2001 1/4 7,442 6,404 1,038 188,249 5,322 63,577 555 5652/4 7,888 7,006 882 163,746 2,561 62,426 142 6113/4 7,858 6,860 998 161,307 1,498 66,002 53 5854/4 8,344 6,816 1,529 184,906 3,277 65,727 400 695
2002 1/4 7,912 6,575 1,337 191,225 5,236 69,675 518 6032/4 8,071 7,110 961 164,659 2,681 67,328 153 7033/4 8,129 7,057 1,072 170,630 1,773 69,398 73 7514/4 9,139 7,380 1,759 195,790 4,184 72,048 479 870
2003 1/4 8,733 7,070 1,663 190,807 5,941 75,945 603 7462/4 8,384 7,221 1,163 168,569 2,948 71,066 171 7933/4 8,491 7,286 1,205 167,110 1,896 71,697 82 7594/4 9,170 7,331 1,840 196,171 3,948 74,892 445 912
2004 1/4 8,451 6,988 1,462 190,420 6,292 80,189 632 9002/4 8,203 7,146 1,058 169,876 3,167 75,335 186 9803/4 8,309 6,998 1,312 169,968 2,017 78,461 83 9394/4 9,285 7,335 1,950 189,016 3,943 78,112 442 1,110
2005 1/4 8,558 6,758 1,650 188,427 6,922 84,772 731 9792/4 7,980 6,924 1,056 173,629 3,432 80,103 193 9503/4 8,815 7,187 1,628 172,979 2,096 83,125 80 9084/4 9,413 7,068 2,346 190,479 4,513 84,413 526 1,116
2006 1/4 8,448 6,473 1,976 188,432 7,103 91,066 683 9652/4 8,560 6,944 1,615 175,351 3,532 83,789 206 1,0023/4 8,676 6,922 1,754 175,093 2,332 87,292 89 9564/4 9,588 7,460 2,128 195,723 4,536 86,573 448 1,169
2007 1/4 8,821 6,857 1,964 195,302 6,898 93,771 647 1,0542/4 8,789 7,169 1,620 184,712 3,762 88,608 209 1,1043/4 8,824 7,375 1,448 183,663 2,387 92,196 89 1,0534/4 10,052 7,543 2,509 199,909 4,956 94,031 493 1,280
2008 1/4 9,779 7,562 2,218 196,809 7,367 102,601 733 1,1112/4 9,770 7,870 1,899 179,538 3,631 92,177 197 1,1713/4 9,500 7,776 1,724 179,181 2,733 96,355 85 1,1164/4 10,399 7,984 2,415 185,412 5,003 93,938 498 1,350
2009 1/4 8,227 5,989 2,238 187,205 6,916 100,271 716 1,1542/4 8,218 6,664 1,554 186,082 3,591 93,994 203 1,1883/4 9,463 7,226 2,237 181,009 2,664 99,000 89 1,1344/4 10,019 7,632 2,387 197,938 5,274 101,209 542 1,391
2010 1/4 11,273 8,952 2,321 188,735 7,664 112,501 805 1,309 2/4 10,367 8,085 2,281 187,740 4,234 103,635 254 1,303 3/4 9,497 7,445 2,052 186,656 2,640 109,070 93 1,316 4/4 10,672 8,061 2,610 204,256 5,445 108,953 566 1,418
2011 1/4 10,647 7,981 2,667 194,672 8,141 121,410 835 1,368 2/4 10,679 8,519 2,159 178,078 4,466 108,953 244 1,368 3/4 10,727 8,176 2,552 195,697 3,030 112,542 110 1,307
Final energy consumption
New & renewable/Other
(1,000 TOE)
수요전망 내지13-4 문 2012.3.8 4:2 PM 페이지153 매일3 MAC2PDF_IN 600DPI 125LPI T
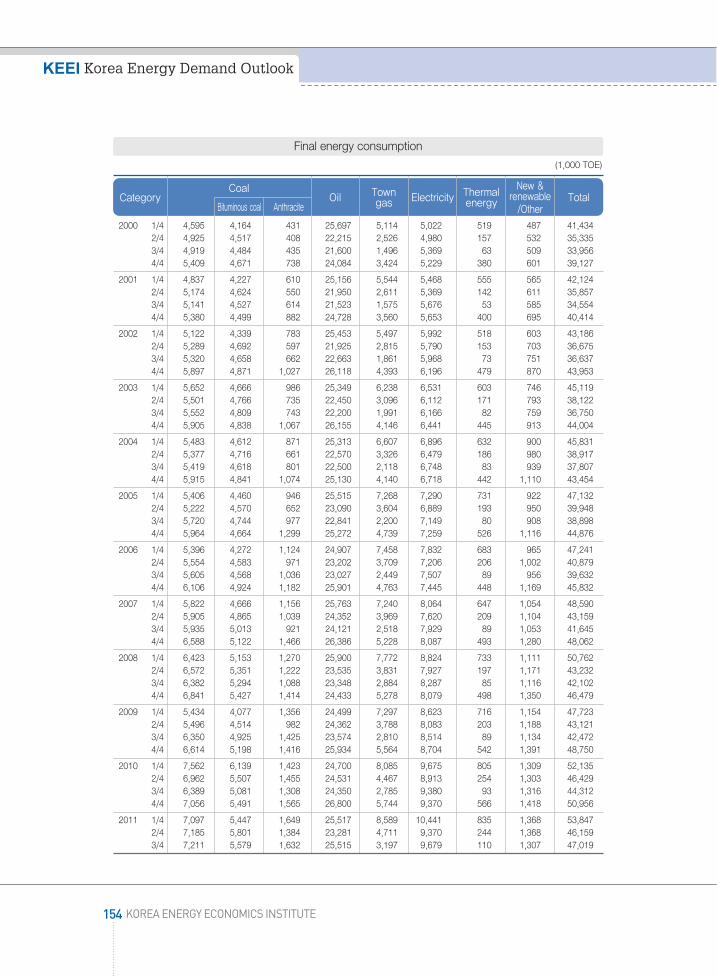
154 KOREA ENERGY ECONOMICS INSTITUTE
KEEI Korea Energy Demand Outlook
(1,000 TOE)
CategoryCoal
Oil Town gas Electricity Thermal
energy
New & renewable/Other
TotalBituminous coal Anthracite
2000 1/4 4,595 4,164 431 25,697 5,114 5,022 519 487 41,4342/4 4,925 4,517 408 22,215 2,526 4,980 157 532 35,3353/4 4,919 4,484 435 21,600 1,496 5,369 63 509 33,9564/4 5,409 4,671 738 24,084 3,424 5,229 380 601 39,127
2001 1/4 4,837 4,227 610 25,156 5,544 5,468 555 565 42,1242/4 5,174 4,624 550 21,950 2,611 5,369 142 611 35,8573/4 5,141 4,527 614 21,523 1,575 5,676 53 585 34,5544/4 5,380 4,499 882 24,728 3,560 5,653 400 695 40,414
2002 1/4 5,122 4,339 783 25,453 5,497 5,992 518 603 43,1862/4 5,289 4,692 597 21,925 2,815 5,790 153 703 36,6753/4 5,320 4,658 662 22,663 1,861 5,968 73 751 36,6374/4 5,897 4,871 1,027 26,118 4,393 6,196 479 870 43,953
2003 1/4 5,652 4,666 986 25,349 6,238 6,531 603 746 45,1192/4 5,501 4,766 735 22,450 3,096 6,112 171 793 38,1223/4 5,552 4,809 743 22,200 1,991 6,166 82 759 36,7504/4 5,905 4,838 1,067 26,155 4,146 6,441 445 913 44,004
2004 1/4 5,483 4,612 871 25,313 6,607 6,896 632 900 45,8312/4 5,377 4,716 661 22,570 3,326 6,479 186 980 38,9173/4 5,419 4,618 801 22,500 2,118 6,748 83 939 37,8074/4 5,915 4,841 1,074 25,130 4,140 6,718 442 1,110 43,454
2005 1/4 5,406 4,460 946 25,515 7,268 7,290 731 922 47,1322/4 5,222 4,570 652 23,090 3,604 6,889 193 950 39,9483/4 5,720 4,744 977 22,841 2,200 7,149 80 908 38,8984/4 5,964 4,664 1,299 25,272 4,739 7,259 526 1,116 44,876
2006 1/4 5,396 4,272 1,124 24,907 7,458 7,832 683 965 47,2412/4 5,554 4,583 971 23,202 3,709 7,206 206 1,002 40,8793/4 5,605 4,568 1,036 23,027 2,449 7,507 89 956 39,6324/4 6,106 4,924 1,182 25,901 4,763 7,445 448 1,169 45,832
2007 1/4 5,822 4,666 1,156 25,763 7,240 8,064 647 1,054 48,5902/4 5,905 4,865 1,039 24,352 3,969 7,620 209 1,104 43,1593/4 5,935 5,013 921 24,121 2,518 7,929 89 1,053 41,6454/4 6,588 5,122 1,466 26,386 5,228 8,087 493 1,280 48,062
2008 1/4 6,423 5,153 1,270 25,900 7,772 8,824 733 1,111 50,7622/4 6,572 5,351 1,222 23,535 3,831 7,927 197 1,171 43,2323/4 6,382 5,294 1,088 23,348 2,884 8,287 85 1,116 42,1024/4 6,841 5,427 1,414 24,433 5,278 8,079 498 1,350 46,479
2009 1/4 5,434 4,077 1,356 24,499 7,297 8,623 716 1,154 47,7232/4 5,496 4,514 982 24,362 3,788 8,083 203 1,188 43,1213/4 6,350 4,925 1,425 23,574 2,810 8,514 89 1,134 42,4724/4 6,614 5,198 1,416 25,934 5,564 8,704 542 1,391 48,750
2010 1/4 7,562 6,139 1,423 24,700 8,085 9,675 805 1,309 52,1352/4 6,962 5,507 1,455 24,531 4,467 8,913 254 1,303 46,4293/4 6,389 5,081 1,308 24,350 2,785 9,380 93 1,316 44,3124/4 7,056 5,491 1,565 26,800 5,744 9,370 566 1,418 50,956
2011 1/4 7,097 5,447 1,649 25,517 8,589 10,441 835 1,368 53,8472/4 7,185 5,801 1,384 23,281 4,711 9,370 244 1,368 46,1593/4 7,211 5,579 1,632 25,515 3,197 9,679 110 1,307 47,019
Final energy consumption
수요전망 내지13-4 문 2012.3.8 4:2 PM 페이지154 매일3 MAC2PDF_IN 600DPI 125LPI T
KKEEEEII Korea Energy Demand Outlook(Volume 13 No. 4)
Printed on January 2012
Issued on January 2012
CEO of publisher: Kim Jin-woo
Registration: No. 7 on December 7, 1992
Printed by: Beomshinsa (02)503-8737
ⓒ Korea Energy Economic Institute 2011
132 Naesonsunhwan-ro, Uiwang-si, Gyeonggi-do
Phone: (031)420-2114, Fax: (031)422-4958
Publisher: Korea Energy Economics Institute
수요전망 내지13-4 문 2012.3.8 4:2 PM 페이지155 매일3 MAC2PDF_IN 600DPI 125LPI T

수요전망 내지13-4 문 2012.3.8 4:2 PM 페이지156 매일3 MAC2PDF_IN 600DPI 125LPI T

KEEI
KEEI
KE
EI
Korea Energy Demand Outlook
ISSN 1599-9009
KoreaEnergy
Dem
andO
utlook December 2011
Decem
ber2011
Volume 13, No. 4QUARTERLY ENERGY OUTLOOK
Korea Energy Economic Institute132 Naesonsunhwan-ro, Uiwang-si, Gyeonggi-do
Phone: (031)420-2114
Fax: (031)422-4958
E-mail : [email protected]
Hompage : http://www.keei.re.kr
Korea
Energy
Econom
icInstitute
에너지수요전망 문13-4 2012.3.8 4:9 PM 페이지1 매일3 MAC2PDF_IN 600DPI 175LPI T


