
WS:ANZ_Active:47079786:v1
Intended for
Kwinana WTE Project Co
Kwinana Beach, Australia
Date
December 2018
KWINANA WASTE TO
ENERGY PROJECT
ARENA LIFE CYCLE
ASSESSMENT
Ramboll
1560 Broadway
Suite 1905
Denver, CO 80202
USA
T +1 303 382 5460
F +1 303 382 5499
www.ramboll.com
KWINANA WASTE TO ENERGY PROJECT
ARENA LIFE CYCLE ASSESSMENT
Project name Kwinana Waste to Energy Project
Project no. 1100021970-002
LCA Commissioner Kwinana WtE Project Co
Version 5
Date December 19, 2018
Prepared by Ramboll
LCA Practitioners Jim Mellentine, Ashley Kreuder

Ramboll - Kwinana Waste to Energy Project
1/33
CONTENTS
Executive Summary 3 1. Introduction 6 1.1 Kwinana Waste to Energy Plant 6 1.2 ARENA Life Cycle Assessment 6 2. Goal and Scope 8 2.1 Goal of Study 8 2.2 Scope of Study 8 2.2.1 System Boundary, Functional unit, reference flows, AND reference
system 8 2.2.2 Cutoff Criteria 9 2.2.3 Data Quality Criteria 9 2.2.4 Impact Categories 9 3. LCA Approach 11 3.1 Inventory of Inputs and Outputs (Life Cycle Inventory) 11 3.1.1 Kwinana Waste to Energy plant Electricity Production 11 3.1.2 Business as usual Reference system: Western Australia electricity
(black coal) production 15 3.2 Data sources and quality assessment 17 3.3 Emission factors and their sources, conversion factors (yields) 17 3.4 Documentation of assumptions and calculations (Life Cycle Impact
Assessment) 18 4. Summary of LCA Results 20 4.1 WtE Plant 20 4.2 BAU: Black Coal Electricity Production 22 4.3 Comparison to the Business as Usual Reference Scenario 23 4.3.1 Comparison to IFI Marginal Grid Electricity Factor 24 4.4 Sensitivity to Waste Collection Fuel Consumption 25 4.5 Alternative Scenario: WtE Bottom Ash Landfilled 26 5. Discussion and Interpretation 27 5.1 Study Limitations 27 6. Future Work 28 7. Critical Review 29

Ramboll - Kwinana Waste to Energy Project
2/33
TABLE OF TABLES Table 1: Life Cycle Impact Assessment Indicators and Characterization
Methods. 10 Table 2: WTE Plant Electricity Production Inputs and Outputs for 1 line
per hour and per year, assuming 8,000 hrs/yr of operation 12 Table 3: Waste as Fuel: Waste collection and transport to WtE facility,
per tonne waste. 13 Table 4: Expected Waste Composition 14 Table 5: WTE Plant Air Emissions Output for 1 kWh generated. 14 Table 6: Waste as Fuel: Avoided Landfill Impact Assumptions, per tonne
of waste. 14 Table 7: Western Australia Electricity (Black Coal) Production Inputs and
Outputs for 1 MWh generated. 15 Table 8: WtE Plant Data Sources and Quality Assessment 17 Table 9: Conversion Factors 18 Table 10: WtE Plant Impact Assessment Results 20 Table 11: BAU: Black Coal Electricity Production Impact Assessment
Results 22 Table 12: Reviewer’s Credentials 29
TABLE OF FIGURES Figure 1: Western Australia Electricity Generation by Fuel Type. 3 Figure 2: WtE Plant versus Western Australia Black Coal 4 Figure 3: WtE Plant Contribution Analysis 5 Figure 4: Example of GWP Characterization Factors 18 Figure 5: WtE Plant Contribution Analysis 21 Figure 6: Business as Usual Black Coal Plant Contribution Analysis 23 Figure 7: WtE Plant versus Western Australia Black Coal 24 Figure 8: Kwinana WtE annual GWP result compared the Australian
marginal grid electricity (IFI). 25 Figure 9: WtE LCA results for Low (1.4 liters/tonne), Baseline (5.75
liters/tonne), and High (10.1 liters/tonne) diesel consumption used for
waste collection prior to transport of the waste to the WtE facility. 25 Figure 10: WtE LCA results for the Baseline scenario and scenario where
Ash is disposed in a landfill 26
APPENDICES
Appendix 1 Critical Review Report and Response to Comments
Appendix 2 WRATE Tables

Ramboll - Kwinana Waste to Energy Project
3/33
EXECUTIVE SUMMARY
Kwinana WTE Project Co commissioned a Life Cycle Assessment (LCA) of their proposed Kwinana
Waste to Energy plant (WtE Plant) to meet funding requirements of the Australian Renewable
Energy Agency (ARENA). The WtE Plant will be located in Kwinana, Australia. It will have two
lines, each line estimated to generate 138,220 MWh of electricity annually from 25,000 kg per
hour of municipal solid waste. The Western Australian grid is primarily supplied by black coal and
gas, with a small portion of wind as illustrated in Figure 1.
Figure 1: Western Australia Electricity Generation by Fuel Type1.
The objective of the LCA study is to meet the requirements of ARENA, which are to show the
overall environmental impact profile, primarily for embodied fossil energy and GHG balance and
to provide a benchmark on fossil energy used, energy return on energy invested (EROEI), and
GHG performance.
Whilst the Western Australian market is supplied with a blend of fuel types, the functional unit of
the study is to compare the cradle to grave impacts of 1 MWh of electricity supplied to the
Western Australian grid from proposed WtE Plant electricity production versus electricity
production using black coal. The WtE Plant impacts include collection and transportation of the
municipal solid waste as well as the displacement of municipal solid waste to landfill per the
ARENA requirements.
The results of the Fossil Energy Abiotic Depletion Potential Fossil Fuels (ADPF) for 1 MWh of
electricity are as follows:
• WtE Plant: ADPF is 17.3 kg oil eq per 1 MWh of electricity produced. This is
approximately 723 MJ2 or 0.201 MWh per MWh of electricity or a EROEI of 4.98.
• BAU: Black Coal Electricity Production: ADPF is 244 kg oil eq per 1 MWh of electricity
produced. The 244 kg oil equates to approximately 10,2003 MJ or 2,800 MWh per MWh of
electricity or a EROEI of 3.57E-04.
1 Niklaus A, Dowling L; Renewables Influence on the Generation Mix and Gas Demand in Western Australia. AEMO Insights. May 2017. Obtained
from https://www.aemo.com.au/-/media/Files/Media_Centre/Insights/2017-05-24-Insights-Paper.pdf
2 Assumes a HHV of 41.8 MJ/kg heavy fuel oil from https://www.engineeringtoolbox.com/fuels-higher-calorific-values-d_169.html.
3 Assumes a HHV of 41.8 MJ/kg heavy fuel oil from https://www.engineeringtoolbox.com/fuels-higher-calorific-values-d_169.html.

Ramboll - Kwinana Waste to Energy Project
4/33
• This is more than ten times higher than the WtE Plant.
The results of the Global Warming Potential (GWP) for 1 MWh of electricity are as follows:
• WtE Plant: -860 kg CO2 equivalent, which is a net benefit.
• BAU: Black Coal Electricity Production: GWP is 993 kg CO2 equivalent.
The LCA results in Figure 2 indicate that the proposed WtE Plant electricity is also preferable to
the current Western Australian grid electricity for the impact categories of Particulate Matter
(PM), Acidification Potential (AP), and Photochemical ozone creation potential (PCOP) However,
the black coal electricity production is preferable for Consumptive Water Use (CWU), Land Use
Change (LUC), Ozone Depletion Potential (ODP), and Eutrophication Potential (EP).
Figure 2: WtE Plant versus Western Australia Black Coal
Figure 3 illustrates the main drivers of the WtE Plant impacts. The Avoided landfill impacts and
waste transport are the most significant impact for all categories. Without considering the
avoided impacts, the disposal of the boiler fly ash and APCr to landfill is the main contributor to
the CWU, LUC, ADPF and EP impacts. Waste Collection and Transport of municipal waste to the
facility is a significant contributor to ODP, PM, and ADPF. WtE air emissions are the next
significant impact to AP and GWP.
-100% -50% 0% 50% 100%
GWP (kg CO2 eq)
ADPF (kg oil eq)
PCOP (kg C2H4 eq)
EP (kg PO4--- eq)
AP (kg SO2 eq)
PM (kg intake)
PM (Deaths)
ODP (kg CFC-11 eq)
LUC (kg C deficit)
CWU (L H2O eq)
WtE Black Coal

Ramboll - Kwinana Waste to Energy Project
5/33
Figure 3: WtE Plant Contribution Analysis
From these results, Kwinana WTE Project Co may consider the following improvements to the
WtE Plant project going forward:
• Recycle or Upcycle Boiler Ash. The project is already planning to divert the bottom
ash for use as construction aggregate, while the remaining boiler ash and APCr will be
disposed in a landfill. This disposal has a significant impact on CWU and EP impacts.
Similarly finding an alternative use for the boiler ash and APCr will reduce these impacts.
The project is currently developing use of boiler ash as construction aggregate through
Carbon8 technology4.
• Improve Waste Collection and Transport. Waste collection has a significant impact
on PM, ODP, ADPF and other categories. As illustrated in the sensitivity analysis in
Section 4.4, optimizing truck routes, using fuel efficient vehicles or using alternative
fuel vehicles could significantly reduce these impacts.
• Improving WtE Plant Efficiency. Increasing the efficiency of the plant to require less
municipal waste per MWh of electricity would also reduce the waste collection impacts on
PM, ODP, and ADPF and the air emissions impacts on AP and GWP.
4 Carbon8 Aggregates. https://c8a.co.uk/
-100% -80% -60% -40% -20% 0% 20% 40% 60% 80%
GWP (kg CO2 eq)
ADPF (kg oil eq)
PCOP (kg C2H4 eq)
EP (kg PO4--- eq)
AP (kg SO2 eq)
PM (kg intake)
PM (Deaths)
ODP (kg CFC-11 eq)
LUC (kg C deficit)
CWU (L H2O eq)
WtE Air Emissions WtE Input Water and Treatment
Urea Activated Carbon
Quicklime Waste Collection & Transport
Natural Gas Boiler Ash & APCr Disposal to Landfill
Avoided Landfill Impacts Avoided Waste Transport

Ramboll - Kwinana Waste to Energy Project
6/33
1. INTRODUCTION
1.1 Kwinana Waste to Energy Plant
Kwinana WTE Project Co is applying for funding through the Australian Renewable Energy Agency
(ARENA) for the proposed Kwinana Waste to Energy plant (WtE Plant). Kwinana WTE Project Co
is a combination of the Phoenix Energy Power Plant company, Green Investment Bank, and the
Green Investment Group.
The WtE Plant is located in the Kwinana Industrial Area (KIA), which is zoned for heavy industry.
The KIA does not have a reticulated sewage system, so the WtE must reuse 100% of water
onsite.
The WtE Plant design recovers energy in the form of electricity using moving grate combustion
technology. The plant includes two (2) x 600 tonnes per day integrated moving grate fired
furnace/boiler (incineration) lines each with a Selective Non-Catalytic Reduction (SNCR) system
and a Semi-Dry air pollution control flue gas cleaning system. The lines have a common air
cooled condensing Steam Turbine Generator and are designed to have zero aqueous emissions.
The WtE Plant is designed to process up to 400,000 tonnes/year of Municipal Solid Waste (MSW),
Commercial & Industrial Waste (C&I) and pre-sorted Construction & Demolition Waste (C&D). To
do this, the WtE Plant must be able to treat waste for at least 8,000 hours continuously per year.
The proposed source of the MSW, C&I, and C&D is from the towns of Armadale, Gosnells,
Mandurah, Murray, Serp-Jarra, South Perth, Canning and the City of Kwinana, which are a
combined 290 km from the WtE facility.
1.2 ARENA Life Cycle Assessment
ARENA requires a Life Cycle Assessment (LCA) study be undertaken for all bioenergy and biofuel
projects. All projects must complete a proof of concept LCA by the first funding milestone and
projects rated at a TRL 8-9/CRI 2+ must also deliver a commercialization LCA as a final
milestone deliverable. LCA provides valuable insights into the environmental advantages and
risks associated with bioenergy technologies. ARENA uses the results of the proof of concept LCA
to determine if the proposed technologies have a favorable overall environmental impact profile,
primarily for embodied fossil energy and GHG balance. ARENA uses the results of the
commercialization LCA to obtain a benchmark on fossil energy used, energy return on energy
invested (EROEI), and GHG performance. In addition, ARENA uses LCA to understand the risks of
other environmental impacts and communicate project benefits.
The WtE plant is rated at Technology Readiness Level 9+, so Ramboll completed a
commercialization LCA according to ARENA5 requirements and the International Standards
Organization (ISO) standards ISO 14040 – Life cycle Assessment – Principles and framework and
ISO 14044 – Life cycle assessment – Requirements and guidelines (ISO series 14040/14044). As
outlined in the ISO series 14040/14044, an LCA consists of four phases:
5 Australian Renewable Energy Agency (ARENA). (2016, October). Life Cycle Assessment (LCA) of Bioenergy Products and Projects: Method and
guidance for undertaking life cycle assessment (LCA) of bioenergy products and project. Retrieved from
https://arena.gov.au/assets/2017/05/AU21285-ARENA-LCA-Guidelines-12-1.pdf
Ramboll - Kwinana Waste to Energy Project
7/33
1. Goal and scope definition: define the objectives and associated study framework and
boundaries;
2. Life cycle inventory (LCI): create an inventory of the mass and energy inputs and
outputs from processes associated with the product system processes (data collection
phase)
3. Life cycle impact assessment (LCIA): evaluation of the relative environmental
significance (e.g., global warming potential (GWP) associated with the inputs and
outputs; and,
4. Interpretation: summary of the conclusions in relation to the objectives of the study.

Ramboll - Kwinana Waste to Energy Project
8/33
2. GOAL AND SCOPE
In LCA, the goal and scope define the objectives and associated study framework and boundaries
of the study.
2.1 Goal of Study
The goal of this LCA is to meet the requirements of ARENA and provide verified environmental
performance data to investors.
The primary audience for the study will be ARENA and project investors. This study does not
support comparative assertions intended to be disclosed to the public.
2.2 Scope of Study
The scope of the study defines the system boundary and specific products to be studied, which
then determines data collection and analysis needs. In addition, the scope establishes which
impact categories will be evaluated, which allocation procedures will be applied, and what data
will be required.
2.2.1 SYSTEM BOUNDARY, FUNCTIONAL UNIT, REFERENCE FLOWS, AND REFERENCE SYSTEM
The objective of this study is to compare the cradle to grave impacts of the WtE Plant electricity
production to Western Australia electricity (black coal) production business as usual reference
system (BAU: Black Coal electricity production). The WtE Plant is located in Kwinana, Australia.
The plant will have two lines, where each line will generate 138,220 MWh of electricity annually
from 25,000 kg per hour of municipal solid waste.
Following the ARENA requirements, the system boundary was expanded to include the impacts
associated with the handling and processing of the municipal solid waste and the avoided impacts
associated with the landfill impacts (e.g., avoided methane emissions and carbon storage).
Recycling of ferrous metals and aluminum from the bottom ash were considered to be outside the
system boundary. Given this system expansion, the system boundary includes all relevant unit
processes and allocation assumptions and procedures are not relevant. The boundary includes
municipal solid waste collection and transport to the Kwinana facility, upstream extraction and
production of auxiliary material, fuel, and water inputs, combustion for electricity generation,
disposal of boiler ash and APCr in a landfill, and avoided impacts from the transport of waste (in
excess of the amount of transport to the Kwinana facility) and processing of the waste in a
landfill. Sensitivity analyses associated with the waste collection impacts and diversion of ash
from landfill are included in Sections 4.4 and 4.5.
The functional unit of the study is the production of 1 MWh of electricity supplied to the Western
Australian grid.
The MWh of electricity functional unit is represented by the input and output reference flows
described in more detail in Section 3.1.
The study excludes the embodied impacts of capital equipment and infrastructure, which meets
the following requirements from ARENA:
• The production systems estimated to have an economic life of 10 years or greater, and

Ramboll - Kwinana Waste to Energy Project
9/33
• The production systems do not require establishment of significant supporting physical
infrastructure.
Other material and energy flows were evaluated for their inclusion or exclusion according to the
cutoff criteria in Section 2.2.2.
2.2.2 CUTOFF CRITERIA
Cutoff criteria are used to determine the unit processes or product systems to be excluded from
the study. Exclusions are typically set by amount of material or energy flows, or the level of
environmental significance associated with unit processes.
The ARENA method requires that the cutoff criteria include:
• a cutoff for individual flows by at 1% and
• a cutoff for cumulative contribution of the excluded processes of less than 5%
The WtE Plant LCI is assumed to include at least 95% of processes by mass, 95% of processes
by energy, and 95% of GWP. The WtE Plant LCA accounted for all known inputs and outputs (i.e.,
no known inventory items were omitted due to the cut-off criteria). For BAU: Black Coal
electricity production, data was used as-is with no cut-off consideration.
2.2.3 DATA QUALITY CRITERIA
Data requirements provide guidelines for data quality in the life cycle assessment and are
important to ensure data quality is consistently tracked and measured throughout the analysis.
Data quality metrics include precision, completeness, and representativeness, as follows:
• Precision- describes the variability of the inventory data. This study applies primary
data for the WtE Plant mass and energy inputs and distribution tonne-kilometers and
associated modes. We apply secondary data from external databases for life cycle
inventory values associated with embodied emissions of upstream material production
and acquisition and distribution modes. See Table 8 for a description of databases used.
• Completeness- describes the usage of the available data in existence to describe the
scope of the LCA. We worked extensively with the WtE design team to obtain a
comprehensive set of data associated with the WtE Plant. See Section 3.1.1 for an
inventory of inputs and outputs.
• Representativeness- describes the ability of the data to reflect the system in question.
We measure representativeness with the time, technology, and geographic coverage of
the data. Time coverage describes the age of the inventory data and the period of time
over which data is collected. The WtE plant provided data for the Normal Operating Point
(NOP). We obtained secondary data for the production of input materials such as natural
gas from the Australian LCI (AusLCI) database6 and ecoinvent V3.47 database. These
datasets are from mostly from 2012 and are based on Australian or Global data, as
detailed in Section 3.2.
2.2.4 IMPACT CATEGORIES
Life cycle assessment uses environmental impact categories to relate the resource consumption
and emissions to air, water, and terrestrial environments. In this study, we use the life cycle
6 Australian Life Cycle Assessment Society (ALCAS). (2011). The Australian Life Cycle Inventory (AusLCI) Database. Retrieved from
http://www.auslci.com.au/index.php/Datasets
7 Ecoinvent. (2017, October 4). Fourth update of ecoinvent version 3 (ecoinvent V3.4). Database. https://www.ecoinvent.org/database/older-
versions/ecoinvent-34/ecoinvent-34.html

Ramboll - Kwinana Waste to Energy Project
10/33
assessment impact assessment (LCIA) indicators required by ARENA to assess the environmental
impacts of the WtE Plant, listed in Table 1. LCIA results are relative expressions and do not
predict actual impacts or actual damages, the exceeding of thresholds, safety margins, or risks.
Table 1: Life Cycle Impact Assessment Indicators and Characterization Methods.
LCIA Indicator LCIA Indicator Units Characterization Model
GWP100 (GWP) kg CO2 equivalents (kg CO2e) IPCC 5th Assessment Report model based on
100-year timeframe
Fossil energy (abiotic
depletion fossil fuels)
(ADPF)
kg oil equivalent (kg oil eq) All fossil energy carriers based on
relative scarcity (Goedkoop, et al., 2009)
Photochemical ozone
creation potential (PCOP)
kg of ethene equivalent (kg C2H4 eq) CML 2016
Eutrophication (EP) kg phosphate equivalent (kg PO4 eq) CML 2016
Acidification (AP) kg sulphur dioxide
equivalent (kg SO2 eq)
CML 2016
Particulate Matter (PM) particulate matter less
than 2.5 microns (kg intake or deaths)
Recommended factors from Pelton Workshop,
January 2016 published by UNEP/SETAC.
Ozone Depletion Potential
(ODP)
kg CFC 11 equivalent (kg CFC-11 eq) CML 2016
Land Use (LUC) kg soil organic matter
(SOM) (kg C/m2/a deficit)
ILCD
Consumptive Water Use
(CWU)
L H2O eq. global
average water scarcity (L H2O eq)
Method of Ridoutt & Pfster, (2010), with
Water stress indices of Pfster et al. (2009)

Ramboll - Kwinana Waste to Energy Project
11/33
3. LCA APPROACH
Ramboll conducted this study according to the standards established by the ISO series
14040/14044 as well as the requirements define by the Australian Renewable Energy Agency
(ARENA) for LCA of bioenergy products and projects. This section details the life cycle
assessment approach including:
1. Inventory of inputs and outputs (Life Cycle Inventory),
2. Data sources and quality assessment,
3. Emission factor and their sources, conversion factors (yields), and
4. Documentation of assumptions and calculations (Life Cycle Impact Assessment)
3.1 Inventory of Inputs and Outputs (Life Cycle Inventory)
This section describes the cradle-to-grave life cycle inventory (LCI) of the Kwinana WtE plant and
the BAU: Black Coal electricity production. Primary design data were collected from project
documentation. Waste collection and transport data were estimated based on the locations of the
waste sources and literature.
3.1.1 KWINANA WASTE TO ENERGY PLANT ELECTRICITY PRODUCTION
WtE plant engineers provided the process diagrams, water, energy, and mass balances for the
plant NOP. Ramboll used these NOP diagrams to model the LCI inputs and outputs per hour and
per year based on 8,000 operating hours per year. Table 2 details the inputs and outputs for
each line at the WtE, in units per hour and per year. The air emissions were calculated from the
Kwinana WtE - EPC Contract - Schedule 3, Section 2.78 and expected air emissions from typical modern WTE plants versus EU limits, 2010/75/EC.9 Table 3 summarizes the inputs, outputs and assumptions for the waste collection and transport to WtE facility, per tonne waste.
8 Ashurst. (2018, August 16). Kwinana WtE – EPC Contract – Schedule 3. Report. Section 2.7
9 National Environmental Research Institute (NERI). (2010). Emissions from Decentralised CHP Plants 2007-Energinet.DK Environmental Project
No. 07/1882. Project Report 5- Emission factors and emissions inventory for decentralized CHP production. Retrieved from
http://www.dmu.dk/pub/FR786.pdf.

Ramboll - Kwinana Waste to Energy Project
12/33
Table 4 summarizes the expected composition of the input waste. Table 5 summarizes the air emissions outputs and assumptions. Table 6 summarizes the inputs, outputs and assumptions for the avoided landfill impacts. In some cases, truck sizes for the various waste transport routes were provided by the client. When unknown, we assumed a waste collection truck on routes from the city to the transfer station and on routes from the city to the landfill where there is no transfer station. We assumed a large truck (40 tonne load) on routes from the transfer station to the landfill. Based on the expected inputs and outputs, the overall energy efficiency of the plant is calculated to be 24.6%.
Table 2: WTE Plant Electricity Production Inputs and Outputs for 1 line per hour and per year, assuming 8,000
hrs/yr of operation
Inputs
Qty per hour Qty per year Unit Reference/Comments
i1 Industrial Water 7,483.333 59,866,666.667 liters From water balance10
i2 Potable Water 291.667 2,333,333.333 liters From water balance10
i3 Ammonia/urea
40% solution
77.000 616,000.000 kg From PFD11
i4 Activated carbon 6.000 48,000.000 kg From PFD11
i5 Quick lime (86%
pure)
255.000 2,040,000.000 kg From PFD.11 Assume that 14% is inert limestone,
sand, and clay.
i6 Waste as fuel 25,000.000 200,000,000.000 kg From PFD11; see Table 3 for associated waste
collection and transport,
Table 4 for waste composition, and Table 6 for
avoided landfill impact assumptions
i7 Support fuel
(natural gas)
7.325 58,599.722 kg 276,440 MWh/year12; Composition per Kwinana WtE
- EPC Contract - Schedule 38 and calculated density
of natural gas from specific gravity relative to air.
Outputs
Qty per hour Qty per year Unit Reference/Comments
o1 Electricity 17,277.500 138,220,000.000 kWh Contractually required production in first year
o2 Water to septic 291.667 2,333,333.333 liters The remaining water balance leaves system through
evaporation or in slag and model assumes there are
no impacts
o3 Ferrous metal 340.000 2,720,000.000 kg Ferrous metal is recycled at end of life. From
Client.13
o4 Aluminum (non-
ferrous metal)
120.000 960,000.000 kg Aluminum is recycled at end of life. From Client.13
o5 Bottom ash, wet,
to reuse as
construction
aggregate
4,625.000 37,000,000.000 kg From Client.13
Outputs
10 Acciona. (2018, May 5). Kwinana Waste-to-Energy Project. Part B- EPC Proposal from Acciona- Technical. 20. Overall PFD & Water Balance
Diagram. Water Balance. MEB-005.
11 Acciona. (2018, May 5). Kwinana Waste-to-Energy Project. Part B- EPC Proposal from Acciona- Technical. 20. Overall PFD & Water Balance
Diagram. Overall Process Flow Diagram. MEB-001.
12 The O&M contractor guarantee the following: The Facility shall generate no less than [276,440] MWhrs of electricity [for export and sale] in
each Operational Year.
13 Fichtner. (2016, May). Technical Note No. 12. Kwinana Waste to Energy Project. Renewable Energy Components in the Waste as Basis for Large
Scale Generation Certificate.
Ramboll - Kwinana Waste to Energy Project
13/33
Qty per hour Qty per year Unit Reference/Comments
o6 Boiler fly ash to
landfill
150.000 1,200,000.000 kg From Client.13
o7 APCr to landfill 900.000 7,200,000.000 kg From Client.13
o8 Air emissions See Table 5.
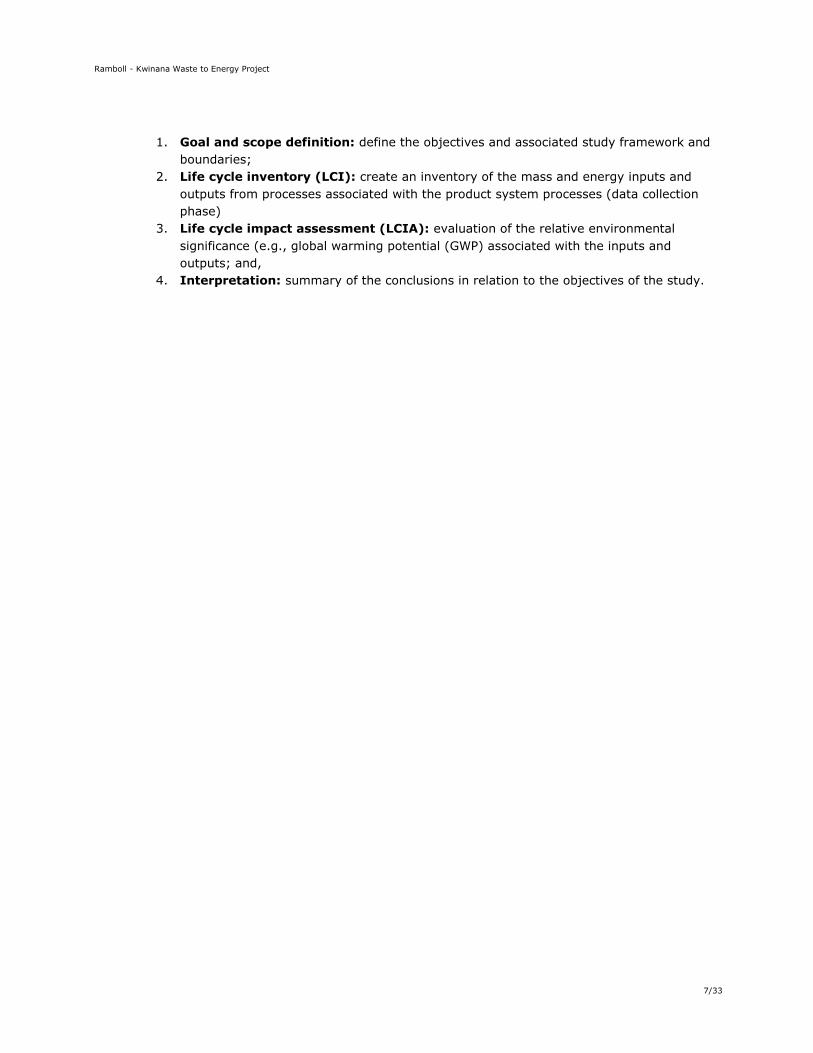
Table 3: Waste as Fuel: Waste collection and transport to WtE facility, per tonne waste.
i6 Waste as Fuel: Waste Collection and Transport
Quantity Reference/Comments
Waste Collection
5.75 liters diesel/ tonne
waste Average of high and low as documented by Larsen et al, 2009
14.
Waste Transport to WtE facility
34.876 km Weighted average distance based on known contributing
municipalities. Assumed same distance for both contracted and
noncontracted waste.
14 Larsen et al. Diesel consumption in waste collection and transport and its environmental significance. July 2009. Waste Management &
Research. Retrieved from
https://www.researchgate.net/publication/26258094_Diesel_consumption_in_waste_collection_and_transport_and_its_environmental_significan
ce

Ramboll - Kwinana Waste to Energy Project
14/33
Table 4: Expected Waste Composition
i6 Waste as Fuel: Waste Composition
% Reference/Comments
Water 36.49% Kwinana WtE - EPC Contract - Table 5
8
Ash 14.25% Kwinana WtE - EPC Contract - Table 58
C 27.18% Kwinana WtE - EPC Contract - Table 58
H 3.72% Kwinana WtE - EPC Contract - Table 5
8
O 17.26% Kwinana WtE - EPC Contract - Table 5
8
N 0.69% Kwinana WtE - EPC Contract - Table 5
8
S 0.10% Kwinana WtE - EPC Contract - Table 58
Cl 0.31% Kwinana WtE - EPC Contract - Table 5
8
Table 5: WTE Plant Air Emissions Output for 1 kWh generated.
o8 Air Emissions
g per kWh Reference/Comments
SO2 0.035 Expected air emissions from typical modern WTE plants versus EU limits, 2010/75/EC
9
NOx 0.320 Expected air emissions from typical modern WTE plants versus EU limits, 2010/75/EC9
UHC 0.002 Expected air emissions from typical modern WTE plants versus EU limits, 2010/75/EC
9
NMVOC 0.002 Expected air emissions from typical modern WTE plants versus EU limits, 2010/75/EC
9
CH4
-0.002 Expected air emissions from typical modern WTE plants versus EU limits, 2010/75/EC9; Subtracted
ambient CH4 concentration from NOAA,15
which is oxidized in the system.
CO
0.019 Expected air emissions from typical modern WTE plants versus EU limits, 2010/75/EC9; Increased by
35% to represent 20% of the limit value.
N2O 0.005 Expected air emissions from typical modern WTE plants versus EU limits, 2010/75/EC
9
CO2
(fossil)
415.336 Kwinana WtE - EPC Contract - Schedule 3, Table 58; Assume that waste has a biobased proportion of
71.2%.
CO2
(biogenic)
1,026.802 Kwinana WtE - EPC Contract - Schedule 3, Section 2.4, Table 58; Assume that waste has a biobased
content of 71.2%.
Table 6: Waste as Fuel: Avoided Landfill Impact Assumptions, per tonne of waste.
i6 Waste as Fuel: Avoided Landfill
Quantity Reference/Comments
Waste Collection
5.75 liters diesel/
tonne waste
Average of high and low as documented by Larsen et al, 200916
.
Waste Transport to transfer station
or landfill
20.269 km Weighted average distance to nearest transfer station or landfill from city
centers based on known contributing municipalities
15 Dlugokencky, Ed (2018). National Oceanic & Atmospheric Administration (NOAA)/Earth System Research Laboratory (ESRL). Retrieved from
www.esrl.noaa.gov/gmd/ccgg/trends_ch4/.
16 Larsen et al. Diesel consumption in waste collection and transport and its environmental significance. July 2009. Waste Management &
Research. Retrieved from
https://www.researchgate.net/publication/26258094_Diesel_consumption_in_waste_collection_and_transport_and_its_environmental_significan
ce

Ramboll - Kwinana Waste to Energy Project
15/33
i6 Waste as Fuel: Avoided Landfill
Waste Transport to landfill from
transfer station (small 3.5-16t
truck)
25.24 km Weighted average distance from transfer station to landfill via small 3.5-
16 tonne truck.
Waste Transport to landfill from
transfer station (40t truck)
43.136 km Weighted average distance from transfer station to landfill via 40 tonne
truck.
Landfill operations (Australian
average)
1 tonne Average Australian landfill operations from AusLCI database. Assumes
46.2% methane capture rate.
3.1.2 BUSINESS AS USUAL REFERENCE SYSTEM: WESTERN AUSTRALIA ELECTRICITY (BLACK
COAL) PRODUCTION
The ARENA method requires that the bioenergy system is compared to a business as usual
reference system, which represents a scenario where the specific bioenergy under study is not
produced. For Western Australia, this is the electricity (black coal) WA reference fuel. Ramboll
collected the data from the AusLCI database17. Table 7 details the inputs and outputs for 1 MWh
of energy generated by Western Australia Electricity (Black Coal) Production.
Table 7: Western Australia Electricity (Black Coal) Production Inputs and Outputs for 1 MWh generated.
Inputs
Qty per MWh Unit Reference/Comments
Tap Water 2,230 liters AusLCI17
Rail transport 26.877 tkm AusLCI17
Truck transport 0.856375 tkm AusLCI17
Black coal 520 kg AusLCI17
Outputs
Qty per MWh Unit Reference/Comments
Electricity 1 MWh AusLCI17
Water to septic 1,190 liters AusLCI17
Coal ash to landfill 28.6 kg AusLCI17
Bottom ash 3.17 kg AusLCI17
Emissions to Air
CO2 976 kg AusLCI17
CH4 9.37 g AusLCI17
N2O 8.33 g AusLCI17
CO 115 g AusLCI17
NOx 0.00416 g AusLCI17
NMVOC 17.7 g AusLCI17
SOx 0.00385 g AusLCI17
NH3 0.291 g AusLCI17
17 Australian Life Cycle Assessment Society (ALCAS). (2011). The Australian Life Cycle Inventory (AusLCI) Database. Retrieved from
http://www.auslci.com.au/index.php/Datasets

Ramboll - Kwinana Waste to Energy Project
16/33
As 0.0183 g AusLCI17
Be 0.0118 g AusLCI17
B 1.13 g AusLCI17
Cd 0.0150 g AusLCI17
Cr 0.0497 g AusLCI17
Cr VI 0.00259 g AusLCI17
Co 0.0443 g AusLCI17
Cu 0.0598 g AusLCI17
C9H12 0.00187 g AusLCI17
F 38.2 g AusLCI17
HCl 212.2 g AusLCI17
Pb 0.0712 g AusLCI17
Mn 0.131 g AusLCI17
Hg 0.0276 g AusLCI17
Ni 0.0837 g AusLCI17
PM10 188 g AusLCI17
PM2.5 75.1 g AusLCI17
Polychlorinated dioxins and furans 3.15E-07 g AusLCI17
PAH 0.00575 g AusLCI17
Zn 0.124 g AusLCI17
Emissions to Water
As 2.81006E-04 g AusLCI17
Cd 2.81006E-04 g AusLCI17
Cr 4.8895E-04 g AusLCI17
Co 4.906361E-03 g AusLCI17
Cu 1.2645261E-02 g AusLCI17
Pb 2.81006E-04 g AusLCI17
Mn 8.430174E-03 g AusLCI17
Hg 3.37E-05 g AusLCI17
Ni 8.430174E-03 g AusLCI17
Zn 1.1914646E-02 g AusLCI17
Emissions to soil
As 5.874325E-02 g AusLCI17
Cd 7.0266462E-02 g AusLCI17
Cr 8.1683419E-02 g AusLCI17
Co 7.46349592E-01 g AusLCI17
Ramboll - Kwinana Waste to Energy Project
17/33
Cu 4.23244769E-01 g AusLCI17
Pb 2.14810056E-01 g AusLCI17
Mn 6.589723431 g AusLCI17
Hg 9.89826E-04 g AusLCI17
Ni 2.741194296 g AusLCI17
Zn 4.184491073 g AusLCI17
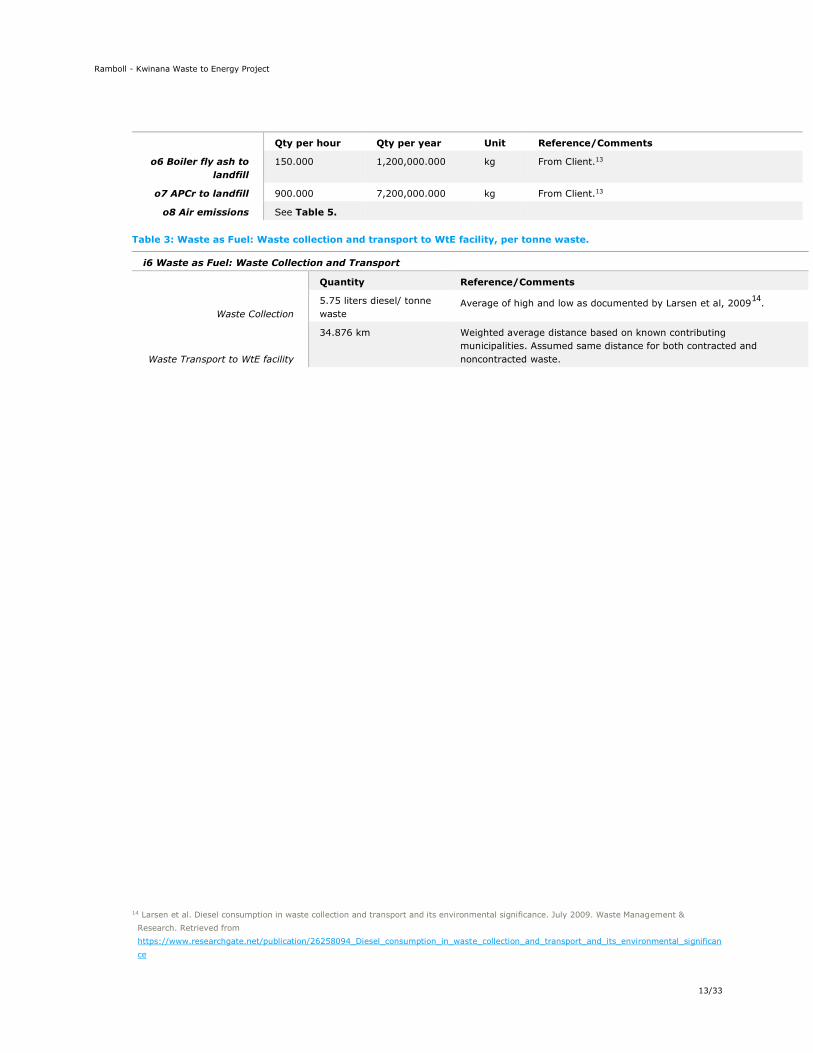
3.2 Data sources and quality assessment
Ramboll selected the LCI data described previously according to the data quality criteria in
Section 2.2.3 for the WtE Plant. For the reference scenario, ARENA requires the use of the
electricity (black coal) WA reference fuel from the AusLCI database. Table 8 lists the WtE Plant
data sources, references and the associated data quality by precision, completeness and
representativeness.
Table 8: WtE Plant Data Sources and Quality Assessment
Data Type Data
Source(s)
Precision Completeness Representativeness (Time,
Technology, Geography)
Primary data Kwinana WtE
Project Co and
WtE plant
design team
Primary
Data
Relevant data is included as
much as possible from the water,
mass, and energy balances.
Projected NOP for current WtE
technology located in Kwinana,
Australia
Australian
secondary life
cycle data
AusLCI U Secondary
Data
Datasets include all relevant
flows for unit processes (U) and
apply no cutoff criteria18
2012 average technology for
Western Australia or Australia.
Other
secondary life
cycle data
ecoinvent V3.4
Cut-off U
Secondary
Data
Datasets include all relevant
flows for unit processes (U) and
the primary production of
materials is always allocated to
the primary user of the material
(cut-off)
2005-2012 average technology for
global, rest of world, or swiss
datasets. Swiss datasets are
mostly used for waste treatment.
Where available primary data from Kwinana WtE Project Co and the WtE plant design team was
used. Data gaps were filled using assumptions and secondary data from AusLCI and ecoinvent
V3.4 as detailed in Table 2-Table 6 following the cutoff criteria in Section 2.2.2.
3.3 Emission factors and their sources, conversion factors (yields)
In life cycle assessment, emission factors (i.e., characterization factors) and conversion factors
are used to quantify life cycle environmental impacts of a product or service. Ramboll used the
emission factors from the environmental impact categories required by ARENA to assess the
environmental impacts of the WtE Plant, listed in Table 1. For example, ARENA requires the
GWP100 method from the IPCC 5th Assessment Report model based on a 100-year timeframe.
The GWP100 method is used to determine the climate change impacts from GHG inventory
substances in the LCI. To do this, the GWP100 applies a GWP characterization factor to the LCI to
determine the kg of CO2e equivalence. Figure 4 provides an example that includes the GHG
inventory substances for CO2, CH4, and SF6 and their associated GWP characterization factors.
18 Australian Life Cycle Assessment Society (ALCAS). (2014, March 6). Requirements for the development of AusLCI Data sets. Retrieved from
http://www.auslci.com.au/Documents/AUSLCI_Requirements_30.pdf

Ramboll - Kwinana Waste to Energy Project
18/33
Figure 4: Example of GWP Characterization Factors
Ramboll used conversion factors in the LCA to convert energy, mass, and distances into different
units. Table 9 lists the conversion factor values, units and their references.
Table 9: Conversion Factors
Conversion Factor Value Units Reference/Comments
NOP Municipal Waste
Energy Content Lower
Heating Value (LHV)
10.1 MJ/kg Ashurst. (2018, August 16). Kwinana WtE – EPC Contract –
Schedule 3. Report. Section 3.3. Page 42
Efficiency of furnace +
boiler
0.882 Acciona. (2018, May 5). Kwinana Waste-to-Energy Project. Part
B- EPC Proposal from Acciona- Technical. 20. Overall PFD &
Water Balance Diagram. Overall Process Flow Diagram. MEB-001.
Energy conversion from
megajoules (MJ) to kilowatt-
hours (kWh)
3.6 MJ/kWh
Density of air at 20 deg C 1.204084759 kg/m3 Converted from 101325 N/m2, 287.058 J/(kg·K), and 293.15K
per 20 deg C
Density of natural gas at 20
deg C
0.728471279 kg/m3 Calculated from specific gravity and density of air at 20 deg C
Higher Heating Value (HHV)
natural gas
37.1 MJ/m3 Ashurst. (2018, August 16). Kwinana WtE – EPC Contract –
Schedule 3. Report. Section 2.7.
Density of diesel 832.5 kg/m3 https://www.engineeringtoolbox.com/fuels-densities-specific-
volumes-d_166.html
Ambient CH4 concentration,
which is oxidized in the
system
1.86 ppm https://www.esrl.noaa.gov/gmd/ccgg/trends_ch4/#global
1.77105478 mg/Nm3 ppm x CH4 g/mol / 24.46 L (standard molar volume of ideal gas
at 25C)
Conversion from mg/Nm3 to
g/GJ
1.9 (mg/Nm3)/
(g/GJ)
Methane sink 1.040581831 g/GJ Calculated from Ambient CH4 concentration and (mg/Nm3)/(g/GJ)
conversion factor
3.4 Documentation of assumptions and calculations (Life Cycle Impact
Assessment)
Ramboll used the SimaPro 8.5 LCA Software to generate the LCA results. First, the LCA model
was created for the WtE Plant and Reference Scenarios. The model was built with the LCI from
Section 3.1 and the data sources from Section 3.2. Then the LCIA characterization factors from
Ramboll - Kwinana Waste to Energy Project
19/33
Table 1 were combined in SimaPro to generate results. Finally, the LCIA results were exported to
Excel to finalize the results and conduct the sensitivity analysis. Minimal manipulation of the
results was required in Excel, but to finalize the results, Ramboll completed the following:
• Multiplied Water Scarcity impacts in cubic meters by 1000 to convert to liters
• Removed credits for aluminum and ferrous metals recycling
• Calculated the avoided landfill credits from the landfill LCIA results multiplied by the
tonnes waste per MWh conversion factor of 1.44697.
Ramboll conducted sensitivity analysis on the following assumptions of the LCA:
• Fuel consumption amount used in waste collection. We reference a study that shows a
range of 1.4 to 10.1 liters of diesel used to collect waste. We assumed an average of
5.75 liters in our baseline model. Section 4.4 shows how sensitive the results are to
this assumption.
• Ash from the combustion of waste is assumed to be reused as construction aggregate.
As an alternative scenario that is relevant, we also considered the impacts for landfilling
the ash. Section 4.5 shows how landfilling the Ash would impact the results.

Ramboll - Kwinana Waste to Energy Project
20/33
4. SUMMARY OF LCA RESULTS
This section summarizes the life cycle assessment results of the WtE Plant and the BAU: Black
Coal Electricity Production. Results include the assessment of key contributing factors,
comparison to the reference scenario, and sensitivity analysis to identify specific process stages
and substances that drive the results.
4.1 WtE Plant
The WtE Plant was evaluated for its cradle-to-grave life cycle impacts for ten impact categories.
Table 10 lists the WtE impact results for each impact category for 1 MWh of electricity produced.
Table 10: WtE Plant Impact Assessment Results
Impact
Category Total
WtE Air
Emissions
WtE Input
Water and
Treatment
Urea Activated
Carbon Quicklime
Waste
Collection
&
Transport
Natural
Gas
Ash
Disposal
to Landfill
Avoided
Landfill
Impacts
Avoided
Waste
Transport
GWP (kg
CO2 eq)
-8.60+02 4.17E+02 1.27E-02 5.49E+00 1.18E+00 1.53E+01 2.85E+01 8.90E-02 2.33E+01 -1.30E+03 -4.89E+01
ADPF (kg oil
eq)
1.94E-01 0.00E+00 2.86E-03 2.23E+00 2.91E-01 1.69E+00 9.41E+00 5.00E-01 3.15E+00 -1.87E+00 -1.52E+01
PCOP (kg
C2H4 eq)
-2.93E-01 2.19E-03 2.42E-06 1.07E-03 3.20E-04 2.49E-03 5.22E-03 6.70E-06 1.54E-03 -2.96E-01 -9.18E-03
EP (kg PO4-
-- eq)
3.49E-01 4.30E-02 2.13E-05 4.55E-03 1.58E-03 3.22E-03 2.62E-02 1.28E-05 5.29E-01 -2.14E-01 -4.51E-02
AP (kg SO2
eq)
-5.98E-01 2.03E-01 5.45E-05 2.74E-02 6.90E-03 1.93E-02 1.30E-01 4.89E-05 6.00E-02 -8.35E-01 -2.09E-01
PM (kg
intake)
-5.03E-07 0.00E+00 1.30E-10 9.55E-08 1.01E-08 1.88E-08 5.07E-07 3.81E-12 4.76E-08 -4.64E-07 -7.18E-07
PM (Deaths) -3.42E-06 0.00E+00 4.80E-10 6.09E-07 5.92E-08 8.77E-08 3.34E-06 2.52E-11 2.85E-07 -3.08E-06 -4.73E-06
ODP (kg
CFC-11 eq)
-3.69E-07 0.00E+00 3.09E-09 7.98E-07 2.74E-08 8.75E-07 5.08E-06 2.15E-11 2.05E-07 -6.11E-07 -6.74E-06
LUC (kg C
deficit)
-7.43E+01 0.00E+00 3.54E-03 1.20E-01 2.41E-01 1.51E+00 1.07E-01 -1.28E-05 4.61E+00 2.85E-02 -8.09E+01
CWU (L H2O
eq)
8.50E+01 0.00E+00 2.28E+02 1.85E+02 1.00E+00 5.88E+00 4.01E+01 1.18E-01 9.49E+02 -3.13E+02 -1.01E+03
The goal of this LCA is to meet the requirements of ARENA, which are to show the overall
environmental impact profile, primarily for embodied fossil energy and GHG balance and to
provide a benchmark on fossil energy used, energy return on energy invested (EROEI), and GHG
performance. The results of the ADPF or fossil fuel energy used and GWP for 1 MWh of electricity
from the WtE Plant are as follows:
• ADPF of the WtE Plant without considering avoided landfill and waste collection is 17.3 kg
oil eq per 1 MWh of electricity produced. This is approximately 723 MJ19 or 0.201 MWh
per MWh of electricity or a EROEI of 4.98.
• GWP of the WtE Plant is -860 kg CO2 equivalent, which is a net benefit. Assuming
276,440 MWh annual production, the annual benefit is approximately 238,000 tonnes
CO2e avoided.
19 Assumes a HHV of 41.8 MJ/kg heavy fuel oil from https://www.engineeringtoolbox.com/fuels-higher-calorific-values-d_169.html.

Ramboll - Kwinana Waste to Energy Project
21/33
Figure 5 illustrates the key components of the life cycle of the WtE Plant that are contributing to
the 10 life cycle impact categories: inputs waste collection and transport, urea, and quicklime
and outputs from air emissions and ash disposal. The inputs from municipal waste are driving the
impacts from avoiding disposal in the landfill, but they also contribute to ODP, PM, and ADPF
from the waste collection and transport of municipal waste to the facility. Urea contributes to the
CWU, ODP, PM, and ADPF impacts. Quicklime contributes to LUC, ODP, and ADPF impacts. The
disposal of the boiler ash and APCr to landfill is the main contributor to the CWU, LUC, and EP
impacts.
Figure 5: WtE Plant Contribution Analysis
The CWU impacts for the WtE plant are driven by the avoided landfill and waste transport, which
displace almost double the water impacts. The landfill requires a large amount of electricity generation from the grid, which relies on a large amount of water consumption. The waste transport requires a large amount of electricity from the grid to build and maintain the roads and the maintain truck and on diesel fuel. The electricity grid relies on a large amount of water consumption. Diesel fuel uses a lot of water at the refinery and crude oil extraction.
Without the avoided landfill and waste transport displacement, the ash to landfill is the main
driver, which is 67% of the water impacts. WtE Input Water and Treatment accounts for 16% of the water impacts and Urea accounts for 13% of the impacts.
Whereas the Coal Plant uses more water in the plant and at the coal mine, equal to 88% of the coal plants water impacts. Coal Transport is 4% and Sewage treatment is 6% of the impacts. The coal plant generates less waste coal ash (1% of the water impacts) The Coal plant disposes of less waste: 0.007 kg of coal ash whereas the WtE plant disposes of 0.16 kg of bottom ash. This is 1% vs 41% of the water impacts.
Without the avoided landfill and waste transport, the WtE plant has 26% higher water consumption.
-100% -80% -60% -40% -20% 0% 20% 40% 60% 80%
GWP (kg CO2 eq)
ADPF (kg oil eq)
PCOP (kg C2H4 eq)
EP (kg PO4--- eq)
AP (kg SO2 eq)
PM (kg intake)
PM (Deaths)
ODP (kg CFC-11 eq)
LUC (kg C deficit)
CWU (L H2O eq)
WtE Air Emissions WtE Input Water and Treatment
Urea Activated Carbon
Quicklime Waste Collection & Transport
Natural Gas Boiler Ash & APCr Disposal to Landfill
Avoided Landfill Impacts Avoided Waste Transport

Ramboll - Kwinana Waste to Energy Project
22/33
The LUC impacts for the WtE plant are driven by the avoided waste transport. The avoided waste
transport’s land use impacts are from the diesel fuel and road construction. The diesel fuel land
use is from the extraction and refining of crude oil.
Without the avoided waste transport displacement, the ash disposal to landfill and quicklime are
the main drivers which account for 70% and 23% of the land use impacts, respectively. Ash
disposal to landfill impacts are driven by land use from the landfill. Quicklime land use impacts
are driven by limestone production and paper production for packaging.
Whereas the Coal Plant’s LUC impacts come from the coal transport (61%), ash disposal (24%),
and water (27%). Coal transport is driven by the land use required by the rail transport. Ash
disposal is driven by the land use from diesel fuel and road construction. And water is driven by
the land use required for wood used for charcoal in the water treatment plant.
Without the avoided landfill and waste transport, the WtE plant’s LUC is 109% higher than the
Coal plant.
4.2 BAU: Black Coal Electricity Production
The BAU: Black Coal Electricity Production was evaluated for the same ten impact categories to
show the current system impacts that the WtE Plant is proposed to displace. Table 11 lists the
black coal impact results for each category for 1 MWh of electricity produced.
Table 11: BAU: Black Coal Electricity Production Impact Assessment Results
Impact Category Result Impact Category Result
GWP (kg CO2 eq) 993 PM (kg intake) 3.01E-06
ADPF (kg oil eq) 244 PM (Deaths) 2.00E-05
PCOP (kg C2H4 eq) 5.38E-03 ODP (kg CFC-11 eq) 1.03E-06
EP (kg PO4--- eq) 0.591 LUC (kg C deficit) 3.15
AP (kg SO2 eq) 2.15 CWU (L H2O eq) 1,120
To meet the goal of the study and the ARENA LCA requirements, the BAU: Black Coal Electricity
Production is also evaluated for ADPF or fossil fuel energy used and GWP for 1 MWh of electricity
generated. The results are as follows:
• ADPF of the BAU: Black Coal Electricity Production is 244 kg oil eq per 1 MWh of
electricity produced. This is over ten times higher than the WtE Plant (without the
avoided landfill and waste transport impacts). The 244 kg oil equates to approximately
10,20020 MJ or 2,800 MWh per MWh of electricity or a EROEI of 3.57E-4.
• GWP of the WtE Plant is -860 kg CO2 equivalent, which is approximately 187% less than
the black coal plant.
Figure 6 illustrates the key components of the life cycle of the black coal plant that are
contributing to the 10 life cycle impact categories: black coal extraction, transport, combustion,
ash disposal, water, and sewage treatment. The combustion emissions are driving the impacts to
PM, AP, EP, PCOP, and GWP. Coal transport is the main contributor to LUC, while coal extraction
is the primary contributor to ODP and ADPF, and secondarily to PCOP. Water use at the plant is
the main contributor to CWU.
20 Assumes a HHV of 41.8 MJ/kg heavy fuel oil from https://www.engineeringtoolbox.com/fuels-higher-calorific-values-d_169.html.

Ramboll - Kwinana Waste to Energy Project
23/33
Figure 6: Business as Usual Black Coal Plant Contribution Analysis
4.3 Comparison to the Business as Usual Reference Scenario
The ARENA method requires that the bioenergy system is compared to a business as usual
reference system, which represents a scenario where the specific bioenergy under study is not
produced. For Western Australia, this is the electricity (black coal) WA reference fuel. The life
cycle impacts of electricity production vary from WtE and Black Coal as follows:
• Fuel extraction/collection & transportation: Black coal is extracted through coal
mining, which has significant impacts on ODP, PCOP, and ADPF. Coal mining is assumed
to have a 30-year lifetime, so there are some LUC benefits assumed for the coal mine to
be rehabilitated into shrub land. The coal is then transported to the coal power plant via
rail, which contributes mostly to LUC. The waste input to the WtE Plant is collected from
residential, industrial, and commercial facilities, so it offsets the impacts of transporting
the waste to landfill and treating the waste at the landfill. This provides a significant
benefit to all impact categories. The waste is then transported to the WtE Plant by truck,
which impacts ODP, PM, and ADPF (from diesel fuel).
• Electricity Production: The coal plant’s main impacts for electricity production are from
combustion and water input and treatment impacts. Coal combustion contributes to the
impacts of PM, AP, EP, PCOP, and GWP. Water input and treatment contributes mainly to
the impacts of CWU and LUC (from the wood extraction to produce charcoal for water
treatment). The WtE plant’s main impacts for electricity production is from combustion
air emissions, water input and treatment, urea, and quicklime. The air emissions
contribute mainly to the impacts of AP, EP, and GWP. Water input and treatment
contributes mainly to CWU. Quicklime contributes mainly to ODP and ADPF and quicklime
contributes mainly to AP, ODP, and ADPF.
• Waste Disposal: Both the coal and WtE plants create fly ash, which need to be disposed
of in a landfill. The disposal of ash contributes mainly to LUC, EP, and PCOP for coal and
-10% 0% 10% 20% 30% 40% 50% 60% 70% 80% 90% 100%
GWP (kg CO2 eq)
ADPF (kg oil eq)
PCOP (kg C2H4 eq)
EP (kg PO4--- eq)
AP (kg SO2 eq)
PM (kg intake)
PM (Deaths)
ODP (kg CFC-11 eq)
LUC (kg C deficit)
CWU (L H2O eq)
Combustion Emissions Coal Extraction Water
Coal Transport Ash Disposal Sewage Treatment

Ramboll - Kwinana Waste to Energy Project
24/33
to CWU, AP, and ADPF for WtE. The AusLCI data set models coal ash as disposed in a
sanitary landfill, while we used the AusLCI data set for incineration ash in a residual
landfill for the WtE boiler ash and APCr.
The LCA results in Figure 7 indicate that the WtE Plant electricity is preferable to the current
Western Australian grid electricity (Black Coal) for all impact categories and with more
pronounced benefits for LUC, PCOP, and GWP.
Figure 7: WtE Plant versus Western Australia Black Coal
4.3.1 COMPARISON TO IFI MARGINAL GRID ELECTRICITY FACTOR
In addition to comparing to black coal per ARENA requirements, we also compare GWP results to
the International Financial Institution (IFI) GHG emission factor for marginal grid electricity in
Australia, which is calculated to be 716.6 kg CO2e/MWh. Figure 8 shows the result per annum.
-100% -50% 0% 50% 100%
GWP (kg CO2 eq)
ADPF (kg oil eq)
PCOP (kg C2H4 eq)
EP (kg PO4--- eq)
AP (kg SO2 eq)
PM (kg intake)
PM (Deaths)
ODP (kg CFC-11 eq)
LUC (kg C deficit)
CWU (L H2O eq)
WtE Black Coal

Ramboll - Kwinana Waste to Energy Project
25/33
Figure 8: Kwinana WtE annual GWP result compared the Australian marginal grid electricity (IFI).
4.4 Sensitivity to Waste Collection Fuel Consumption
Several impact categories of the WtE plant results are sensitive to the amount of diesel fuel used
in waste collection, which is also one of the most uncertain quantities in the inventory. To
address this uncertainty, we calculated the WtE plant results with the range of fuel consumption
values presented in the referenced study from the Technical University of Denmark. The study
presents a range of fuel consumption values from a low of 1.4 liters per tonne of waste to a high
10.1 liters per tonne of waste. In our baseline results, we used an average of 5.75 liters per
tonne of waste. Figure 9 shows how the overall results vary using the low, baseline, and high
values. The most sensitive categories are ADPF at ±97%, ODP at ±91%, PM at ±42%, CWU at
±14%, and AP at ±13%. EP, GWP, PCOP, and LUC categories all vary less than 5%.
Figure 9: WtE LCA results for Low (1.4 liters/tonne), Baseline (5.75 liters/tonne), and High (10.1 liters/tonne)
diesel consumption used for waste collection prior to transport of the waste to the WtE facility.
-237
198
-300 -200 -100 0 100 200
Kwinana WtE
Australian marginal grid electricity (IFI)
GWP (kt CO2e/year)
-100% -80% -60% -40% -20% 0% 20% 40% 60% 80%
GWP (kg CO2 eq)
ADPF (kg oil eq)
PCOP (kg C2H4 eq)
EP (kg PO4--- eq)
AP (kg SO2 eq)
PM (kg intake)
PM (Deaths)
ODP (kg CFC-11 eq)
LUC (kg C deficit)
CWU (L H2O eq)
High (10.1 l/t) Baseline (5.75 l/t) Low (1.4 l/t)

Ramboll - Kwinana Waste to Energy Project
26/33
4.5 Alternative Scenario: WtE Bottom Ash Landfilled
While the bottom ash from waste combustion is assumed to be reused as construction aggregate,
our analysis also considered the impacts of the landfilling the ash. Figure 10 shows the effect of
landfilling the ash on the WtE life cycle. The WtE impacts would increase in several categories.
The largest increases occur in ODP, EP and ADPF while the rest of the categories also show
increases.
Figure 10: WtE LCA results for the Baseline scenario and scenario where Ash is disposed in a landfill
-100% -50% 0% 50% 100%
GWP (kg CO2 eq)
ADPF (kg oil eq)
PCOP (kg C2H4 eq)
EP (kg PO4--- eq)
AP (kg SO2 eq)
PM (kg intake)
PM (Deaths)
ODP (kg CFC-11 eq)
LUC (kg C deficit)
CWU (L H2O eq)
Baseline Ash Disposal in Landfill
Ramboll - Kwinana Waste to Energy Project
27/33
5. DISCUSSION AND INTERPRETATION
Based on the considered life cycles of this study, the WtE Plant electricity is preferable to the
current Western Australian black coal electricity generation for all impact categories, especially
LUC, PCOP, and GWP.
5.1 Study Limitations
This study was created based on projected design of the WtE Plant at NOP. While the design
conditions are guaranteed, the results of this study may not always reflect actual operating
conditions. For future work, the LCA results could be updated using actual annual operating
conditions to reevaluate the impacts.

Ramboll - Kwinana Waste to Energy Project
28/33
6. FUTURE WORK
Kwinana WtE Project Co would like to use the results of this LCA to improve the WtE Plant project
going forward. From the LCA findings, the following improvements could be made to improve the
life cycle impacts of the WtE Plant:
• Recycle or Upcycle Boiler Ash. The project is already planning to divert the bottom
ash to concrete, while the remaining boiler ash will be disposed in a landfill. This disposal
has a significant impact on CWU and EP impacts. Similarly finding an alternative use for
the boiler ash will reduce these impacts.
• Improve Waste Collection and Transport. Waste collection has a significant impact
on PM, ODP, ADPF and other categories. As illustrated in the sensitivity analysis in
Section 4.4, optimizing truck routes, using fuel efficient vehicles or using alternative
fuel vehicles could significantly reduce these impacts.
• Improving WtE Plant Efficiency. Increasing the efficiency of the plant to require less
municipal waste per MWh of electricity would also reduce the waste collection impacts on
PM, ODP, and ADPF and the air emissions impacts on AP and GWP.
In addition, once the WtE plant is operational the LCA results could be updated to include actual
annual operating data to reevaluate the impacts.

Ramboll - Kwinana Waste to Energy Project
29/33
7. CRITICAL REVIEW
To meet ARENA’s requirements for commercialization LCAs, a critical review was conducted. The
reviewer was selected based on his/her ability to meet at least one of the following requirements
from ARENA:
• have at least five years of professional experience in the field of LCA;
• have been involved in at least five peer-reviewed LCA studies; or
• be a Life Cycle Assessment Certified Practitioner (LCACP) – administered by ALCAS or the
American Centre for Life Cycle Assessment.
Table 12 lists the reviewer’s credentials.
Table 12: Reviewer’s Credentials
Reviewer’s Name: Anders Daamgard
Reviewer’s Affiliation: Technical University of Denmark
Reviewer’s Credentials: Anders has at least five years of professional experience in the field of LCA.
The Critical Review Report and Response to Comments are listed in Appendix 1.

Ramboll - Kwinana Waste to Energy Project
30/33
APPENDIX 1
CRITICAL REVIEW REPORT AND RESPONSE TO COMMENTS

Technical University of Denmark
Department of
Environmental Engineering
Bygningstorvet
Building 115
2800 Kgs. Lyngby
Denmark
Tel +45 45 25 16 00
Dir. +45 45 25 16 12
Fax +45 45 93 28 50
www.env.dtu.dk
MEMO
To Rambøll Consulting Engineers
Reg. CRITICAL REVIEW OF "KWINANA WASTE TO ENERGY PROJECT - ARENA LIFE CYCLE ASSESSMENT”
From Anders Damgaard, DTU Environment
18 October 2018
ADAM
Content
Summary 1
The general aspects 2
Checklist 4 Summary This critical review of the LCA "KWINANA WASTE TO ENERGY PROJECT - ARENA LIFE CYCLE ASSESSMENT” regarding the environmental effects from the proposed Kwinana Waste-to-Energy plant, was carried out by Anders Damgaard, DTU Environment, after the international standard ISO 14044 and the standards set by ARENA as closely as possible.
The review was carried out in October 2018.
The overall finding of the review is that the study lives up to the ISO standards and guidelines for LCA.
There are minor areas where the reporting can be improved, but the reviewer does not find this will
change the overall findings. Most of the choices with regards to data taken for the modelling of the
WTE plant are conservative, which indicate that value-choices in the LCA have been cautious, and if
anything the results could favour the WtE more than indicated.

2
The general aspects The following covers general comments to the life cycle assessment.
General aspects Comments
The methods have been used in accordance with the international standard
Yes, to a high degree
The methods are scientifically and technically valid.
Yes, the standard has been followed, except where they have indicated they
follow ARENA guidelines.
Applied data is appropriate and reasonable
Generally the data applied are reasonable.
There is an error with regards to avoided landfill where data for part of the
modelling is missing.
The assessment report is transparent and consistent
Overall the report is transparent and consistent.
The documentation for the avoided landfill modelling (Table 6) is though not
clear, and I think incomplete. Only transport and collection distances are
included, it is missing the data for how the actual avoided landfill was
modelled. This has a high impact on the results and should be updated.
Additional comments:
Modelling of CWU and LUC are highly dependent on the quality of
the applied processes. To me it looks like there are data missing for
CWU and LUC is the avoided landfill modelling as it does not seem
realistic this process does not have an impact on this similar to the
ash landfill.
The cut-off criteria reporting of 95% (section 3.2.2) is not indicated if
this is an assumption, or to some degree calculated. It is a
reasonable assumption, but could be made clearer.
In the avoided landfill reporting it is not clear why there are two
transports from transfer station to landfill.
The sensitivity scenario 5.5 with using ash in in construction and
infrastructure is mislabelled, since the modelling only considers how
the results look if ash landfilling is missing. There would be both
drawbacks and benefits in using ash this way, which could pull the
results in both directions for different impact categories.
I could have wished for a sensitivity scenario investigating the
importance of the waste composition. In the modelling is assumed a
fossil carbon content of 29.8% (rest is biogenic carbon). If this

3
percentage changed both the direct emissions from the WTE would
change, as well as the avoided landfill impacts. That said as long as
the alternative energy source is black coal this will not change the
overall findings.

4
Checklist The following should be covered by the report
Aspects from ISO 14044 Comments
1 General aspects
1.1 the Lifecycle Assessment Commissioner, Practitioner of the Life Cycle Assessment
√
1.2 report Date √
1.3 statement that the assessment has been carried out in accordance with the requirements of ISO 14044
√
2 The goal of the assessment
2.1 the reasons for carrying out the study √
2.2 its intended applications √
2.3 the target audience √
2.4 statement as to whether the study is intended to support comparative assertions intended to be disclosed to the public
√
3 Scope of the study
3.1 funktion, including
a) statement of performance characteristics, and
√
b) any omission of additional functions in comparisons
√
3.2 functional unit, including
a) consistency with goal and scope It follows the ARENA guidelines.
b) definition √
c) results of performance measurement √
3.3 system boundary, including
a) omission of life cycle stages, processes or data needs
√
b) quantification of energy and material inputs and outputs, and
The modelling of the avoided landfill is incomplete

5
c) assumptions about electricity production Following ARENA guidelines.
In ISO 14044 I would have expected a
temporal consideration that could be different
from hard coal
3.4 cut-off criteria for initial inclusions of inputs and output, including
a) description of cut-off criteria and assumptions
√
b) effect of selection on results √
c) inclusion of mass, energy and environmental criteria
√
4 Life cycle inventory analysis
4.1 data collection procedure √
4.2 qualitative and quantitative description of unit processes
√
4.3 sources of published literature √
4.4 calculation procedures √
4.5 validation of data, including
a) data quality assessment √
b) treatment of missing data √
4.6 sensitivity analysis for refining the system boundary
As mentioned above there could have been more done on this point. Considering the analysis, this is not considered to change the overall recommendations of the study and is therefore acceptable.
4.7 allocation principles and procedures, including
a) documentation and justification of allocation procedures
√
b) uniform application of allocation procedures
√
5 Life cycle impact assessment, where applicable
5.1 the LCIA procedures, calculations and results of the study
√
5.2 limitation of the LCIA results relative to the defined goal and scope of the LCA
√

6
5.3 the relationship of the LCIA results to the defined goal and scope, see 4.2
√
5.4 the relationship of the LCIA results to the LCI results, see 4.4
√
5.5 impact categories and category indicators considered, including a rationale for their selection, including assumptions and a reference to their source
√
5.6 description of or reference to all characterization models, characterization factors and methods used, including all assumptions and limitations
√
5.7 description of or reference to all value-choices used in relation to impact categories, characterization models, characterization factors, normalization, grouping, weighting and, elsewhere in the LCIA, a justification for their use and their influence on the results, conclusions and recommendations
Not relevant
5.8 a statement that the LCIA results are relative expressions and do not predict impacts on category endpoints, the exceeding of thresholds, safety margins or risks.
and, when included as part of the LCA, also
√
a) a description and justification of the definition and description of any new impact categories, category indicators or characterization models used for the LCIA
Not applicable
b) a statement and justification of any grouping of the impact categories
Not applicable
c) any further procedures that transform the indicator results, and a justification of the selected, references, weighting factors, etc.
Not applicable
d) any analysis of the indicator results, for example sensitivity and uncertainty analysis or use of environmental data, including any implications for the results, and
√

7
e) data and indicator results reached prior to any normalization, grouping or weighting shall be made available together with the normalized, grouped or weighted results
Not applicable
6 Life cycle interpretation
6.1 the results √
6.2 assumptions and limitations associated with the interpretation of results, both methodology and data related
√
6.3 data quality assessment
6.4 full transparency in terms of value-choices, rationales and expert judgements
√
7 Critical review, where applicable
7.1 name and affiliation of reviewers √ (only one reviewer and not a review panel
as in ISO 14044)
7.2 critical review reports √
7.3 responses to recommendations Comes later

Intended for
Kwinana WTE Project Co Kwinana Beach, Australia
Date
October 2018
KWINANA WASTE TO ENERGY PROJECT ARENA LIFE CYCLE ASSESSMENT

Ramboll 1560 Broadway Suite 1905 Denver, CO 80202 USA T +1 303 382 5460 F +1 303 382 5499 www.ramboll.com
KWINANA WASTE TO ENERGY PROJECT ARENA LIFE CYCLE ASSESSMENT
Project name Kwinana Waste to Energy Project Project no. 1100021970-002 LCA Commissioner Kwinana WtE Project Co Version 1 Date October 5, 2018 Prepared by Ramboll LCA Practitioners Jim Mellentine, Ashley Kreuder

Ramboll - Kwinana Waste to Energy Project
1/25
CONTENTS
1. Executive Summary 3 2. Introduction 5 3. Goal and Scope 6 3.1 Goal of Study 6 3.2 Scope of Study 6 3.2.1 System Boundary, Functional unit, reference flows, AND reference
system 6 3.2.2 Cutoff Criteria 7 3.2.3 Data Quality Criteria 7 3.2.4 Impact Categories 7 4. LCA Approach 9 4.1 Inventory of Inputs and Outputs (Life Cycle Inventory) 9 4.1.1 Kwinana Waste to Energy plant Electricity Production 9 4.1.2 Business as usual Reference system: Western Australia electricity
(black coal) production 11 4.2 Data sources and quality assessment 13 4.3 Emission factors and their sources, conversion factors (yields) 14 4.4 Documentation of assumptions and calculations (Life Cycle Impact
Assessment) 15 5. Summary of LCA Results 17 5.1 WtE Plant 17 5.2 BAU: Black Coal Electricity Production 18 5.3 Comparison to the Business as Usual Reference Scenario 18 6. Discussion and Interpretation 21 6.1 Study Limitations 21 7. Future Work 22 8. Critical Review 23
TABLE OF TABLES Table 1: Life Cycle Impact Assessment Indicators and Characterization Methods. 8 Table 2: WTE Plant Electricity Production Inputs and Outputs for 1 line per hour and per year, assuming 8,000 hrs/yr of operation 9

Ramboll - Kwinana Waste to Energy Project
2/25
Table 3: Waste as Fuel: Waste collection and transport to WtE facility, per tonne waste. 10 Table 4: Expected Waste Composition and Bio/Fossil Ratio. 10 Table 5: WTE Plant Air Emissions Output for 1 kWh generated. 11 Table 6: Waste as Fuel: Avoided Landfill Impact Assumptions, per tonne of waste. 11 Table 7: Western Australia Electricity (Black Coal) Production Inputs and Outputs for 1 MWh generated. 12 Table 8: WtE Plant Data Sources and Quality Assessment 14 Table 9: Conversion Factors 15 Table 10: Reviewer’s Credentials 23
TABLE OF FIGURES Figure 1: WtE Plant versus Western Australia Black Coal 3 Figure 2: WtE Plant Contribution Analysis 4 Figure 3: Example of GWP Characterization Factors 15 Figure 4: WtE Plant Contribution Analysis 17 Figure 5: Business as Usual Black Coal Plant Contribution Analysis 18 Figure 6: WtE Plant versus Western Australia Black Coal 19

Ramboll - Kwinana Waste to Energy Project
3/25
1. EXECUTIVE SUMMARY
Kwinana WTE Project Co is commissioned a Life Cycle Assessment (LCA) of their Kwinana Waste to Energy plant (WtE Plant) to meet funding requirements of the Australian Renewable Energy Agency (ARENA). The WtE Plant is located in Kwinana, Australia and is estimated to generate 138,000 MWh of electricity annually from 25,000 tons per hour of municipal solid waste. Currently, the Western Australian grid is supplied by black coal. The objective of the LCA study is to compare the cradle to grave impacts of 1 MWh of electricity supplied to the Western Australian grid from WtE Plant electricity production versus the current Western Australia electricity (black coal) production. The WtE Plant impacts include collection and transportation of the municipal solid waste as well as the displacement of municipal solid waste to landfill per the ARENA requirements. The LCA results in Figure 1 indicate that the WtE Plant electricity is preferable to the current Western Australian grid electricity for the impact categories of Particulate Matter (PM), Acidification Potential (AP), Photochemical ozone creation potential (PCOP), Fossil Energy Abiotic Depletion Potential Fossil Fuels (ADPF), and Global Warming Potential (GWP). However, the black coal electricity production is preferable for Consumptive Water Use (CWU), Land Use Change (LUC), Ozone Depletion Potential (ODP), and Eutrophication Potential (EP).
Figure 1: WtE Plant versus Western Australia Black Coal
Figure 2 illustrates the main drivers of the WtE Plant impacts. The disposal of the bottom ash to landfill is the main contributor to the CWU, LUC, and EP impacts. The main contributor to ODP is the Waste Collection and Transport of municipal waste to the facility.
-100.0% -50.0% 0.0% 50.0% 100.0%
GWP (kg CO2 eq)
ADPF (kg oil eq)
PCOP (kg C2H4 eq)
EP (kg PO4--- eq)
AP (kg SO2 eq)
PM (kg intake)
PM (Deaths)
ODP (kg CFC-11 eq)
LUC (kg C deficit)
CWU (L H2O eq)
Western Australia Black Coal WtE Plant
Commented [AD1]: kg
Commented [JM2R1]: updated

Ramboll - Kwinana Waste to Energy Project
4/25
Figure 2: WtE Plant Contribution Analysis
From these results, Kwinana WTE Project Co is considering the following improvements to the WtE Plant project going forward:
• Recycle or Upcycle Bottom Ash. Landfilling the bottom ash has a significant impact on CWU, LUC, and EP impacts. As illustrated in the scenario analysis in Section 5.5, recycling or upcycling the bottom ash in concrete could reduce these impacts.
• Improve Waste Collection and Transport. Waste collection has a significant impact on PM, ODP and other categories. As illustrated in the sensitivity analysis in Section 5.4, optimizing truck routes, using fuel efficient vehicles or using alternative fuel vehicles could significantly reduce these impacts.
-100% -50% 0% 50% 100%
GWP (kg CO2 eq)
ADPF (kg oil eq)
PCOP (kg C2H4 eq)
EP (kg PO4--- eq)
AP (kg SO2 eq)
PM (kg intake)
PM (Deaths)
ODP (kg CFC-11 eq)
LUC (kg C deficit)
CWU (L H2O eq)
WtE Air Emissions WtE Input Water and Treatment
Urea Activated Carbon
Quicklime Waste Collection & Transport
Natural Gas Ash Disposal to Landfill
Avoided Landfill Impacts

Ramboll - Kwinana Waste to Energy Project
5/25
2. INTRODUCTION
Kwinana WTE Project Co is applying for funding through the Australian Renewable Energy Agency (ARENA) for the Kwinana Waste to Energy plant (WtE Plant). ARENA requires an LCA study be undertaken for all bioenergy and biofuel requirements. The WtE plant is rated at Technology Readiness Level 9+, so a commercialization LCA is required. Ramboll conducted the LCA study according to ARENA1 requirements and the International Standards Organization (ISO) standards ISO 14040 – Life cycle Assessment – Principles and framework and ISO 14044 – Life cycle assessment – Requirements and guidelines (ISO series 14040/14044). As outlined in the ISO series 14040/14044, an LCA consists of four phases:
1. Goal and scope definition: define the objectives and associated study framework and boundaries;
2. Life cycle inventory (LCI): create an inventory of the mass and energy inputs and outputs from processes associated with the product system processes (data collection phase)
3. Life cycle impact assessment (LCIA): evaluation of the relative environmental significance (e.g., global warming potential (GWP) associated with the inputs and outputs; and,
4. Interpretation: summary of the conclusions in relation to the objectives of the study.
1 Australian Renewable Energy Agency (ARENA). (2016, October). Life Cycle Assessment (LCA) of Bioenergy Products and Projects: Method and guidance for undertaking life cycle assessment (LCA) of bioenergy products and project. Retrieved from https://arena.gov.au/assets/2017/05/AU21285-ARENA-LCA-Guidelines-12-1.pdf

Ramboll - Kwinana Waste to Energy Project
6/25
3. GOAL AND SCOPE
In LCA, the goal and scope define the objectives and associated study framework and boundaries of the study.
3.1 Goal of Study The goal of this LCA is to meet the requirements of ARENA and provide verified environmental performance data to investors. The primary audience for the study will be ARENA and project investors. This study does not support comparative assertions intended to be disclosed to the public.
3.2 Scope of Study The scope of the study defines the system boundary and specific products to be studied, which then determines data collection and analysis needs. In addition, the scope establishes which impact categories will be evaluated, which allocation procedures will be applied, and what data will be required.
3.2.1 SYSTEM BOUNDARY, FUNCTIONAL UNIT, REFERENCE FLOWS, AND REFERENCE SYSTEM The objective of this study is to compare the cradle to grave impacts of the WtE plant electricity production to Western Australia electricity (black coal) production business as usual reference system (BAU: Black Coal electricity production). The WtE Plant is located in Kwinana, Australia and is estimated to generate 138,000 MWh of electricity annually from 25,000 tons per hour of municipal solid waste. Following the ARENA requirements, the system boundary was expanded to include the impacts associated with the handling and processing of the municipal solid waste and the avoided impacts associated with the landfill impacts (e.g., avoided methane emissions and carbon storage). Recycling of ferrous metals and aluminum from the bottom ash were considered to be outside the system boundary. Given this system expansion, the system boundary includes all relevant unit processes and allocation assumptions and procedures are not relevant. Sensitivity analyses associated with the inclusion of avoided landfill impacts and exclusion of credits from the recycling of ferrous metals and aluminum from the bottom ash are included in Section 5.1. The functional unit of the study is the production of 1 MWh of electricity supplied to the Western Australian grid. The MWh of electricity functional unit is represented by the input and output reference flows described in more detail in Section 4.1. The study excludes the embodied impacts of capital equipment and infrastructure, which meets the following requirements from ARENA:
• The production systems estimated to have an economic life of 10 years or greater, and • The production systems do not require establishment of significant supporting physical
infrastructure.
Commented [AD3]: kg
Commented [JM4R3]: Updated
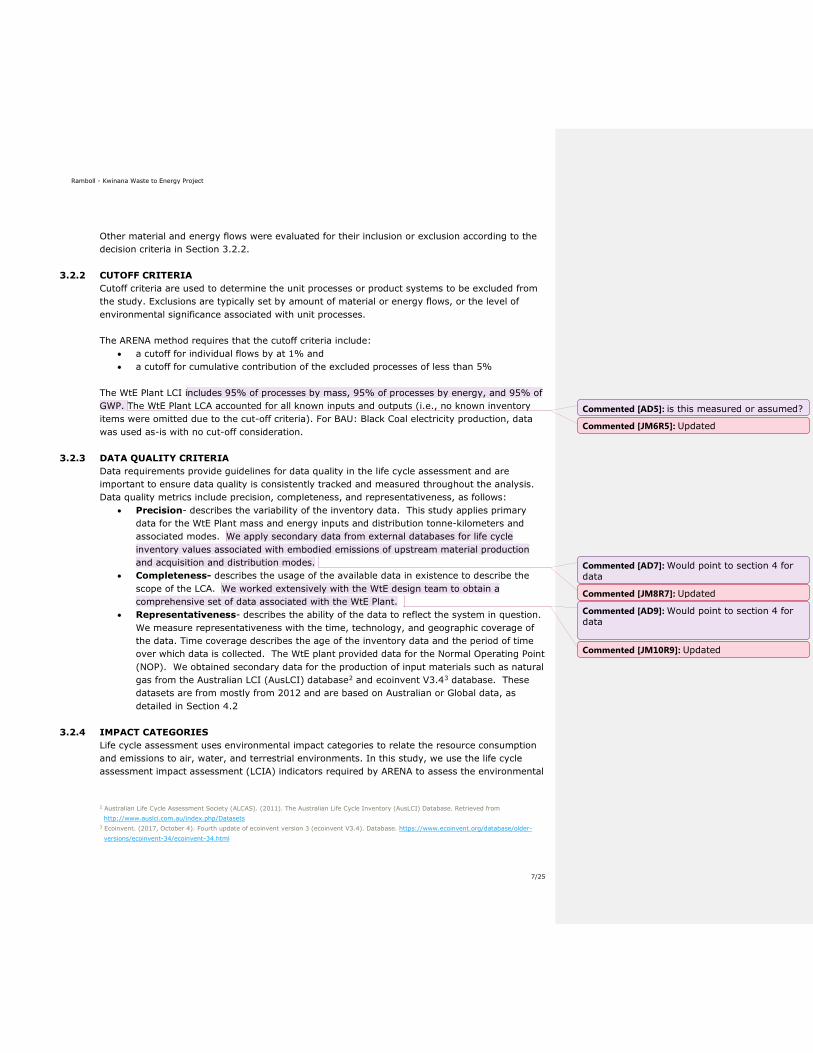
Ramboll - Kwinana Waste to Energy Project
7/25
Other material and energy flows were evaluated for their inclusion or exclusion according to the decision criteria in Section 3.2.2.
3.2.2 CUTOFF CRITERIA Cutoff criteria are used to determine the unit processes or product systems to be excluded from the study. Exclusions are typically set by amount of material or energy flows, or the level of environmental significance associated with unit processes. The ARENA method requires that the cutoff criteria include:
• a cutoff for individual flows by at 1% and • a cutoff for cumulative contribution of the excluded processes of less than 5%
The WtE Plant LCI includes 95% of processes by mass, 95% of processes by energy, and 95% of GWP. The WtE Plant LCA accounted for all known inputs and outputs (i.e., no known inventory items were omitted due to the cut-off criteria). For BAU: Black Coal electricity production, data was used as-is with no cut-off consideration.
3.2.3 DATA QUALITY CRITERIA Data requirements provide guidelines for data quality in the life cycle assessment and are important to ensure data quality is consistently tracked and measured throughout the analysis. Data quality metrics include precision, completeness, and representativeness, as follows:
• Precision- describes the variability of the inventory data. This study applies primary data for the WtE Plant mass and energy inputs and distribution tonne-kilometers and associated modes. We apply secondary data from external databases for life cycle inventory values associated with embodied emissions of upstream material production and acquisition and distribution modes.
• Completeness- describes the usage of the available data in existence to describe the scope of the LCA. We worked extensively with the WtE design team to obtain a comprehensive set of data associated with the WtE Plant.
• Representativeness- describes the ability of the data to reflect the system in question. We measure representativeness with the time, technology, and geographic coverage of the data. Time coverage describes the age of the inventory data and the period of time over which data is collected. The WtE plant provided data for the Normal Operating Point (NOP). We obtained secondary data for the production of input materials such as natural gas from the Australian LCI (AusLCI) database2 and ecoinvent V3.43 database. These datasets are from mostly from 2012 and are based on Australian or Global data, as detailed in Section 4.2
3.2.4 IMPACT CATEGORIES Life cycle assessment uses environmental impact categories to relate the resource consumption and emissions to air, water, and terrestrial environments. In this study, we use the life cycle assessment impact assessment (LCIA) indicators required by ARENA to assess the environmental
2 Australian Life Cycle Assessment Society (ALCAS). (2011). The Australian Life Cycle Inventory (AusLCI) Database. Retrieved from http://www.auslci.com.au/index.php/Datasets
3 Ecoinvent. (2017, October 4). Fourth update of ecoinvent version 3 (ecoinvent V3.4). Database. https://www.ecoinvent.org/database/older-versions/ecoinvent-34/ecoinvent-34.html
Commented [AD5]: is this measured or assumed?
Commented [JM6R5]: Updated
Commented [AD7]: Would point to section 4 for data
Commented [JM8R7]: Updated
Commented [AD9]: Would point to section 4 for data
Commented [JM10R9]: Updated

Ramboll - Kwinana Waste to Energy Project
8/25
impacts of the WtE Plant, listed in Table 1. LCIA results are relative expressions and do not predict actual impacts or actual damages, the exceeding of thresholds, safety margins, or risks.
Table 1: Life Cycle Impact Assessment Indicators and Characterization Methods.
LCIA Indicator LCIA Indicator Units Characterization Model
GWP100 (GWP) kg CO2 equivalents (kg CO2e) IPCC 5th Assessment Report model based on 100-year timeframe
Fossil energy (abiotic depletion fossil fuels) (ADPF)
kg oil equivalent (kg oil eq) All fossil energy carriers based on
relative scarcity (Goedkoop, et al., 2009)
Photochemical ozone creation potential (PCOP)
kg of ethene equivalent (kg C2H4 eq) CML 2016
Eutrophication (EP) kg phosphate equivalent (kg PO4 eq) CML 2016
Acidification (AP) kg sulphur dioxide
equivalent (kg SO2 eq)
CML 2016
Particulate Matter (PM) particulate matter less
than 2.5 microns (kg intake or deaths)
Recommended factors from Pelton Workshop, January 2016 published by UNEP/SETAC.
Ozone Depletion Potential (ODP)
kg CFC 11 equivalent (kg CFC-11 eq) CML 2016
Land Use (LUC) kg soil organic matter
(SOM) (kg C/m2/a deficit)
ILCD
Consumptive Water Use (CWU)
L H2O eq. global
average water scarcity (L H2O eq)
Method of Ridoutt & Pfster, (2010), with Water stress indices of Pfster et al. (2009)
Commented [JM12R11]: Added detailed breakdown of drivers for LUC and CWU to results section to illuminate the reason for the differences and reflecting the updated results.
Commented [AD11]: Are you sure your Ecoinvent processes support the LUC and CWU data. Or could this be the reason for differences?

Ramboll - Kwinana Waste to Energy Project
9/25
4. LCA APPROACH
Ramboll conducted this study according to the standards established by the ISO series 14040/14044 as well as the requirements define by the Australian Renewable Energy Agency (ARENA) for LCA of bioenergy products and projects. This section details the life cycle assessment approach including:
1. Inventory of inputs and outputs (Life Cycle Inventory), 2. Data sources and quality assessment, 3. Emission factor and their sources, conversion factors (yields), and 4. Documentation of assumptions and calculations (Life Cycle Impact Assessment)
4.1 Inventory of Inputs and Outputs (Life Cycle Inventory) This section describes the cradle-to-grave life cycle inventory (LCI) of the Kwinana WtE plant and the BAU: Black Coal electricity production. Primary design data were collected from project documentation. Waste collection and transport data were estimated based on the locations of the waste sources and literature.
4.1.1 KWINANA WASTE TO ENERGY PLANT ELECTRICITY PRODUCTION WtE plant engineers provided the process diagrams, water, energy, and mass balances for the plant NOP. Ramboll used these NOP diagrams to model the LCI inputs and outputs per hour and per year based on 8,000 operating hours per year. Table 2 details the inputs and outputs for 1 kWh of energy generated by the WTE plant. The air emissions were calculated from the Kwinana WtE - EPC Contract - Schedule 3, Section 2.74 and expected air emissions from typical modern WTE plants versus EU limits, 2010/75/EC.5 Table 3 summarizes the inputs, outputs and assumptions for the waste collection and transport to WtE facility, per tonne waste. Table 4 summarizes the expected composition of the input waste. Table 5 summarizes the air emissions outputs and assumptions. Table 6 summarizes the inputs, outputs and assumptions for the avoided landfill impacts. Based on the expected inputs and outputs, the overall energy efficiency of the plant is calculated to be 24.6%.
Table 2: WTE Plant Electricity Production Inputs and Outputs for 1 line per hour and per year, assuming 8,000 hrs/yr of operation
Inputs Qty per hour Qty per year Unit Reference/Comments
i1 Industrial Water 7,483.333 59,866,666.667 liters From water balance6
i2 Potable Water 291.667 2,333,333.333 liters From water balance6
i3 Ammonia/urea 40% solution
77.000 616,000.000 kg From PFD7
4 Ashurst. (2018, August 16). Kwinana WtE – EPC Contract – Schedule 3. Report. Section 2.7 5 National Environmental Research Institute (NERI). (2010). Emissions from Decentralised CHP Plants 2007-Energinet.DK Environmental Project No. 07/1882. Project Report 5- Emission factors and emissions inventory for decentralized CHP production. Retrieved from http://www.dmu.dk/pub/FR786.pdf.
6 Acciona. (2018, May 5). Kwinana Waste-to-Energy Project. Part B- EPC Proposal From Acciona- Technical. 20. Overall PFD & Water Balance Diagram. Water Balance. MEB-005.
7 Acciona. (2018, May 5). Kwinana Waste-to-Energy Project. Part B- EPC Proposal From Acciona- Technical. 20. Overall PFD & Water Balance Diagram. Overall Process Flow Diagram. MEB-001.

Ramboll - Kwinana Waste to Energy Project
10/25
Inputs i4 Activated carbon 6.000 48,000.000 kg From PFD7
i5 Quick lime (86% pure)
255.000 2,040,000.000 kg From PFD.7 Assume that 14% is inert limestone, sand, and clay.
i6 Waste as fuel 25,000.000 200,000,000.000 kg From PFD7; see Table 3 for associated waste collection and transport, Table 4 for waste composition, and Table 6 for avoided landfill impact assumptions
i7 Support fuel (natural gas)
7.325 58,599.722 kg 276,440 MWh/year8; Composition per Kwinana WtE
- EPC Contract - Schedule 34 and calculated density of natural gas from specific gravity relative to air.
Outputs Qty per hour Qty per year Unit Reference/Comments
o1 Electricity 17,277.500 138,220,000.000 kWh Contractually required production in first year
o2 Water to septic 291.667 2,333,333.333 liters The remaining water balance leaves system through evaporation or in slag and model assumes there are no impacts
o3 Ferrous metal 590.000 4,720,000.000 kg Ferrous metal is recycled at end of life
o4 Aluminum 88.000 704,000.000 kg Aluminum is recycled at end of life
o5 Bottom ash, wet, to landfill
2,331.000 18,648,000.000 kg From PFD.7 Subtracted aluminum and ferrous material from Bottom Ash input to screen. Assumes mass is 100% ash.
o6 Boiler ash to landfill
353.000 2,824,000.000 kg From PFD7
o7 Air emissions See Table 5.
Table 3: Waste as Fuel: Waste collection and transport to WtE facility, per tonne waste.
i6 Waste as Fuel: Waste Collection and Transport
Quantity Reference/Comments
Waste Collection 5.75 liters diesel/ tonne waste
Average of high and low as documented by Larsen et al, 20099.
Waste Transport to WtE facility 34.876 km Weighted average distance based on known contributing municipalities
Table 4: Expected Waste Composition and Bio/Fossil Ratio.
i6 Waste as Fuel: Waste Composition
% Reference/Comments
C 55.18% Kwinana WtE - EPC Contract - Table 54
H 7.56% Kwinana WtE - EPC Contract - Table 54
O 35.03% Kwinana WtE - EPC Contract - Table 54
N 1.4% Kwinana WtE - EPC Contract - Table 54
8 The O&M contractor guarantee the following: The Facility shall generate no less than [276,440] MWhrs of electricity [for export and sale] in each Operational Year.
9 Larsen et al. Diesel consumption in waste collection and transport and its environmental significance. July 2009. Waste Management & Research. Retrieved from https://www.researchgate.net/publication/26258094_Diesel_consumption_in_waste_collection_and_transport_and_its_environmental_significance

Ramboll - Kwinana Waste to Energy Project
11/25
i6 Waste as Fuel: Waste Composition
S 0.21% Kwinana WtE - EPC Contract - Table 54
Cl 0.62% Kwinana WtE - EPC Contract - Table 54
Table 5: WTE Plant Air Emissions Output for 1 kWh generated.
o7 Air Emissions
g per kWh Reference/Comments
SO2 0.035 Expected air emissions from typical modern WTE plants versus EU limits, 2010/75/EC5
NOx 0.320 Expected air emissions from typical modern WTE plants versus EU limits, 2010/75/EC5
UHC 0.002 Expected air emissions from typical modern WTE plants versus EU limits, 2010/75/EC5
NMVOC 0.002 Expected air emissions from typical modern WTE plants versus EU limits, 2010/75/EC5
CH4
-0.002 Expected air emissions from typical modern WTE plants versus EU limits, 2010/75/EC5; Subtracted
ambient CH4 concentration from NOAA,10 which is oxidized in the system.
CO
0.019 Expected air emissions from typical modern WTE plants versus EU limits, 2010/75/EC5; Increased by 35% to represent 20% of the limit value.
N2O 0.005 Expected air emissions from typical modern WTE plants versus EU limits, 2010/75/EC5
CO2 (fossil)
235.482 Kwinana WtE - EPC Contract - Schedule 3, Table 54; Assume that waste has a biobased content of 71.2%.
CO2 (biogenic)
582.164 Kwinana WtE - EPC Contract - Schedule 3, Section 2.4, Table 54; Assume that waste has a biobased content of 71.2%.
Table 6: Waste as Fuel: Avoided Landfill Impact Assumptions, per tonne of waste.
i6 Waste as Fuel: Avoided Landfill
Quantity Reference/Comments
Waste Collection
5.75 liters diesel/
tonne waste Average of high and low as documented by Larsen et al, 200911.
Waste Transport to transfer station or landfill
20.269 km Weighted average distance to nearest transfer station or landfill from city centers based on known contributing municipalities
Waste Transport to landfill from transfer station (small 3.5-16t truck)
25.24 km Weighted average distance from transfer station to landfill via small 3.5-16 tonne truck.
Waste Transport to landfill from transfer station (40t truck)
43.136 km Weighted average distance from transfer station to landfill via 40 tonne truck.
4.1.2 BUSINESS AS USUAL REFERENCE SYSTEM: WESTERN AUSTRALIA ELECTRICITY (BLACK COAL) PRODUCTION The ARENA method requires that the bioenergy system is compared to a business as usual reference system, which represents a scenario where the specific bioenergy under study is not
10 Dlugokencky, Ed (2018). National Oceanic & Atmospheric Administration (NOAA)/Earth System Research Laboratory (ESRL). Retrieved from www.esrl.noaa.gov/gmd/ccgg/trends_ch4/.
11 Larsen et al. Diesel consumption in waste collection and transport and its environmental significance. July 2009. Waste Management & Research. Retrieved from https://www.researchgate.net/publication/26258094_Diesel_consumption_in_waste_collection_and_transport_and_its_environmental_significance
Commented [AD13]: No actual avoided landfill?
Commented [JM14R13]: Added to table
Commented [AD15]: Why both small and large scale trucks from transfer station to landfill. Not really clear how you do this.
Commented [JM16R15]: It’s a combination of information provided and assumptions. I added a description above Table 2.

Ramboll - Kwinana Waste to Energy Project
12/25
produced. For Western Australia, this is the electricity (black coal) WA reference fuel. Ramboll collected the data from the AusLCI database12. Table 7 details the inputs and outputs for 1 MWh of energy generated by Western Australia Electricity (Black Coal) Production.
Table 7: Western Australia Electricity (Black Coal) Production Inputs and Outputs for 1 MWh generated.
Inputs Qty per MWh Unit Reference/Comments
Tap Water 2,230 liters AusLCI12
Rail transport 26.877 tkm AusLCI12
Truck transport 0.856375 tkm AusLCI12
Black coal 520 kg AusLCI12
Outputs Qty per MWh Unit Reference/Comments
Electricity 1 MWh AusLCI12
Water to septic 1,190 liters AusLCI12
Coal ash to landfill 28.6 kg AusLCI12
Bottom ash 3.17 kg AusLCI12
Emissions to Air CO2 976 kg AusLCI12
CH4 9.37 g AusLCI12
N2O 8.33 g AusLCI12
CO 115 g AusLCI12
NOx 0.00416 g AusLCI12
NMVOC 17.7 g AusLCI12
SOx 0.00385 g AusLCI12
NH3 0.291 g AusLCI12
As 0.0183 g AusLCI12
Be 0.0118 g AusLCI12
B 1.13 g AusLCI12
Cd 0.0150 g AusLCI12
Cr 0.0497 g AusLCI12
Cr VI 0.00259 g AusLCI12
Co 0.0443 g AusLCI12
Cu 0.0598 g AusLCI12
C9H12 0.00187 g AusLCI12
12 Australian Life Cycle Assessment Society (ALCAS). (2011). The Australian Life Cycle Inventory (AusLCI) Database. Retrieved from http://www.auslci.com.au/index.php/Datasets

Ramboll - Kwinana Waste to Energy Project
13/25
F 38.2 g AusLCI12
HCl 212.2 g AusLCI12
Pb 0.0712 g AusLCI12
Mn 0.131 g AusLCI12
Hg 0.0276 g AusLCI12
Ni 0.0837 g AusLCI12
PM10 188 g AusLCI12
PM2.5 75.1 g AusLCI12
Polychlorinated dioxins and furans 3.15E-07 g AusLCI12
PAH 0.00575 g AusLCI12
Zn 0.124 g AusLCI12
Emissions to Water As 2.81006E-04 g AusLCI12
Cd 2.81006E-04 g AusLCI12
Cr 4.8895E-04 g AusLCI12
Co 4.906361E-03 g AusLCI12
Cu 1.2645261E-02 g AusLCI12
Pb 2.81006E-04 g AusLCI12
Mn 8.430174E-03 g AusLCI12
Hg 3.37E-05 g AusLCI12
Ni 8.430174E-03 g AusLCI12
Zn 1.1914646E-02 g AusLCI12
Emissions to soil As 5.874325E-02 g AusLCI12
Cd 7.0266462E-02 g AusLCI12
Cr 8.1683419E-02 g AusLCI12
Co 7.46349592E-01 g AusLCI12
Cu 4.23244769E-01 g AusLCI12
Pb 2.14810056E-01 g AusLCI12
Mn 6.589723431 g AusLCI12
Hg 9.89826E-04 g AusLCI12
Ni 2.741194296 g AusLCI12
Zn 4.184491073 g AusLCI12
4.2 Data sources and quality assessment Ramboll selected the LCI data described previously according to the data quality criteria in Section 3.2.3 for the WtE Plant. For the reference scenario, ARENA requires the use of the

Ramboll - Kwinana Waste to Energy Project
14/25
electricity (black coal) WA reference fuel from the AusLCI database. Table 8 lists the WtE Plant data sources, references and the associated data quality by precision, completeness and representativeness.
Table 8: WtE Plant Data Sources and Quality Assessment
Data Type Data Source(s) Precision Completeness Representativeness (Time, Technology, Geography)
Primary data Kwinana WtE Project Co and WtE plant design team
Primary Data
Relevant data is included as much as possible from the water, mass, and energy balances.
Projected NOP for current WtE technology located in Kwinana, Australia
Australian secondary life cycle data
AusLCI U Secondary Data
Datasets include all relevant flows for unit processes (U) and apply no cutoff criteria13
2012 average technology for Western Australia or Australia.
Other secondary life cycle data
ecoinvent V3.4 Cut-off U
Secondary Data
Datasets include all relevant flows for unit processes (U) and the primary production of materials is always allocated to the primary user of the material (cut-off)
2005-2012 average technology for global, rest of world, or swiss datasets. Swiss datasets are mostly used for waste treatment.
Where available primary data from Kwinana WtE Project Co and the WtE plant design team was used. Data gaps were filled using assumptions and secondary data from AusLCI and ecoinvent V3.4 as detailed in Table 2-Table 6 following the decision criteria in Section 3.2.2.
4.3 Emission factors and their sources, conversion factors (yields) In life cycle assessment, emission factors (i.e., characterization factors) and conversion factors are used to quantify life cycle environmental impacts of a product or service. Ramboll used the emission factors from the environmental impact categories required by ARENA to assess the environmental impacts of the WtE Plant, listed in Table 1. For example, ARENA requires the GWP100 method from the IPCC 5th Assessment Report model based on a 100-year timeframe. The GWP100 method is used to determine the climate change impacts from GHG inventory substances in the LCI. To do this, the GWP100 applies a GWP characterization factor to the LCI to determine the kg of CO2e equivalence. Figure 3 provides an example that includes the GHG inventory substances for CO2, CH4, and SF6 and their associated GWP characterization factors.
13 Australian Life Cycle Assessment Society (ALCAS). (2014, March 6). Requirements for the development of AusLCI Data sets. Retrieved from http://www.auslci.com.au/Documents/AUSLCI_Requirements_30.pdf

Ramboll - Kwinana Waste to Energy Project
15/25
Figure 3: Example of GWP Characterization Factors
Ramboll used conversion factors in the LCA to convert energy, mass, and distances into different units. Table 9 lists the conversion factor values, units and their references.
Table 9: Conversion Factors
Conversion Factor Value Units Reference/Comments
NOP Municipal Waste Energy Content Lower Heating Value (LHV)
10.1 MJ/kg Ashurst. (2018, August 16). Kwinana WtE – EPC Contract – Schedule 3. Report. Section 3.3. Page 42
Efficiency of furnace + boiler
0.882 Acciona. (2018, May 5). Kwinana Waste-to-Energy Project. Part B- EPC Proposal From Acciona- Technical. 20. Overall PFD & Water Balance Diagram. Overall Process Flow Diagram. MEB-001.
Energy conversion from megajoules (MJ) to kilowatt-hours (kWh)
3.6 MJ/kWh
Density of air at 20 deg C 1.204084759 kg/m3 Converted from 101325 N/m2, 287.058 J/(kg·K), and 293.15K per 20 deg C
Density of natural gas at 20 deg C
0.728471279 kg/m3 Calculated from specific gravity and density of air at 20 deg C
Higher Heating Value (HHV) natural gas
37.1 MJ/m3 Ashurst. (2018, August 16). Kwinana WtE – EPC Contract – Schedule 3. Report. Section 2.7.
Density of diesel 832.5 kg/m3 https://www.engineeringtoolbox.com/fuels-densities-specific-volumes-d_166.html
Ambient CH4 concentration, which is oxidized in the system
1.86 ppm https://www.esrl.noaa.gov/gmd/ccgg/trends_ch4/#global
1.77105478 mg/Nm3 ppm x CH4 g/mol / 24.46 L (standard molar volume of ideal gas at 25C)
Conversion from mg/Nm3 to g/GJ
1.9 (mg/Nm3)/(g/GJ)
Methane sink 1.040581831 g/GJ Calculated from Ambient CH4 concentration and (mg/Nm3)/(g/GJ) conversion factor
4.4 Documentation of assumptions and calculations (Life Cycle Impact Assessment) Ramboll used the SimaPro 8.5 LCA Software to generate the LCA results. First, the LCA model was created for the WtE Plant and Reference Scenarios. The model was built with the LCI from Section 4.1 and the data sources from Section 4.2. Then the LCIA characterization factors from Table 1 were combined in SimaPro to generate results. Finally, the LCIA results were exported to Excel to finalize the results and conduct the sensitivity analysis. Minimal manipulation of the results was required in Excel, but to finalize the results, Ramboll completed the following:
• Multiplied Water Scarcity impacts in cubic meters by 1000 to convert to liters • Removed credits for aluminum and ferrous metals recycling • Calculated the avoided landfill credits from the landfill LCIA results multiplied by the
tonnes waste per MWh conversion factor of 1.44697. Ramboll conducted sensitivity analysis on the following system boundary assumptions of the LCA:

Ramboll - Kwinana Waste to Energy Project
16/25
• Fuel consumption amount used in waste collection. We reference a study that shows a range of 1.4 to 10.1 liters of diesel used to collect waste. We assumed an average of 5.75 liters in our baseline model. Section 5.4 shows how sensitive the results are to this assumption.
• Ash from the combustion of waste is assumed to go to landfill. However, Kwinana WtE Project Co is investigating alternative uses that would divert this material from the landfill. Section 5.5 shows how diverting the ash from landfill would further decrease impacts.

Ramboll - Kwinana Waste to Energy Project
17/25
5. SUMMARY OF LCA RESULTS
This section summarizes the life cycle assessment results of the WtE Plant and the BAU: Black Coal Electricity Production. Results include the assessment of key contributing factors, comparison to the reference scenario, and sensitivity analysis to identify specific process stages and substances that drive the results.
5.1 WtE Plant Figure 4 illustrates the key components of the life cycle of the WtE Plant several key components: inputs from municipal waste, urea, and quicklime and outputs from bottom ash. The inputs from municipal waste are driving the positive impacts from avoiding disposal in the landfill, but they are also contributing negatively to ODP, PM, and ADPF from the waste collection and transport of municipal waste to the facility. Urea is contributing negatively to the CWU, ODP, PM, and ADPF. Quicklime is contributing negatively to LUC, ODP, and ADPF. The disposal of the bottom ash to landfill is the main contributor to the CWU, LUC, and EP impacts.
Figure 4: WtE Plant Contribution Analysis
Table 10 lists the WtE impact results for each category for 1 MWh of electricity produced.
Table 10: WtE Plant Impact Assessment Results
Impact Category Result Impact Category Result
GWP (kg CO2 eq) -955 PM (kg intake) 2.89E-07
ADPF (kg oil eq) 20.3 PM (Deaths) 1.75E-06
PCOP (kg C2H4 eq) -0.281 ODP (kg CFC-11 eq) 6.69E-06
EP (kg PO4--- eq) 1.22 LUC (kg C deficit) 13.8
AP (kg SO2 eq) -0.295 CWU (L H2O eq) 2,570
-100% -50% 0% 50% 100%
GWP (kg CO2 eq)ADPF (kg oil eq)
PCOP (kg C2H4 eq)EP (kg PO4--- eq)
AP (kg SO2 eq)PM (kg intake)
PM (Deaths)ODP (kg CFC-11 eq)
LUC (kg C deficit)CWU (L H2O eq)
WtE Air Emissions WtE Input Water and Treatment
Urea Activated Carbon
Quicklime Waste Collection & Transport
Natural Gas Ash Disposal to Landfill
Avoided Landfill Impacts
Commented [AD17]: I suggest you make this bigger so you can see the axis title for each line
Commented [JM18R17]: Updated

Ramboll - Kwinana Waste to Energy Project
18/25
5.2 BAU: Black Coal Electricity Production Figure 5 illustrates the key components of the life cycle of the black coal plant several key components: black coal extraction, transport, combustion, ash disposal, water, and sewage treatment. The combustion emissions are driving the impacts to PM, AP, EP, PCOP, and GWP. Coal transport is the main contributor to LUC, while coal extraction is the primary contributor to ODP and ADPF, and secondarily to PCOP. Water use at the plant is the main contributor to CWU.
Figure 5: Business as Usual Black Coal Plant Contribution Analysis
Table 11 lists the black coal impact results for each category for 1 MWh of electricity produced.
Table 11: Black Coal Impact Assessment Results
Impact Category Result Impact Category Result
GWP (kg CO2 eq) 993 PM (kg intake) 3.01E-06
ADPF (kg oil eq) 244 PM (Deaths) 2.00E-05
PCOP (kg C2H4 eq) 5.38E-03 ODP (kg CFC-11 eq) 1.03E-06
EP (kg PO4--- eq) 0.591 LUC (kg C deficit) 3.15
AP (kg SO2 eq) 2.15 CWU (L H2O eq) 1,120
5.3 Comparison to the Business as Usual Reference Scenario The LCA results in Figure 6 indicate that the WtE Plant electricity is preferable to the current Western Australian grid electricity for several evaluated impact categories of Particulate Matter (PM), Acidification Potential (AP), Photochemical ozone creation potential (PCOP), Fossil Energy Abiotic Depletion Potential Fossil Fuels (ADPF), and Global Warming Potential (GWP). However,
-20% 0% 20% 40% 60% 80% 100%
GWP (kg CO2 eq)
ADPF (kg oil eq)
PCOP (kg C2H4 eq)
EP (kg PO4--- eq)
AP (kg SO2 eq)
PM (kg intake)
PM (Deaths)
ODP (kg CFC-11 eq)
LUC (kg C deficit)
CWU (L H2O eq)
Combustion Emissions Coal Extraction Water
Coal Transport Ash Disposal Sewage Treatment

Ramboll - Kwinana Waste to Energy Project
19/25
the black coal electricity production is preferable for Consumptive Water Use (CWU), Land Use Change (LUC), Ozone Depletion Potential (ODP), and Eutrophication Potential (EP).
Figure 6: WtE Plant versus Western Australia Black Coal
5.4 Sensitivity to Waste Collection Fuel Consumption Several impact categories of the WtE plant results are sensitive to the amount of diesel fuel used in waste collection, which is also one of the most uncertain quantities in the inventory. To address this uncertainty, we calculated the WtE plant results with the range of fuel consumption values presented in the referenced study from the Technical University of Denmark. The study presents a range of fuel consumption values from a low of 1.4 liters per tonne of waste to a high 10.1 liters per tonne of waste. In our baseline results, we used an average of 5.75 liters per tonne of waste. Figure 7 shows how the overall results vary using the low, baseline, and high values. The most sensitive categories are PM (Deaths) at ±57%, PM (kg intake) at ±55%, ODP at ±35%, ADPF at ±24% and AP at ±23%. GWP, PCOP, EP, LUC, and CWU categories all vary less than 2%.
-100% -80% -60% -40% -20% 0% 20% 40% 60% 80% 100%
GWP (kg CO2 eq)
ADPF (kg oil eq)
PCOP (kg C2H4 eq)
EP (kg PO4--- eq)
AP (kg SO2 eq)
PM (kg intake)
PM (Deaths)
ODP (kg CFC-11 eq)
LUC (kg C deficit)
CWU (L H2O eq)
Black Coal WtE

Ramboll - Kwinana Waste to Energy Project
20/25
Figure 7: WtE LCA results for Low (1.4 liters/tonne), Baseline (5.75 liters/tonne), and High (10.1 liters/tonne) diesel consumption used for waste collection prior to transport of the waste to the WtE facility.
5.5 Alternative Scenario: Ash Upcycled in Construction and Infrastructure Materials While the ash from waste combustion is assumed to go to landfill, Kwinana WtE Project Co is investigating alternative uses for the ash as a fill material in concrete for building and infrastructure projects. This would have the effect of eliminating the ash disposal impacts from the life cycle. Figure 8 shows the effect of removing the impacts from ash disposal from the WtE life cycle. Since ash disposal is a large contributor in several categories, the overall WtE impacts would further decrease. The largest decreases occur in EP, CWU, and LUC, while PM and ADPF also show large decreases.
Figure 8: WtE LCA results for the Baseline scenario and scenario where ash is used in concrete (i.e., ash disposal impacts are removed).
-100.0% -80.0% -60.0% -40.0% -20.0% 0.0% 20.0% 40.0% 60.0% 80.0% 100.0%
GWP (kg CO2 eq)ADPF (kg oil eq)
PCOP (kg C2H4 eq)EP (kg PO4--- eq)
AP (kg SO2 eq)PM (kg intake)
PM (Deaths)ODP (kg CFC-11 eq)
LUC (kg C deficit)CWU (L H2O eq)
High (10.1 l/t) Baseline (5.75 l/t) Low (1.4 l/t)
-100% -80% -60% -40% -20% 0% 20% 40% 60% 80% 100%
GWP (kg CO2 eq)
ADPF (kg oil eq)
PCOP (kg C2H4 eq)
EP (kg PO4--- eq)
AP (kg SO2 eq)
PM (kg intake)
PM (Deaths)
ODP (kg CFC-11 eq)
LUC (kg C deficit)
CWU (L H2O eq)
Without Ash Disposal Baseline

Ramboll - Kwinana Waste to Energy Project
21/25
6. DISCUSSION AND INTERPRETATION
Based on the considered life cycles of this study, the WtE Plant electricity is preferable to the current Western Australian black coal electricity generation for several impact categories – PM, AP, PCOP, ADPF, and GWP. Black coal electricity is preferable to the WtE Plant electricity CWU, LUC, ODP, and EP.
6.1 Study Limitations This study was created based on projected design of the WtE Plant at NOP. While the design conditions are guaranteed, the results of this study may not always reflect actual operating conditions. For future work, the LCA results could be updated using actual annual operating conditions to reevaluate the impacts.

Ramboll - Kwinana Waste to Energy Project
22/25
7. FUTURE WORK
Kwinana WtE Project Co would like to use the results of this LCA to improve the WtE Plant project going forward. From the LCA findings, the following improvements could be made to improve the life cycle impacts of the WtE Plant:
• Recycle or Upcycle Bottom Ash. Landfilling the bottom ash has a significant impact on CWU, LUC, and EP impacts. As illustrated in the scenario analysis in Section 5.5, recycling or upcycling the bottom ash in concrete could reduce these impacts.
• Improve Waste Collection and Transport. Waste collection has a significant impact on PM, ODP and other categories. As illustrated in the sensitivity analysis in Section 5.4, optimizing truck routes, using fuel efficient vehicles or using alternative fuel vehicles could significantly reduce these impacts.
In addition, once the WtE plant is operational the LCA results could be updated to include actual annual operating data to reevaluate the impacts.

Ramboll - Kwinana Waste to Energy Project
23/25
8. CRITICAL REVIEW
To meet ARENA’s requirements for commercialization LCAs, a critical review was conducted. The reviewer was selected based on his/her ability to meet at least one of the following requirements from ARENA: • have at least five years of professional experience in the field of LCA; • have been involved in at least five peer-reviewed LCA studies; or • be a Life Cycle Assessment Certified Practitioner (LCACP) – administered by ALCAS or the American Centre for Life Cycle Assessment. Table 10 lists the reviewer’s credentials.
Table 12: Reviewer’s Credentials
Reviewer’s Name: Anders Daamgard
Reviewer’s Affiliation: Technical University of Denmark
Reviewer’s Credentials:
The Critical Review Report and Response to Comments are listed in Appendix 1.

Ramboll - Kwinana Waste to Energy Project
32/33
APPENDIX 2
WRATE TABLES

Baseline1 Project Net Source Notes
198,097 -237,842 -435,938
Baseline is the International
Financial Institution (IFI) GHG
emission factor for marginal grid
electricity in Australia, which is
calculated to be 716.6 kg
CO2e/MWh and project is the
Kwinana WtE p. 23 Figure 8.
Non-biogenic 115,200.0 4,838.4 -110,361.6
p. 19 Table 10.
Assumes baseline waste to landfill
content has a biogenic content of
71.2% from p. 13 Table 5.
Non-biogenic content
determined by mass, not
CV or atomic carbon
value
Biogenic 284,800.0 11,961.6 -272,838.4
p. 19 Table 10.
Assumes baseline waste to landfill
content has a biogenic content of
71.2% from p. 13 Table 5.
Biogenic content
determined by mass, not
CV or atomic carbon
value
Compost (All) 0.0 0.0 0.0
Compost can include
both PAS 100 compliant
compost and other forms
of compost of beneficial
use made from source
segregated feedstock.
Digestate (Only PAS
110)0.0 0.0 0.0
Digestate must derive
from source segregated
organic feedstocks and
be PAS 110 compliant
Compost-like-output
(“CLO”)0.0 0.0 0.0
All other compost-like
digestate product should
be categorized as
Compost Like Output
(CLO), provided that it is
for 'beneficial use' (i.e.
there is a market for the
commodity)Plastics 0.0 0.0 0.0
Ferrous Metals 0.0 5,440.0 5,440.0p. 12 Table 2 (multiplied by 2 for
two lines)
Appendix 2
WRATE Project Green Impact Data Table
Kwinana Waste to Energy Project: ARENA Life Cycle Assessment
Kwinana, Australia
Materials
recycled
(tonnes per
annum)2
Greenhouse gas emissions
(tonnes CO2e per annum)
Waste to
landfill
(tonnes per
annum)
Green Metric
Page 1 of 4

Baseline1 Project Net Source Notes
Appendix 2
WRATE Project Green Impact Data Table
Kwinana Waste to Energy Project: ARENA Life Cycle Assessment
Kwinana, Australia
Green Metric
Non-ferrous metals 0.0 1,920.0 1,920.0p. 12 Table 2 (multiplied by 2 for
two lines)
Paper 0.0 0.0 0.0
Card 0.0 0.0 0.0
Glass 0.0 0.0 0.0
Mineral aggregates 0.0 74,000.0 74,000.0
p. 12 Table 2, Output o5. Bottom
ash reused as construction
aggregate (multiplied by 2 for two
lines)
Mineral aggregates for
beneficial use includes all
fly ash, bottom ash,
mixed glass not recycled
as glass, grit and other
mineralsWaste Electronic
and
Electrical Equipment
(“WEEE”)
0.0 0.0 0.0
Other 0.0 0.0 0.0
'Other' categories are all
remaining recycled
material - specify
additional categories as
necessary
Notes:
2 The mass of all materials recycled should be reported on the basis of the equivalent level of moisture content of the feedstock. This particularly applies to
Compost, CLO and Digestate and aggregates, which can increase moisture content. Accordingly, the mass of the materials recycled should not be higher
than the mass of feedstock input.
1 The Baseline Scenario for all rows except the first GHG row represents the waste collection, transport, and landfill Impacts from the WtE Plant input waste
as if it were not avoided. In the LCA report these impacts are listed as avoided impacts and are shown as a net benefit in Table 10.
Materials
recycled
(tonnes per
annum)2
Page 2 of 4

115,165 tonnes CO2e per annum
Electricity 16.8 MWe
Heat 0 MWth
Electricity 17.8 MWe
Heat 0 MWth
Renewable2 134 GWh per annum
Non-renewable2 142 GWh per annum
Total 276 GWh per annum
Renewable2 0 GWh per annum
Non-renewable2 0 GWh per annum
Total 0 GWh per annum
124,400 m3 (if known)
400,000 tonnes per annum
24.6 %
Water consumption (projects >5 MWe)
Absolute (gross) GHG emissions of the project (equivalent to the
Direct Process Emissions + any emissions associated with energy
inputs – Scope 2)1
Capacity to
produce renewable
energy (gross)
Capacity to
produce non-
renewable energy
(gross)
Electricity
exported (net of
parasitic load)
Heat exported (net of
parasitic load)
Total quantity of waste treated3
Net efficiency of energy recovery4
Appendix 2
WRATE Key Project Assumptions Table
Kwinana Waste to Energy Project: ARENA Life Cycle Assessment
Kwinana, Australia
Page 3 of 4

Appendix 2
WRATE Key Project Assumptions Table
Kwinana Waste to Energy Project: ARENA Life Cycle Assessment
Kwinana, Australia
Non-biogenic 115,200 tonnes per annum
Virgin biomass 0 oven dried tonnes per annum
Biogenic 284,800 tonnes per annum
Non-biogenic 142,228 MWh per annum
Virgin biomass 0 MWh per annum
Biogenic 134,212 MWh per annum
Notes:
6 Eligible E% or renewable energy portion of energy generated from a mixed waste stream (such as MSW, C&I & Special) from the PE RRC 2 Bin
Calculation on page 14. Fichtner. (2016, May). Technical Note No. 12. Kwinana Waste to Energy Project. Renewable Energy Components in the
Waste as Basis for Large Scale Generation Certificate.
1 Calculated direct emissions from the project air emissions plus the natural gas usage multiplied by the GHG Protocol natural gas emission factors
from http://ghgprotocol.org/sites/default/files/Emission_Factors_from_Cross_Sector_Tools_March_2017.xlsx and the IPCC AR5 Global Warming
Potentials.
4 Net efficiency, after taking account of any parasitic load.
5 This will usually be the amount of waste sent to thermal treatment EfW, but may also include any waste sent to anaerobic digestion.
Amount of material
from which energy
recovery takes
place (mass)5
Calorific content
from which energy
recovery takes
place (calorific
value)6
2 The allocation of net (not gross) electricity and/ or heat produced between renewable and non-renewable categories should be made in proportion
to the ratio of CV of biogenic vs. non-biogenic feedstock from which energy from waste is derived.
3 Waste treated at the project plant should not include rejects, but rather focus on that waste that is actually treated at the plant. For EfW projects,
the waste treated and total mass of waste from which energy recovery takes place will be the same.
Page 4 of 4


