IJST, Transactions of Civil Engineering, Vol. 39, No. C2+, pp 485-496
Printed in The Islamic Republic of Iran, 2015
© Shiraz University
LABORATORY ASSESSMENT OF THE ELECTRO-OSMOTIC CONSOLIDATION
TECHNIQUE FOR URMIA LAKE SEDIMENTS*
K. BADV1** AND K. MOHAMMADZADEH2
1,2Dept. of Civil Engineering, Urmia University, Urmia, I. R. Iran
Email: [email protected]
Abstract– The electro-osmotic consolidation is a method to improve geotechnical properties of
soft clayey soils. The feasibility of electro–osmotically induced consolidation can be examined
through the soil coefficient of electro–osmotic permeability (ke) and the electro–osmotic
coefficient of water transport (ki). Using an electro-osmotic testing cell, ke and ki parameters were
measured in Urmia Lake west coast sediments. Three electric field intensities of 40, 60 and 80
V/m were used and salinity and pH change was monitored in cathode and anode reservoirs during
the tests. ke and ki increased when soil void ratio increased. The results showed that increasing
applied electric field intensity increased the rate of water pH and salinity change at cathode
reservoir. The results for soil hydraulic conductivity (kh) and ke showed that kh is in the range of
10-10
m/s to 10-9
m/s for the range of void ratios between 0.5 to 0.8, respectively, and ke is in the
range of 5.5×10⁻⁹
to 6.6×10⁻⁹
m2/sV for the range of void ratios between 0.72 to 0.83, respectively.
The ratio of ke/kh controls electro–osmotically induced negative pore water pressure. The higher
the ratio, the higher the pore water pressure difference and the faster the consolidation is. The
range of ke/kh was between 5.2 to 9.4 m/V at the void ratios between 0.83 and 0.72, respectively.
The ratio of ke/kh increased when void ratio decreased. The high range of ke/kh proved the
effectiveness of electro-osmosis consolidation for the Urmia Lake sediments.
Keywords– Electro–osmotic consolidation, Urmia Lake sediments, electro–osmotic permeability, hydraulic
conductivity
1. INTRODUCTION
Soil improvement in fine-grained soils involves techniques that are implemented to increase strength
properties, decrease compressibility and deformation and accelerate dewatering and consolidation
processes [1-13]. Recent developments in the offshore oil and gas industry have resulted in an increasing
number of offshore platforms being erected. Land reclamation is now practiced in many coastal parts of
the world to cope with increasing demands for land [14]. There exist practical and economical needs to
accelerate dewatering and consolidation of sediments and mine tailings, for long term storage or
landfilling [6, 15-24]. Furthermore, electro-osmosis techniques have been implemented to remediate
contaminated lands [25-27]. For these reasons, geotechnical and geo-environmental engineers need to
search for innovative and practical soil improvement techniques to revise and optimize traditional soil
improvement methods. This work answers the call by investigating some parameters that influence the
electro-osmotic treatment.
When a DC field is applied in a soil-water-electrolyte system, three electro-kinetic transport
mechanisms for water, ions and soil solids are identified, i.e. electro-osmosis, electro-migration and
electrophoresis [28-31]. Electro-osmosis is the movement of soil pore fluid, electro-migration is the
Received by the editors July 11, 2014; Accepted May 6, 2015. Corresponding author

K. Badv and K. Mohammzadeh
IJST, Transactions of Civil Engineering, Volume 39, Number C2+ December 2015
486
movement of ions in the soil pore fluid and electrophoresis is the movement or tendency of movement of
soil solids.
This paper evaluates the feasibility of electro–osmotic consolidation of Urmia Lake west coast
sediments through the measurement of the coefficient of electro–osmotic permeability (ke) and electro–
osmotic coefficient of water transport (ki) using an electro-osmosis apparatus.
2. THEORY
In 1949 Leo Casagrande introduced the electro-kinetic treatment of soil to improve its geotechnical
properties [28]. Since then, electrokinetic treatment has been successfully applied to increase the strength
of sensitive deposits [1, 2, 32], transport stabilizing agents into the pores of a weakly cemented soil [33]
and dewater and consolidate mine tailings, sediments and marine deposits [6, 15, 17, 22, 24, 34, 35].
However, electrokinetic treatment in field applications has been limited by many uncertainties regarding
the influencing parameters in the process (e.g. electrode material, applied voltage, current intermittence,
void ratio and pore fluid salinity), questions about the effectiveness of the technique to generate the
desired results, the economic viability of the method, and the long term effect of the treatment.
The movement of water under the influence of the electric field is attributed to its drag by the mobile
counter ions in the electrical double layer. The electro-osmosis flow has been described by various
theories including Hemholtz-Smoluchowski model, Schmidt theory, Spiegler friction model, ion
hydration, and Gary-Mitchell approach [36]. The Hemholtz-Smoluchowski model is widely accepted by
geotechnical engineers to explain the phenomenon of electro-osmosis in soils. In the model, the coefficient
of electro-osmotic permeability, ke (m2/sV) is expressed as [31]:
e
nk
(1)
where ζ(V) is the zeta potential (negative in clayey soils), ε (F/m) is the permittivity of the fluid, µ (Ns/m2)
is the viscosity of the pore fluid, and n is the porosity of soil.
The economic viability of electro-osmotic method could be evaluated through the determination of
the quantity of water transported in applied unit electric current I(A) through the soil. The coefficient of
electro-osmosis water transport ki (L3/C, i.e. volume of transported water per unit electric charge, C) is
written by the following equations:
i
qAk
I (2)
i e eqA k I k i A (3)
= = e e e e ei
k i A k i kk
I j (4)
where q is the quantity of water transported per unit area of soil, A is the total cross sectional area of soil
(m2), I is the applied electric current (A), ie is the electric field intensity (V/m), j is the density of electric
current (A/m2), and λ is the bulk electric conductance of the soil (S/m).
During enhanced electro-osmosis consolidation, negative pore water pressure is developed within the
soil which causes the increase of effective stress and consolidation of the soil. The negative pore water
pressure is a function of the ratio of ke/kh and the electric voltage V(x) as follows [37]:
( ) ( )ew
h
ku x V x
k (5)
Laboratory assessment of the electro-osmotic consolidation …
December 2015 IJST, Transactions of Civil Engineering, Volume 39, Number C2+
487
where kh is the soil hydraulic conductivity, γw is the unit weight of water, and x is the distance from
cathode reservoir. The higher the ratio of ke/kh , the more negative the pore water pressure developed in
the soil is and hence, the more effective the electro-osmosis consolidation will be.
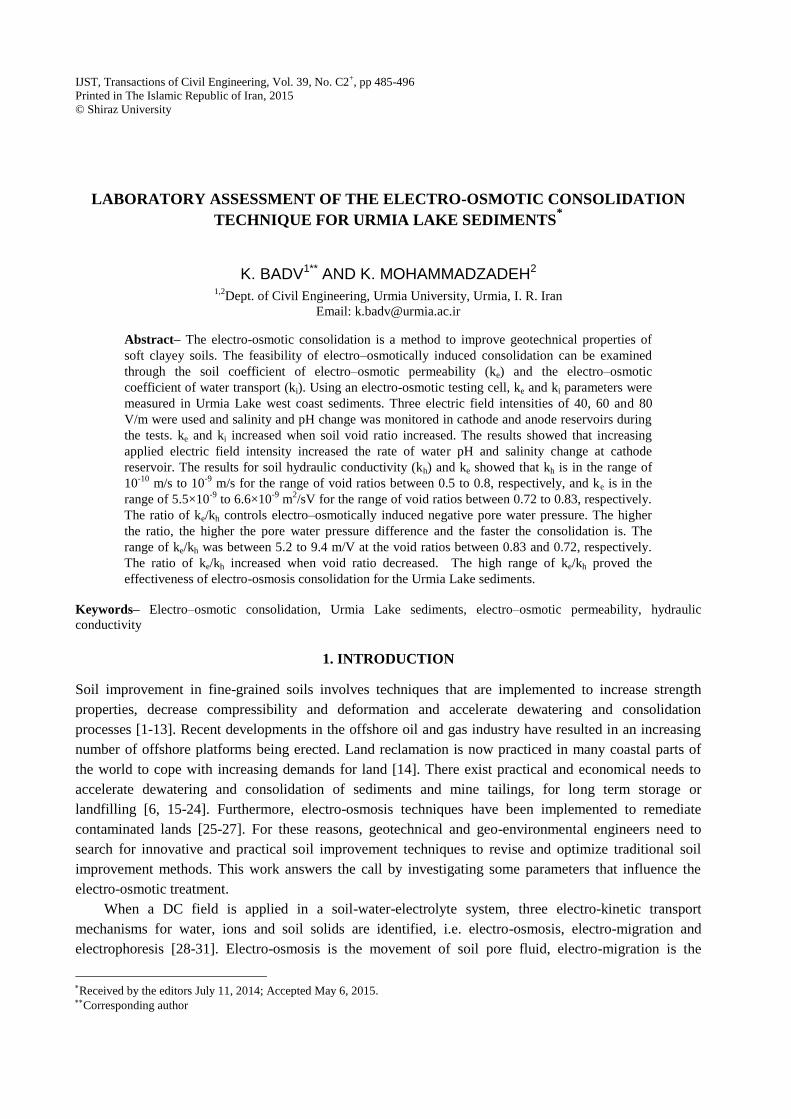
3. ELECTRO-OSMOSIS APPARATUS
The electro-osmosis (EO) apparatus used for the laboratory EO experiments is the modification of the
apparatus used by Micic [5] and Mohamedelhassan [3]. The schematic of the apparatus is depicted in Fig.
1. The apparatus consisted of an EO-cell, loading equipment, an electrical circuit, a DC power supply,
control/instrumentation devices, and volume measurement devices. The apparatus has been designed with
the following practical considerations: (1) the loading equipment can simulate the in situ stress condition,
generate a remoulded soil sample with the required void ratio, and combine electro-osmosis and
preloading consolidation; (2) the vertical electrode setup is readily implemented in the EO-cell to allow
for replacement of corroded electrodes; (3) the soil sample is of adequate size to allow for the study of
geotechnical properties after an electro-osmosis test; (4) the cell is insulated from leakage and electric
conduction; (5) the drainage condition can be adjusted to suit the required boundary conditions; (6) the
applied electric field is approximately one-dimensional; and (7) the voltage distribution, electrical
current, and water flow in the soil sample can be measured at any time during testing without power
interruption.
1- EO testing cell, 2- loading plate, 3- dial gauge, 4- water supply tank, 5- surcharge, 6- graduated cylinder, 7- base table, 8- DC power supply, 9- timer, 10- perforated Plexiglas plate, 11- copper electrode, 12- geotextile filter, 13- voltage probe
Fig. 1. Schematic of the electro-osmosis test apparatus
The EO testing cell is a rectangular tank made of 15 mm thick Plexiglas plates, with the outside
dimensions of 430 mm long, 130 mm wide, and 305 mm deep. The inside dimensions (the soil
compartment) are 250 mm long, 100 mm wide, and 250 mm deep. The EO-cell weights about 8.5 kg. A
specially designed loading plate equipped with a dial gauge was placed on the top of the soil specimen to
apply a surcharge through the dead weights. The dial gauge was used to measure the settlement of the soil.
The base plate of the EO-cell was equipped with two drainage valves at the ends of the cell to allow for
drainage of expelled water from the soil during treatment. Therefore, drainage from the soil sample could
be controlled at either end of the sample. Geotextile filters were placed at both sides of the soil sample,
i.e., behind the cathode and anode to prevent loss of soil through the drainage channel. Expelled water to
the cathode reservoir was collected in the graduated cylinder beside the cell, as shown in Fig. 1.

K. Badv and K. Mohammzadeh
IJST, Transactions of Civil Engineering, Volume 39, Number C2+ December 2015
488
Two electrodes were used to generate an electric field in the soil sample via a DC power supply, as
shown in Fig. 1. The electrodes were made of 1 mm thick copper mesh with 8.5 mm nominal openings.
The horizontal spacing between the electrodes was 250 mm. This arrangement generates an approximately
uniform horizontal electric field in the soil sample. A voltage was applied by a DC power supply with a
maximum capacity of 3.5 A and 35 V. The power supply was connected in series with an automatic
control switcher (timer) for current intermittence and an ammeter and in parallel with a voltmeter. The
voltage distribution across the sample was measured by four voltage probes which were fastened onto the
bottom of the cell as shown in Fig. 1. The probes were inserted about 30 mm into the soil and connected to
a voltmeter to measure the voltage distribution across the soil sample.
4. MATERIALS AND METHODS
a) Physical and chemical testing on soil samples
The Urmia Lake is the second largest salt lake of the world in the northwest of Iran. The site in which the
soils samples were taken is located in the west coast of the Urmia Lake with a distance of 23 Km east of
Urmia City, Iran. The geotechnical investigations conducted on the site have revealed that the soil deposits
up to 14 meters deep mainly consist of alternate layers of soft clayey and silty deposits (CL-ML, CL and
ML) with occasional sand lenses in between the fine grained layers [38]. The soil samples were recovered
from 1 – 1.5 m deep in the ground surface and were collected in plastic bags to retain the natural moisture
content.
The soil mechanical tests were performed on the collected soil samples to identify the soil major
geotechnical (physical) properties. The soil pH and salinity and the bulk soil and the pore water electric
resistivity were determined as part of the soil chemical properties. Table 1 summarizes the soil physical
and chemical properties.
Table 1. Soil physical and chemical properties
Property Magnitude Property Magnitude
Liquid limit (%) 27 Percent sand 23
Plastic limit (%) 29 Percent silt 59
Unified soil classification CL-ML Percent clay 18
Specific gravity 2.67 pH 8.3
Range of natural water content (%) 28-30 Salinity (g/L) 2
Optimum water content (%) 16 Bulk soil electrical
Maximum dry unit weight (kN/m3) 17.2 resistivity (S/m) 0.115
Bulk unit weight (kN/m3) 20 Soil pore water electrical
resistivity (S/m)
0.375
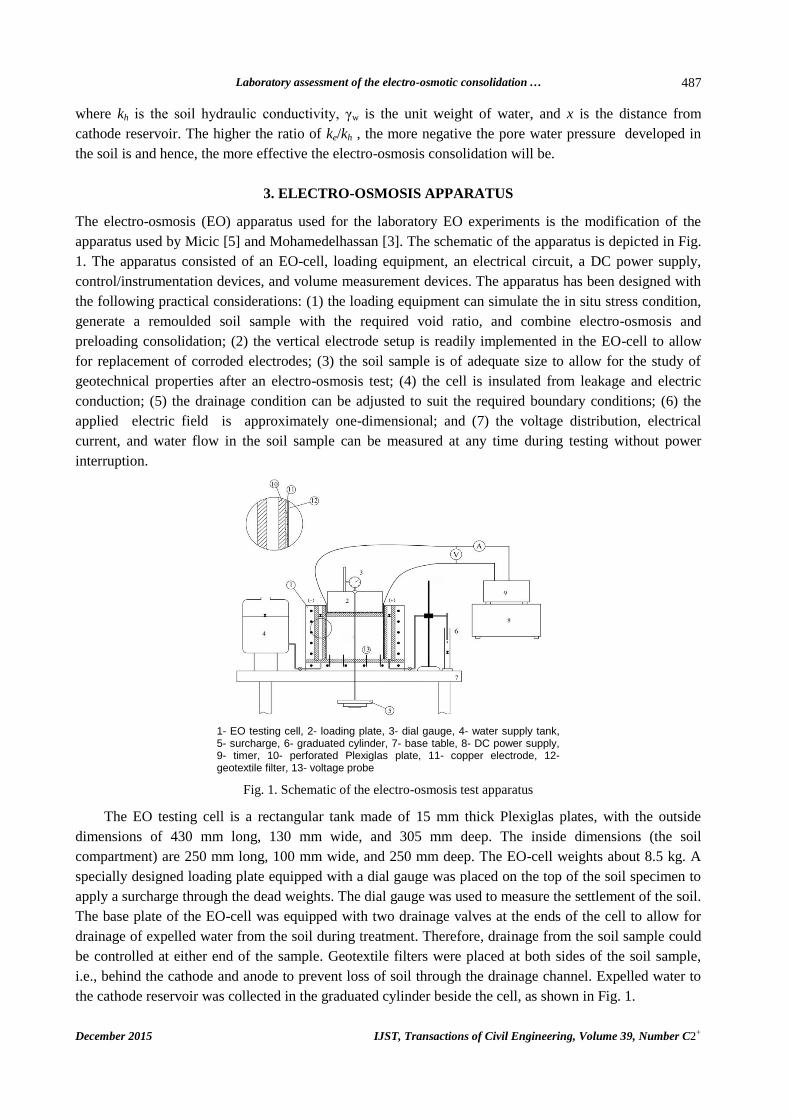
The consolidation tests were performed on the soil samples to determine the soil consolidation
properties. Figure 2 shows the log(σ’v)-e curve and Table 2 shows the consolidation parameters obtained
for the tested soil sample. In Table 2, av, mv and Cv refer to the coefficient of compressibility, the
coefficient of volume change, and the coefficient of consolidation, respectively. The compression index
(Cc) of 0.238 and the recompression index (Cr) of 0.018 were obtained from Fig. 2.
Laboratory assessment of the electro-osmotic consolidation …
December 2015 IJST, Transactions of Civil Engineering, Volume 39, Number C2+
489
Fig. 2. Consolidation curve for the tested soil sample
Table 2. Consolidation parameters for the tested soil
b) EO testing program and methodology
Twelve electro-osmosis tests were performed on the soil samples under different test conditions. Four
different surcharges of 10 kPa, 15 kPa, 20 kPa, and 30 kPa were applied on the soil. The electric voltages
of 10V, 15V, and 20V were used for any EO test under a prescribed surcharge. The selection of 4
surcharges of 10, 15, 20 and 30 kPa in the EO tests was based on the approximate heights of 0.5 m, 0.8 m,
1.0 m and 1.5 m road embankment constructed on the Urmia Lake west coast sediments, the place where
the soil samples were taken. The selection of the voltages was based on the data reported in the literature
for similar soils [4]. Each EO test was repeated once to ensure the reproducibility of the test results and
similar results were obtained for duplicated tests. Application of each surcharge caused the soil samples to
have different void ratios at the start of the EO test. During each EO test, the electro-osmosis flow volume
(q), change in electric field (E) and electric current (I), and change in pH and salinity were measured.
The EO testing methodology is described as follows: the soil sample was installed in the soil
compartment of the EO cell and its height was measured. The loading plate was installed on top of the
soil, the surcharge was applied and the sample was allowed to consolidate under the applied surcharge.
Depending on the applied surcharge, 95% of consolidation occurred between 10 and 20 days. At the end
of consolidation, the settlement and final height of the soil was determined. After consolidation of the soil
sample, the water levels in the cathode and anode reservoirs were adjusted at the surface of the soil. The
electric system was turned on and the electro-osmosis test commenced. The EO test elapsed for about 8
hours and during the test, the volume of infiltrated water towards the cathode within a prescribed time
span was measured, the electric potential between two electrodes and within the soil was measured, and
samples were collected from the cathode and anode reservoirs for pH and salinity measurements. At the
end of each EO test, the weight, the dimensions, and the water content of the tested soil were measured
and the unit weight and void ratio of the soil sample was calculated.
cv
×10-7
(m2/N)
mv
×10-7
(m2/N)
av
×10-7
(m2/N)
ef e◦ σ’v
(kN/m2)
6.1 2.5 4.6 0.83 0.84 25
4.9 2.5 4.5 0.82 0.83 50
3.9 2.4 4.4 0.80 0.82 100
3.6 2.1 3.9 0.76 0.80 200
3.2 2.0 3.5 0.68 0.76 400

K. Badv and K. Mohammzadeh
IJST, Transactions of Civil Engineering, Volume 39, Number C2+ December 2015
490
c) Hydraulic conductivity tests
As described earlier, the ratio of ke/kh controls the electro–osmotic pore pressure. The higher the
ratio, the higher the electro-osmotically induced negative pore water pressure and faster the soil electro-
osmosis consolidation [37]. The soil hydraulic conductivity was measured with triaxial hydraulic
conductivity apparatus under 15 kPa, 20 kPa, and 25 kPa effective stresses and Kh of 1.8×10⁻¹⁰
m/s,
1.4×10⁻¹⁰
m/s, and 1.0×10⁻¹⁰
m/s was obtained, respectively.
5. RESULTS AND DISCUSSION
As described earlier, 12 EO tests were performed to fully investigate the viability of the electro-osmosis
method on the Urmia Lake west coast sediments. At the end of each EO test, the following graphs were
plotted: (1) the volume of collected water in the cathode reservoir against the elapsed test time and against
the time within which the electric current was applied (two plots), (2) the change in electric voltage
against distance from anode within the soil sample, (3) magnitude of pH in cathode and anode reservoirs
against elapsed time, (4) magnitude of salinity of cathode and anode reservoirs against elapsed time, and
(5) electric conductance in the cathode and anode reservoirs against elapsed time.
To allow for the briefness of the text, only plots for EO test under 15 kPa surcharge are shown as
follows. The initial water content and unit weight of the soil sample was 35% and 18.4 kN/m3,
respectively. After consolidation under 15 kPa surcharge, the water content and unit weight of the soil
sample was 28.5% and 19.2 kN/m3, respectively. Decrease of the soil water content and increase of the
soil unit weight are the obvious effects of the soil consolidation under 15 kPa applied surcharge. The pH,
salinity, and electric conductance of the soil pore water was 8.3, 1.9 gr/L, and 0.376 S/m, respectively.
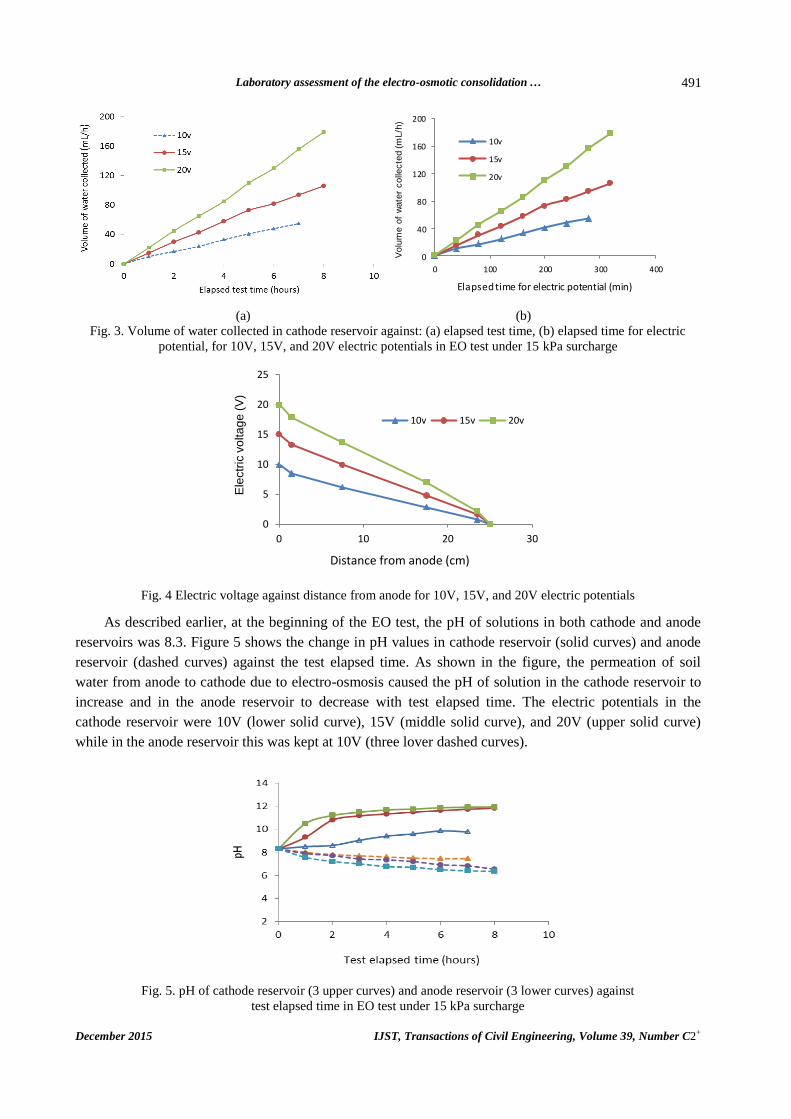
Three electric potentials of 10 V, 15 V, and 20 V were used between the two electrodes. Figures 3a and 3b
show the change in volume of the collected water in the cathode reservoir against the elapsed time of the
test and time within which the electric potential is applied (for three electric potentials), respectively. As
shown in Figs. 3a and 3b, by increasing the elapsed test time and time within which the electric potential
is applied, the volume of collected water in the cathode reservoir increased. As described earlier, when the
electric field was applied to the soil, cations responded to move in the direction of the electric field while
anions moved in the direction opposite the electric field. The double layer accounts for the fact that there
must be more cations than anions to achieve neutrality and thus net momentums were imparted on the
water molecules by cations and caused them to migrate toward the cathode reservoir. The longer the
applied electric filed, the more the water moved towards the cathode reservoir. There is a direct
relationship between the intensity of the electric potential and the amount of migrated water towards the
cathode. As shown in Figs. 3a and 3b, when the electric potential was increased, more water was collected
at the cathode reservoir.
Figure 4 shows the change in electric voltage against distance from anode within the soil sample for
three electric potentials. As shown in Fig. 4, when distance from anode increases, the electric voltage
decreases. Also, when the electric potential increased, the electric voltage gradient (ie, see Table 3) across
the soil increased which resulted in more water being dragged towards the cathode reservoir.
Table 3. Results of EO test on the soil sample with 15 kPa consolidation pressure
ke
(m2/s.V)
kE
(m2/s.V)
ki
(m3/C)
q
(ml/h)
λ
(S/m)
ie
(V/m)
E
(V/m)
A
( )
I
(A)
V
(V)
5.4×10⁻⁹
4.6×10⁻⁹
4.1×10⁻⁸
14.8 0.131 33.4 40 227.5 0.10 10
6.0×10⁻⁹
5.2×10⁻⁹
4.4×10⁻⁸
25.5 0.114 52.8 60 227.5 0.16 15
6.4×10⁻⁹
5.9×10⁻⁹
5.1×10⁻⁸
39.0 0.113 74.0 80 227.5 0.21 20
Laboratory assessment of the electro-osmotic consolidation …
December 2015 IJST, Transactions of Civil Engineering, Volume 39, Number C2+
491
0
40
80
120
160
200
0 100 200 300 400
Vo
lum
e o
f w
ate
r c
olle
cte
d (
mL
/h)
Elapsed time for electric potential (min)
10v
15v
20v
(a) (b)
Fig. 3. Volume of water collected in cathode reservoir against: (a) elapsed test time, (b) elapsed time for electric
potential, for 10V, 15V, and 20V electric potentials in EO test under 15 kPa surcharge
0
5
10
15
20
25
0 10 20 30
Ele
ctr
ic v
olta
ge
(V
)
Distance from anode (cm)
10v 15v 20v
Fig. 4 Electric voltage against distance from anode for 10V, 15V, and 20V electric potentials
As described earlier, at the beginning of the EO test, the pH of solutions in both cathode and anode
reservoirs was 8.3. Figure 5 shows the change in pH values in cathode reservoir (solid curves) and anode
reservoir (dashed curves) against the test elapsed time. As shown in the figure, the permeation of soil
water from anode to cathode due to electro-osmosis caused the pH of solution in the cathode reservoir to
increase and in the anode reservoir to decrease with test elapsed time. The electric potentials in the
cathode reservoir were 10V (lower solid curve), 15V (middle solid curve), and 20V (upper solid curve)
while in the anode reservoir this was kept at 10V (three lover dashed curves).
Fig. 5. pH of cathode reservoir (3 upper curves) and anode reservoir (3 lower curves) against
test elapsed time in EO test under 15 kPa surcharge

K. Badv and K. Mohammzadeh
IJST, Transactions of Civil Engineering, Volume 39, Number C2+ December 2015
492
0
1
2
3
4
0 5 10
Salin
ity
(g/L
)
Test elapsed time (hours)
0.2
0.3
0.4
0.5
0.6
0 2 4 6 8 10
Ele
ctr
ic c
onducta
nce (
S/m
)
Test elapsed time (hours)
(a) (b)
Fig. 6. (a) Salinity, (b) Electric conductance, in the cathode and anode reservoirs against
test elapsed time in EO test under 15 kPa surcharge
Figure 6a shows the change in salinity of solutions in cathode and anode reservoirs against the test
elapsed time. In the figure, the upper curve represents cathode reservoir in 20V test, the middle curve
represents cathode reservoir in 15V test, and the lower curve represents the anode reservoir. As shown in
Fig. 6a, the salinity of solution in cathode reservoir increased with time while the salinity of solution in
anode reservoir remained constant.
Fig. 6b shows the change in electric conductance of solutions in cathode and anode reservoirs against
the test elapsed time. In the figure, the upper curve represents cathode reservoir in 20V test, the middle
curve represents cathode reservoir in 15V test, and the lower curve represents the anode reservoir. As
shown in the figure, the electric conductance of solution in cathode reservoir increased with time while in
the anode reservoir it remained constant.
When the electric field was applied to the soil, at the anode, water was oxidized releasing oxygen and
creating protones (H+) resulting in an acid front moving towards the cathode. This caused the pH, salinity,
and electric conductance at the cathode reservoir to increase with time. The higher pH increased the water
movement through the soil towards the cathode reservoir. At the cathode, hydrogen evolved and a base
front of hydroxyl ions (OH-) was generated and moved towards the anode.
Table 3 summarizes the results of EO test on the soil sample with 15 kPa consolidation pressure. In
the table, E is the intensity of electric field between two electrodes (V/m), and kE is the coefficient of
electro-osmosis permeability for a given electric field intensity (E). The other parameters in the table are
as described earlier.
Figures 7a and 7b show the relationship between the coefficients of electro-osmosis permeability (ke)
and electro-osmosis water transport (ki) with the void ratio of tested soil, respectively, for three electric
field intensities. As shown in the figures, the general trend is that by increasing the soil void ratio, the ke
and ki values increase.
The ratio of ke/kh was calculated for three electric field intensities and for the range of soil void ratios
and are summarized in Table 4 and plotted in Fig. 8. As shown in Table 4 and Fig. 8, the ratio of ke/kh is in
the range of 5.2 to 9.4 m/V and it increased when the sediments void ratio decreased. As described earlier,
the development of the negative pore water pressure due to electro-osmosis, is a function of the ratio of
ke/kh and the electric voltage V(x). Hence, the higher range of the ke/kh in the conducted electro-osmosis
tests on the Urmia Lake sediments, is an indication of the development of high negative pore water
pressure, resulting in high effective stresses and hence, enhanced consolidation. This could be considered
as the economic viability of the electro-osmosis consolidation technique for the Urmia Lake sediments in
the laboratory scale.

Laboratory assessment of the electro-osmotic consolidation …
December 2015 IJST, Transactions of Civil Engineering, Volume 39, Number C2+
493
(a) (b)
Fig. 7. (a) The coeffieint of electro-osmosis permeability (ke), (b) The coefficient of electro-osmosis water transport
(ki), against soil void ratio for three electric field intensities (E) in EO test under 15 kPa surcharge
4
5
6
7
8
9
10
0.7 0.75 0.8 0.85
ke/k
h(m
/V)
Void ratio (e)
40 v/m 60 v/m 80 v/m
Fig. 8. The ratio of ke/kh against soil void ratio for three electric field
intensities (E) in EO test under 15 kPa surcharge
Table 4. ke/kh values (m/V) against the soil void ratios in three electric filed intensities
Void ratio Electric filed intensity, E (V/m)
40 60 80
0.72 8.1 8.9 9.4
0.74 7.5 8.9 8.8
0.76 6.8 7.6 8.0
0.83 5.2 5.4 NA
6. SUMMARY AND CONCLUSIONS
The feasibility of electro–osmotic technique was evaluated in the sediments of Urmia Lake west coast by
laboratory tests. An electro-osmosis test apparatus was fabricated to determine the key parameters
including the coefficient of electro–osmosis permeability (ke) and electro–osmosis coefficient of water
transport (ki). Prior to the EO tests, the soil samples were consolidated at 10 kPa, 15 kPa, and 20 kPa
surcharges. Then, EO tests were conducted under three electric field intensities of 40 V/m, 60 V/m, and 80
V/m and ke and ki parameters were determined. Using triaxial hydraulic conductivity apparatus, the
hydraulic conductivity of the soil samples was determined and the ratio of ke/kh was calculated to
K. Badv and K. Mohammzadeh
IJST, Transactions of Civil Engineering, Volume 39, Number C2+ December 2015
494
investigate the effectiveness of the electro-osmosis technique in consolidation of the tested sediments. The
following conclusions were made from this experimental study:
(1) The results showed that the coefficient of electro-osmosis permeability (ke) at the electric field
intensities of 40 V/m, 60 V/m, and 80 V/m and for the range of soil void ratios of 0.72 to 0.83, is in
the range of 5.0×10⁻⁹
m2/s.V to 6.6×10
-9 m
2/s.V with the average value of 5.9×10
-9 m
2/s.V.
(2) The coefficient of electro-osmosis permeability increased when the soil void ratio increased.
(3) The average electro-osmosis coefficient of water transport (ki) for the tested Urmia Lake sediments is
4.5×10⁻⁸
m3/C and its magnitude increased when the intensity of electric field and the soil void ratio
increased.
(4) The sediments hydraulic conductivity was measured with triaxial hydraulic conductivity apparatus
under 15 kPa, 20 kPa, and 25 kPa effective stresses and Kh values of 1.8×10⁻¹⁰
m/s, 1.4×10⁻¹⁰
m/s, and
1.0×10⁻¹⁰
m/s were obtained, respectively
(5) For the range of tested electric field intensities and sediments void ratios, the ratio of ke/kh was in the
range of 5.2 to 9.4 m/V. This high range of ke/kh proved the effectiveness of the enhanced electro-
osmosis consodidation technique for the Urmia Lake sediments. The magnitude of ke/kh increased
when the sediments void ratio decreased.
Acknowledgments: This paper forms part of a research program in geoenvironmental engineering being
conducted at the Environmental Geotechnique Research Laboratory at the Department of Civil
Engineering in Urmia University, Iran. The funding for this research was made possible by the award of a
research grant to K. Badv from Urmia University of Iran.
REFERENCES
1. Lo, K.Y., Ho, K.S. & Inculet, I. I. (1991a). Electro-osmotic strengthening of soft sensitive clay. Canadian
Geotechnical Journal, Vol. 28, No. 1, pp. 62-73.
2. Lo, K.Y., Ho, K. S. & Inculet, I. I. (1991b). Field test of electro-osmotic strengthening of soft sensitive clay.
Canadian Geotechnical Journal, Vol. 28, No. 1, pp. 74-83.
3. Mohamedelhassan, E. E. (2002). Soil improvement using electrokinetic and vacuum technique. Ph.D. Thesis,
Department of Civil and Environmental Engineering, The University of Western Ontario, London, Canada, p.
226.
4. Mohamedelhassan, E. E. (2009). Electrokinetic strengthening of soft clay. Ground Improvement, Vol. 162, No.
4, pp. 157-166.
5. Micic, S. (2002). Electro-kinetic improvement of offshore foundations. Ph.D. Thesis, Department of Civil and
Environmental Engineering, The University of Western Ontario, London, Canada, p. 276.
6. Lockhart, N. C. (1981). Sedimentation and electro-osmotic dewatering of coal washer slimes. Fuel, Vol. 01.6 0,
pp. 919-923.
7. Mok, C. K. (2006). Design and modelling of electro-osmotic dewatering. Ph.D. Thesis, School of Civil
Engineering and Geosciences, University of Newcastle upon Tyne, Australia, p. 160.
8. Marshall, O., Grey, C. E., Malone, P. & Weiss, C. (2010). Moisture control using intelligent single well electro-
osmotic dewatering systems. U.S. Army Engineer Research and Development Center (ERDC) and Construction
Engineering Research Laboratory (CERL), U.S.A, OMB No. 0704-0188, p. 27.
9. Mckinney, J. P. (2010). Design of electrolytic dewatering systems for phosphatic clay suspensions. Ph.D.
Thesis, Department of Chemical Engineering, University of Florida, U.S.A., p. 103.
10. Yang, L., Nakhla, G. & Bassi, A. (2005). Electro-kinetic dewatering of oily sludges. Journal of Hazardous
Material, Vol. B125, pp. 130–140.

Laboratory assessment of the electro-osmotic consolidation …
December 2015 IJST, Transactions of Civil Engineering, Volume 39, Number C2+
495
11. Paczkowska, B. (2005). Electro-osmotic introduction of methacrylate polycations to dehydrate clayey soil.
Canadian Geotechnical Journal, Vol. 42, pp. 780–786.
12. Fazeli, A., Habibagahi, G. & Ghahramani, A. (2009). Shear strength characteristics of Shiraz unsaturated silty
clay. Iranian Journal of Science and Technology, Transaction B, Engineering, Vol. 33, No. B4, pp. 327-341.
13. Rahnema, A., Habibagahi, G. & Ghahramani, A. (2003). A new simple shear apparatus for testing unsaturated
soils. Iranian Journal of Science and Technology, Transaction B, Engineering, Vol. 27, No. 1, pp. 73-80.
14. Chien, S.C., Ou, C.Y. & Hsieh, P.G. (2013). Application of electro-osmotic chemical treatment to improve soft
clay in practice. Proceedings of the Twenty-third International Offshore and Polar Engineering, Anchorage,
Alaska, USA, June 30-July 5, 2013.
15. Buckland, D. G., Shang, J. G. & Mohamedelhassan, E. (2000). Electro-kinetic enhanced sedimentation of
contaminated Welland River sediments. Canadian Geotechnical Journal, Vol. 37, No. 4, pp. 735-747.
16. Lo, K.Y., Micic, S., Shang, J.Q., Lee, N.Y. & Lee, S.W. (2000). Electrical strengthening of a marine sediment.
International Journal of Offshore and Polar Engineering, ISOPE, Vol. 10, No. 2, pp. 137-144.
17. Sprute, R. H. & Kelsh, D. J. (1976). Dewatering and densification of coal waste by direct current laboratory
tests. United States Bureau of Mines Report, No. 8197.
18. Larue, O., Wakeman, R., Tarleton, E. & Vorobiev, E. (2006). Pressure electro-osmotic dewatering with
continuous removal of electrolysis products. Chemical Engineering Science, Vol. 61, pp. 4732–4740.
19. Reddy, K.R., Urbanek, A. & Khodadoust, A. P. (2006) Electro-osmotic dewatering of dredged sediments:
bench-scale investigation. Journal of Environmental Management, Vol. 78, pp. 200–208.
20. Saveyn, H., Pauwels, G., Timmerman, R. & der Meeren, P. V. (2005). Effect of polyelectrolyte conditioning on
the enhanced dewatering of activated sludge by application of an electric field during the expression phase.
Water Research, Vol. 39, pp. 3012–3020.
21. McKinney, J. P. & Orazem, M. E. (2009). Electrokinetic methods for dewatering of phosphatic clay slurries.
ECS Transactions, Vol. 19, No. 26, pp. 35–43.
22. Fourie, A. B., Johns, D. G. & Jones, C.J.F.P. (2007). Dewatering of mine tailings using electrokinetic
geosynthetics. Canadian Geotechnical Journal, Vol. 44, pp. 160–172.
23. Shang, J. Q. (1997). Electrokinetic dewatering of clay slurries as engineered soil covers. Canadian Geotechnical
Journal, Vol. 34, pp. 78–86.
24. El-Shall, H. & Zhang, P. (2004). Process for dewatering and utilization of mining wastes. Mineral Engineering,
Vol. 17, pp. 269–277.
25. Ottosen, L. M. (2014). Electrokinetics in the removal of metal ions from soils. Encyclopedia of Applied
Electrochemistry, DOI 10.1007/978-1-4419-6996-5_87, PP. 742-746.
26. Zhou, M., Zhu, S., Liu, Y. & Wang, H. (2014). Electrokinetic remediation of fluorine-contaminated soil using
approaching cathodes. Journal of CLEAN Soil Air Water, Vol. 42, Issue 12, pp. 1771-1775.
27. Alcántara, M. T., Gómez, J., Pazon, M. & Sanromán, M. A. (2012). Electrokinetic remediation of lead and
penanthrene polluted soils. Geoderma, Vol. 173–174, pp. 128–133.
28. Casagrande, L. (1949). Electro-osmosis in soils. Geotechnique, Vol. 1, No. 3, pp. 159-177.
29. Gray, D. H. & Mitchell, J. K. (1967). Fundamental aspects of electro-osmosis in soils. Journal of Soil Mechanics
and Foundation Engineering Division, ASCE, Vol. 93, No. 6, pp. 178–205.
30. Casagrande, L. (1983). Stabilization of soils by means of electro-osmosis – State of the art. Journal of Boston
Society of Civil Engineers, ASCE, Vol. 69, No. 2, pp. 255-302.
31. Mitchell, J. K. (1993). Fundamentals of soil behaviour. 2nd
Edition, John Wiley and Sons Inc., New York.
32. Bjerrum, L., Moum, J. & Eide, O. (1967). Application of electro-osmosis to a foundation problem in a
Norwegian quick clay. Geotechnique, Vol. 17, pp. 214-235.
33. Ozkan, S., Gale, R. J. & Seals, R. K. (1999). Electro-kinetic stabilization of kaolinite by injection of A13+ and
PO43- ions. Ground Improvement, Vol. 3, pp. 135-144.
K. Badv and K. Mohammzadeh
IJST, Transactions of Civil Engineering, Volume 39, Number C2+ December 2015
496
34. Shang, J. Q. & Lo, K. Y. (1997). Electro-kinetic dewatering of a phosphate clay. Journal of Hazardous
Materials, Vol. 55, No. 1-3, pp. 117-133.
35. Mohammadzadeh, K. (2012). Experimental investigation on the electro-osmotic method of consolidation of the
Urmia Lake shoreline soft deposits. M.Sc. Thesis, Department of Civil Engineering, Urmia University, Urmia,
Iran, p. 114 (In Persian).
36. Yeung, A. T. (1994). Electro-kinetic flow process in porous media and their applications. Advances in Porous
Media, Vol. 2, pp. 307-393.
37. Esrig, M. I. (1968). Pore pressure, consolidation and electrokinetics. Journal of the Soil Mechanics and
Foundations Division, Vol. 94, No. 4, pp. 899-921.
38. Darya-Khak-Pey Consulting Engineers (2005). Geotechnical investigation of Shahid Kalantari Highway in
Salmas Bridge Junction in Km 20+60, Tehran, Iran (In Persian).


