Laboratory exams in the diagnosis of CNS infections
Dr Paul Matthew Pasco
June 7, 2008
Lab exams for bacterial meningitis CSF GS/CS CSF cytology (+) of bacterial antigens in CSF Neuroimaging Molecular techniques (PCR)

CSF culture & sensitivity
Gonzaga (1967): (+) in 57/85 patients Pneumococcus in 26%; G(-) bacilli in 33%
Punsalan (1988) = (+) in 9/12 Handumon (2000) = (+) in 11/50 adults
Reyes (1979): 82 children Most common: G(-) bacilli in 53.7% Others: S. pneumoniae, N. meningitidis
Kho (1992): 50 culture-proven cases; G(+) in 62% (S. pneumoniae), G(-) in 38%

CSF cytology & GS (Reyes 1986)
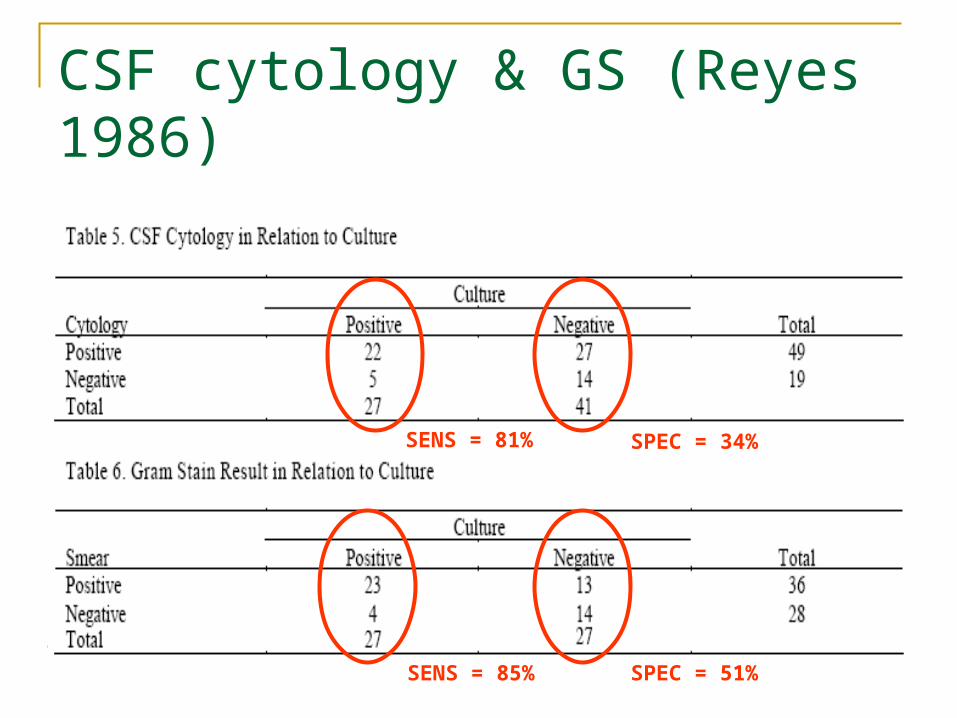
CSF cytology & GS (Reyes 1986)
SENS = 81% SPEC = 34%
SENS = 85% SPEC = 51%

How do we use sensitivity & specificity? SnNout = for a test with high sensitivity, a
negative result rules out the diagnosis SpPin = for a test with high specificity, a
positive result rules in the diagnosis A perfect test is both a SpPin & SnNout A useless test: SENS + SPEC – 100 = 0
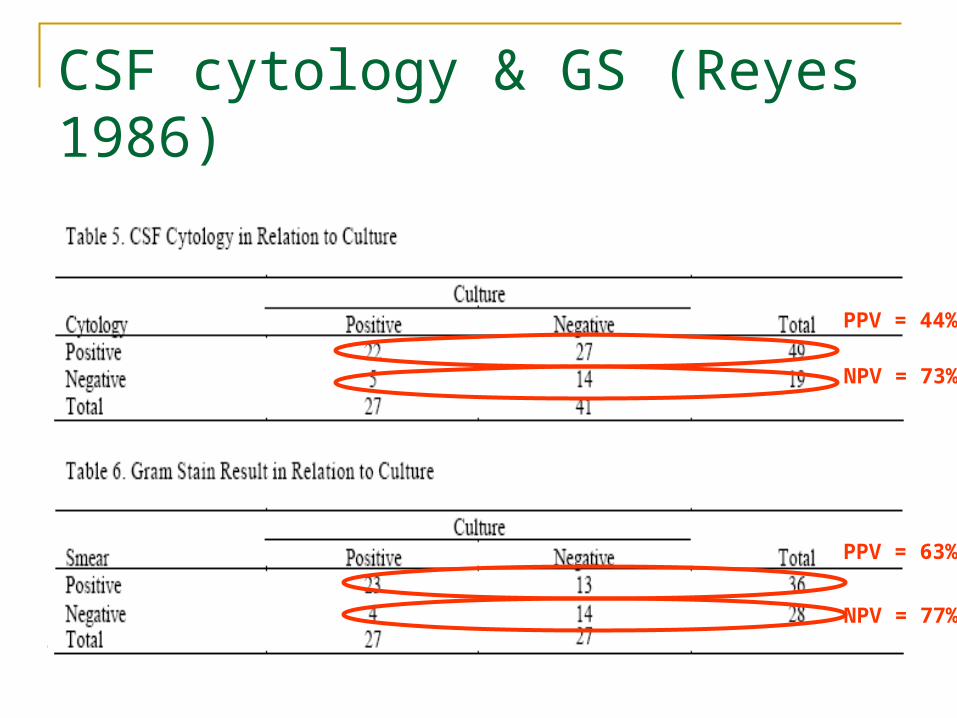
CSF cytology & GS (Reyes 1986)
PPV = 44%
NPV = 73%
PPV = 63%
NPV = 77%

Likelihood ratios
LR(+) = probability of (+) test for a person with the diseaseprobability of (+) test for a person
without the disease
LR(-) = probability of (-) test for a personwith the disease
probability of (-) test for a personwithout the disease
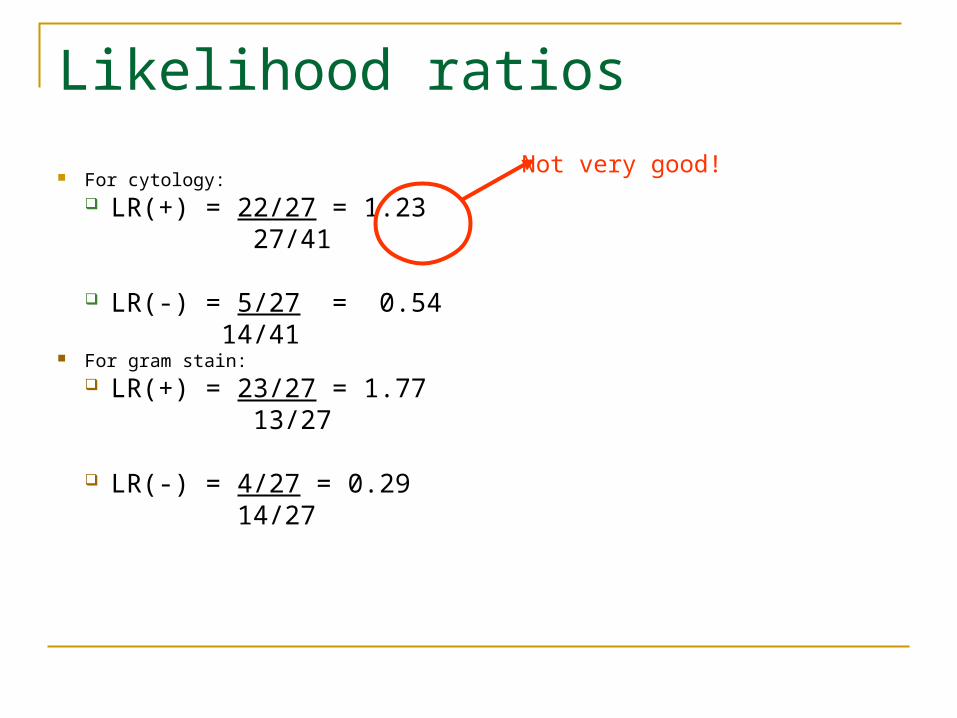
Likelihood ratios
For cytology: LR(+) = 22/27 = 1.23
27/41
LR(-) = 5/27 = 0.54 14/41
For gram stain: LR(+) = 23/27 = 1.77
13/27
LR(-) = 4/27 = 0.29 14/27
Not very good!

A likelihood ratio nomogram

How do we estimate our patient’s pre-test probability of having the disease? Clinical experience Local prevalence statistics Information from databases Original studies to assess diagnostic tests Studies devoted specifically to determining
pre-test probabilities
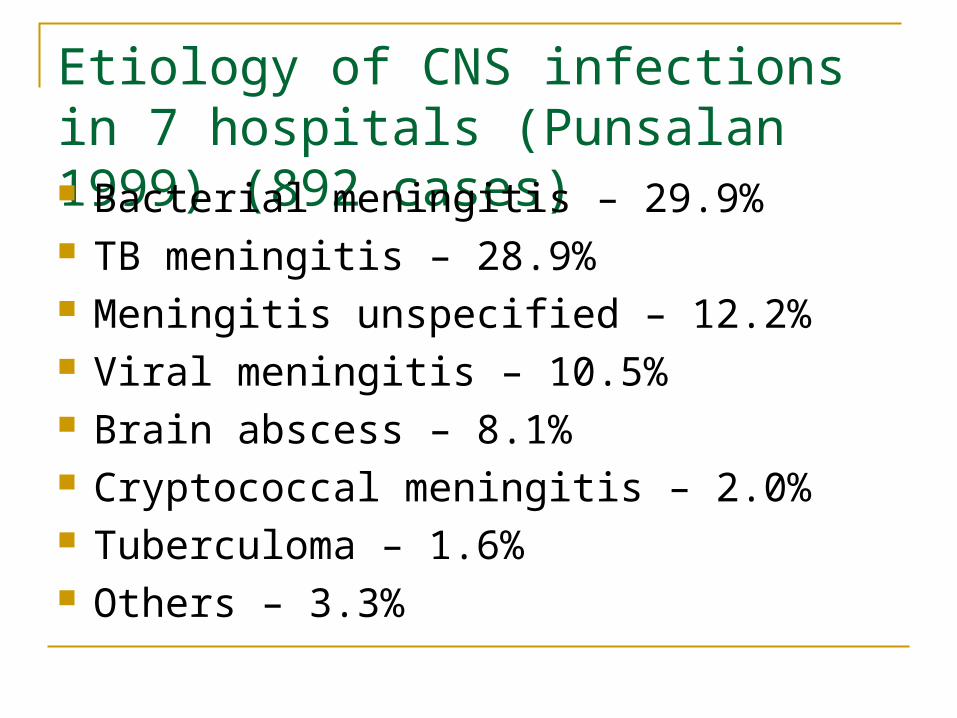
Etiology of CNS infections in 7 hospitals (Punsalan 1999) (892 cases) Bacterial meningitis – 29.9% TB meningitis – 28.9% Meningitis unspecified – 12.2% Viral meningitis – 10.5% Brain abscess – 8.1% Cryptococcal meningitis – 2.0% Tuberculoma – 1.6% Others – 3.3%

Local experience in bacterial meningitis (Handumon 2000) Typical clinical picture:
Drowsy, 50% Meningismus, 85% Seizure, 26% Focal neurological deficit, 18% Fever + headache + sensorial change, 85%
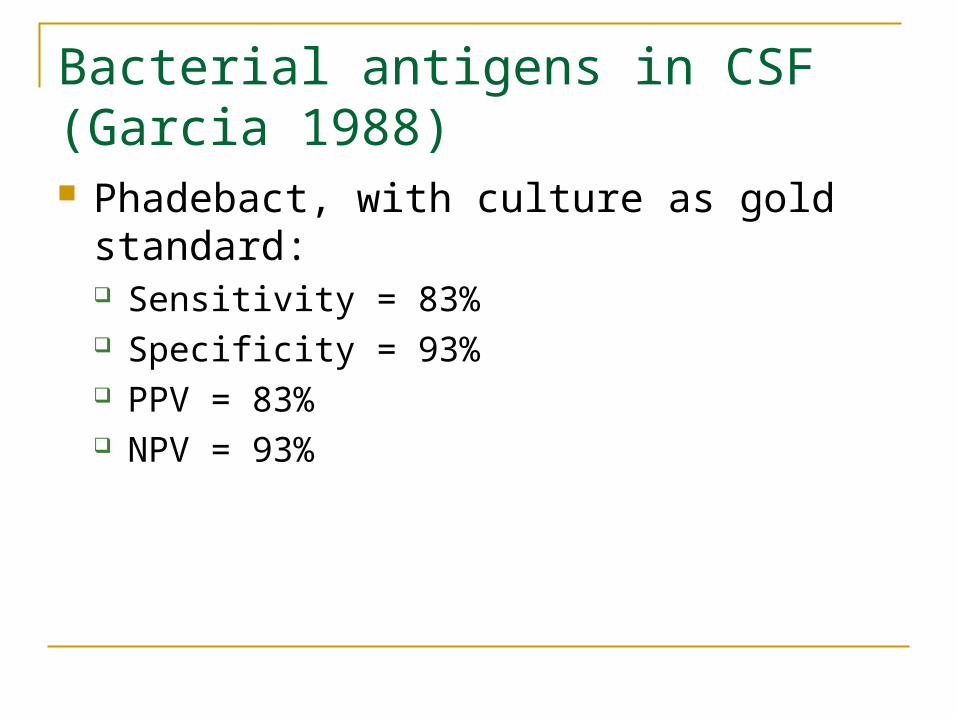
Bacterial antigens in CSF (Garcia 1988) Phadebact, with culture as gold standard:
Sensitivity = 83% Specificity = 93% PPV = 83% NPV = 93%
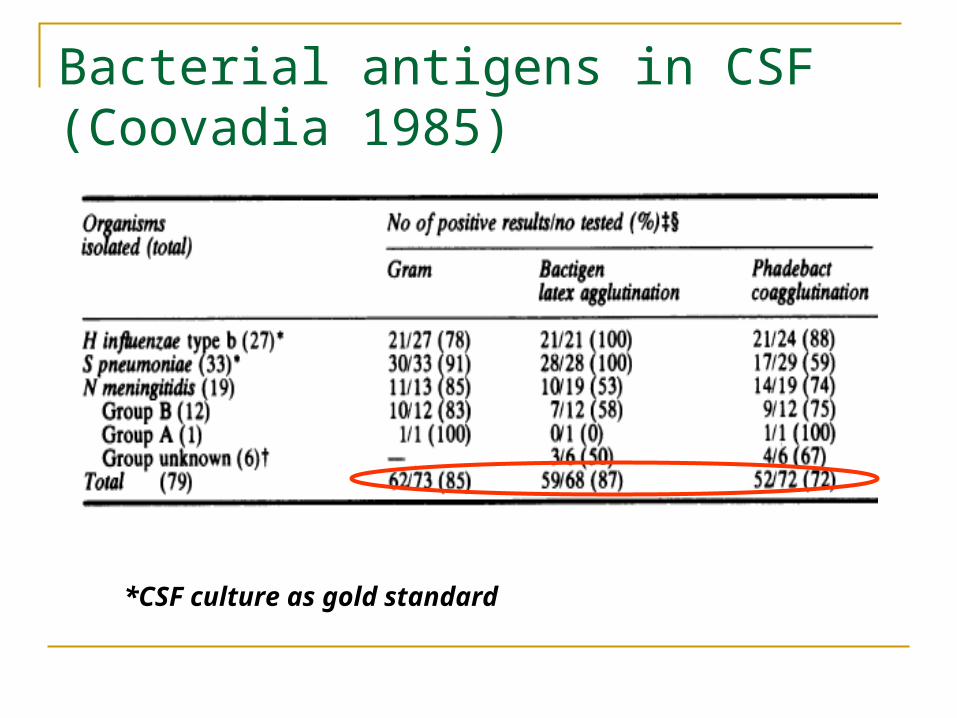
Bacterial antigens in CSF (Coovadia 1985)
*CSF culture as gold standard

Other tests on CSF
CSF CRP: sensitivity of 61%, specificity of 100%, PPV of 100%, NPV of 80% (Changco 1987)
CSF leukocyte esterase: sensitivity of 100%, specificity of 93%; CSF nitrite: specificity and NPV of 85% (Tan 1997)
CSF pH: decreased in 10/11 cases of purulent meningitis (Espiritu 1986)
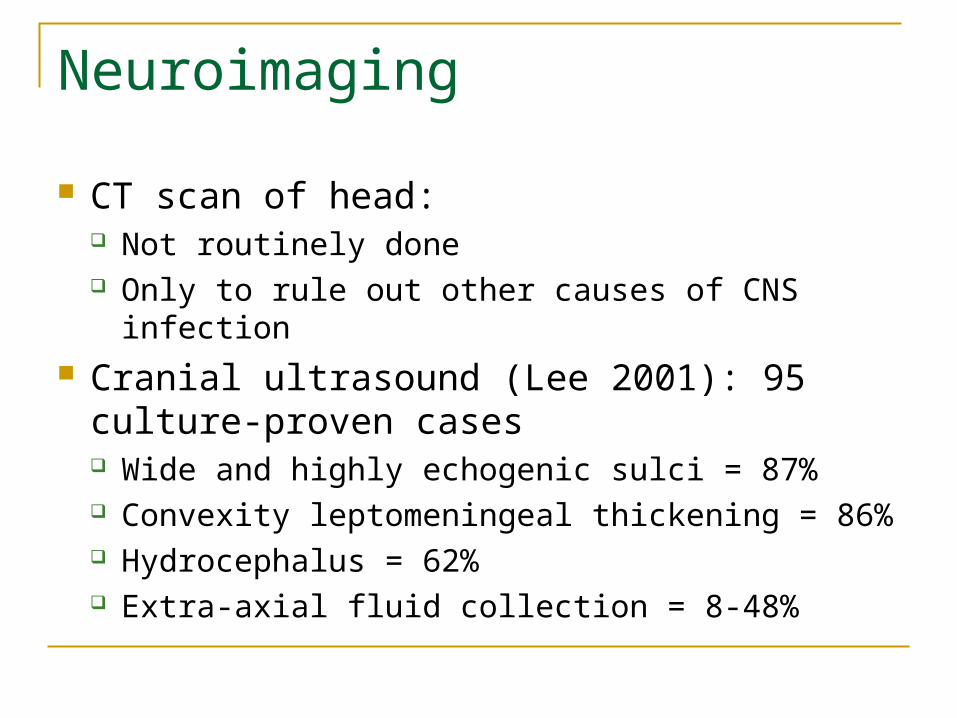
Neuroimaging
CT scan of head: Not routinely done Only to rule out other causes of CNS infection
Cranial ultrasound (Lee 2001): 95 culture-proven cases Wide and highly echogenic sulci = 87% Convexity leptomeningeal thickening = 86% Hydrocephalus = 62% Extra-axial fluid collection = 8-48%

Other tests
GS/CS from throat and petechiae (esp. for meningococcal disease) and blood
Serum CRP (Sutinen 1998): elevated CRP (>10 mg/ml) has 100% sensitivity in 19 cases of bacterial meningitis (but may be low in early stages of infection)
Molecular techniques – not available locally PCR for N. meningitidis & S. pneumoniae Quantitative PCR to determine bacterial load?

How should lab results help us in management of CNS infections?
*Lab results should help us cross a threshold;*We may have to performseveral tests to cross athreshold.

Viral encephalitis
Standard cell culture Brain biopsy Serologic diagnosis: detect a 3-fold or more
increase in specific antibody production CSF ELISA & PCR – how to determine
sensitivity and specificity?
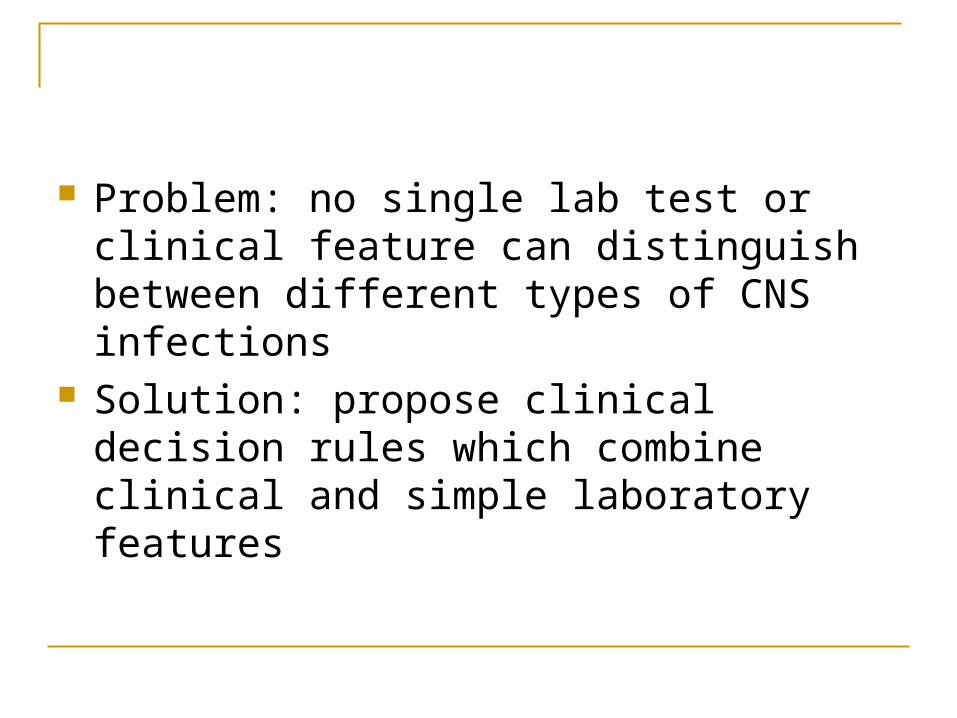
Problem: no single lab test or clinical feature can distinguish between different types of CNS infections
Solution: propose clinical decision rules which combine clinical and simple laboratory features

Clinical decision rules to distinguish between bacterial and viral meningitis (Dubos 2006)
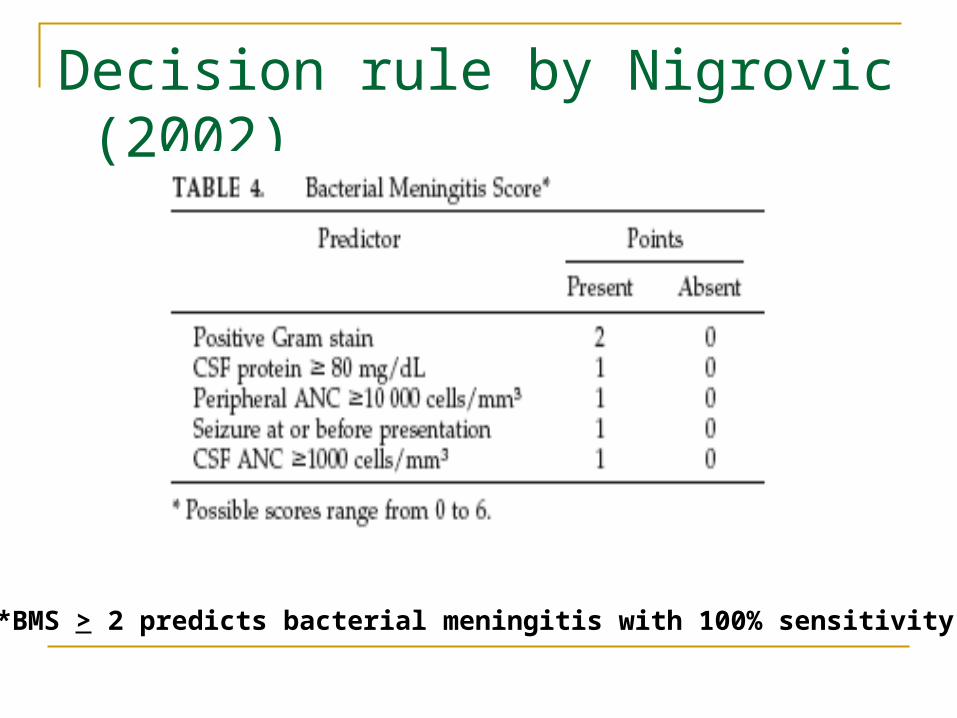
Decision rule by Nigrovic (2002)
*BMS > 2 predicts bacterial meningitis with 100% sensitivity

Lab exams for tuberculous meningitis CSF AFB smear and TB culture CSF qualitative & quantitative exams ELISA – to detect IgG antibodies to
mycobacterial antigens in CSF PCR – to detect mycobacterial DNA elements Neuroimaging
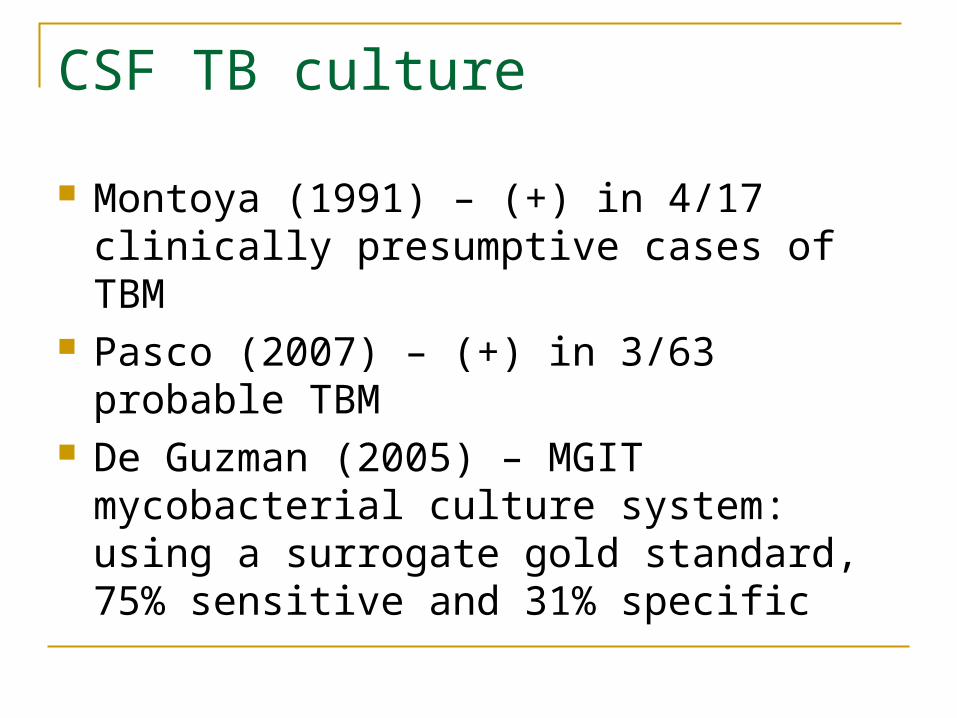
CSF TB culture
Montoya (1991) – (+) in 4/17 clinically presumptive cases of TBM
Pasco (2007) – (+) in 3/63 probable TBM De Guzman (2005) – MGIT mycobacterial
culture system: using a surrogate gold standard, 75% sensitive and 31% specific

ELISA for TB meningitis
Montoya (1991) – 30 kDa native antigen: (+) in 3 of 4 definite TBM, (-) in all normal & non-TBM cases
Valenzuela (2000) – 38 kDa antigen: (+) in 1 of 1 definite TBM; specificity of 72%
Montoya (2000) – antigen A60: 3 definite cases; 100% sensitive and 94% specific
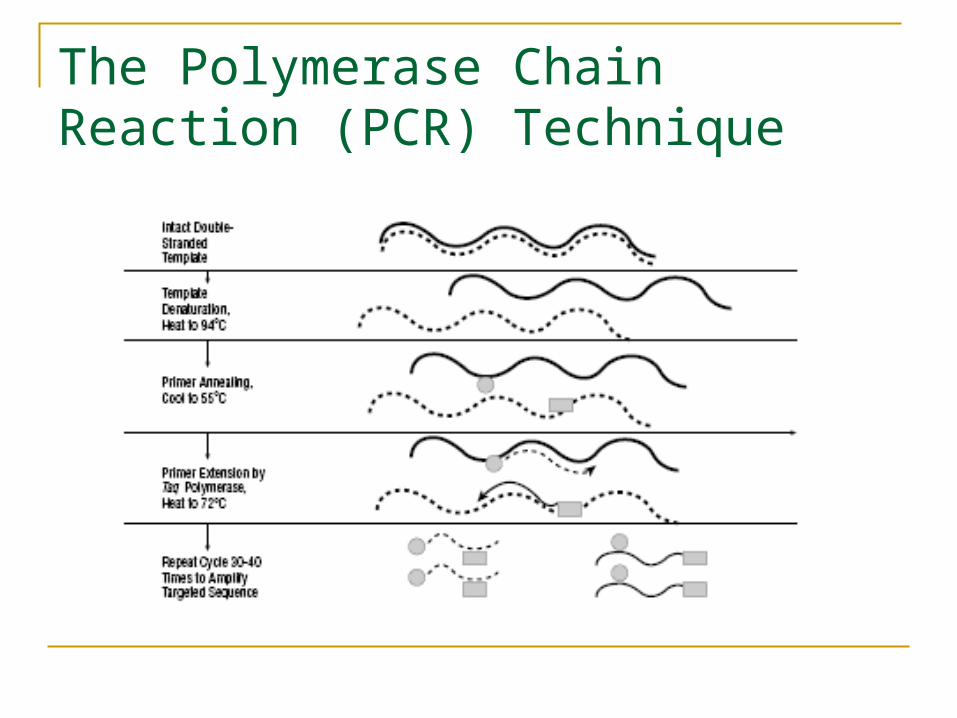
The Polymerase Chain Reaction (PCR) Technique

PCR for TB Meningitis
Montoya (1997) – (+) in 7/8 culture-proven TB Meningitis; no data in non-TBM
Pasco (2007) – 63 probable TBM: 3/63 (+) by smear or culture, 14/63 (+) by PCR; 2/3 definite TBM also (+) by PCR
Udarbe-Agustin (2004) – 3/6 definite TBM (+) by PCR
Montoya (2001) – 9 definite TBM: 1 (+) by Amplicor, 2 (+) by nested PCR
Meta-analysis by Pai (2003) – sensitivity is 56%, specificity is 98%

CT scan in TB Meningitis
Malazo (1995) – 30 children with TBM: 28 had hydrocephalus, 14 had basal exudates, 2 were normal
Kumar (1996) – compared CT scans of 94 children with TBM and 52 with pyogenic meningitis: basal meningeal enhancement, tuberculoma, or both, were 89% sensitive and 100% specific for TBM
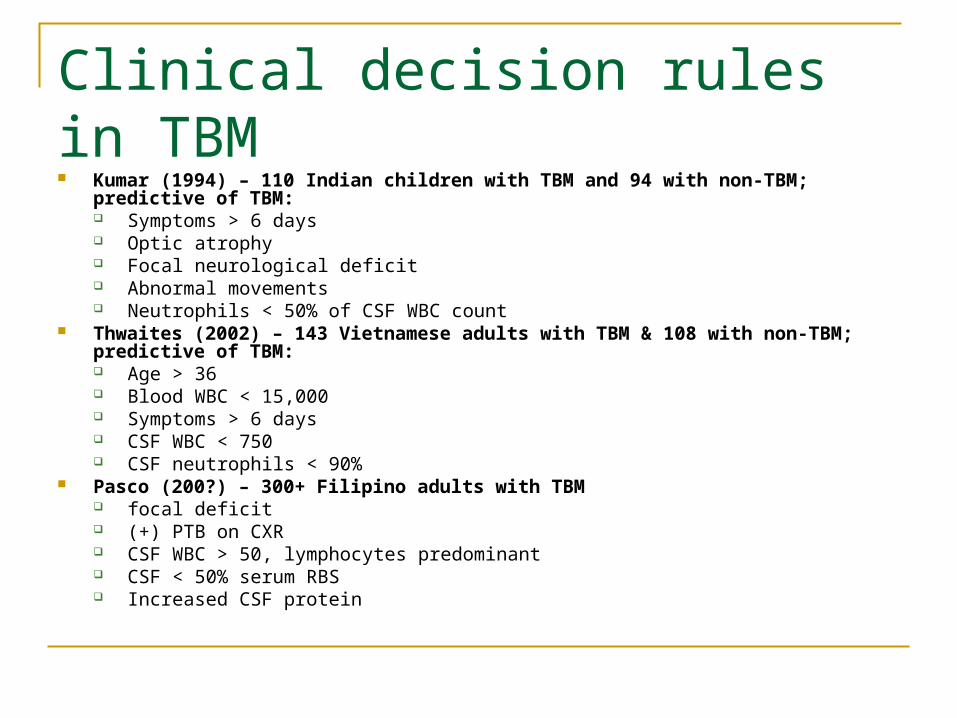
Clinical decision rules in TBM Kumar (1994) – 110 Indian children with TBM and 94 with non-TBM; predictive of TBM:
Symptoms > 6 days Optic atrophy Focal neurological deficit Abnormal movements Neutrophils < 50% of CSF WBC count
Thwaites (2002) – 143 Vietnamese adults with TBM & 108 with non-TBM; predictive of TBM: Age > 36 Blood WBC < 15,000 Symptoms > 6 days CSF WBC < 750 CSF neutrophils < 90%
Pasco (200?) – 300+ Filipino adults with TBM focal deficit (+) PTB on CXR CSF WBC > 50, lymphocytes predominant CSF < 50% serum RBS Increased CSF protein

Cryptococcal meningitis
India Ink & Sabouraud’s culture CALAS titers Lokin (2000) – 8 cases of cryptococcal
meningitis: 8 (+) by India Ink and mucicarmine; after 24h, still (+) by mucicarmine
Summary
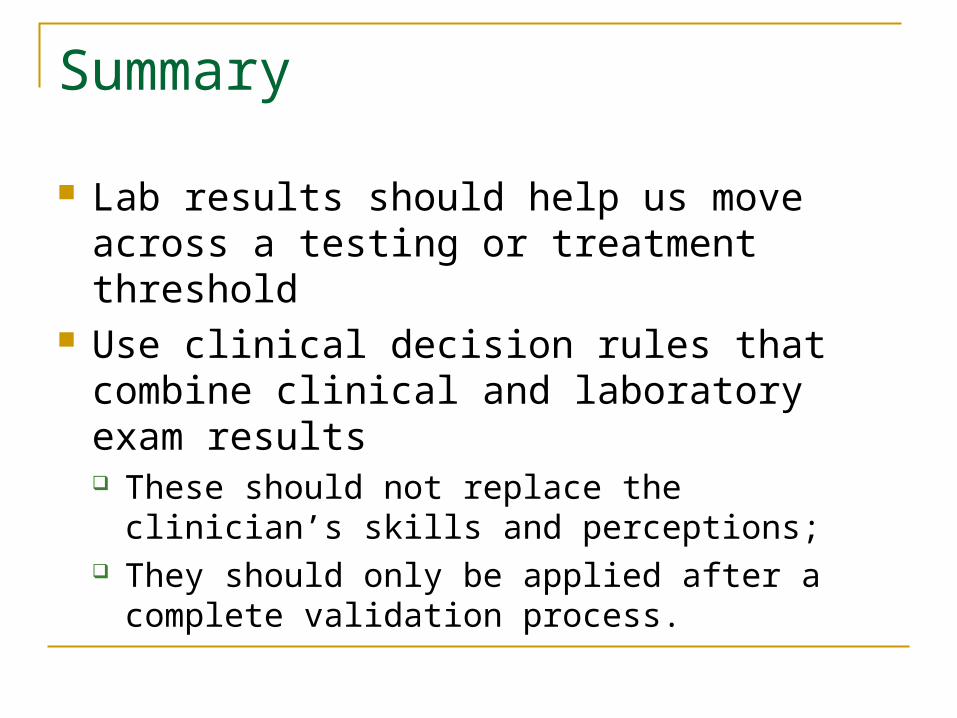
Lab results should help us move across a testing or treatment threshold
Use clinical decision rules that combine clinical and laboratory exam results These should not replace the clinician’s skills and
perceptions; They should only be applied after a complete
validation process.


