ORIGINAL PAPER
Laboratory Simulation of Irrigation-Induced Settlementof Collapsible Desert Soils Under Constant Surcharge
Ramesh Vandanapu . Joshua R. Omer . Mousa F. Attom
Received: 24 October 2016 /Accepted: 14 June 2017 / Published online: 19 June 2017
� The Author(s) 2017. This article is an open access publication
Abstract The heterogeneous nature of soil as a load
bearing material, coupled with varying environmental
conditions, pose challenges to geotechnical engineers
in their quest to characterize and understand ground
behavior for safe design of structures. Standard
procedures for checking bearing capacity and settle-
ment alone may sometimes be insufficient to achieve
an acceptable degree of durability and in-service
performance of a structure, particularly under varying
environmental conditions, whether natural or man-
made. There exists a wide variety of problematic soils
that exhibit swelling, shrinkage, dispersion and col-
lapse characteristics occasioned by changes in mois-
ture content. Specific examples are collapsible soils,
which occur mainly in arid and semi-arid regions, are
generally capable of resisting fairly large loads in the
dry condition but suffer instability and significant
strength loss when in contact with water. A number of
case studies in the United Arab Emirates were
examined, where lightly loaded structures such as
boundary walls, pavements and footpaths had been
built on ground overlying collapsible soil strata.
Sustained irrigation of the dry landscapes was found
to have caused uneven settlement of the collapsible
soils leading to continuous distress to the structures as
evident from cracking and deformation. To help
address the problem, an opportunity has been taken
to develop a laboratory method of simulating the
loaded behavior of collapsible soils in varying situa-
tions and to measure its deformation at constant
surcharge and ground water infiltration rates. Finally,
relationships were developed to estimate the time and
magnitude of settlement, if thickness of collapsible
soil is known.
Keywords Collapsible soil � Laboratory simulation �Deformation � Plate loading test
1 Introduction
Collapsible soils are found in many parts of the world
such as USA, Central and South America, China,
Africa, Russia, India and the Middle East (Murthy
2010). Collapsible soils behave interestingly in that
they may be competent as load bearing media in
certain situations yet in other situations they present
special challenges to engineers (Rezaei et al. 2012).
Such soils are usually arid and semi-arid sands
R. Vandanapu (&) � J. R. Omer
School of Civil Engineering and Construction, Kingston
University London, London, UK
e-mail: [email protected];
R. Vandanapu
Amity University, Dubai, UAE
M. F. Attom
Department of Civil Engineering, American University of
Sharjah, Sharjah, UAE
123
Geotech Geol Eng (2017) 35:2827–2840
DOI 10.1007/s10706-017-0282-0

consisting primarily of silt sized particles (Kalantari
2012) and may be susceptible to failure when
subjected to water ingress from intermittent precipi-
tation or deliberate water disposal. This is because
collapsible soils suffer instability and structural
breakdown when in contact with water. Furthermore,
due to the high evaporation rate of soil moisture in dry
regions, any underlying collapsible soil strata do not
have sufficient time to consolidate under the in situ
stresses (Pye and Tsoar 1990). Collapsible soils are
generally characterized by their natural dryness,
openness in structure and high porosity (Noutash
et al. 2010). The structure of a collapsible soil strongly
influences its mechanical properties as is true for other
soil types (Leroueil and Vaughan 1990;Wesley 1990).
Jotisankasa (2005) stated that wetting of collapsible
soil, through whatever mechanisms, coupled with
loading causes a significant reduction in volume
followed by structural collapse. A direct consequence
of this is settlement and differential settlement of any
structures founded on such soils, which undesirably
lose much of their friction component of shear
strength. In fact, with or without loading, increase in
moisture content cause collapsible soils to exhibit
abrupt changes in both volume and strength and this is
markedly significant when the degree of saturation is
above 50%. Nonetheless, partial collapse behavior of
such soils can take place even without full saturation,
as reported by Houston et al. (1993) and Abbeche et al.
(2010), although other workers for example (Houstan
et al. 2002) noted the total collapse of certain soils at
given stress level requires a state of full saturation.
Water ingress, by whatever means, into collapsible
soil strata causes the groundwater table to rise. In
urbanized arid/semi-arid sites, water from pipeline
leakages, surface irrigation activities and industrial
effluents can also percolate deeply into beds of
collapsible soils underlying the site. It should be
understood that the term ‘‘collapsible soils’’ does not
mean a particular soil type but rather a whole variety
of soils that are susceptible to structural collapse and
examples include wind-blown sand, loess or alluvial
soil types (Kalantari 2012). These soils are generally
found in an unsaturated state in their natural condition
(Zhu and Chen 2009). Other than effects of water,
another cause of soil structure collapse is reduction in
the strength of the bonding between soil particles, e.g.
in loosely cemented sands where the cementing
material is liable to softening and weakening by
water. Even though it is difficult to predict the
behavior of soils that exhibit collapse under unex-
pected or undesirable water ingress, many researchers
have undertaken laboratory tests (Holtz and Hilf 1961;
Jennings and Knight 1975; Jasmer and Ore 1987;
Anderson and Riemer 1995; Reznik 2007; Gaaver
2012; Kalantari 2012; Rezaei et al. 2012) and field
tests (Reznik 1993; Houston et al. 1995) in an attempt
to identify certain characteristics of such soils. Among
the most significant articles reviewed so far, only a
small number are directly related to the current
research and are summarized below.
1.1 Laboratory Tests
Holtz and Hilf (1961) suggested that loess-like soils
are vulnerable to collapse when they have high void
ratios and are saturated to the extent that their moisture
content exceeds the liquid limit. A graph was devel-
oped for use in identifying whether or not a soil is
likely to exhibit collapse behavior. Use of the graph
requires knowledge of just two basic properties: dry
density and liquid limit. In regions like UAE, where
the current research is underway, most soils are silty
sands that are either non-plastic or possess little or
negligible plasticity. Thus, the procedure suggested by
Holtz and Hilf (1961) may not be useful in the region
of concern.
Anderson and Riemer (1995) used tri-axial equip-
ment to perform constant-shear-drained (CSD) tests
on uniformly graded sand and an undisturbed clayey
alluvial soil. The test results showed that the collapse
potential was related to the stress path, knowledge of
which is necessary to accurately predict the collapse
potential of such a soil.
Reznik (2007) developed equations to estimate the
structural pressure (rsz) as a function of the degree of
saturation (S) using oedometer test results reported by
various researchers. ‘Structural pressure’ value is
defined as stress at separation ‘points’ between elastic
and plastic states of any soil (including collapsible
soils) under loading. Soil collapse was observed to
start when the applied stress exceeded the soil
structural pressure values. This led to conclusion that
the collapsibility of soil is a non-elastic deformation.
Gaaver (2012) conducted tests on various disturbed
and undisturbed soils in an effort to identify the nature
of the soils and possible methods of ground improve-
ment. Equations were developed for predicting
2828 Geotech Geol Eng (2017) 35:2827–2840
123

collapse potential of soil, based on determination of
the initial moisture content of the soil from lab tests. A
new parameter RFSR (reduction factor in shearing
resistance) was introduced and could be calculated if
the initial moisture content of the soil is known,
thereby enabling estimation of the reduction in bearing
capacity. In UAE, due to hot climate mostly through-
out the year, soils are very dry above groundwater
table and thus moisture contents are too low. In view
of collecting samples via boreholes for determination
of moisture content, the drilling fluids being used will
significantly alter the moisture content of soil thereby
making it difficult to obtain samples in their true
natural state.
One disadvantage of the strategies in the above
mentioned researchers is the reliance on collecting
undisturbed samples and carrying out time-consuming
measurements such as oedometer and tri-axial tests.
Another disadvantage is that it would be extremely
difficult to obtain undisturbed and truly representative
soil samples of cohesion-less silty sands particularly
for UAE ground conditions. Therefore it can be
commented that whilst the previously reported
research is promising for the purpose of assessing
whether a soil is collapsible and its degree of
collapsibility, it does not closely represent actual field
situations. This is because of not taking into account
the effects of water ingress, groundwater influence and
most significantly the influence of surcharge stresses
due to structures resting over the soil in question.
1.2 Field Tests
Reznik (1993) conducted plate load tests on collapsi-
ble soils at a location in south-western Ukraine by
simulating the water flow conditions that were
consistent with those observed beneath nearby real
structures, where rapid increase of settlements
occurred due to uncontrolled wetting of soils. A
parameter called the proportionality limit (Ppr) was
introduced and is defined to represent the maximum
pressure corresponding in the linear part of the load-
settlement curve obtained from plate load test. Values
of the Ppr obtained for collapsible soils were found to
decrease with increase in water content. It was
observed that the degree of saturation of soils under
structures due to accidental wetting rarely exceeded
70–80%. Additionally the degree of saturation calcu-
lated after conducting the plate load test including
wetting was found to be always below 80%. The
findings indicated that the load testing technique
applied for the collapsible soils was reasonable for
design purposes.
Houston et al. (1995) developed an in situ test
named ‘downhole collapse test’ and conducted a series
of tests at a site known to exhibit wetting induced
collapse. The test was performed in a borehole with
load being applied to the plate at the bottom of the
borehole. Water was introduced in the test and load-
settlement response of the soil monitored. Using data
from all tests, equations were developed thereof and
used to estimate the collapse induced by wetting.
Field tests conducted by the two researchers
mentioned above attempt to replicate the field condi-
tions and the results would seem realistic for use in
geotechnical design. Despite this advantage, such field
replicating tests suffer one drawback in that they are
laborious and often not cost-effective for some
infrastructural projects. Thus the alternative of labo-
ratory tests is still attractive to geotechnical designers
provided that there is sufficient modification to create
test conditions which simulate reality as closely as
possible.
In this research work, the primary aim is to develop
a deeper understanding of the behavioral characteris-
tics of collapsible soil and to develop predictive
methods together with appropriate parameter values to
increase safety and economy in geotechnical design.
This work concentrates mainly on laboratory testing of
collapsible soils to simulate the effects of water
infiltration due to irrigation of landscapes underlain by
collapsible soil layers in arid/semi arid environments.
2 Timeliness and Significance of the Current
Research Work
As already stated, many researchers have attempted to
use laboratory and field methods in characterizing
collapsible soils, however most of the methods have
disadvantages in that they are time consuming and
resource intensive. In addition, the methods do not
adequately account for the effects of water ingress into
soil, yet this is an important consequence of drip
irrigation, pipeline leakage and precipitation. Also,
field tests are considerably more expensive than
laboratory tests as direct sources of design parameters
for substructures built on problematic soils such as
Geotech Geol Eng (2017) 35:2827–2840 2829
123

collapsible soils. Therefore, as a better alternative, a
carefully designed laboratory simulative test seems
plausible as a method of developing empirical param-
eters for use in geotechnical design for structures built
on over collapsible soil strata.
3 Experimental Study
In the current research work, it was planned to conduct
plate load tests (BS 1377-9:1990) on collapsible soil in
a custom designed tank of sufficiently large dimen-
sions, to minimize boundary effects on the stressed
zone of soil underneath a loaded plate lying on the soil
surface. The tests include introduction of variable
water table in the sand tank as well as controlled water
infiltration rate to enable simulation of drip irrigation
from which water would percolate deeply into under-
lying strata of collapsible soils supporting structures.
The primary purpose of the tests is to understand
underlying mechanisms and develop comprehensive
data that would be used to formulate predictive
equations for rates of settlement of collapsible soil,
as functions of several variables such as (1) thickness
of collapsible layer, (2) its depth from ground level, (3)
groundwater regime. All tests were conducted at
controlled infiltration rates and at specified magni-
tudes of surcharge loading.
3.1 Methodology
A number of case studies of structural damage
examined in the UAE by Vandanapu et al. (2016)
clearly showed structural distresses in lightly loaded
structures such as boundary walls, hard landscapes,
footpaths and pavements adjacent to areas under
drip irrigation. No signs of distresses were noticed in
larger structures such as residential houses and
office buildings as most of them were founded on
deep piles unaffected by superficial strata of col-
lapsible soils. Consistent with the subsurface condi-
tions under the distressed structures, it was planned
to conduct constant-pressure (equivalent to the
ground pressure exerted by boundary walls) labora-
tory plate load tests on collapsible soil to study the
response of such light structures to changing water
table levels occasioned by drip irrigation. The plate
load tests were carried in two different cases as seen
in Fig. 1.
In both cases, surface of the soil in the tank was
loaded with a pressure equivalent to that exerted on the
ground by the light structures and then settlements
were observed with water infiltrating (simulating drip
irrigation) from the surface. The tests were devised to
help understand the settlement behavior of collapsible
behavior of soil while the drip irrigation is underway.
The influence of variable depths (simulating the actual
groundwater table) of water the tank on time and
magnitude of settlement was observed in case-1. In
case-2, the influence of variable thickness of collapsi-
ble soil layer sandwiched between non-collapsible soil
layers on time and magnitude of settlement was
studied.
It is imperative that the laboratory test conditions
represent the field situation as far as possible. Details
of the experimental arrangement, materials and instru-
mentation specifications are described in the following
sections.
Case-1 :Tank filled with collapsible soil only Case-2: A collapsible soil layer sandwiched between two other layers in the tank.
Fig. 1 Plate load test cases
2830 Geotech Geol Eng (2017) 35:2827–2840
123

3.2 Plate Load Test Set-Up
A cubic tank measuring 1 m 9 1 m 9 1 m was
fabricated using a mild steel sheet of 4 mm thick,
with carefully designed joints to create a water-tight
enclosure. The prepared tank was placed under a
loading frame made from a steel beam of 250 mm
width and 250 mm depth with mass per linear meter
equal to 72.4 kg/m and total mass of about 500 kg
including the supports. This was done in order to act as
a reaction while applying load on the soil using
hydraulic jacks (Figs. 2, 3).
3.3 Test Load Calculations
As listed in Table 1, necessary calculations were made
to derive the required weight of the loading frame
sufficient to provide adequate reaction while testing
the collapsible soil.
*Sample calculations
Stress = 50 kN/m2
Area of plate = pr2 = 3.14*(0.01)2 = 0.0314 m2
Reaction load required (kg) = 50 9 1000 9 0.0314/
10 = 157 kg
The dead weight of the loading frame used in the
current work is 500 kg which evidently can resist a
stress of up to 150 kN/m2. The emphasis was to
simulate the behavior of collapsible soil strata in the
field as realistically as possible. All plate load tests
were conducted at a constant pressure of 80 kN/
m2(calculated in accordance with the sizes, weights
and foundations depths of various boundary walls and
gazebos commonly used in the area of concern), which
corresponds to the actual maximum pressure exerted
on the ground by the kinds of installations cited above.
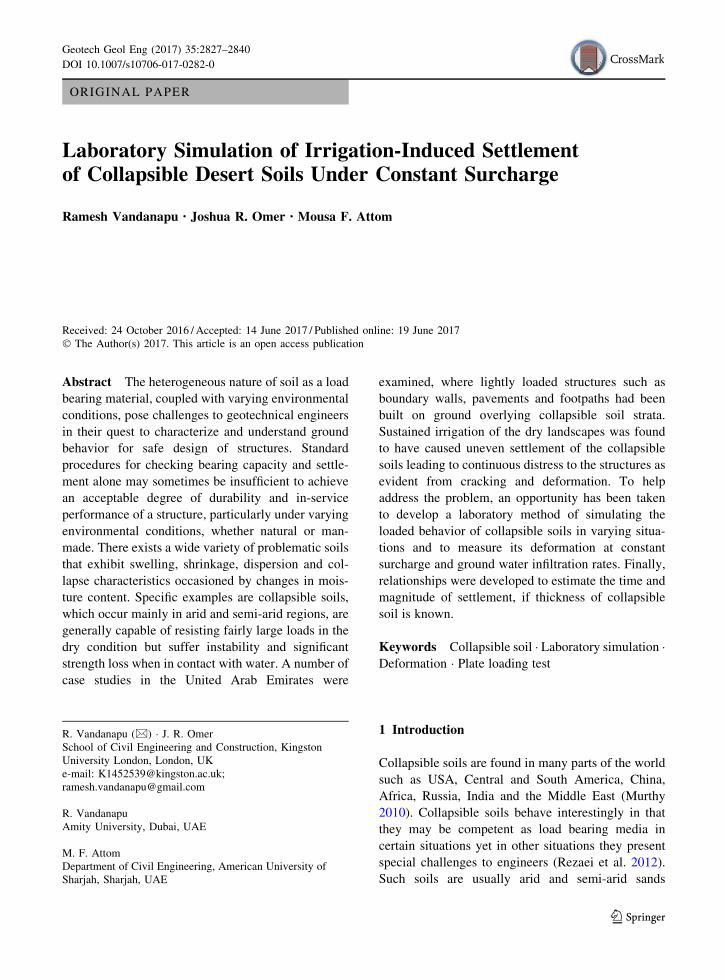
3.4 Replication of Groundwater Table
Many researchers have performed laboratory plate
load tests but for either dry or fully saturated soils yet
natural soils in the ground rarely fit this condition. So,
it was considered more realistic to carry out model
scale plate load tests with soil moisture contents and
water table positions that relate to real field conditions.
For this purpose, a hole was made on one side of the
test tank and a piezometer inserted along with grad-
uated scale to measure and control the water table level
(Fig. 4). Initially water was poured into the empty tank
to a depth of 10 cm from bottom and then dry soil was
slowly added over the water. Furthermore, the place-
ment of water and soil was done simultaneously until a
stable water level in the tank was established.
3.5 Preparation of Collapsible Soil
Samples of collapsible soils were collected from
various sites around Abu Dhabi, UAE, where
Hydraulic Jack
Fig. 2 Elevation of the experimental setup
Loading Frame
Soil Tank
Dial gauge for measuring settlement
Fig. 3 The top view of the setup
Table 1 Minimum required reaction load for various stresses
Stress (kN/m2) Diameter of test
plate (mm)
Minimum required
reaction load (kg)
50* 200 157
100 200 315
150 200 472
Geotech Geol Eng (2017) 35:2827–2840 2831
123
geotechnical companies had previously been con-
tracted to undertake extensive investigations of struc-
tural distresses arising from ground movements. The
main reason for the distress was subsoil collapse
caused by ingress of irrigation water from the
surrounding soft landscapes. The investigation com-
panies drilled a number of boreholes, which showed
that collapsible strata existed at depths where standard
penetration test (SPT) values were low (N = 4 to 10)
and very low (N\ 4). It is from such depths where soil
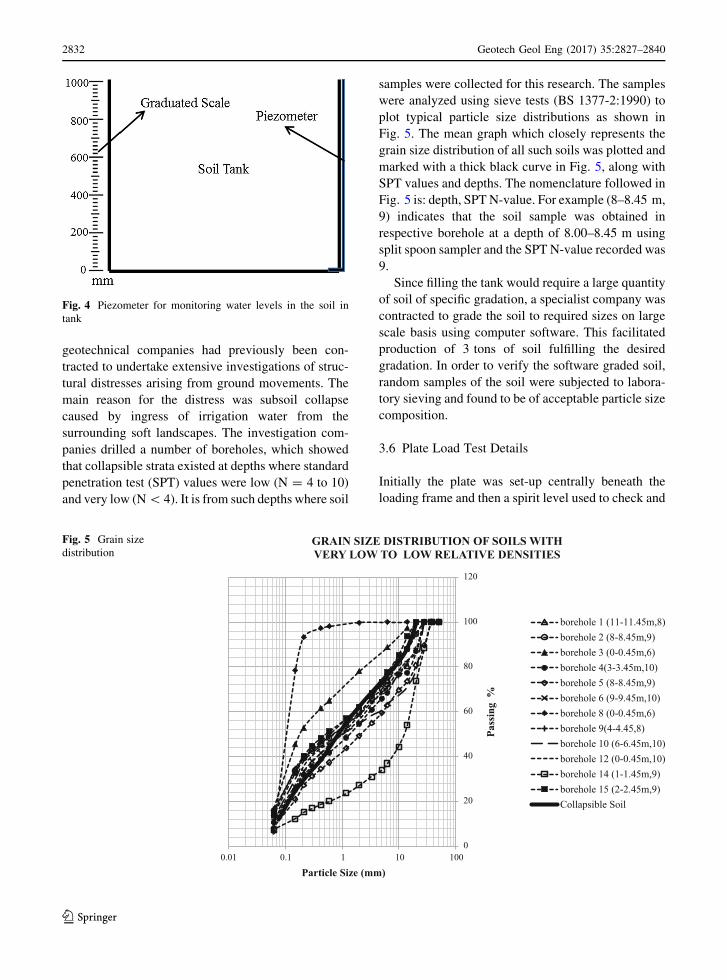
samples were collected for this research. The samples
were analyzed using sieve tests (BS 1377-2:1990) to
plot typical particle size distributions as shown in
Fig. 5. The mean graph which closely represents the
grain size distribution of all such soils was plotted and
marked with a thick black curve in Fig. 5, along with
SPT values and depths. The nomenclature followed in
Fig. 5 is: depth, SPT N-value. For example (8–8.45 m,
9) indicates that the soil sample was obtained in
respective borehole at a depth of 8.00–8.45 m using
split spoon sampler and the SPT N-value recorded was
9.
Since filling the tank would require a large quantity
of soil of specific gradation, a specialist company was
contracted to grade the soil to required sizes on large
scale basis using computer software. This facilitated
production of 3 tons of soil fulfilling the desired
gradation. In order to verify the software graded soil,
random samples of the soil were subjected to labora-
tory sieving and found to be of acceptable particle size
composition.
3.6 Plate Load Test Details
Initially the plate was set-up centrally beneath the
loading frame and then a spirit level used to check and
Fig. 4 Piezometer for monitoring water levels in the soil in
tank
0
20
40
60
80
100
120
0.01 0.1 1 10 100
%Pa
ssin
g
Particle Size (mm)
GRAIN SIZE DISTRIBUTION OF SOILS WITH VERY LOW TO LOW RELATIVE DENSITIES
borehole 1 (11-11.45m,8)borehole 2 (8-8.45m,9)borehole 3 (0-0.45m,6)borehole 4(3-3.45m,10)borehole 5 (8-8.45m,9)borehole 6 (9-9.45m,10)borehole 8 (0-0.45m,6)borehole 9(4-4.45,8)borehole 10 (6-6.45m,10)borehole 12 (0-0.45m,10)borehole 14 (1-1.45m,9)borehole 15 (2-2.45m,9)Collapsible Soil
Fig. 5 Grain size
distribution
2832 Geotech Geol Eng (2017) 35:2827–2840
123

level the loading plate in horizontal position (Fig. 6).
Once the plate had been set up correctly in position, a
hydraulic jack was carefully placed over it and
precisely below the loading frame. A dial gauge was
then set up on the plate surface and mounted on a
magnetic stand bearing on the side of the tank. Jack
loads were then applied in increments equivalent to
1/10th to 1/12th of the targeted maximum pressure
(80 kN/m2) until the final pressure was reached. Care
was exercised to ensure that, at each load increment,
the plate settlement reached a stable value before
readings were recorded. Thereafter, wetting of soil
was done in a controlled manner.
In view of understanding the effect of groundwater
regime coupled with controlled irrigation on settle-
ment of foundation, three plate load tests were carried
out at different water levels as listed in Table 2. Once
the first plate load test with groundwater level at 2.5B
below the plate was conducted, the soil lying above the
water level was removed from the tank and dried
completely. The dried soil was then placed in the tank
and water table raised to 1.5B in order to proceed with
the second test. The same procedure was also followed
between the 2nd (1.5B) and the 3rd (1.0B) tests.
In addition, four plate load tests at various
collapsible soil to total soil stratum ratios (1/2, 1/3,
1/4 and 1/5) were carried out to understand the effect
of collapsible soil as a layer in the soil strata. For this
purpose, collapsible soil was inserted as a layer at the
mid-depth and plate load test tests at constant pressure
were conducted accordingly.
3.7 Watering Pattern
In order to create a laboratory simulation of the actual
watering pattern due to irrigation of real landscapes, a
pipe similar in diameter to the actual ones used in the
UAE was prepared with perforations created at 15 cm
intervals followed by fitting of drippers. The prepared
pipe was placed on the surface of soil in the tank
(Fig. 7) with one of its ends closed and the other
connected to water supply. Once the targeted pressure
of 80 kN/m2 was reached, water was allowed to flow
in definite cycles. A ‘cycle’ is defined as application of
specified quantity of water every 12 h for a duration of
30 min. Drip irrigation was simulated over the soil in
tank at the rate of 13 l/m2/day (as per data obtained
from local landscaping companies), watered twice a
day (6.00 A.M.–6.30 A.M. and 6.00 P.M.–6.30 P.M.)
equally at the rate of each 6.5 l/m2. Rate of discharge
of water was ensured with the help of water-meter
fitted at the water outlet and a stopwatch. Such cycles
were continued until rate of increase in settlement was
so fast that our primary aim of maintaining constant
pressure was not possible.
Spirit level Circular Plate
Fig. 6 Leveling the plate top
Table 2 Water table positions studied in plate tests
Test number Depth of water level below
bottom of plate
1 2.5B (500 mm)
2 1.5B (300 mm)
3 1.0B (200 mm)
B = diameter of plate = 200 mm
DrippersPipe
Soil Surface
Fig. 7 Arrangement for simulating the field watering pattern
Geotech Geol Eng (2017) 35:2827–2840 2833
123

3.8 Constant Load Application Procedure
In actual practice, once any lightly loaded structure is
constructed, its dead weight is largely constant
throughout the lifetime, any live loads on such a
structure being relatively small. On this basis, it was
considered that the plate load tests ought to be
conducted with maintained ground pressure to simu-
late the condition of a bearing soil medium. Once the
dripping of water was initiated the soil started losing
its strength due to the collapse of its structure which
resulted in a decrease in the pressure exerted on the
soil. Such a reduction in pressure was immediately
compensated by manually applying pressure via the
lever of the hydraulic jack (Fig. 8). This was possible
due to continuous monitoring of pressure while
applying the desired watering cycles on the soil
surface.
4 Test Results and Discussions
All outcomes obtained from constant load plate load
tests were elucidated in forthcoming sections.
4.1 Plate Load Tests–Full Collapsible Soil
Three plate load tests were carried out at different
water levels as listed in Table 2. The water depths
beneath the bottom of test plate were chosen to be
consistent in scale to the actual foundation situations at
the locations where structural distresses were inves-
tigated in the UAE case studies. Data from the plate
load tests were transferred into Microsoft Excel
workbooks for further processing in a bid to study
the underlying patterns. Graphs of pressure against
settlement and of settlement versus time were plotted
and are discussed in the following sections.
4.1.1 Effect of Dripping Water on Settlement of Soil
Pressure–settlement graphs for all three tests con-
ducted are shown in Figs. 9, 10, and 11. It was also
observed that the number of wetting cycles required
for the soil to reach collapsing state increased with
increase in the depth of the water table below the plate
Fig. 8 Maintaining constant pressure
80, 15.77
0
2
4
6
8
10
12
14
16
18
0 20 40 60 80 100
Sett
lem
ent (
mm
)
Pressure (kN/sq.m)
Fig. 9 Pressure–settlement curve with groundwater table at
depth of 2.5B
80, 17
0
2
4
6
8
10
12
14
16
18
0 20 40 60 80 100
Sett
lem
ent (
mm
)
Pressure (kN/sq.m)
Fig. 10 Pressure–settlement curve with groundwater table at
depth of 1.5B
2834 Geotech Geol Eng (2017) 35:2827–2840
123

(Table 3). This could be attributed to the presence of a
deeper zone of soil (2.5B) involved in the collapse
mechanism when the water level is at 2.5B, where the
number of wetting cycles needed to cause soil collapse
was greatest in comparison to the other cases. It is also
apparent that the further the collapsible soil zone is
below the plate foundation the higher is the number of
cycles of wetting necessary to initiate soil collapse.
4.1.2 Effect of Time on Settlement of Soil
Time–settlement graphs for all three tests carried out
are shown in Fig. 12. The graphs illustrate that the
time required for the soil to exhibit its collapse
behavior increases with increase in thickness of
collapsible soil below the plate foundation. The time
durations from commencement of test to start of soil
collapse are listed in Table 4 for brevity and ease of
understanding. A linear behavior is evident from the
data in Table 4, so that a 0.5B increase in depth of
water is equivalent to a time gap of 60 min between
the start of test and the onset of soil collapse.
4.1.3 Rate of Collapse
As previously stated, each plate load test was termi-
nated once settlement rate was so rapid that the prime
objective of maintaining constant pressure cannot be
continued. To understand the rate of collapse, the
time–settlement data of the last wetting cycle from
each test was used to calculate the rate of collapse. The
calculations and corresponding results are shown in
Table 5. It is evident that irrespective of the thickness
of collapsible soil below the base of the plate, the rate
of collapse exhibited by the soil in all three tests was
fairly uniform at 6 mm in 30 min (0.2 mm/min).
80, 11.52
0
2
4
6
8
10
12
14
16
18
0 20 40 60 80 100
Sett
lem
ent (
mm
)Pressure (kN/sq.m)
Fig. 11 Pressure–settlement curve with groundwater table at
depth of 1.0B
Table 3 Wetting cycles before collapse
Depth of groundwater level below
foundation
Number of wetting
cycles
2.5B 7
1.5B 5
1.0B 4
‘B’ refers to width of foundation (width of plate in the plate
load test)
510, 9.85
540, 15.77
390, 10.74
420, 17
330, 5.7
360, 11.52
0
2
4
6
8
10
12
14
16
18
0 50 100 150 200 250 300 350 400 450 500 550 600
Sett
lem
ent (
mm
)
Time (min)
Groundwater tableat depth of 2.5B
Groundwater tableat depth of 1.5B
Groundwater tableat depth of 1.0B
Fig. 12 Time–settlement
curves at various
groundwater levels
Geotech Geol Eng (2017) 35:2827–2840 2835
123
4.1.4 Effect of Loading–Reloading on Modeled
Groundwater Table
Each time, once the soil was removed and replaced after
drying, there was a drop inwater level in the piezometer
when weight was placed on the soil. To understand this
behavior moisture content and specific gravity of soil
after removing the soil was determined before replacing
it with dry soil and was found to be 12% and 2.6
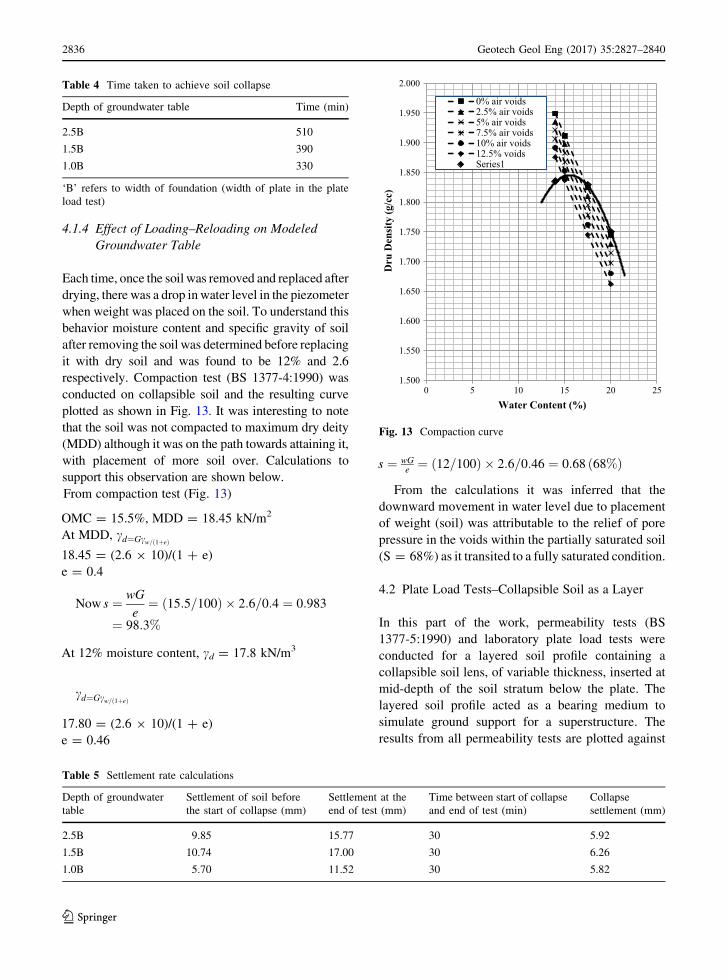
respectively. Compaction test (BS 1377-4:1990) was
conducted on collapsible soil and the resulting curve
plotted as shown in Fig. 13. It was interesting to note
that the soil was not compacted to maximum dry deity
(MDD) although it was on the path towards attaining it,
with placement of more soil over. Calculations to
support this observation are shown below.
From compaction test (Fig. 13)
OMC = 15.5%, MDD = 18.45 kN/m2
At MDD, cd¼Gcw= 1þeð Þ
18.45 = (2.6 9 10)/(1 ? e)
e = 0.4
Now s ¼ wG
e¼ 15:5=100ð Þ � 2:6=0:4 ¼ 0:983
¼ 98:3%
At 12% moisture content, cd = 17.8 kN/m3
cd¼Gcw= 1þeð Þ
17.80 = (2.6 9 10)/(1 ? e)
e = 0.46
s ¼ wGe¼ 12=100ð Þ � 2:6=0:46 ¼ 0:68 68%ð Þ
From the calculations it was inferred that the
downward movement in water level due to placement
of weight (soil) was attributable to the relief of pore
pressure in the voids within the partially saturated soil
(S = 68%) as it transited to a fully saturated condition.
4.2 Plate Load Tests–Collapsible Soil as a Layer
In this part of the work, permeability tests (BS
1377-5:1990) and laboratory plate load tests were
conducted for a layered soil profile containing a
collapsible soil lens, of variable thickness, inserted at
mid-depth of the soil stratum below the plate. The
layered soil profile acted as a bearing medium to
simulate ground support for a superstructure. The
results from all permeability tests are plotted against
Table 4 Time taken to achieve soil collapse
Depth of groundwater table Time (min)
2.5B 510
1.5B 390
1.0B 330
‘B’ refers to width of foundation (width of plate in the plate
load test)
Table 5 Settlement rate calculations
Depth of groundwater
table
Settlement of soil before
the start of collapse (mm)
Settlement at the
end of test (mm)
Time between start of collapse
and end of test (min)
Collapse
settlement (mm)
2.5B 9.85 15.77 30 5.92
1.5B 10.74 17.00 30 6.26
1.0B 5.70 11.52 30 5.82
1.500
1.550
1.600
1.650
1.700
1.750
1.800
1.850
1.900
1.950
2.000
0 5 10 15 20 25D
ru D
ensi
ty (g
/cc)
Water Content (%)
0% air voids2.5% air voids5% air voids7.5% air voids10% air voids12.5% voidsSeries1
Fig. 13 Compaction curve
2836 Geotech Geol Eng (2017) 35:2827–2840
123
the thickness of collapsible soil layer in order to
understand its behavior. Results from all plate load
tests were also presented graphically. For this purpose
various pressure–settlement and time–settlement
graphs were constructed and are discussed in the next
sections.
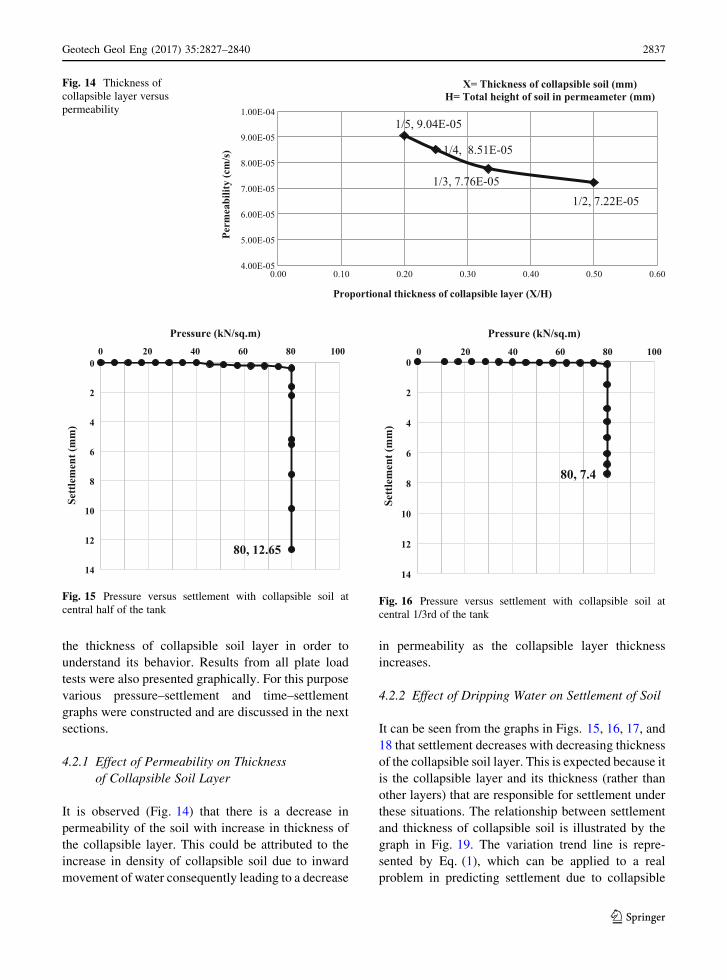
4.2.1 Effect of Permeability on Thickness
of Collapsible Soil Layer
It is observed (Fig. 14) that there is a decrease in
permeability of the soil with increase in thickness of
the collapsible layer. This could be attributed to the
increase in density of collapsible soil due to inward
movement of water consequently leading to a decrease
in permeability as the collapsible layer thickness
increases.
4.2.2 Effect of Dripping Water on Settlement of Soil
It can be seen from the graphs in Figs. 15, 16, 17, and
18 that settlement decreases with decreasing thickness
of the collapsible soil layer. This is expected because it
is the collapsible layer and its thickness (rather than
other layers) that are responsible for settlement under
these situations. The relationship between settlement
and thickness of collapsible soil is illustrated by the
graph in Fig. 19. The variation trend line is repre-
sented by Eq. (1), which can be applied to a real
problem in predicting settlement due to collapsible
1/5, 9.04E-05
1/4, 8.51E-05
1/3, 7.76E-051/2, 7.22E-05
4.00E-05
5.00E-05
6.00E-05
7.00E-05
8.00E-05
9.00E-05
1.00E-04
0.00 0.10 0.20 0.30 0.40 0.50 0.60
Perm
eabi
lity
(cm
/s)
Proportional thickness of collapsible layer (X/H)
X= Thickness of collapsible soil (mm)H= Total height of soil in permeameter (mm)
Fig. 14 Thickness of
collapsible layer versus
permeability
80, 12.65
0
2
4
6
8
10
12
14
0 20 40 60 80 100
Sett
lem
ent (
mm
)
Pressure (kN/sq.m)
Fig. 15 Pressure versus settlement with collapsible soil at
central half of the tank
80, 7.4
0
2
4
6
8
10
12
14
0 20 40 60 80 100
Sett
lem
ent (
mm
)
Pressure (kN/sq.m)
Fig. 16 Pressure versus settlement with collapsible soil at
central 1/3rd of the tank
Geotech Geol Eng (2017) 35:2827–2840 2837
123

soil behavior, provided the proportionate thickness of
the collapsible soil is known.
y ¼ 2E� 05x2 þ 0:0176xþ 1:1267 ð1Þ
where x = thickness of collapsible soil (mm);
y = settlement (mm)
4.2.3 Effect of Time on Settlement of Soil
Time–settlement graphs for all plate load tests
conducted are shown in Fig. 20. It is seen that in all
cases, settlement increases with time but at different
rates depending on the position and thickness of the
collapsible soil relative to the tank depth. This is again
attributed to the proportionate influence of collapsible
80, 6.99
0
2
4
6
8
10
12
14
0 20 40 60 80 100
Sett
lem
ent (
mm
)Pressure (kN/sq.m)
Fig. 17 Pressure versus settlement with collapsible soil at
central 1/4th of the tank
80, 4.33
0
2
4
6
8
10
12
14
0 20 40 60 80 100
Sett
lem
ent (
mm
)
Pressure (kN/sq.m)
Fig. 18 Pressure versus settlement with collapsible soil at
central 1/5th of the tank
450, 12.65
300, 7.4
225, 6.99
180, 4.33
y = 2E-05x2 + 0.0176x + 1.1267R² = 0.9544
23456789
1011121314
150200250300350400450500
Sett
lem
ent (
mm
)
Thickness of Collapsible Soil Layer (mm)
Fig. 19 Thickness of collapsible soil layer versus settlement
180, 12.65
200, 7.4210, 6.99
254, 4.13
0
2
4
6
8
10
12
14
0 50 100 150 200 250 300 350
Sett
lem
ent (
mm
)
Time (Minutes)
collapsible soil at central half depth of tank
collapsible soil at central 1/3rd depth of tank
collapsible soil at central 1/4th depth of tank
collapsible soil at central 1/5th depth of tank
Fig. 20 Time versus settlement with various collapsible soil thicknesses at central depth of tank
2838 Geotech Geol Eng (2017) 35:2827–2840
123

soil responsible for settlement. The relationship
between time and thickness of collapsible soil is
shown in Fig. 21, where the trend of variation
represented by Eq. (2).
y ¼ 1429:9x�0:343 ð2Þ
where y = time (min); x = thickness of collapsible
soil (mm)
Equation (2) may be used to predict the time taken
by the soil to exhibit settlement if proportionate
thickness and depth location of the collapsible soil is
known.
5 Conclusions
1. The number of wetting cycles required for the soil
to exhibit the collapse increases with increase in
depth of groundwater table below the foundation
level.
2. Once the soil starts exhibiting its collapsible
behavior, the rate at which it collapses was found
to be uniform irrespective of its thickness.
3. The decrease in water level in the soil due to
placing the soil (after removing) could be
attributed to the removing pressure which being
exerted by the air in air voids on the voids that are
partially saturated to reach into a fully saturated
conditions.
4. The permeability of the soil stratum decreases
with increase in thickness of collapsible soil
portion in it.
5. The magnitude of settlement increases with
increased proportion of collapsible soil in a soil
strata.
6. The time required for the soil to start exhibiting
collapse increases with increasing depth of the
groundwater table below the foundation. In addi-
tion, despite high magnitudes of ground settle-
ment, the time required to attain the maximum
settlement decreases with increase in the thickness
of the collapsible stratum.
7. Predictive relationships were developed for link-
ing the time period for maximum settlement to
thickness of collapsible soil as well as magnitude
of settlement to thickness of collapsible layer.
These relationships can be used by geotechnical
engineers to assess the rate and magnitude of
settlements, depending on the thickness of the
collapsible soil at a particular site. Though every
effort has been made in the current study to
prepare sufficiently large sized models to simulate
field conditions relevant to the UAE case studies,
inevitably there will be variations to be taken into
account from one site to another. These variations
include: the rate and frequency of irrigation,
thickness of collapsible soil stratum and its depth
below ground level as well as depth of ground-
water table. Thus, geotechnical engineers need to
exercise utmost care when assessing the important
parameters such as time, rate and magnitude of
collapse settlements in the particular locality of
concern. A reliable assessment of the relationship
between the intensity of landscape irrigation,
water table level, thickness and location of
collapsible strata can enable UAE geotechnical
engineers to develop guidance for property own-
ers/members of the public to help them control
rates of irrigation hence avoid extreme ground
settlement that would cause structural distress of
the kind reported in the case studies in this paper.
The current laboratory test results will form part of
an ongoing doctoral research project aimed at assess-
450, 180 300, 200225, 210
180, 254
y = 1429.9x-0.343
R² = 0.8856
150
175
200
225
250
275
300
150200250300350400450500
Tim
e (m
inut
es)
Thickness of Collapsible Soil Layer (mm)
Fig. 21 Thickness of collapsible soil layer versus time
Geotech Geol Eng (2017) 35:2827–2840 2839
123
ing the behavior of collapsible soil under various
structural loads. In addition, numerical analysis using
finite element methods is planned to carryout in view
of understand the behavior on large scale, whereby
eventual aim is to develop equations and course of
actions that geotechnical engineers may find useful
while performing geotechnical analysis of structures
resting on collapsible soil layers.
Open Access This article is distributed under the terms of the
Creative Commons Attribution 4.0 International License (http://
creativecommons.org/licenses/by/4.0/), which permits unre-
stricted use, distribution, and reproduction in any medium,
provided you give appropriate credit to the original
author(s) and the source, provide a link to the Creative Com-
mons license, and indicate if changes were made.
References
Abbeche K, Bahloul O, Ayadat T, Bahloul A (2010) Treatment
of collapsible soils by salts using the double consolidation
method. In: Proceedings of international conference
GeoShanghai, Shanghai, China, ASCE, Reston, VA, USA
Anderson SA, Riemer MF (1995) Collapse of saturated soil due
to reduction in confinement. J Geotech Eng 121(2):216–
219. doi:10.1061/(ASCE)0733-9410(1995)
Gaaver KE (2012) Geotechnical properties of Egyptian col-
lapsible soils. Alex Eng J 51:205–210. doi:10.1016/j.aej.
2012.05.002
Holtz WG, Hilf JW (1961) Settlement of soil foundations due to
saturation. In: Proceedings of 5th international conference
on soil mechanics and foundation engineering, vol 1. Paris,
pp 673–679
Houstan SL, Houston WN, Lawrence CA (2002) Collapsible
soil engineering in highway infrastructure development.
J Transp Eng 128(3):295–300. doi:10.1061/(ASCE)0733-
947X(2002)
Houston WN, Mahmoud HH, Houston SL (1993) Laboratory
procedure for partial-wetting collapse determination,
unsaturated soils, ASCE, New York, USA, Special
Geotechnical Publication vol 39, pp 54–63
Houston SL, Hisham HHM, Houston WN (1995) Down-hole
collapse test system. J Geotech Eng 121(4):341–349.
doi:10.1061/(ASCE)0733-9410(1995)
Jasmer R, Ore HB (1987) Hydro-compaction hazards due to
collapsible loess in South-Eastern Idaho. Proceedings of
the 23rd symposium on engineering geology and soils
engineering. Logan, Utah, pp 461–475
Jennings JE, Knight K (1975) A guide to construction on or with
materials exhibiting additional settlements due to collapse
of grain structure. In: Proceedings of 6th regional confer-
ence for Africa on soil mechanics and foundation engi-
neering, Johannesburg, pp 99–105
Jotisankasa A (2005) Collapse behavior of a compacted silty
clay. Ph.D. Thesis, Imperial College, London
Kalantari B (2012) Foundations on collapsible soils: a review.
Proc inst civ eng Forensic Eng 166(FE2):57–63. doi:10.
1680/feng.12.00016
Leroueil S, Vaughan PR (1990) The general and congruent
effects of structure in natural soils and weak rocks.
Geotechnique 40(3):467–488. doi:10.1680/geot.1990.40.
3.467
Murthy VNS (2010) Soil mechanics and foundation engineer-
ing. CBS publishers and distributors, New Delhi
Noutash MK, Hajialilue BM, Cheshmdoost M (2010) Pre-
pounding of canals as a remediation method for collapsible
soils. In: Proceedings of the 4th international conference on
geotechnical engineering and soil mechanics, Tehran, Iran
Pye K, Tsoar H (1990) Aeolian sand and sand dunes. Unwin
Hyman, London
Rezaei M, Ajalloeian R, Ghafoori M (2012) Geotechnical
properties of problematic soils: emphasis on collapsible
cases. Int J Geosci 3(1):105–110. doi:10.4236/ijg.2012.
31012
Reznik YM (1993) Plate-load tests of collapsible soils.
J Geotech Eng 119(3):608–615. doi:10.1061/(ASCE)0733-
9410(1993)
Reznik YM (2007) Influence on physical properties on defor-
mation characteristics of collapsible soils. Eng Geol
92(1–2):27–37. doi:10.1016/j.enggeo.2007.03.001
Vandanapu R, Omer JR, Attom MF (2016) Geotechnical case
studies: emphasis on collapsible soil cases. Proc Inst Civ
Eng Forensic Eng 169(3):103–110. doi:10.1680/jfoen.16.
00011
Wesley LD (1990) Influence of structure and composition of
residual soils. J Geotech Eng ASCE 116(4):589–603.
doi:10.1061/(ASCE)0733-9410(1990)
Zhu Y, Chen Z (2009) A new method of studying collapsibility
of loess. Front Archit Civ Eng China 3(3):305–311. doi:10.
1007/s11709-009-0040-3
2840 Geotech Geol Eng (2017) 35:2827–2840
123


