
Poverty and Inequality Monitoring:
Latin America and the Caribbean
Safeguarding Against a Reversal in Social
Gains During the Economic Crisis in Brazil
Executive Summary
Brazil has accomplished impressive reductions in poverty and inequality between 2004 and 2014 as
a result of rapidly growing formal employment, higher real wages and redistributive social assistance
programs such as Bolsa Família. With labor income as the major source of income of the poor and
vulnerable households, the current economic crisis poses a serious threat to the sustainability of the
gains in poverty and inequality reduction. As in the 2008-2009 financial crisis, Brazil’s social
assistance and safety net system has a critical role in safeguarding the social gains achieved so far
by preventing more Brazilians from falling into poverty. Yet the expansion of the budget for the social
safety net system is hampered by the challenging fiscal consolidation environment in Brazil.
This note summarizes the findings of the analysis carried out regarding the poverty and inequality
impacts of the ongoing economic crisis in Brazil in 2016 and 2017. The first objective is to get an
estimate of the extent to which the deteriorating macroeconomic conditions and shrinking labor
markets in Brazil will impact on poverty and inequality. The second objective is to generate a detailed
profile of the “new poor” associated with the crisis. The third and final objective is to get estimates of
the additional budget needed for the Bolsa Família Program to effectively mitigate the poverty
impacts of the crisis and protect the past achievements of Brazil in poverty and inequality reduction
until the necessary structural reforms take place in Brazil and the engines of growth are reignited.
The analysis is repeated for two scenarios regarding the changes in real GDP in 2016 and 2017 for
the purpose of providing a sufficiently narrow zone for policy decisions anticipating the adverse
impacts of the crisis on poverty. The distributional impact of each scenario is evaluated first under the
assumption of no changes in the real budget of Bolsa Família and second after allowing for an
increase in the real Bolsa Família budget, which allows for an increase in the coverage of the
program to the new poor based on the program’s current level of “real” benefits and eligibility rules.
The results of the microsimulation analysis suggest that indicators about inequality and poverty will
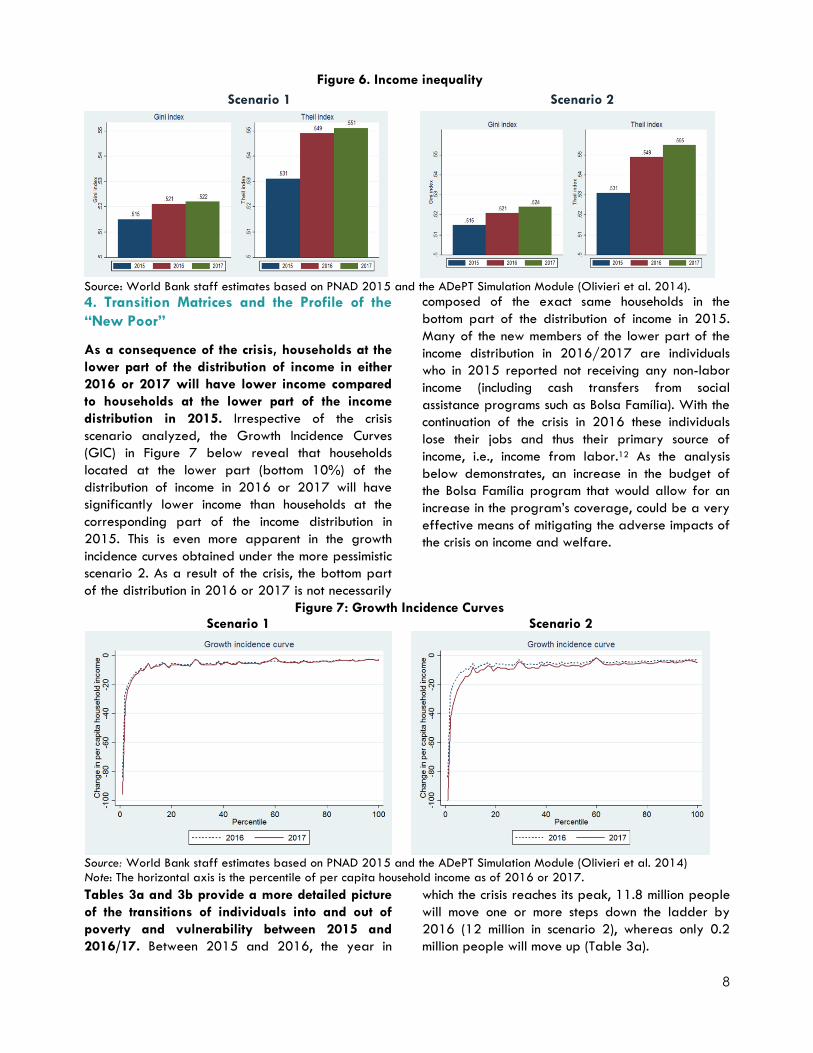
increase in 2016 and remain high in 2017. In scenario 1, the Gini index measuring inequality is
predicted to increase from 0.515 to 0.522 in 2017 as is the poverty headcount ratio (at the R$140
poverty line) which will increase from 8.7% to 9.8% representing an increase in the number of poor
by 2.5 million people. In the more pessimistic scenario 2, the Gini increases to 0.524 in 2017 and the
higher poverty headcount ratio of 10.3% in 2017 represents an increase in the number of poor by 3.6
million people. However, poverty rates will increase mainly in the urban areas and less in the rural
areas (where poverty rates are higher to begin with). The analysis also reveals that the people falling
below the poverty line as a consequence of the crisis are likely to be slightly younger in age, skilled,
located in urban areas, located in the southeast, previously working in the service sector, and white.
The depth and duration of the current economic crisis in Brazil gives rise to the opportunity to expand
the role of Bolsa Família from an effective redistribution program to a true safety net program that is
sufficiently flexible to expand its coverage to the “new poor” households generated by the crisis. The
analysis in this note suggests that an increased budget (in real terms) of about 4.73% (R$1.25 billion)
and 6.9% (R$1.82 billion) from the 2015 budget of R$26.4 billion, would be a very effective way of
targeting scarce financial resources to the most needy among the “new poor” households generated
by the crisis. In nominal terms, or in 2017 Reais, the estimate of the budget required in 2017 can be
calculated by multiplying the 2015 budget (R$26.4 billion) with the estimated increase in the “real”
Pub
lic D
iscl
osur
e A
utho
rized
Pub
lic D
iscl
osur
e A
utho
rized
Pub
lic D
iscl
osur
e A
utho
rized
Pub
lic D
iscl
osur
e A
utho
rized
2
Bolsa Família budget (e.g., 1.0473 under scenario 1) and the expected inflation rate between 2015
and 2017 (e.g., 10% or 1.10). Using these specific values, the estimate of the nominal budget
required in 2017 is R$30.41 billion.
The distribution of the additional Bolsa Família budget to the newly eligible households among the
“new poor” can prevent the extreme poverty rate in Brazil from increasing beyond the level of 2015,
though its impact on preventing the overall poverty rate from increasing is not as dramatic. It is
important to bear in mind that the preceding estimates of the additional budget needed for Bolsa
Família are derived based on the program’s current level of real benefits and eligibility rules and
assuming annual adjustments in the nominal budget in par with the annual inflation rate so at to
maintain the purchasing power of the benefits constant over time. Delays in adjusting the nominal
value of the transfers of Bolsa Família in par with the prevailing inflation rate are likely to lead to
higher poverty rates than those estimated in this note (all else equal). As the Brazil Systematic
Country Diagnostic (2016) highlights, in spite of the limited fiscal space in the medium run, there is
ample scope to expand funding for the most progressive elements of social policy, through
reallocations from poorly targeted social transfers and through improvements in the efficiency of
spending.
1. Background and Motivation1
etween 2004 and 2014, more than 28.6
million Brazilians have escaped poverty.
Yet, Brazil remains one of the most
unequal countries in the world. The reduction in
poverty is an achievement of regional significance,
representing almost 50 percent of the reduction in
poverty in the whole Latin American and Caribbean
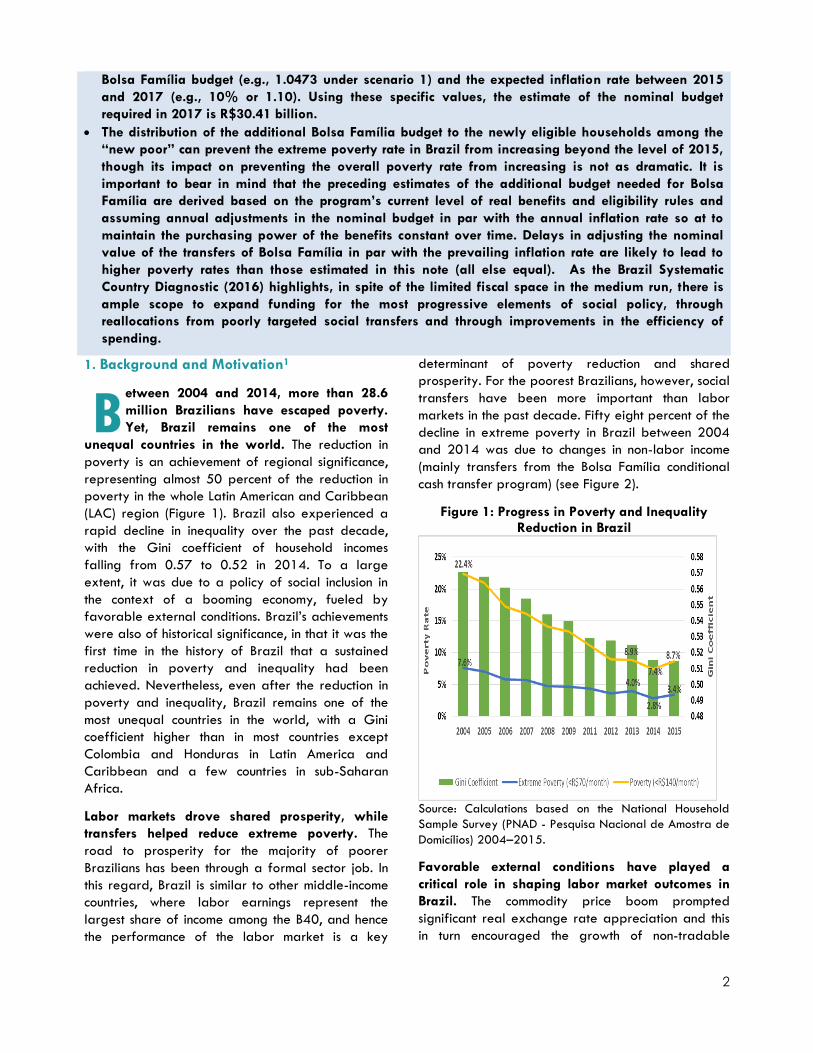
(LAC) region (Figure 1). Brazil also experienced a
rapid decline in inequality over the past decade,
with the Gini coefficient of household incomes
falling from 0.57 to 0.52 in 2014. To a large
extent, it was due to a policy of social inclusion in
the context of a booming economy, fueled by
favorable external conditions. Brazil’s achievements
were also of historical significance, in that it was the
first time in the history of Brazil that a sustained
reduction in poverty and inequality had been
achieved. Nevertheless, even after the reduction in
poverty and inequality, Brazil remains one of the
most unequal countries in the world, with a Gini
coefficient higher than in most countries except
Colombia and Honduras in Latin America and
Caribbean and a few countries in sub-Saharan
Africa.
Labor markets drove shared prosperity, while
transfers helped reduce extreme poverty. The
road to prosperity for the majority of poorer
Brazilians has been through a formal sector job. In
this regard, Brazil is similar to other middle-income
countries, where labor earnings represent the
largest share of income among the B40, and hence
the performance of the labor market is a key
determinant of poverty reduction and shared
prosperity. For the poorest Brazilians, however, social
transfers have been more important than labor
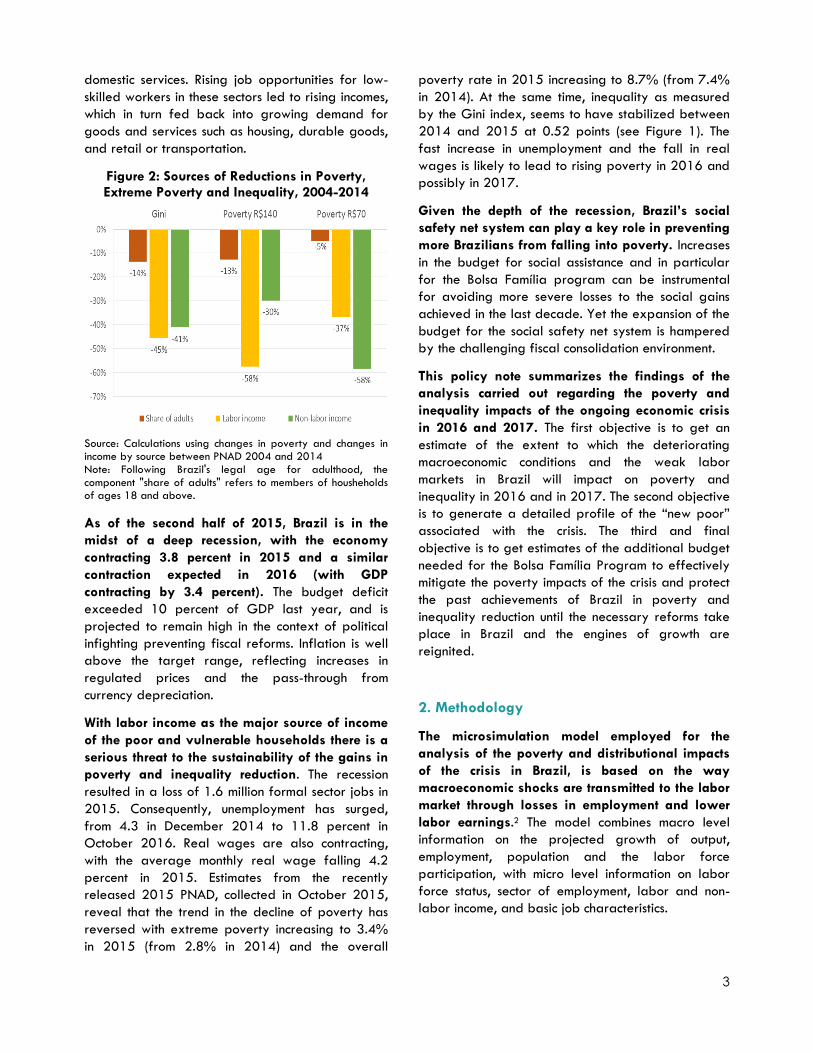
markets in the past decade. Fifty eight percent of the
decline in extreme poverty in Brazil between 2004
and 2014 was due to changes in non-labor income
(mainly transfers from the Bolsa Família conditional
cash transfer program) (see Figure 2).
Figure 1: Progress in Poverty and Inequality Reduction in Brazil
Source: Calculations based on the National Household
Sample Survey (PNAD - Pesquisa Nacional de Amostra de
Domicílios) 2004–2015.
Favorable external conditions have played a
critical role in shaping labor market outcomes in
Brazil. The commodity price boom prompted
significant real exchange rate appreciation and this
in turn encouraged the growth of non-tradable
B
3
domestic services. Rising job opportunities for low-
skilled workers in these sectors led to rising incomes,
which in turn fed back into growing demand for
goods and services such as housing, durable goods,
and retail or transportation.
Figure 2: Sources of Reductions in Poverty, Extreme Poverty and Inequality, 2004-2014
Source: Calculations using changes in poverty and changes in income by source between PNAD 2004 and 2014 Note: Following Brazil's legal age for adulthood, the component "share of adults" refers to members of housheholds of ages 18 and above.
As of the second half of 2015, Brazil is in the
midst of a deep recession, with the economy
contracting 3.8 percent in 2015 and a similar
contraction expected in 2016 (with GDP
contracting by 3.4 percent). The budget deficit
exceeded 10 percent of GDP last year, and is
projected to remain high in the context of political
infighting preventing fiscal reforms. Inflation is well
above the target range, reflecting increases in
regulated prices and the pass-through from
currency depreciation.
With labor income as the major source of income
of the poor and vulnerable households there is a
serious threat to the sustainability of the gains in
poverty and inequality reduction. The recession
resulted in a loss of 1.6 million formal sector jobs in
2015. Consequently, unemployment has surged,
from 4.3 in December 2014 to 11.8 percent in
October 2016. Real wages are also contracting,
with the average monthly real wage falling 4.2
percent in 2015. Estimates from the recently
released 2015 PNAD, collected in October 2015,
reveal that the trend in the decline of poverty has
reversed with extreme poverty increasing to 3.4%
in 2015 (from 2.8% in 2014) and the overall
poverty rate in 2015 increasing to 8.7% (from 7.4%
in 2014). At the same time, inequality as measured
by the Gini index, seems to have stabilized between
2014 and 2015 at 0.52 points (see Figure 1). The
fast increase in unemployment and the fall in real
wages is likely to lead to rising poverty in 2016 and
possibly in 2017.
Given the depth of the recession, Brazil’s social
safety net system can play a key role in preventing
more Brazilians from falling into poverty. Increases
in the budget for social assistance and in particular
for the Bolsa Família program can be instrumental
for avoiding more severe losses to the social gains
achieved in the last decade. Yet the expansion of the
budget for the social safety net system is hampered
by the challenging fiscal consolidation environment.
This policy note summarizes the findings of the
analysis carried out regarding the poverty and
inequality impacts of the ongoing economic crisis
in 2016 and 2017. The first objective is to get an
estimate of the extent to which the deteriorating
macroeconomic conditions and the weak labor
markets in Brazil will impact on poverty and
inequality in 2016 and in 2017. The second objective
is to generate a detailed profile of the “new poor”
associated with the crisis. The third and final
objective is to get estimates of the additional budget
needed for the Bolsa Família Program to effectively
mitigate the poverty impacts of the crisis and protect
the past achievements of Brazil in poverty and
inequality reduction until the necessary reforms take
place in Brazil and the engines of growth are
reignited.
2. Methodology
The microsimulation model employed for the
analysis of the poverty and distributional impacts
of the crisis in Brazil, is based on the way
macroeconomic shocks are transmitted to the labor
market through losses in employment and lower
labor earnings.2 The model combines macro level
information on the projected growth of output,
employment, population and the labor force
participation, with micro level information on labor
force status, sector of employment, labor and non-
labor income, and basic job characteristics.

4
The microsimulation model involves three basic
steps: (1) the estimation of a baseline model; (2)
simulation analysis; and (3) impact assessment
(see Figure 3 for a visual summary). The first step
uses household- and individual-level information to
model labor market behavior. Labor force and
employment status are divided into five categories
in total, and are modeled as functions of household
and individual characteristics.3 Parameters are
estimated by means of a multinomial logit model
for occupational choice as in Ferreira et al. (2008).
Labor earnings for all employed individuals are
then modeled as a function of individual and job
characteristics, and parameters are estimated by
means of a earnings function (Mincer, 1974). The
model parameters are estimated based on published
data on macroeconomic variables for the baseline
year 2015, and on household level data from the
2015 PNAD, officially released to the public domain
in November 2016. After removing observations with
missing income and non-usual household members
(such as maids and their family members), the number
of observations used for this analysis is roughly
350,000. The ADePT simulation software used
ensures the consistency among the macro variables in
the baseline year and the individual aggregates
from the micro part of the model.
Figure 3: The Basic Steps in the Microsimulation Model
Source: Authors’ work based on Olivieri et al. (2014).
The projected values of the main macroeconomic
and demographic variables in the model are key
ingredients for the simulation analysis. The
growth rate in GDP between 2015 and
2016/2017 in the country overall and in each of
the three sectors is obtained from the Fall 2016
issue of the Brazil Macro-Poverty Outlook (MPO)
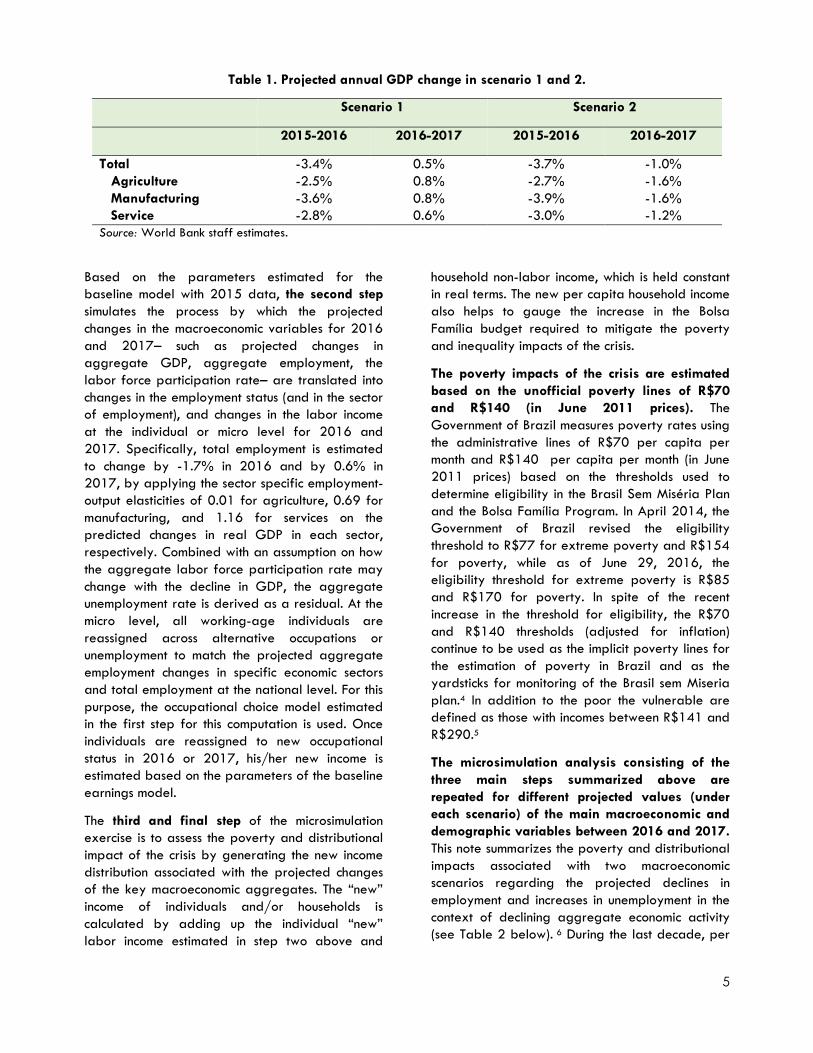
of the World Bank (see Table 1). Specifically, the
Brazil MPO forecasts that real GDP for the
Brazilian economy overall will decline by 3.4%
between 2015 and 2016 and increase by 0.5%
between 2016 and 2017. The MPO also predicts
that the manufacturing sector will shrink at an
annual rate of 3.6% between 2015 and 2016, as
well as a decline in real GDP over the same
period in the agricultural and service sectors (by
2.5% and 2.8%, respectively). Between 2016 and
2017, it is expected that positive growth rates will
reappear for the economy overall and each of the
three key sectors. In scenario 2, which is more
pessimistic, it is assumed that the decline in real
GDP between 2015 and 2016 will the slightly
greater than in the baseline scenario 1, i.e., GDP
declining by 3.7%, instead of -3.4%, whereas the
decline in GDP between 2016 and 2017 continues
to be negative at -1.0%, instead of the increase of
0.5% in the base case scenario 1. In scenario 2, the
sector-specific declines in GDP are derived by
rescaling the change between 2015 and 2016
and between 2016 and 2017.
5
Table 1. Projected annual GDP change in scenario 1 and 2.
Based on the parameters estimated for the
baseline model with 2015 data, the second step
simulates the process by which the projected
changes in the macroeconomic variables for 2016
and 2017– such as projected changes in
aggregate GDP, aggregate employment, the
labor force participation rate– are translated into
changes in the employment status (and in the sector
of employment), and changes in the labor income
at the individual or micro level for 2016 and
2017. Specifically, total employment is estimated
to change by -1.7% in 2016 and by 0.6% in
2017, by applying the sector specific employment-
output elasticities of 0.01 for agriculture, 0.69 for
manufacturing, and 1.16 for services on the
predicted changes in real GDP in each sector,
respectively. Combined with an assumption on how
the aggregate labor force participation rate may
change with the decline in GDP, the aggregate
unemployment rate is derived as a residual. At the
micro level, all working-age individuals are
reassigned across alternative occupations or
unemployment to match the projected aggregate
employment changes in specific economic sectors
and total employment at the national level. For this
purpose, the occupational choice model estimated
in the first step for this computation is used. Once
individuals are reassigned to new occupational
status in 2016 or 2017, his/her new income is
estimated based on the parameters of the baseline
earnings model.
The third and final step of the microsimulation
exercise is to assess the poverty and distributional
impact of the crisis by generating the new income
distribution associated with the projected changes
of the key macroeconomic aggregates. The “new”
income of individuals and/or households is
calculated by adding up the individual “new”
labor income estimated in step two above and
household non-labor income, which is held constant
in real terms. The new per capita household income
also helps to gauge the increase in the Bolsa
Família budget required to mitigate the poverty
and inequality impacts of the crisis.
The poverty impacts of the crisis are estimated
based on the unofficial poverty lines of R$70
and R$140 (in June 2011 prices). The
Government of Brazil measures poverty rates using
the administrative lines of R$70 per capita per
month and R$140 per capita per month (in June
2011 prices) based on the thresholds used to
determine eligibility in the Brasil Sem Miséria Plan
and the Bolsa Família Program. In April 2014, the
Government of Brazil revised the eligibility
threshold to R$77 for extreme poverty and R$154
for poverty, while as of June 29, 2016, the
eligibility threshold for extreme poverty is R$85
and R$170 for poverty. In spite of the recent
increase in the threshold for eligibility, the R$70
and R$140 thresholds (adjusted for inflation)
continue to be used as the implicit poverty lines for
the estimation of poverty in Brazil and as the
yardsticks for monitoring of the Brasil sem Miseria
plan.4 In addition to the poor the vulnerable are
defined as those with incomes between R$141 and
R$290.5
The microsimulation analysis consisting of the
three main steps summarized above are
repeated for different projected values (under
each scenario) of the main macroeconomic and
demographic variables between 2016 and 2017.
This note summarizes the poverty and distributional
impacts associated with two macroeconomic
scenarios regarding the projected declines in
employment and increases in unemployment in the
context of declining aggregate economic activity
(see Table 2 below). 6 During the last decade, per
Scenario 1 Scenario 2
2015-2016 2016-2017 2015-2016 2016-2017
Total -3.4% 0.5% -3.7% -1.0%
Agriculture -2.5% 0.8% -2.7% -1.6%
Manufacturing -3.6% 0.8% -3.9% -1.6%
Service -2.8% 0.6% -3.0% -1.2%
Source: World Bank staff estimates.

6
capita GDP and per capita household income have
been growing along similar paths. It is conceivable
that the current economic crisis breaks this pattern.
The population size in 2016 and 2017 is
adjusted based on the actual rate of population
change between 2015 and 2016 (using PNAD
Continua). The fraction of the working age
population (16 years and older) in the labor force,
or the labor participation rate, in 2015 and 2016
is also based on PNAD Continua. It is assumed that
the labor participation rate in 2016 and 2017 will
be approximately the same compared to that in
2015 (actually only 0.1% higher) after accounting
for growth in the population from year to year
and discouraged worker effects associated with
the crisis.7
Table 2. Comparison Between Scenario 1 and Scenario 2
Employment change since 2015
Scenario Year Annual
GDP
Change
Unempl.
Rate
Labor
Force
Particip.
Rate
Total Agriculture Manufacturing Service
1 2016 -3.4% 11.2% 63.6% -1.7% -1.6% -9.6% -0.2%
2017 0.5% 11.8% 63.6% 0.6% 0.0% 0.6% 0.7%
2 2016 -3.7% 11.2% 63.6% -1.7% -1.6% -9.6% -0.2%
2017 -1.0% 13.3% 63.6% -1.2% -0.0% -1.1% -1.4%
Source: World Bank staff estimates
Note: Numbers in grey cells are set exogenously whereas numbers in cells with no shade are determined as residuals.
The distributional impact of each one of these
scenarios is evaluated first under the assumption
of no change in the budget of Bolsa Família and
second after allowing for an increase in the Bolsa
Família budget and the coverage of the program.
The poverty and distributional impacts under these
two different scenarios without and with changes in
the Bolsa Família budget provide a sufficiently
narrow zone for policy decisions anticipating the
adverse impacts of the crisis on poverty.
Caveats
As already mentioned, the microsimulations rely on a
number of untested assumptions necessary to make
microeconomic data consistent with macroeconomic
projections.8 Key among these is the assumption that
the structural relationships summarized by the
parameters of the regression equations estimated in
the baseline year 2015 remain unchanged in 2016
and 2017. In other words, the functional
relationships that determine either employment in a
specific sector or the wage earned by an individual
are assumed to be remain unaffected by the
continuation of the crisis in 2016 or the turnaround in
real GDP growth in 2017. This assumes, for instance,
that the rather unusual decline in the skilled to
unskilled wage premium observed between 2002
and 2014 continues during the crisis period.9 It is
conceivable that the skills premium increases again
as pressures at the lower part of the wage
distribution ease off during the crisis period. To the
extent there is a drift back to informality and the
minimum wage becomes less binding, the same skill
distribution in the population during the crisis period
may be associated with very different relative
earnings outcomes in 2016-2017 than in 2014, and
possibly higher poverty and inequality. Taking into
account these caveats associated with the
microsimulation model, the estimates of poverty and
inequality discussed for scenarios 1 and 2 may
actually provide only a lower bound of the poverty
and inequality impacts of the crisis. In addition, the
model assumes that the factors of production (labor
and capital) are immobile across space, and that the
rate of change in GDP is the same as the rate of
change in household income. Finally, prices are held
constant throughout the analysis.10
3. Poverty and inequality impacts
According to the results of the microsimulation
analysis, poverty headcount ratios will rise in
2016 and remain high in 2017 (see Figure 4). In
scenario 1, the number of extreme poor will increase
by 1.5 million people, from 6.8 million in 2015 to
8.3 million in 2016 (and to 8.5 million in 2017),
raising the extreme poverty headcount ratio from

7
3.4% in 2015 to 4.1% in 2016 and to 4.2% in
2017. The number of moderate poor will increase
by 2.3 million from 17.3 million in 2015 to 19.6
million in 2016 (and to 19.8 million in 2017). This
pushes up the poverty headcount ratio from 8.7% to
9.7% in 2016. In the more pessimistic scenario 2, the
continuing rise in the extreme poverty rate results in
a higher extreme poverty headcount ratio of 4.6%
in 2017, which represents an increase in the number
of extreme poor between 2015 and 2017 by 2.6
million people, whereas the higher moderate
poverty headcount ratio of 10.3% in 2017
represents an increase in the number of moderate
poor by 3.6 million people (between 2015 and
2017).
Figure 4. Poverty headcount ratio
Scenario 1 Scenario 2
Source: World Bank staff estimates based on PNAD 2015 and the ADePT Simulation Module (Olivieri et al. 2014)
However, poverty rates will increase more in the
urban areas and less in the rural areas (Figure 5).
In contrast to urban areas where poverty headcount
ratios will rise in 2016 and remain at the higher
level in 2017, rural areas in 2017 will have
headcount ratios only slightly higher than the ones as
of 2015.
Figure 5. Poverty headcount ratio in urban and rural areas
Scenario 1 Scenario 2
Source: World Bank staff estimates based on PNAD 2015 and the ADePT Simulation Module (Olivieri et al. 2014).
The rise in poverty during the crisis in Brazil will
be accompanied by an increase in income
inequality in the country (see Figure 6). Moreover,
the predicted increase in inequality appears to be
independent of the index of inequality used (e.g.,
Gini index or Theil index).11
8
Figure 6. Income inequality
Scenario 1 Scenario 2
Source: World Bank staff estimates based on PNAD 2015 and the ADePT Simulation Module (Olivieri et al. 2014).
4. Transition Matrices and the Profile of the
“New Poor”
As a consequence of the crisis, households at the
lower part of the distribution of income in either
2016 or 2017 will have lower income compared
to households at the lower part of the income
distribution in 2015. Irrespective of the crisis
scenario analyzed, the Growth Incidence Curves
(GIC) in Figure 7 below reveal that households
located at the lower part (bottom 10%) of the
distribution of income in 2016 or 2017 will have
significantly lower income than households at the
corresponding part of the income distribution in
2015. This is even more apparent in the growth
incidence curves obtained under the more pessimistic
scenario 2. As a result of the crisis, the bottom part
of the distribution in 2016 or 2017 is not necessarily
composed of the exact same households in the
bottom part of the distribution of income in 2015.
Many of the new members of the lower part of the
income distribution in 2016/2017 are individuals
who in 2015 reported not receiving any non-labor
income (including cash transfers from social
assistance programs such as Bolsa Família). With the
continuation of the crisis in 2016 these individuals
lose their jobs and thus their primary source of
income, i.e., income from labor.12 As the analysis
below demonstrates, an increase in the budget of
the Bolsa Família program that would allow for an
increase in the program’s coverage, could be a very
effective means of mitigating the adverse impacts of
the crisis on income and welfare.
Figure 7: Growth Incidence Curves Scenario 1 Scenario 2
Source: World Bank staff estimates based on PNAD 2015 and the ADePT Simulation Module (Olivieri et al. 2014) Note: The horizontal axis is the percentile of per capita household income as of 2016 or 2017.
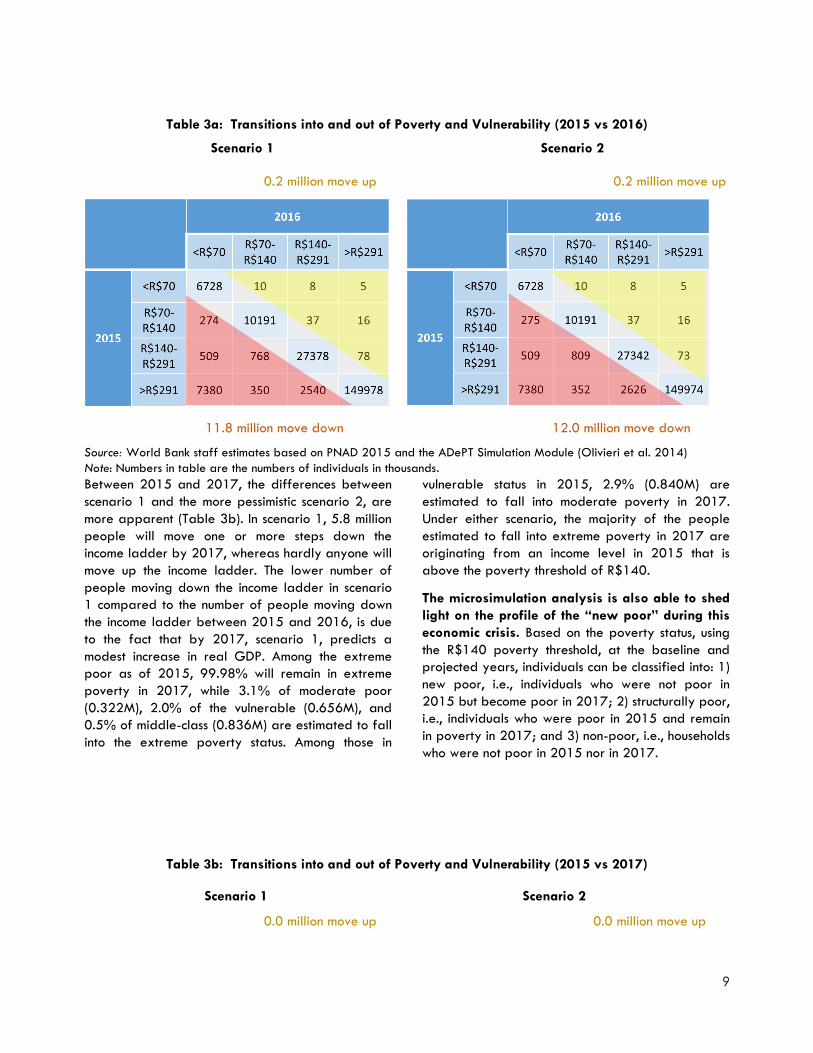
Tables 3a and 3b provide a more detailed picture
of the transitions of individuals into and out of
poverty and vulnerability between 2015 and
2016/17. Between 2015 and 2016, the year in
which the crisis reaches its peak, 11.8 million people
will move one or more steps down the ladder by
2016 (12 million in scenario 2), whereas only 0.2
million people will move up (Table 3a).
9
Table 3a: Transitions into and out of Poverty and Vulnerability (2015 vs 2016)
Scenario 1 Scenario 2
0.2 million move up 0.2 million move up
11.8 million move down 12.0 million move down
Source: World Bank staff estimates based on PNAD 2015 and the ADePT Simulation Module (Olivieri et al. 2014)
Note: Numbers in table are the numbers of individuals in thousands.
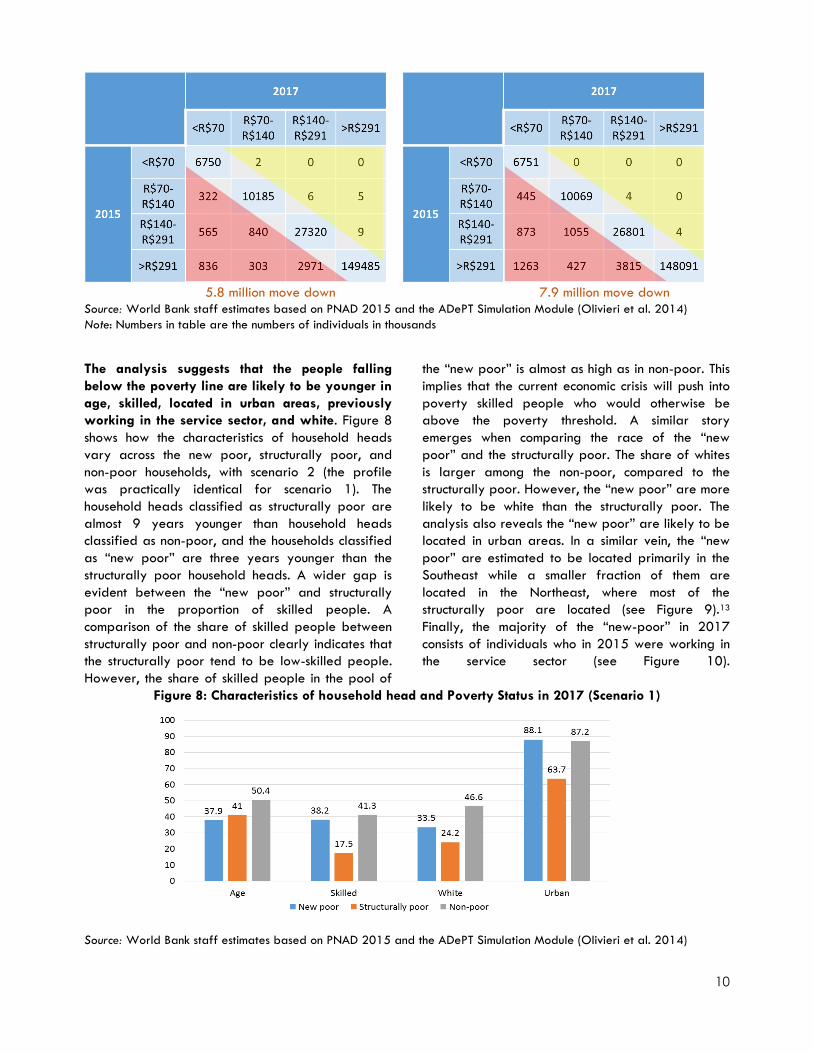
Between 2015 and 2017, the differences between
scenario 1 and the more pessimistic scenario 2, are
more apparent (Table 3b). In scenario 1, 5.8 million
people will move one or more steps down the
income ladder by 2017, whereas hardly anyone will
move up the income ladder. The lower number of
people moving down the income ladder in scenario
1 compared to the number of people moving down
the income ladder between 2015 and 2016, is due
to the fact that by 2017, scenario 1, predicts a
modest increase in real GDP. Among the extreme
poor as of 2015, 99.98% will remain in extreme
poverty in 2017, while 3.1% of moderate poor
(0.322M), 2.0% of the vulnerable (0.656M), and
0.5% of middle-class (0.836M) are estimated to fall
into the extreme poverty status. Among those in
vulnerable status in 2015, 2.9% (0.840M) are
estimated to fall into moderate poverty in 2017.
Under either scenario, the majority of the people
estimated to fall into extreme poverty in 2017 are
originating from an income level in 2015 that is
above the poverty threshold of R$140.
The microsimulation analysis is also able to shed
light on the profile of the “new poor” during this
economic crisis. Based on the poverty status, using
the R$140 poverty threshold, at the baseline and
projected years, individuals can be classified into: 1)
new poor, i.e., individuals who were not poor in
2015 but become poor in 2017; 2) structurally poor,
i.e., individuals who were poor in 2015 and remain
in poverty in 2017; and 3) non-poor, i.e., households
who were not poor in 2015 nor in 2017.
Table 3b: Transitions into and out of Poverty and Vulnerability (2015 vs 2017)
Scenario 1 Scenario 2
0.0 million move up 0.0 million move up
10
5.8 million move down 7.9 million move down Source: World Bank staff estimates based on PNAD 2015 and the ADePT Simulation Module (Olivieri et al. 2014)
Note: Numbers in table are the numbers of individuals in thousands
The analysis suggests that the people falling
below the poverty line are likely to be younger in
age, skilled, located in urban areas, previously
working in the service sector, and white. Figure 8
shows how the characteristics of household heads
vary across the new poor, structurally poor, and
non-poor households, with scenario 2 (the profile
was practically identical for scenario 1). The
household heads classified as structurally poor are
almost 9 years younger than household heads
classified as non-poor, and the households classified
as “new poor” are three years younger than the
structurally poor household heads. A wider gap is
evident between the “new poor” and structurally
poor in the proportion of skilled people. A
comparison of the share of skilled people between
structurally poor and non-poor clearly indicates that
the structurally poor tend to be low-skilled people.
However, the share of skilled people in the pool of
the “new poor” is almost as high as in non-poor. This
implies that the current economic crisis will push into
poverty skilled people who would otherwise be
above the poverty threshold. A similar story
emerges when comparing the race of the “new
poor” and the structurally poor. The share of whites
is larger among the non-poor, compared to the
structurally poor. However, the “new poor” are more
likely to be white than the structurally poor. The
analysis also reveals the “new poor” are likely to be
located in urban areas. In a similar vein, the “new
poor” are estimated to be located primarily in the
Southeast while a smaller fraction of them are
located in the Northeast, where most of the
structurally poor are located (see Figure 9).13
Finally, the majority of the “new-poor” in 2017
consists of individuals who in 2015 were working in
the service sector (see Figure 10).
Figure 8: Characteristics of household head and Poverty Status in 2017 (Scenario 1)
Source: World Bank staff estimates based on PNAD 2015 and the ADePT Simulation Module (Olivieri et al. 2014)

11
Figure 9: Region of Residence (in 2015) and Poverty Status in 2017 (Scenario 1)
Source: World Bank staff estimates based on PNAD 2015 and the ADePT Simulation Module (Olivieri et al. 2014)
Figure 10: Occupational Status in 2015 and Poverty Status in 2017
Source: World Bank staff estimates based on PNAD 2015 and the ADePT Simulation Module (Olivieri et al. 2014)
5. Mitigating the Poverty Impacts of the Crisis
through Bolsa Família
Social assistance in Brazil consists of three main
pillars. First, disability benefits provide transfers to
older or disabled people known as Benefício de
Prestação Continuada (BPC); second, the inclusion of
self-employed or agricultural family workers into
social insurance institutions, such as the Rural Pension
Program (Previdência Social Rural or PSR); and third,
targeted income support, such as the Bolsa Família
CCT program. The benefits of the social assistance
programs for poverty prevention in old age in Brazil
are received primarily by low-income workers, both
rural and urban, who move in and out of informality
during their working lives (Gragnolati et al. 2013).
Brazil initiated these programs years ago, and other
LAC countries have followed suit. Between 2000 and
2013 at least 18 countries in the region introduced
inclusive reforms, which sought to increase coverage
of the elderly (Rofman et al. 2014).
Chronic poverty is addressed through the Bolsa
Família Program (PBF), the flagship CCT program
of the MDS. It provides cash transfers to poor
households, conditional on school attendance and use
of maternal and child health services. The program
was brought to scale at remarkable speed with the
number of beneficiaries going from 3.6 million to
11.1 million families in four years (see Figure 11). As
of 2014, the program reaches about 56 million
individuals or 14 million households— around a
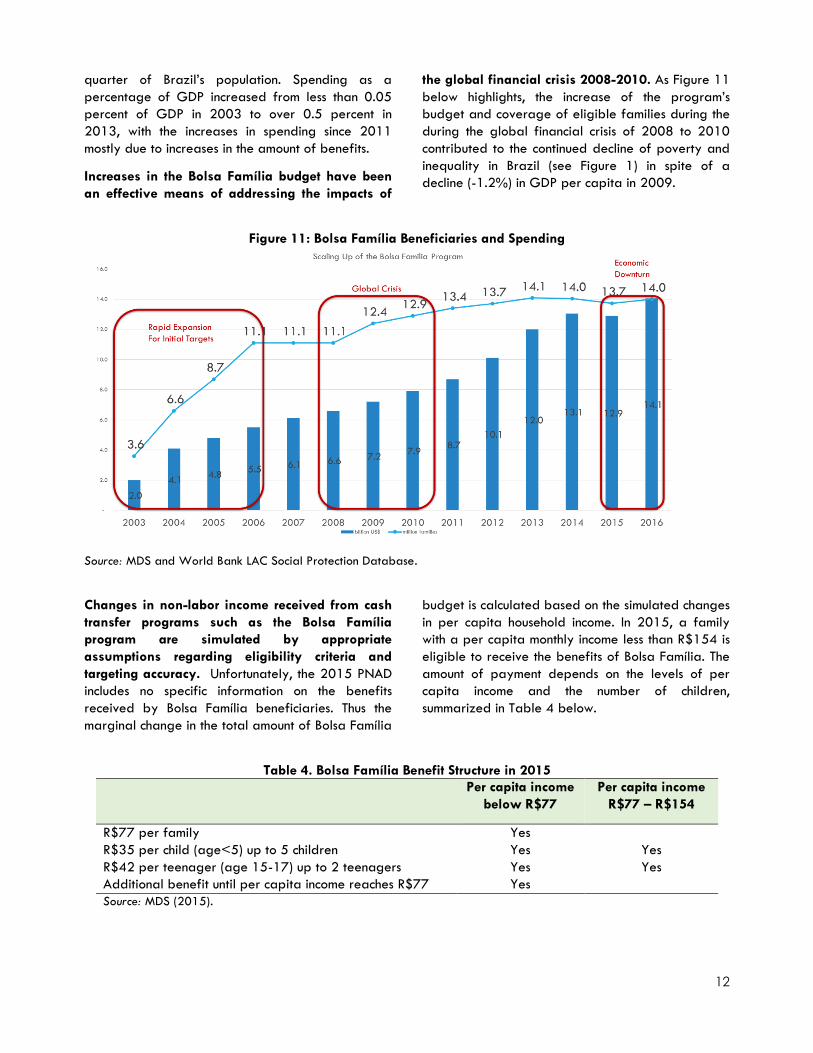
12
quarter of Brazil’s population. Spending as a
percentage of GDP increased from less than 0.05
percent of GDP in 2003 to over 0.5 percent in
2013, with the increases in spending since 2011
mostly due to increases in the amount of benefits.
Increases in the Bolsa Família budget have been
an effective means of addressing the impacts of
the global financial crisis 2008-2010. As Figure 11
below highlights, the increase of the program’s
budget and coverage of eligible families during the
during the global financial crisis of 2008 to 2010
contributed to the continued decline of poverty and
inequality in Brazil (see Figure 1) in spite of a
decline (-1.2%) in GDP per capita in 2009.
Figure 11: Bolsa Família Beneficiaries and Spending
Source: MDS and World Bank LAC Social Protection Database.
Changes in non-labor income received from cash
transfer programs such as the Bolsa Família
program are simulated by appropriate
assumptions regarding eligibility criteria and
targeting accuracy. Unfortunately, the 2015 PNAD
includes no specific information on the benefits
received by Bolsa Família beneficiaries. Thus the
marginal change in the total amount of Bolsa Família
budget is calculated based on the simulated changes
in per capita household income. In 2015, a family
with a per capita monthly income less than R$154 is
eligible to receive the benefits of Bolsa Família. The
amount of payment depends on the levels of per
capita income and the number of children,
summarized in Table 4 below.
Table 4. Bolsa Família Benefit Structure in 2015
Per capita income
below R$77
Per capita income
R$77 – R$154
R$77 per family Yes
R$35 per child (age<5) up to 5 children Yes Yes
R$42 per teenager (age 15-17) up to 2 teenagers Yes Yes
Additional benefit until per capita income reaches R$77 Yes
Source: MDS (2015).

13
Table 5 shows how the eligibility of a family for
Bolsa Família benefits can change between 2015
and 2017 as a consequence of the crisis. The first
group of families, denoted as (1) in Table 5, has per
capita income between R$77 and R$154 in 2015
but is projected to have income less than R$77 in
2017. These families become newly eligible for the
basic R$77 payment and the amount needed to fill
the gap if its per capita income remains under R$77.
The second group, denoted by (2), consists of the
families who were not eligible for Bolsa Família in
2015 but are predicted to have per capita income
less than R$77 in 2017. These families will be able
to receive the full Bolsa Família package. The third
group is the families who will also become newly
eligible for Bolsa Família, but unlike the second
group they can receive only payments for children
and teenagers since their per capita income in 2017
is estimated to be greater than R$77. The remaining
three groups of families (4) through (6) will lose their
eligibility for some components of (or the whole
package) of Bolsa Família benefits.
Based on the results from the microsimulations, it
is possible to obtain estimates of the number of
families in each of the six groups in Table 5.
Assuming that benefits will be provided to all
families that satisfy the criteria in Table 4, it is
possible to calculate the additional budget
(marginal budget) required by the Bolsa Família
Program to cover the households affected in the
years 2016 and 2017.
Table 5. Changes in eligibility for Bolsa Família
2015 2017 Increase Decrease
(1) R$77 - R$154 <R$77 Basic + Gap
(2) >R$154 <R$77 Basic + Gap + Child/Teen
(3) >R$154 R$77 - R$154 Child/Teen
(4) <R$77 R$77 - R$154 Basic + Gap
(5) <R$77 >R$154 Basic + Gap +
Child/Teen
(6) R$77 - R$154 >R$154 Child/Teen
Source: World Bank staff estimates based on MDS (2015)
Note: The same thresholds are used in 2017 as in 2015 because all the analysis in the model is carried out in terms of
2015 prices. The increases in the Bolsa Família benefit structure and eligibility thresholds adopted in June 2016, where
practically identical with the prevailing inflation rate between 2015 and 2016.
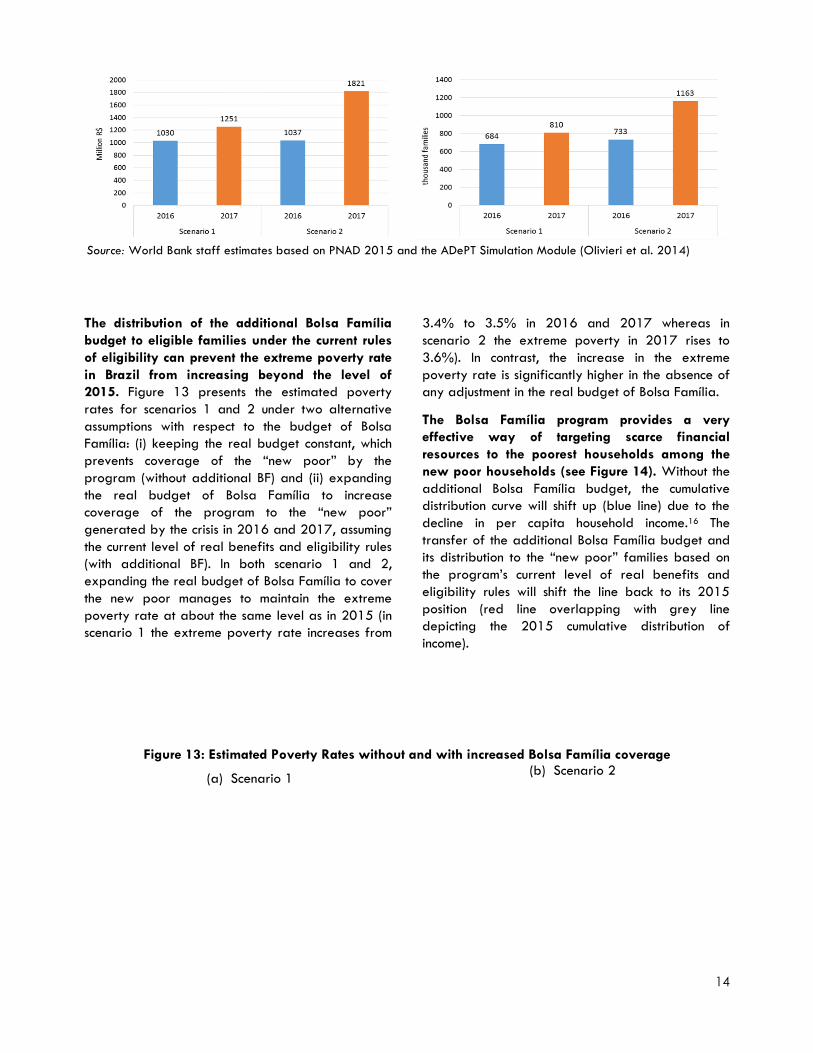
Following the methodology outlined above, the
marginal change in the budget of Bolsa Família
needed to extend coverage of the program to the
“new poor” can be calculated (see Figure 12).
Abstracting from operational issues associated with
the identification and targeting of the “new poor
households, the microsimulation analysis for scenario
1, implies that in 2017, 0.810M new families (not
individuals) will be eligible for Bolsa Família
benefits.14 This entails an increase in the Bolsa
Família budget of R$1.25 billion, or a 4.73%
increase in the budget (of R$26.4 billion in 2015).15
This increase in the budget needed can be broken
down in two parts: The R$978M that is needed to
cover the 0.522M families falling below the extreme
poverty threshold of R$77 per capita per month,
and the R$199M that is needed to cover the
0.232M families falling between the thresholds of
R$77 and R$154 per capita per month. With
scenario 2, in 2017, 1.163M new families will be
eligible for Bolsa Família benefits. This entails an
increase in the Bolsa Família budget by R$1.82
billion or a of 6.9% increase from the 2015 budget
(of R$26.4 billion in 2015).
Figure 12: Marginal change in the budget and the numbers of recipients of Bolsa Família
(a) Marginal Change in the Bolsa Família Budget
(b) Marginal Change in the Number of Bolsa Família recipient families
14
Source: World Bank staff estimates based on PNAD 2015 and the ADePT Simulation Module (Olivieri et al. 2014)
The distribution of the additional Bolsa Família
budget to eligible families under the current rules
of eligibility can prevent the extreme poverty rate
in Brazil from increasing beyond the level of
2015. Figure 13 presents the estimated poverty
rates for scenarios 1 and 2 under two alternative
assumptions with respect to the budget of Bolsa
Família: (i) keeping the real budget constant, which
prevents coverage of the “new poor” by the
program (without additional BF) and (ii) expanding
the real budget of Bolsa Família to increase
coverage of the program to the “new poor”
generated by the crisis in 2016 and 2017, assuming
the current level of real benefits and eligibility rules
(with additional BF). In both scenario 1 and 2,
expanding the real budget of Bolsa Família to cover
the new poor manages to maintain the extreme
poverty rate at about the same level as in 2015 (in
scenario 1 the extreme poverty rate increases from
3.4% to 3.5% in 2016 and 2017 whereas in
scenario 2 the extreme poverty in 2017 rises to
3.6%). In contrast, the increase in the extreme
poverty rate is significantly higher in the absence of
any adjustment in the real budget of Bolsa Família.
The Bolsa Família program provides a very
effective way of targeting scarce financial
resources to the poorest households among the
new poor households (see Figure 14). Without the
additional Bolsa Família budget, the cumulative
distribution curve will shift up (blue line) due to the
decline in per capita household income.16 The
transfer of the additional Bolsa Família budget and
its distribution to the “new poor” families based on
the program’s current level of real benefits and
eligibility rules will shift the line back to its 2015
position (red line overlapping with grey line
depicting the 2015 cumulative distribution of
income).
Figure 13: Estimated Poverty Rates without and with increased Bolsa Família coverage
(a) Scenario 1 (b) Scenario 2

15
Source: World Bank staff estimates based on PNAD 2015 and the ADePT Simulation Module (Olivieri et al. 2014)
Figure 14: Changes in income distribution without and with expanded Bolsa Família coverage
Source: World Bank staff estimates based on PNAD 2015 and the ADePT Simulation Module (Olivieri et al. 2014) Note: The vertical lines in the figures above denote the R$70 poverty line in 2015 Reais (=R$92.3 in 2015) and the R$140 Poverty line in 2015 Reais (= R$184 in 2015).
6. Policy Considerations
The depth and duration of the current economic
crisis in Brazil gives rise to the opportunity to
expand the role of Bolsa Família from an effective
redistribution program to a true safety net
program that is sufficiently flexible to expand its
coverage to the “new poor” households generated
by the crisis. Brazil has managed to build one of
the largest safety net systems in the world and the
Bolsa Família program constitutes the flagship
program of the Ministry of Social Development
(MDS). Conditional cash transfer programs such as
Bolsa Família do not only have a redistributive role,
but also an important role at protecting the poor in
times of an economic downturn. To fulfill this function,
counter-cyclical (increased) budgets are required at
times of crises to increase coverage of the increasing
number of poor.
The analysis in this note suggests that an
increased budget (in real terms) of about 4.73%
(R$1.25 billion) and 6.9% (R$1.82 billion) from
the 2015 budget of R$26.4 billion, would be a
very effective way of targeting scarce financial
resources to the most needy among the “new
poor” households generated by the crisis.17 The
distribution of the additional Bolsa Família budget to
the newly eligible households among the “new poor”
can prevent the extreme poverty rate in Brazil from
increasing beyond the level of 2015, though its
impact on preventing the overall poverty rate from
increasing is not as dramatic. It is important to bear
in mind that these estimates are derived based on
the program’s current level of real benefits and
eligibility rules and assuming annual adjustments in
the nominal budget in par with the annual inflation
rate so at to maintain the purchasing power of the
benefits constant over time. Delays in adjusting the
nominal value of the transfers of Bolsa Família in
par with the prevailing inflation rate are likely to
lead to higher poverty rates than those estimated in
this note (all else equal).
One encouraging message emerging from this
analysis is that the fiscal adjustment currently
R$70
Poverty line
R$140
Poverty line

16
under implementation in Brazil can be
accomplished at virtually little or no cost to
poverty. Even with the depth of the current
recession, the social gains Brazil made in the last
decade do not appear likely to be reversed under
a range of plausible assumptions. This suggests that
Brazil has crossed an important threshold, and that is
an important legacy of the past decade. The
estimated increase in the budget for the Bolsa
Família program required to mitigate the impacts of
the crisis on extreme poverty is relatively low (less
than 7% in the pessimistic growth scenario). As the
Brazil Systematic Country Diagnostic (2016)
highlights, in spite of the limited fiscal space in the
medium run, there is ample scope to increase the
budget for the most progressive elements of social
policy, through reallocations from entitlement
programs and through improvements in the
efficiency of public spending.18
17
References
Bourguignon, F., Bussolo, M., Pereira da Silva, L. (2008). “The impact of macroeconomic policies on poverty
and income distribution: Macro-micro evaluation techniques and tools.” In F. Bourguignon, M. Bussolo, & L.
Pereira da Silva (eds.), The impact of macroeconomic policies on poverty and income distribution: Macro-
micro evaluation techniques and tools. Washington, D.C.: World Bank.
Brazil Macro Poverty Outlook (2016: Fall) Washington D.C., The World Bank.
Brazil Systematic Country Diagnostic (2016) “Retaking the Path to Inclusion, Growth, and Sustainability”, May
2016. Report No: 101431-BR, Washington D.C., The World Bank.
Cabanillas, O.B., Lugo, M.A., Nielsen, H., Rodríguez-Castelán, C., & Zanetti, M.P. (2015). “Is Uruguay more
resilient this time? Distributional impacts of a crisis similar to the 2001-02 Argentine crisis.” Journal of
Banking and Financial Economics, 2(4), 64-90.
Ferreira, F., Leite, P., Pereira da Silva, L., & Picchetti, P. (2008). “Can the distributional impacts of
macroeconomic shocks be predicted? A comparison of top-down macro-micro models with historical data
for Brazil.” In F. Bouruignon, M. Bussolo, & L. Pereira da Silva (eds.), The impact of macroeconomic policies
on poverty and income distribution: Macro-micro evaluation techniques and tools. Washington, D.C.: World
Bank.
Gragnolati, Michele, Ole Hagen Jorgensen, Romera Rocha, and Anna Fruttero. 2011. Growing Old in an
Older Brazil: Implications of Population Aging on Growth, Poverty, Public Finance, and Service Delivery.
Washington, DC: World Bank.
MDS (2015). Plano Brazil Sem Miséria: Caderno de Resultados 2011 | 2014.\
Mincer, J. (1974). Schooling, experience and earnings. New York: Columbia University Press for the National
Bureau of Economic Research.
Olivieri, S., Radyakin, S., Kolenikov, S., Lokshin, M., Narayan, A., & Sánchez-Páramo, C. (2014). Simulating
distributional impacts of macro-dynamics: Theory and practical applications. Washington, D.C.: World Bank.
Rofman, Rafael, Ignacio Apella, and Evelyn Vezza, eds. 2014. Beyond Contributory Pensions: Fourteen
Experiences with Coverage Expansion in Latin America. The World Bank.
http://elibrary.worldbank.org/doi/book/10.1596/978-1-4648-0390-1.
Skoufias, E. R. Gukovas, and T. Scot (2016) “Variations in Participation and Employment in Brazilian
Metropolitan Areas” Background paper for the Brazil Programmatic Poverty Analysis Task of the World
Bank.

18
1 Note prepared by the LAC Poverty and Equity GP Team: Emmanuel Skoufias, Shohei Nakamura, and Renata
Gukovas. Martin Raiser, Ricardo Paes de Barros, Pedro Olinto, Oscar Calvo-Gonzalez, and Antonio Nucifora,
provided very constructive suggestions and feedback. This note is a revised and updated version of an earlier note
using data from the 2014 PNAD as a baseline year. 2 See Olivieri et al. (2014) for a detailed description of the ADePT simulation module developed for microsimulations
of the poverty and welfare impacts of economic crises (http://go.worldbank.org/UDTL02A390) .The ADepT crisis
simulation module is based on a simplified version of the approaches developed by Bourguignon, Bussolo, and
Pereira da Silva (2008) and Ferreira et al. (2008). 3 The categories are inactivity (or being out of the labor force), unemployment, and employment in the following
three sectors: the primary sector (agriculture, fishing, and mining); manufacturing (including electricity, gas, and
water); and services (including the construction sector). 4 See DECRETO Nº 8.794, DE 29 DE JUNHO DE 2016 5 Based on the Secretaria de Assuntos Estratégicos (SAE) the middle class consists of individuals with incomes above
R$291. http://www.sae.gov.br/imprensa/sae-na-midia/governo-define-que-a-classe-mediatem-renda-entre-r-291-
e-r-1-019-cidade-verde-em-24-07-2013/#ixzz35UobUtKL 6 For more details, see the companion technical note. 7 Recent work by Bank staff also suggests that during this crisis, discouraged worker effects are likely to dominate
instead of the added worker effects that in past crises in Brazil typically contributed to women and other temporary
workers increasing their labor force participation during the crisis period (Skoufias, et al. 2016). 8 See Olivieri et al (2014) for a more detailed discussion of the limitations of the ADePT Simulation module. 9 See Figure 1.12 in the Brazil Systematic Country Diagnostic (2016) where the evolution of the wage skill premium
and inequality is presented. 10 Given that the analysis is being carried out with only one year of data from the 2015 PNAD, adjusted 2015
nominal income for general inflation between 2015 and 2016 or 2017 compared against a poverty threshold that is
also adjusted by the same general inflation rate is equivalent to price changes having no real effects. Another issue
related to prices is spatial disparities in the cost of living. Although Brazil does not have an official poverty line, the
administrative poverty lines used by the Bolsa Família program make no adjustments for cost of living differences
across regions or between urban and rural areas. Alternative simulations carried out (not reported) taking into
account spatial cost of living differences in the baseline year using a spatial cost of living index derived from the
2008/9 POF survey yielded qualitatively similar estimates on the distributional impacts of the crisis in Brazil. 11 The Gini index, for example, is most sensitive to income differences at about the middle of the distribution. 12 The very large declines for the very bottom percentiles of income are primarily due to extreme values and outliers
(i.e., very low but non-zero values of reported income). Reproducing the GIC excluding the bottom 1% of the income
distributions yields the same general picture with the maximum decline in income at the “new” bottom percentile of
income being around -40%. 13 Southeast region includes the following States: Minas Gerais, Espirito Santo, Rio de Janeiro, and São Paulo. 14 In practice, targeting errors are always an issue of concern in the implementation of cash transfer programs such as
Bolsa Família, and it is important to develop targeting mechanisms that minimize inclusion and exclusion errors. 15 Administrative records from the Bolsa Família program report a budget of R$26.4 billion in 2015. The budget
calculations in this note, net out the number of families that would graduate or become ineligible from Bolsa Família
because of increases in their income. It is also assumed that every family whose per capita income less than R$154
and meeting the official criteria receives the benefit. 16 The cumulative distribution functions in Figure 14 zoom-in the per capita income range between R$0 and R$250. 17The estimate of the nominal budget required in 2017 can be calculated by multiplying the 2015 budget (R$26.4
billion) with the estimated increase in the “real” Bolsa Família budget (e.g., 1.0473 under scenario 1) and the
expected inflation rate between 2015 and 2017 (e.g. 10% or 1.10). Using these specific values, the estimate of the
nominal budget required in 2017 is R$30.41 billion. 18 The Brazil Systematic Country Diagnostic (2016) is accessible at: http://documents.worldbank.org/curated/en/180351467995438283/Brazil-Systematic-country-diagnostic


