
i
UNIVERSITY OF KWAZULU-NATAL
Lean Manufacturing Implementation:
A perspective on key success factors
By
Jeremiah Khathutshelo Makhomu
#202517295
A dissertation submitted in partial fulfilment of the requirements for the degree of
Master of Business Administration
Graduate School of Business and Leadership
College of Law and Management Studies
Supervisor: Mr Danny L McCabe
Co-supervisor: Dr Bruce Rhodes
Year of submission: 2012

ii
DECLARATION
I ………………………………………………………………declare that
(i) The research reported in this dissertation/thesis, except where otherwise indicated, is my original
research.
(ii) This dissertation/thesis has not been submitted for any degree or examination at any other university.
(iii) This dissertation/thesis does not contain other persons’ data, pictures, graphs or other information,
unless specifically acknowledged as being sourced from other persons.
(iv) This dissertation/thesis does not contain other persons’ writing, unless specifically acknowledged as
being sourced from other researchers. Where other written sources have been quoted, then:
a) their words have been re-written but the general information attributed to them has
been referenced:
b) where their exact words have been used, their writing has been placed inside quotation
marks, and referenced.
(v) This dissertation/thesis does not contain text, graphics or tables copied and pasted from the Internet,
unless specifically acknowledged, and the source being detailed in the dissertation/thesis and in the
References sections.
Signature:
iii
ACKNOWLEDGEMENTS
This has truly been one of those ‘never ending journeys’ which only could be completed through
sheer perseverance and unwavering support the kind of which can only come from people who
harbour unparalleled faith in one’s ability. One such person who fits perfectly into this category
of people is none other than my one and only wife Avhashoni Emeldah Makhomu who, through
her unwavering support, has travelled the real MBA journey herself. Babes, thank you!
To my three lovely kids, Bono, Vhutali and Mashau I say this is for you for your endurance and
understanding when daddy had to be away studying whilst you are doing your school homework.
To my supervisors Mr Danny McCabe and Dr Bruce Rhodes had it not been for your guidance
and patience in babysitting this dissertation there wouldn’t be any celebration associated with
this study. Thank you!
Jeremiah Makhomu

iv
ABSTRACT
The interest on lean production is mostly based on the empirical evidence that it improves the
company’s competitiveness. However, the implementation of lean manufacturing harbours
enormous difficulties due to a broad-spectrum of variables, compounded by lack of standardised
mechanisms within organisations of analysis and measure of value-adding capabilities.
The purpose of this study was to understand from both a management and employees’
perspective, the relative importance of key success factors, specifically training, for successful
implementation of the lean principles and to understand the impact of training on employees
perceptions of the lean programme.
A quantitative research methodology was conducted in a packaging manufacturing company and
data, collected using a questionnaire from a sample size of 54 employees, was analysed using
SPSS software.
Employees were found to have developed good perceptions about the impact that training had in
their own jobs and also perceived that the lean program overall added value in their organisation.
Employees considered training and management commitment as the most critical factors for a
successful lean implementation.
For lean implementation to be successful employees must be given training that is relevant to
their work and senior management of the organisation must show (display) commitment towards
the lean program being implemented by making necessary resources (time, funds ) available for
lean activities.

v
TABLE OF CONTENTS
DESCRIPTION PAGE
Title Page i
Declaration ii
Acknowledgements iii
Abstract iv
List of Tables v
List of Figures ix
CHAPTER 1
INTRODUCTION
1 Introduction 1
1.1 Motivation for the study 2
1.2 Focus of the study 2
1.3 Problem Statement 3
1.4 Research Questions 4
1.5 Objectives 4
1.6 Limitations of the study 5
1.7 Summary 5
CHAPTER 2
LEAN THEORY
2.1 Introduction 7
2.2 The Roots of Lean principles 8
2.3 Definition of Lean 8
2.4 The Toyota Production System 10
2.5 Lean principles (Lean thinking) 20
2.6 Benefits of Lean 21
2.7 Lean Tools 23
2.8 Critical Success factors 25
2.9 Implementation Barriers 27
2.10 Improving the chances of sustainability 28
2.11 Summary 29
CHAPTER 3
RESEARCH METHODOLOGY
3.1 Introduction 31
3.2 Aims and Objectives of the Study 31
3.3 Participants and Location of the Study 33
3.4 Data Types 33
3.4.1 Primary Data 33

vi
3.4.2 Secondary Data 34
3.4.3 Quantitative Data 34
3.5 Methods and Instrument of Data Collection 35
3.5.1 Construction of the instruments (Questionnaire) 36
3.5.2 Developing the Questionnaire 37
3.5.3 Scale Construction (Rating Scales) 37
3.6 Recruitment of Participants (Sample population) 38
3.7 Validity 38
3.8 Statistical Significance 39
3.9 Administration of the Questionnaires 41
3.9 Summary 41
CHAPTER 4
RESULTS
4.1 Introduction 43
4.2 Demographic Definition of Samples 43
4.2.1 Age of Respondents 44
4.2.2 Race 45
4.2.3 Gender 46
4.2.4 Employment Levels (employment category) 46
4.3 Employees’ confirmation of Lean Implementation 47
4.4 Employees’ confirmation of Lean Training 50
4.5 Value Add Perception 52
4.6 Job Improvement Perception 53
4.7 Cross Tables: Training versus Value Add 54
4.8 Cross Tables: Training versus Job Improvement 58
4.9 Most important aspect for a successful Lean implementation 61
4.10 Chi-Square 62
4.11 Summary 63
CHAPTER 5
DISCUSSION
5.1 Introduction 64
5.2 Aims and Objectives of the study 64
5.3 Demographics of Respondents 65
5.4 Lean tools implemented 66
5.5 Lean training value add perception 67
5.6 Job improvement perceptions 68
5.7 Which factors are important? 69
5.8 Summary 70
CHAPTER 6
CONCLUSIONS AND RECOMMENDATIONS
6.1 Introduction 72
6.2 Does training have an impact on employees’ perceptions? 72

vii
6.3 Findings and implications of the study 73
6.4 Recommendations for Future Studies 74
6.5 Summary 75
REFERENCES 76
Apenndix 1 Ethical Clearance 81
Appendix 2 Survey Informed Consent 82
Appnedix 3 Research Questionnaire 83
Appendix 4 Turnitin Report 86
viii
List of Tables
Table 2.1 Examples and definitions of common lean practices 24 Table 4.1 Age of respondents 44
Table 4.2 Respondents’ Race Cumulative 45
Table 4.3 Respondents Race Cumulative 46
Table 4.4 Employment Level 46
Table 4.5 Respondents’ confirmation of 5s implementation 48
Table 4.6 Respondents’ confirmation of Kanban implementation 48
Table 4.7 Respondents’ confirmation of Focussed Improvement implementation 48
Table 4.8 Respondents’ confirmation of Kiazen implementation 49
Table 4.9 Respondents’ confirmation of Autonomous Maintenance implementation 49
Table 4.10 Respondents’ confirmation of Preventative Maintenance implementation 50
Table 4.11 Confirmation of 5s training 50
Table 4.12 Confirmation of Kanban training 50
Table 4.13 Confirmation of Kaizen training 51
Table 4.14 Confirmation of Focussed Improvement training 51
Table 4.15 Confirmation of Autonomous Maintenance 51
Table 4.16 Confirmation of Preventative Maintenance training 52
Table 4.17 Confirmation of Other training 52
Table 4.18 Value Add Perception 52
Table 4.19 Respondents perceptions of job improvement 53
Table 4.20 Correlation between 5s training and value add perception 55
Table 4.21 Correlation between Kanban training and value add perception 55 Table 4.22 Correlation between Kaizen training and value add perception 56
Table 4.23 Correlation between FI training and value add perception 56
Table 4.24 Correlation between AM training and value add perception 57
Table 4.25 Correlation between PM training and value add perception 57
Table 4.26 Correlation between 5s training and job improvement perception 58
Table 4.27 Correlation between Kanban training and job improvement perception 59
Table 4.28 Correlation between Kaizen training and job improvement perception 59
Table 4.29 Correlation between FI training and job improvement perception 60
Table 4.30 Correlation between AM training and job improvement 60 Table 4.31 Correlation between PM training and job improvement 61

ix
List of Figures
Figure 2.1 An overview of the goals and building blocks of Lean system 13
Figure 2.2 Five-step Lean thinking 20
Figure 4.1 Respondents’ age pie chart 44
Figure 4.2 Respondents’ Race pie chart 45
Figure 4.3 Gender Split by employment category 47
Figure 4.4 Value Add Perception 53
Figure 4.5 Employees’ perceptions of job improvement 54
Figure 4.6 Important aspect frequencies 62

1
CHAPTER ONE
INTRODUCTION
1.1 Introduction
Lean manufacturing is defined as a production practice that uses fewer resources when
compared to traditional manufacturing. It requires the reduction of any activity that does
not add value to the customer. For example, Lean uses less human effort than traditional
manufacturing because one person could be trained to operate several machines which are
arranged in a U- shape cell layout (Lynch, 2005).
The term Lean production evolved from the Just-In-Time (JIT) production concepts which
were pioneered at Toyota in Japan and was widely adopted in the 1990s to emphasise the
goal of systematically eliminating waste throughout the supply chain (Jacobs, Chase and
Aquilano, 2009).
The term “Lean” with its reference to frugality, was actually coined by James Womack in
his book titled “The machine that changed the world” to characterise the Toyota
manufacturing system (Pieterse, Lourens, Louw, Murray, Van der Merwe, 2010).
This study, “Lean Manufacturing Implementation: A perspective on key success factors”,
was aimed at investigating the impact of training on Lean implementation and specifically
the impact on employees’ perceptions about the Lean program.
In order to answer the research question, a quantitative research methodology was adopted
whereby a research instrument (questionnaire) was designed and used to collect research
data, results of which were analysed using SPSS software. This chapter serves to introduce
the research topic and presents motivations for the study, clearly outlining how the
different stakeholders would benefit from the findings of the study as well as stating the
research problem.

2
1.2 Motivation for the study
The motivation for the study stemmed from the fact that there is empirical evidence that
Lean improves a company’s competitiveness (Sanchez and Perez, 2001).
Although many organisations have adopted Lean principles, the South African context
(“our environment and customs”) differs vastly from the idealised conditions encountered
in Japan, where Lean originated and to improve the chances of implementing Lean
successfully these differences must be taken into account (Pieterse, Lourens, Louw,
Murray, Van der Merwe, 2010).
There is therefore a need to conduct research on the subject of Lean to develop a better
understanding of the application of Lean principles within the context of the South African
environment.
The study was focussed on training from a perspective of its influence on employees’
perceptions rather than the content and delivery of the training materials being offered.
The results of the research were intended to benefit organisations wanting to implement
Lean principles providing insight on some of the key variables they could focus on.
Similarly, organisations that are experiencing difficulties in successfully implementing
Lean principles could refresh their approach as guided by the findings of this research.
Consultants on the subject of Lean could also benefit from the findings of the study as they
could enhance their services by incorporating the findings of this study into the delivery of
their services. Employees can use the findings of the study to engage with management
during the process of implementing Lean principles.
1.3 Focus of the study
The study was conducted in a packaging manufacturing company based in KwaZulu-Natal,
South Africa.

3
While there may be many variables that can impact the implementation of a Lean program
this study focussed specifically on training. The study was pitched to look at training from
a perspective of its influence on employees’ perceptions rather than looking at the content
and delivery of the training materials being offered.
There was therefore an underlying assumption that the content of the training being offered
to employees is relevant, being delivered effectively and would improve employees’
competencies.
There are a number of tools and principles that are associated with Lean manufacturing
such as Autonomous Maintenance, 5s etc. This study focused on the specific Lean tools
that had been implemented (or were being implemented) in the organisation at which the
study was conducted.
1.4 Problem statement
The implementation of Lean manufacturing principles remains a tool with which to
improve competitiveness as organisations take strategic measures to remain profitable
during periods of economic downturn. However as with many improvement programs
Lean principle implementations have not succeeded universally in their applications due to
a number of variables that may impact implementation of such initiatives (Worley, J. and
Doolen, T, 2006).
Typical benefits associated with successful Lean implementation include reduced
inventory levels, reduced lead-times, and improved knowledge management, less rework,
financial savings, increased process understanding and less process waste (Melton, 2005).
In another case study of Lean implementation, as an example, an Indian manufacturing
industry witnessed 92.58% reduction in lead time, 2.17% reduction in processing time,
97.1% reduction in work-in-progress and 26.08% reduction in manpower requirement
(Singh, Garg, Sharman and Grewal, 2010).

4
Whilst there is a rich body of research, conducted internationally, on the impact of
different variables such as training, worker empowerment, labour policy (Friel, 2003),
communication and management support (Worley and Doolen, 2006) little research has
been done to establish the impact of such variables on the implementation of Lean
principles in South African companies.
1.5 Research questions
The following research questions were formulated:
1. Does training influence employees’ perception of the impact of Lean tools on their own
jobs?
2. What impact does employee training have on employees’ perceptions of value added
by a Lean program in their own organisation?
3. What other factors are perceived by employees to be important for a successful Lean
implementation?
1.6 Objectives
The purpose of this study was to understand, from both a management and employees’
perspective, the relative importance of key success factors, specifically training, for
successful implementation of Lean principles and as well as the impact of training on
employees perceptions of the Lean program.
The aim and objective of the study was to research and investigate the impact that Lean
training has on employees’ perceptions of Lean tools in their own workplace and the
overall impression of the Lean program in their organisation. The following four research
objectives were established:
1. Determine what Lean training has been given to employees;
2. Determine employees’ perceptions of the impact of Lean tools on their own work;
3. Determine employees’ perceptions of the relative success of a Lean program in their
organisation;

5
4. Determine what other factors are considered important by employees for a successful
Lean implementation.
1.7 Limitations of the study
The following are some of the limitations identified in the study:
Sample size
Although the total staff compliment of the organisation the study was conducted at
amounted to 120 employees, only 58 responses were obtained of which 4 were spoiled,
thus limiting the sample size to a maximum of 54 employees.
Sample demographics
The purpose of the study was to investigate the impact of Lean training from both
employees’ and managers’ perspectives. However, the sample demographics with regards
to level of positions (employment level) were skewed towards non-management with, 89%
of respondents representing this category.
The study was conducted in one organisation located in one province and this should be
taken into account, so the findings may not be generalisable to other organisations.
1.8 Summary
This chapter introduced the research topic by providing a broad definition of the subject of
Lean manufacturing and its origins. The benefits of a successful Lean implementation such
as reduced inventory process waste, improved knowledge management, reduced lead
times, reduced rework etc. were highlighted.
The research problem was formulated by presenting the benefits associated with Lean,
highlighting the difficulties that surrounds Lean implementation and highlighting the
shortage of research in the field from the South African perspective. The research
questions and the objectives of the study were presented.

6
The next chapter covers the literature review on the subject of Lean. The definition of Lean
and anecdotal historical context of the subject of Lean with regards its origin, will be
presented in detail. In line with research questions and objectives of the study as presented
in this chapter, a detailed review of the Toyota Production System will be presented while
success factors and barriers for successful Lean implementation will also be highlighted.

7
CHAPTER TWO
LEAN THEORY
2.1 Introduction
The interest in Lean production is mostly based on the empirical evidence that it improves
the company’s competitiveness (Sanchez and Perez, 2001). However, as with many
improvement programs, Lean manufacturing implementations have not succeeded
universally in their application and there are different variables that may impact a Lean
implementation (Worley and Doolen, 2006). This view is supported by Achanga, Shehab,
Roy and Nelder (2006) who assert that compounded by lack of standardised mechanism
within organisations of analysis and measure of value-adding capabilities such as Lean, the
implementation of Lean manufacturing harbours enormous difficulties.
Looking at the subject from the South African perspective it is argued that the South
African context (“our environment and customs”) differs vastly from the idealised
conditions encountered in Japan, where Lean originated, and to improve the chances of
implementing Lean successfully these differences must be taken into account (Pieterse,
Lourens, Louw, Murray, Van der Merwe, 2010).
Although there is a broad spectrum of variables that could impact the Lean implementation
process, this research focuses on investigating the impact of one such key variable i.e.
training, on employees’ perceptions of Lean implementation (Worley and Doolen, 2006).
This chapter (chapter 2) focuses on the historical background of Lean principles and
definitions. A view of Lean principles and Lean tools is provided, followed by a discussion
of some of the problems organisations encounter in implementing Lean principles before
concluding the chapter with a summary.

8
2.2 The roots of Lean principles
The roots of Lean manufacturing originate with early automobile manufacturing. The
master craftsmen who first built individual cars possessed a wide range of skills and
abilities, but with low efficiency and at high cost. Henry Ford, in the early 1900s,
recognised these limitations, applied techniques which are consistent with some of the
current Lean philosophies, and broke the assembly process down into 30-second tasks,
which were performed almost a thousand times a day (Worley and Doolen, 2006).
The term Lean production evolved from the Just-In-Time (JIT) production concepts which
were pioneered at Toyota in Japan and was widely adopted in the 1990s to emphasise the
goal of systematically eliminating waste throughout the supply chain (Jacobs, Chase and
Aquilano, 2009).
The term “Lean” with its reference to frugality, was actually coined by James Womack in
his book titled “The machine that changed the world” to characterise the Toyota
manufacturing system (Pieterse et al., 2010).
2.3 Definitions of Lean
Lean production is an integrated set of activities designed to achieve production using
minimal inventories of raw materials, work-in-progress, and finished goods (Jacobs, Chase
and Aquilano, 2009).
Worley and Doolen (2006) however define Lean simply as the systematic removal of waste
by all members of the organisation from all areas of the value stream. Value stream being
defined as all of the activities that contribute to the transformation of a product from raw
material to finished product including design, order taking, and physical manufacture.
Waste is anything, other than the minimum amount of equipment, effort, materials, parts,
space and time that is essential to add value to the product (Jacobs, Chase and Aquilano,
2009). According to Singh, Garg, Sharman and Grewal (2010) waste takes many forms

9
and can be found at any time and in any place. It consumes resources but does not add
value to the product.
Schroeder (2008) defines waste more simply and plainly by saying that waste is anything
that does not contribute to adding value to the product.
However, according to Pieterse et al. (2010) defining Lean through waste would be similar
to naming someone after his appearance. The authors therefore argued that the purpose of
Lean is really to satisfy the customer through faster, cheaper, and better quality products or
services and therefore define waste from the eyes of the customer as activities that
customers would not want to pay for if they knew they were happening.
According to Schroeder (2008) the Japanese, owing to a lack of space and lack of natural
resources, developed an aversion to waste. Hence Lean is a management philosophy
focused on identifying and eliminating waste throughout a product’s entire value stream,
extending not only within the organisation, but also along its entire supply chain network.
Lean is achieved through a set of mutually reinforcing practices, including total quality
management, continuous improvement, supplier management, integrative information
systems, and effective human resource management (Boyle and Scherrer, 2009).
Davis and Heineke (2005) define Lean as an integrated set of activities designed to achieve
high-volume flexible production using minimal inventories of raw materials. It is based on
the premise that nothing will be produced until it is needed. A signal is generated when
material and components are needed at a work station and they arrive “just-in-time” to be
used.
Sawhney and Chason (2005) state that Lean production is not limited to manufacturing
alone but encompasses activities such as product development, procurement and
distribution and there are examples of successful Lean implementations in service industry
as well.
10
2.4 The Toyota Production System
According to Jacobs, Chase and Aquilano (2009) the Toyota Production System (TPS),
commonly regarded as the benchmark for Lean manufacturing, was developed to improve
quality and productivity and is based upon two philosophies central to the Japanese culture:
elimination of waste and respect for people.
According to Bhasin and Burcher (2006), Taiichi Ohno, the mastermind of the Toyota
Production System (TPS), identified seven types of manufacturing waste as:
2.4.1 Overproduction
This type of waste is generated by producing more than the customer demands
(Poppendieck, 2002).
Excess production creates excess inventory and wastes capacity on products that have no
demand. Producing too early creates similar waste as the inventory level is increased and
time is added to the cash-to-cash cycle. There is also a risk of damage that will detract
from the quality of the products (Finch, 2006).
The corresponding Lean principle is to manufacture according to a pull system, or
producing products just as customers order them. Anything produced beyond this (buffer
or safety stocks, work-in-process inventories, etc.) ties up valuable labour and material
resources that might otherwise be used to respond to customer demand (Melton, 2005).
2.4.2 Excess Inventory
Inventory waste consists of excess inventory, over and above that which is necessary. It
wreaks havoc with costs, lead times, quality and flexibility (Melton, 2005).
Related to overproduction, inventory beyond that needed to meet customer demands
negatively impacts cash flow and uses valuable floor space (Cachon and Terwiesch, 2009).
Under a JIT philosophy, all inventories become a target for elimination by tackling the
causes of inventory (Evans and Lindsay, 2008). It is for this reason that one of the most

11
important benefits for implementing Lean principles in manufacturing organizations is the
elimination or postponement of plans for the expansion of warehouse space (Poppendieck,
2002).
2.4.3 Extra Processing Steps (Processing waste)
Some of the more common examples of this are reworking (the product should have been
done correctly the first time), deburring (parts should have been produced without burrs,
with properly designed and maintained tooling), and inspecting (parts should have been
produced using statistical process control techniques to eliminate or minimise the amount
of inspection required (Melton, 2005).
A technique called Value Stream Mapping (VSM) is frequently used to help identify non-
value added steps in the process. The VSM technique originated at Toyota where it was
referred to as “Material and Information Flow Mapping”. VSM is an enterprise
improvement tool used to assist in visualizing the entire production process, representing
both material and information flow. The goal of conducting VSM is to identify all types of
waste in the value stream and to take steps to eliminate them (Singh et al., 2010).
According to Pieterse et al. (2010) a unique advantage of the VSM tool is that it is used in
conjunction with other Lean tools and it therefore provides a link between Lean principles
and Lean tools. By applying VSM users can clearly see how the Lean principles guide the
use of the Lean tools which prevents the tools from being used in isolation.
2.4.4 Excess motion
This type of waste (unnecessary motion) deals with human resources and how workers
perform their tasks. When jobs require repetitive activities, ineffective job design can result
in substantial wastes of labour resources over time (Cachon and Terwiesch, 2009).
Unnecessary motion is caused by poor workflow, poor layout, housekeeping, and
inconsistent or undocumented work methods
Symptoms of motion waste are when components and controls are outside easy reach,
double handling, widely spaced equipment and operators bending, long walking distances

12
and centralised facilities (Melton, 2005).
2.4.5 Defects
Product defect waste results from products that do not meet customer specifications for
quality (Finch, 2006).
Production defects and service errors waste resources in four ways. First, materials are
consumed. Second, the labour used to produce the part (or provide the service) the first
time cannot be recovered. Third, labour is required to rework the product (or redo the
service). Fourth, labour is required to address any forthcoming customer complaints
(Cachon and Terwiesch, 2009).
2.4.6 Waiting
According to Finch (2006) waiting time wastes results from customer order, inventory,
completed products and even customers waiting in queue for a process to begin. While a
product or order is waiting, no value is being added, but financial costs are mounting and
the wait time for the customer is increasing.
Lean demands that all resources are provided on a JIT basis – not too soon, not too late
(Evans and Lindsay, 2008).
2.4.7 Transportation
Material should be delivered to its point of use. Instead of raw materials being shipped
from the vendor to a receiving location, processed, moved into a warehouse, and then
transported to the assembly line, Lean demands that the material be shipped directly from
the vendor to the location in the assembly line where it will be used. The Lean term for this
technique is called point-of-use-storage (POUS) (Melton, 2005).
Other authors have started to add on the list an eighth waste as underutilisation of people
i.e. waste of not using the creative potential of every person in the factory (McBreen,
2008).
With the eighth waste as described above Pieterse et al. (2010) suggested the acronym
DOWNTIME to describe all the eight wastes as follows:

13
Supporting
Goals
Ultimate
Goal
Product design:
Standard parts
Modular design
Quality
Concurrent
engineering
Process design:
Small lot sizes
Setup time
reduction
Manufacturing
cells
Quality
improvement
Production
flexibility
A balanced
system
Little inventory
storage
Fail-safe modes
Personnel/Organizational elements
Workers as assets
Cross-trained workers
Continuous improvement
Cost accounting
Leadership/project management
Manufacturing Planning and
Control
Level loading
Pull system
Visual systems
Limited work-in-progress
(WIP)
Close vendor relationships
Reduced transaction
processing
Preventive maintenance
A balanced
rapid flow
Eliminate disruptions
Make the system flexible Eliminate waste
Defects
Overproduction
Waiting
Non Value Added Processing
Transportation
Inventory (Excess)
Motion (Excess)
Employee Knowledge, Skills and Abilities (Not used)
The TPS represents a philosophy that encompasses every aspect of the process, from
design to after the sale of a product. The philosophy is to pursue a system that functions
well with minimal levels of inventories, minimal space, and minimal transactions
(Stevenson, 2009).
The ultimate goal of a Lean operation is to achieve a system that matches supply to
customer demand in a smooth, uninterrupted flow as depicted in figure 2.1 below.
Figure 2.1 An overview of the goals and building blocks of Lean system
Adapted from: Stevenson, WJ. (2009, p696.) Operations Management, 10th Edition. New
York:Irwin\McGrawHill.
Building
Blocks

14
According to Stevenson (2009) there are four building blocks of the Lean system as
depicted in Figure 2.1.
1. Product design
Four elements of product design are important: Standard parts (workers have fewer
parts to deal with, and training times and costs are reduced), modular design
(clusters of parts are treated as one to simplify purchasing, handling and training),
capable production systems (quality built into the system, production is stopped
when there are quality problems until they are resolved) and concurrent engineering
(bringing design and manufacturing engineering people together in the design
phase to simultaneously develop the product and process).
2. Process design
Eight aspects of process design are particularly important for Lean production
systems and these are:
Small lot sizes
Small-lot production is the primary means of matching production rate to demand
rate. The ability to produce a small quantity of parts or products and then switch
equipment over to produce a small batch of another part or product enables
manufacturer to match the demand rate in relatively small time increments.
However, the difficulty in producing frequent small quantities is that this increases
the number of times the equipment must be changed over (Davis and Heineke,
2005).
In the Lean philosophy, the ideal lot size is one unit, a quantity that may not always
realistically be possible due to practical considerations requirement of minimum lot
sizes. However small lot sizes in both the production process and deliveries from
suppliers have some benefits that enable Lean systems to operate effectively e.g. in-
process inventory moving through the system is considerably less and greater
flexibility in scheduling can be achieved (Nahmias, 2009).
Setup Time Reduction
Setup time is the time required to change equipment from producing one product or

15
service to another (Finch, 2006:108).
Small lots sizes and product mixes may require frequent setups, which could be
expensive and costly due to machine down time and increased in-process inventory
holding. By making use of systems such as Single-Minute Exchange of Die
(SMED) set up activities are streamlined and grouped into internal and external
activities. Internal activities are those that can be done only when the machine is
not running whereas external activities involves those activities that do not require
the machine to stop as they can be done before or after the changeover (Nagarajan,
2009).
Manufacturing cells
According to Jacobs and Chase (2008) a manufacturing cell is a dedicated area
where products that are similar in processing requirements are produced. These
cells are designed to perform a specific set of processes and the cells are dedicated
to a limited range of products. The benefits of this include reduced changeover
times, high utilisation of equipment, and ease of cross-training operators.
Quality Improvement
This is a never ending quest to continuously improve the quality of the product by
focussing on finding and eliminating causes of defects in the process e.g. through
the use of autonomation (i.e. a combination of men and machine) whereby defects
during production are automatically detected (Evans and Lindsay, 2008).
Work Flexibility
According to Heizer and Render (2001) work cells should be designed so they can
easily be rearranged to adapt to changes in volume, product improvements, or even
new designs. This concept of layout flexibility aids the changes that result from
product and process improvements that are inevitable with a philosophy of
continuous improvement.
In line with the overall goal of a Lean system, the process should be designed to

16
create the ability to process a mix of products or services in a smooth flow by
removing or reducing the bottlenecks from the process i.e. reduce areas in the
process that are overloaded (Stevenson, 2009).
A Balanced System
This involves distributing the workload evenly among workstations and helps to
achieve a rapid flow of work through the system. Time required for work assigned
to each workstation must be less than or equal to the cycle time, normally referred
to as takt time. Takt time (derived from the German word Taktzeit which translates
to cycle time) is the cycle time needed in a production system to match the pace of
production to the demand (Webster, 2008).
Inventory storage
According to Cachon and Terwiesch (2009) Lean system is designed to minimise
inventory storage. Excessive inventory tends to cover up recurring problems that
are never resolved either because they aren’t obvious or because the presence of
excessive inventory makes them seem less serious. Advantages of lower inventories
include less carrying costs, less space needed, less tendency to rely on buffers, less
rework if defects occur.
Fail-safe Methods
This refers to building safeguards into the process to reduce or eliminate the
potential for errors during the process. The Japanese also call this poka-yoke (which
is the Japanese word for mistake proofing) (Stevenson, 2009).
According to Jacobs, Chase and Aquilano (2009) there are a wide variety of poka-
yokes, ranging from a bin (to ensure that the right numbers of parts are used in
assembly) to sophisticated detection and electronic signalling devices. A poka-yoke
is therefore a fool proof devise or a technique that ensures production of good units
every time by avoiding errors and providing quick feedback of problems (Heizer
and Render, 2001). An example of a poka-yoke system could be an alarm that goes
off when the product unit is underweight or has missing parts (Stevenson, 2009).

17
3. Personnel/Organisational elements
There are five elements of personnel and organisation that are particularly
important for Lean systems (Stevenson, 2009):
Workers as assets
Well-trained and motivated workers are the heart of the Lean system. They are
given more authority to make decisions than their counterparts in more traditional
systems, but they are also expected to do more (Nahmias, 2009).
According to Pieterse et al (2010) an environment must be created in which people
have an impact on decisions and actions that affect their jobs and this concept,
which they refer to as employee involvement, should be adopted as a philosophy
(rather than a tool) about enabling people to contribute to continuous improvement
and the sustained success of their employer.
Heizer and Render (2001) insisted that firms need to take full advantage of the
employee training investment by enriching jobs. The authors further argued that
enriching jobs and empowering employees would benefit companies from mutual
commitment and respect on the part of both employees and management.
Cross-trained workers
To increase flexibility, workers are cross-trained to perform several parts of the
process and operate a variety of machines. Cross-training employees greatly
increases employees’ contribution to the organisation and more importantly
workers who move around in the organisation performing different responsibilities
find their work more interesting (Finch, 2006).
Continuous Improvement
A central theme of the Lean approach is to work towards continual improvement of
the system – reducing inventories, reducing setup cost and time, improving quality,
increasing the output rate and generally cutting waste and inefficiency (Evans and
Lindsay, 2008).

18
4. Manufacturing planning control
Seven elements of manufacturing planning and control are important for Lean
systems:
Level loading
Level loading (referred to by the Japanese as Heijunka) means to achieve stable,
level daily mix schedules the master production schedule is developed to provide
level capacity loading. Once established production schedules are fixed over a
short time horizon (normally 3 months) thereby providing certainty to the system
(Davis and Heineke, 2005).
According to Jacobs, Chase and Aquilano (2009) the advantages for level loading
are:
1. “The system can be planned to minimise inventory and work-in-process
2. Product modifications can be up-to-date because of the low amount of work-in-
process
3. There is smooth flow throughout the system
4. Purchased items from vendors can be delivered when needed, and, in fact,
often directly to the production line.”
Pull System
The terms push and pull are used to describe two different system of moving work
through a production process. In a traditional production environment a push
system is used in a way that where when work is finished at a workstation, the
output is pushed to the next station or in case of final operation it is pushed on to
final inventory. However in a pull system control of moving the work following
with the next operation i.e. each workstation pulls work from the preceding
workstation as it is needed and output of the final operation is pulled by customer
demand or the master schedule (Nahmias, 2009).
Visual systems
To effect the pull system as described above, a process for the system to

19
communicate such demand could be in a variety of ways, including shout and a
wave, but the most commonly used device is the Kanban card. Kanban is a
Japanese term meaning “signal” or “visible record” (Finch, 2006).
When a worker needs materials or work from the preceding station he or she uses
the Kanban card. Hence the Kanban card could be regarded as the authorisation to
move or work on parts. The two types of Kanbans are:
1. Production Kanban (p-Kanban): signals the need to produce parts
2. Conveyance Kanban (c-Kanban): signals the need to deliver parts to the
next work station (Nahmias, 2009).
Limited Work-in-Process (WIP)
Movement of materials and work-in-process (WIP) in a Lean system is carefully
coordinated, so they arrive at each step in a process just as they are needed. There
are two general approaches to controlling WIP; one is Kanban and the other is
constant work-in-process (CONWIP). Whilst Kanab’s control focuses on individual
work stations CONWIP’s focus is on the system as a whole. With CONWIP, when
a job exits the system, a new job is allowed to enter which results in a constant
level of WIP (Davis and Heineke, 2005).
Close Vendor Relationship
According to Jacobs and Chase (2008) just as customers and employees are key
complements of Lean systems, suppliers are also important to the process. If the
firm shows its usage requirements with its vendors, they have a long-run picture of
demands that will be placed on their production and distribution systems.
Maintaining stock at a Lean level requires frequent deliveries during the day. Some
suppliers even deliver to a location on the production line.
Traditionally buyers have assumed the roles of monitoring the quality of purchased
goods inspecting shipments for quality and quantity and returning poor-quality
goods to vendor for reworking. With Lean systems the responsibility for quality
checks is vested on the suppliers who are expected to deliver high quality goods

20
just in time (Stevenson, 2009)
2.5 Lean Principles (Lean Thinking)
According to Pieterse et al (2010) since Taiichi Ohno, the production genius at Toyota, did
not exactly provide details of instructions on how to adopt his way of thinking and the
tools that are used Womack and Jones attempted to bridge this gap when they published in
1996 their book titled “Lean Thinking” which was a follow up to their initial book titled
“The machine that changed the world”.
The five-step thought process for guiding the implementation of Lean techniques is
depicted on the diagram as follows:
Figure 2.2 Five-step Lean thinking
Adapted from: Lean Enterprise Institute (2010).
1. Identify value
Lean thinking must start with a conscious attempt to precisely define value in terms of
specific products with specific capabilities offered at a specific process through a dialogue
with specific customers (Melton, 2005).
2. Map the value stream
According to Mcbreen (2003) value stream is all the actions needed to bring the product to
the customer. Value Stream Mapping is an enterprise improvement tool to assist in
visualizing the entire production process, representing both material and information flow.
The goal of conducting VSM is to identify all types of waste in the value stream and to

21
take steps to eliminate them. If the processes and equipment in assembly line do not talk
(i.e. not harmonised) duplicate steps will exist (Singh et al., 2010).
3. Create flow
This step entails making the value-creating steps occur in tight sequence so the product
will flow smoothly toward the customer. This can be achieved, as example, by learning to
change set-ups from one product to the next fast and the use of smaller, moveable
machines which can increase productivity (Nagarajan, 2009).
4. Establish pull
This entails designing, scheduling and making exactly what the customer wants just when
the customer wants which means you can throw away sales forecast and simply make what
the customers actually tell you they need. Put simply, let the customer pull the product
from you. The principle is you sell one and then make one (Cachon and Terwiesch, 2009).
5. Seek perfection
As value is specified, value streams are identified, wasted steps are removed, and flow and
pull are introduced, begin the process again and continue it until a state of perfection is
reached in which perfect value is created with no waste (Principles of Lean, 2009).
2.6 Benefits of Lean
Elimination of zero-value activities
According to Sanchez and Perez (2001) one of the primary goals of Lean production is the
elimination of everything that does not add value to the product or service. Storage of
inventory, as an example, does not add value to the product and should be eliminated
whenever possible. Inventory levels could be reduced by reducing the time the machines
spend standing due to breakdowns and malfunction through preventative and predictive
maintenance. Other techniques for reducing inventory could be simultaneous reduction in
manufacturing lot sizes and set-up times and the use of common parts to manufacture
different products.

22
Another source of zero-value activities is the transport of parts within the company. This
activity does not add value to the product but increases lead times. In Lean production the
machine are laid out in flexible work cells to eliminate the frequency of movements among
machines (Webster, 2008).
According Keyes, Nahn and Lauver (2009) the reduction of non-value adding activities
improves operational efficiency which in turn can provide increased opportunity for
profitability and enhanced position among the competition. The authors conducted a case
study aimed at measuring the effect of Lean implementation at a low-volume high variety
manufacturer. Performance measures in different categories such as financial (gross profit),
operational and materials management were identified and measured three months before
and three months after the implementation of Lean. As expected the organisation’s
financial measures i.e. gross profit improved after implementation of Lean. The financial
improvement was recognised due to the reduction in cost of goods sold. The cost of goods
sold had reduced due to reduction of manufacturing costs. Prior to Lean implementation
the cost of goods as a percentage of sales averaged 86% and following the implementation
of Lean the cost of goods sold as a percentage of sales reduced to 76%.
A study of Italian manufacturing companies showed that Lean production companies used
more teams in problem solving, that workers performed a higher variety of tasks, and that
the proportion of implemented employees’ suggestions was higher than in non-Lean
production companies (Sanchez and Perez, 2001).
In another case study of Lean implementation using VSM an Indian manufacturing
industry witnessed 92.58% reduction in lead time, 2.17% reduction in processing time,
97.1% reduction in work-in-progress and 26.08 % reduction in manpower requirement
(Singh et al., 2010)
According to Singh et al (2010) the goal of Lean manufacturing is to reduce waste in
human effort, inventory, time to market and manufacturing space to become highly
responsive to customer demand while producing quality products in the most efficient and
23
economical manner.
It is for the same reasons as above that Lean manufacturing is often associated with
benefits such as reduced inventory, reduced manufacture times, increased quality,
increased flexibility, and increased customer satisfaction (Worley and Doolen, 2006).
Lean implementation results in improved output and quality levels, and achieves this using
fewer resources, such as raw materials and employee effort. With international dominance
across a multitude of industries, this philosophy of production originally developed for the
Japanese auto industry, has proven its value far beyond its original industrial sector and
geographic region. Recently, Lean is applied to a wide variety of industries of varying
sizes, ranging from global aerospace companies to small community hospitals (Boyle and
Scherrer, 2009).
2.7 Lean Tools
Some of the practices of Lean manufacturing include Five S events, Kaizen events,
Kanbans, pull production, quick changeovers, and value stream mapping. Table I provides
a summary of the definitions of some common Lean practices (Worley and Doolen, 2006).

24
Table 2.1: Examples and definitions of common Lean practices
Source :(Worley and Doolen, 2006,236).
Lean practice Definition
Five S events Defined as the five dimensions of workplace organisation. The events are
designed to organise and clean. Five S events are often incorporated with
Kaizen events. The Five S’s are defined as sort (identify unnecessary
equipment), straighten (arrange and label the area so all tolls have a specific
home), shine (clean the area and maintain equipment daily), standardise
(establish guidelines and standards for the area), and sustain (maintain the
established standards)
Kaizen events Defined as continuous improvement in small steps. Organisations typically use
kaizen events to focus on improving a specific process
Kanban Defined as a system that uses a card to signal a need to produce or transport a
container of raw materials or partially finished products to the next stage in the
manufacturing process. This applies both to delivery to the factory and
delivery to each workstation. The result is the delivery of a steady stream of
containers of parts throughout the day. Each container holds a small supply of
parts or materials. New containers are delivered to replace the empty ones
Pull production Characterised by the manufacture of product only when a customer places an
order
Quick changeovers Characterised as a method for minimising the amount of time it takes to
change a machine’s setting or to prepare an area to begin processing a new
product
Value stream mapping Defined as investigating the flow of material through the manufacturing
process from the customer’s point of view. The end result highlights areas of
waste.
Heijunka Variations in production volume lead to waste. The workload must be levelled;
volume and variety must be averaged to achieve a steady flow of work.
Jidoka Quality at the source. Each worker is expected to perform on-going quality
assurance. The objective is to avoid passing defective products to the
following workstation, and to make workers aware of quality (Stevenson
2009).
Team concept Use small teams of workers for process improvement (Stevenson, 2009)
Poka-yoke Safeguards built into the process to reduce the possibility of committing an
error (Stevenson, 2009).

25
2.8 Critical success factors
2.8.1 Multiskilling (Training)
Lean systems use much less of certain resources than typical mass production systems use
– space, inventory and workers – to produce a comparable amount of output. Lean systems
therefore require the use of a highly skilled workforce and flexible equipment (Lynch,
2005).
This view is shared by Schroeder (2008) who asserted that one of the critical things needed
to make a Lean system work is multifunction workers. In most cases, each worker must be
able to operate several machines in a group, going from one to the next to make the parts
required. Since parts are not produced unless they are needed, the worker must be able to
switch off the machine and move on to another job where parts are needed. The worker
must be able to set up machines, do routine maintenance, and inspect the parts. This
obviously requires workers who are cross-trained in several different skills.
In a study conducted to establish critical success factors for Lean implementation within
ten Small Medium Enterprises (SME’s) based in the East of the UK it was found that there
were four key main factors that were fundamental hence critical for the implementation of
Lean manufacturing and in proportion these were: leadership (50), finance (30), skill and
expertise (10) and organisational culture (10) (Achanga, Shehab, Roy and Nelder, 2006).
2.8.2 Worker empowerment
Another key to successful Lean production is worker empowerment, defined as giving
workers more responsibility and control of the manufacturing process, as well as increased
levels of training to build the skills needed to effectively exercise increased responsibility.
Since workers are such a key component of Lean production, care must be taken to ensure
their input is maximized (Webster, 2008).
A very large part of the Lean culture as described in the TPS is considered to reside in
respect for the people of the organisation. It is a known fact that the hardest part of the
implementation of Lean is in the changing of the attitudes and habits of people in the

26
organisation. Top management needs to understand that their commitment and
involvement will be required over an extended period while the organisation coverts its
procedures, habits and methods. Middle management will have to understand how to
implement and support the practices, and understand that they may have to relinquish some
authority as workers get empowered (Pieterse at al., 2010).
2.8.3 People requirements
According to Sawhney and Chason (2005) a successful Lean organisation, be at a
manufacturing or a service industry, depends on its people – both management and the
workforce. Transition from a traditional top Lean environment is as much, if not more,
about culture change in the organisation than about manufacturing issues. During the
transition to Lean few of the major hurdles come from changes being made in the technical
work system. Most problems are associated with the workforce, for example, resistance to
change, lack of necessary job skills, low morale and decisions to recruit new employees or
to retain current work force.
In addition to eliminating waste, Lean has a second major tenet in its philosophy – utilising
the full capability of the workers and suppliers. As an example workers and suppliers are
also charged with improving the production process through quality teams, suggestion
systems, and other forms of participation by workers and suppliers. The capabilities of
workers and suppliers are therefore used at a much greater extent in the Lean system than
in traditional production approaches (Schroeder, 2008)
However, the increase in the number of tasks accomplished by each worker requires the
company to take a greater effort on quality control, maintenance and so on. Moreover the
implementation of multifunctional teams requires potential workers to overcome resistance
to increase the number of tasks they perform. Whilst the training makes this adjustment
easier but there must be some changes as well in the compensation system in order to
remunerate explicitly this new flexibility (Sanchez and Perez, 2001).
Another key consideration is the workers union dynamics. Special efforts are needed to use
Lean in a unionised environment. Labour unions are often organised along skill or craft

27
lines, and they do not tend to encourage flexibility in the workforce. As a result
management will need to work closely with the union to develop the kind of workforce
needed for Lean systems (Schroeder, 2008).
Lean is a knowledge-intensive process and as such relies heavily on the skills of people
and how they respond to change. Also in the context of Lean philosophy of minimising
waste it is important not only to eliminate material waste but waste caused by human
behaviour (Sawhney and Chason, 2005).
2.9 Implementation barriers
The implementation of Lean manufacturing is believed to harbour enormous difficulties
(Achanga, Shehab, Roy and Nelder, 2006).
According to Worley and Doolen (2006) Lean implementations have not succeeded
universally in their applications with many different variables in existence that may impact
a Lean implementation. The authors further argued that literature contains examples of
both Lean manufacturing implementation successes and failures (Worley and Doolen,
2006).
The difficulties associated with implementing Lean was highlighted by Bhasin (2008) who
claimed that less than 10% of UK organisations accomplish successful Lean implantations.
The importance of the human element in Lean implementation was emphasized by
Sawhney and Chason (2005) who argued that Lean is a knowledge-intensive process and
as such relies heavily on the skills of the people and how they respond to changes. The
authors further argued during the transition to Lean most of the major hurdle encountered
do not come from changes made in the technical work system but from the human element
associated with work force, for example, lack of necessary job skills, low morale,
resistance to change etc.
Some of the reasons cited as reasons for failure in transition to Lean are (Sawhney and
Chason, 2005):
28
Long-time employees resisting change
Management focussed on point solutions instead of systems
Lack of true worker participation and involvement
Production schedules that override improvement efforts
Failure of those who understand more to help others to learn
Lack of integration among change efforts and operations
Failure to continue with improvement efforts over the long term
Lack of top management support
Lack of shared operating data
Lack of worker and management trust
Alienation of line leaders
Confusing Lean objectives
Expecting employee training to make Lean manufacturing happen
Implementing Lean as a program
Relying too much on Kaizen workshops
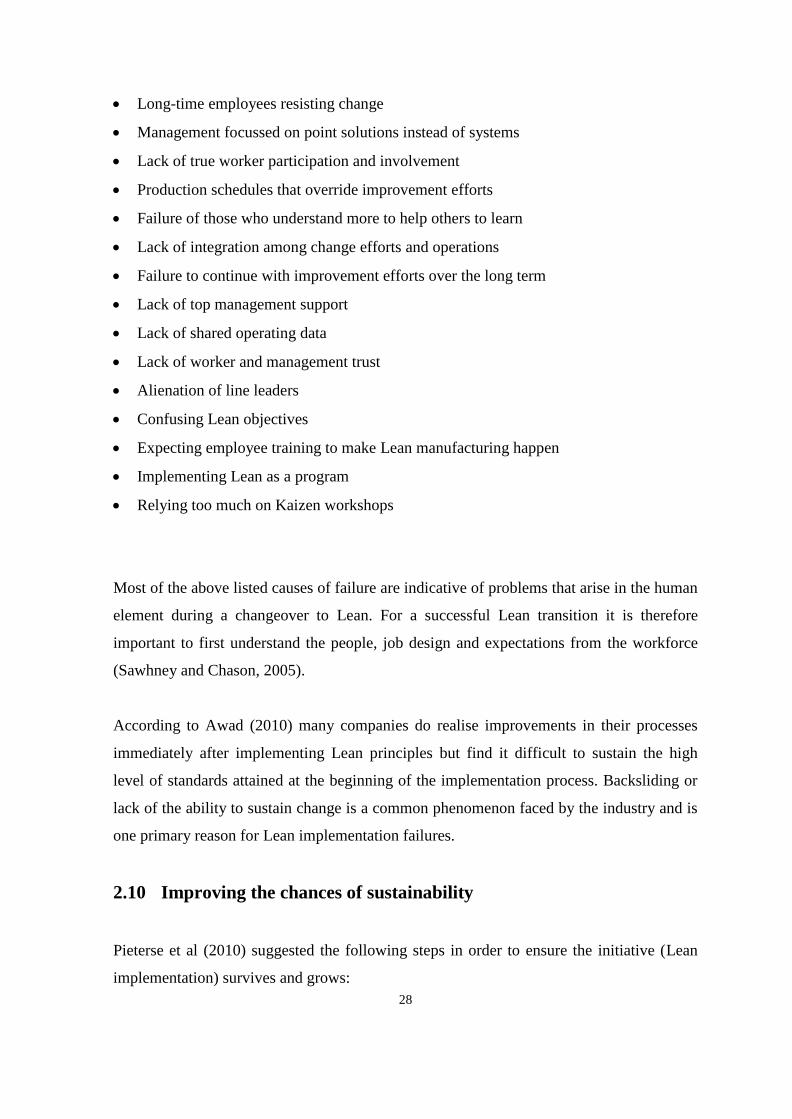
Most of the above listed causes of failure are indicative of problems that arise in the human
element during a changeover to Lean. For a successful Lean transition it is therefore
important to first understand the people, job design and expectations from the workforce
(Sawhney and Chason, 2005).
According to Awad (2010) many companies do realise improvements in their processes
immediately after implementing Lean principles but find it difficult to sustain the high
level of standards attained at the beginning of the implementation process. Backsliding or
lack of the ability to sustain change is a common phenomenon faced by the industry and is
one primary reason for Lean implementation failures.
2.10 Improving the chances of sustainability
Pieterse et al (2010) suggested the following steps in order to ensure the initiative (Lean
implementation) survives and grows:

29
Management must continue showing and demonstrating their commitment and
enthusiasm
Staff must be trained and retrained. The improvement tools must become second nature
and they must be fully aware of the uses and benefits of the Lean tools
Allay the fears that staff has. Make sure you understand the underlying reasons for
resistance and these questions are answered.
There must be monitoring systems in place and they must be maintained to measure
aspects such as housekeeping and improvements in quality, delivery and cost.
The reward system must be maintained rigorously. If staff notices a slacking in the
appreciation of their effort, they become sceptical and the contributions will end.
Comparisons with other factories are to be encouraged. It is easy to become
complacent until one sees what has been achieved elsewhere.
Keep staff informed about the benefits of the Lean implementation. They must see that
their efforts have a meaningful effect.
Avoid the impression that the implementation is solely the task of management or
workers
Keep the initiative going through thick and thin. Starting and stopping as the need
arises creates the impression that the implementation is imposed and ‘something extra’,
instead of being part of the culture of the organisation.
2.11 Summary
The principles of Lean philosophy developed in Japan (Toyota) have all been established
with one single aim of eliminating or reducing waste throughout the value chain. The Lean
principles can be applied in both manufacturing and service organisations.
The seven types of waste are: Overproduction, Waiting, Inventory, Defects, Motion,
Transportation and Processing.
There are a number of Lean tools that can be utilised to progress the aim and objectives of
Lean principles such as 5s, preventative maintenance, pull system, failure mode analysis,
value stream mapping etc.

30
The benefits of implementing Lean principles include reduced inventory, reduced
manufacture times, increased quality, increased flexibility, increased customer satisfaction,
improved output and quality levels and more importantly this is achieved using fewer
resources, such as raw materials and employee effort. Indeed there is empirical evidence
that Lean production improves the company’s competitiveness.
However for Lean implementation to be successful and for the above benefits to be
realised the process relies heavily on multi-skilling of employees. The impact of human
element on the success of Lean implementation programs is well covered in the literature.
Employees operating under Lean production systems are expected to do more tasks;
operate more equipment and carry on more responsibilities generally. Hence the success of
Lean implementation hinges heavily on employee training (multi-skilling).
The objective of this dissertation is to understand the impact of training on employees’
perceptions of the Lean principles in their own work and their perception of value added by
Lean implementation in their own organisation.
The following chapter (Chapter 3) will provide the context of the Research Methodology
adopted in order to answer the research questions that have been developed.

31
CHAPTER THREE
Research Methodology
3.1 Introduction
Jankowicz (2006) defined a research method as a systematic and orderly approach taken
towards the collection and analysis of data so that information can be obtained from those
data. However, according to Kothari (2006) research methods can be understood as all
those methods/techniques that are used for conduction of research e.g. research
questionnaire, analytical tools etc. On the other hand, research methodology could be
understood as a way to systematically solve the research problem and not only talks of
research methods but covers a wider scope and also considers the logic behind the methods
we use in the context of our research study and explains why we are using a particular
method or technique and why we are not using others so that the research is capable of
being evaluated either by the researcher himself or by others.
The literature review, covered in the preceding chapter, provided a critical review of major
references on the subject of Lean. More importantly the theory on the vulnerability of Lean
implementation to a spectrum of factors was covered and specifically the reliance of Lean
on employees’ up-skilling for Lean implementation to be successful.
This chapter provides details of the research methodology that was adopted in order to
answer the developed research questions. In addition this chapter will provide key
motivations for the research, data types, data collection methods, research instrument, type
of questions used, survey population and sample size determination and data handling.
Ethical considerations are also discussed before ending the chapter with a summary.
3.2 Aim and Objectives of the Study
The implementation of the Lean manufacturing principle remains a tool to improve
competitiveness as organisations take strategic measures to remain profitable during
periods of economic downturn. However, like many improvement programs, Lean

32
principles implementations have not succeeded universally in their applications due to a
number of variables that may impact implementation of such initiatives (Worley and
Doolen, 2006).
The need of the study was underpinned by the value associated with Lean principles if
implemented properly as supported by literature. On the contrary, literature also suggests
that lack of commitment by employees and management on the Lean principles can lead to
value destruction. Therefore an understanding of how Lean principles impact both
employees and management provides an opportunity for organisations to amend their
approach or emphasise relevant aspects of the Lean implementation process if necessary.
The aim of this study is to understand the impact that training has on employees’
perceptions of Lean program in their workplace.
The purpose of the study is to answer the research question:
Does training have an impact on employees’ perceptions of impact of a Lean program in
their organisation?
The following research questions have been developed:
1. Does training influence employees’ perception of the impact on Lean tools on their
own jobs?
2. What impact does employee training have on employees’ perceptions of value added
by a Lean program in their own organisation?
3. What other factors are perceived by employees to be important for a successful Lean
implementation?
The objective of the study is to research the impact that Lean training has on employees’
perceptions of Lean tools in their own workplace and the overall impression of the Lean
program in their organisation. This can be broken down to the following four objectives:
1. Determine what Lean training has been given to employees;

33
2. Determine employees’ perceptions of impact of Lean tools on their own work;
3. Determine employees’ perceptions of relative success of Lean program in their
organisation;
4. Determine what other factors are considered important by employees for a successful
Lean implementation
3.3 Participants and Location of Study
The study was conducted at a packaging manufacturing company, which is a division of an
international organisation, located in KwaZulu-Natal, South Africa.
The participants of the research study were selected from personnel, across the board, in
the employ of the organisation the study was conducted at. This included operators,
supervisors (first line managers), junior and senior managers.
The location and review of study was the packaging manufacturing company located in
KwaZulu-Natal, South Africa.
3.4 Data Types
Research data for the purpose of this research are from primary and secondary sources.
3.4.1 Primary Data
Primary data are data one has collected for oneself specifically for one’s projects whereas
secondary data are data other people have collected for their own research projects or
commercial purpose with the main difference between the two being that one (primary
data) is ‘new’ data whilst the other one (secondary) is ‘reused’ data (Maylor and
Blackmon, 2005).
3.4.2 Secondary Data
Secondary sources are interpretations of primary data. Encyclopaedias, textbooks,

34
handbooks, magazine and newspaper articles, and most news casts are considered
secondary information sources (Cooper and Schindler, 2003).
All reference materials used in the literature review would fall under the category of
secondary sources as described above.
Maylor and Blackmon (2005) argued the point that as a researcher, your distance from the
source of the data will affect the quality of the data and ultimately the quality of your
findings or recommendations.
In this research primary data was collected by means of a questionnaire which was used by
the respondents to provide information.
3.4.3 Quantitative data
Quantitative data is obtained from gathering numerical data using structured questionnaires
or observation guides to collect primary data from individuals. The data range from beliefs,
opinions, attitudes, behaviour and lifestyles to general background information on
individuals such as gender, age, education and income. Business researchers often refer to
quantitative data collection as survey research (Hair Jnr, Money, Samouel and Page, 2007).
3.4.4 Qualitative data
Qualitative data represents descriptions of things that are made without assigning numbers
directly and the data is generally collected using some type of unstructured interviews or
observation (Hair Jnr et al., 2007).
Cooper and Schindler (2003, p271) provided a verbal picture of the two different
techniques (quantitative versus qualitative) as follows:
“Quality is the essential character or nature of something; quantity is the amount. Quality
Qualitative is the what; quantity the how much. Quality refers to the meaning, the
definition or analogy or metaphor characterising something, while quantitative assumes the
meaning and refers to a measure of it……the difference lies in the description of the

35
Mexican Sierra, a fish from the sea of Cortez. One can count the spines on the dorsal fin of
a pickled Sierra, 17 plus 15 plus 9. But if the Sierra strikes hard on the line so that our
hands are burned, if the fish sounds and nearly escapes and finally comes in over the rail,
his colours pulsing and his tail beating the air, a whole new relational externality has come
into being. Qualitative research would define the being of fishing, the ambiance of a city,
the mood of citizen, or the unifying tradition of a group…..”
The data obtained for the purpose of this research using a questionnaire was quantitative in
nature whilst literature review as covered in the previous chapter would be qualitative in
nature.
3.5 Methods and instrument of data collection
There are many research designs that could be used to study business problems.
Researchers generally choose from among (1) exploratory; (2) descriptive or (3) causal
design (Hair Jnr et al., 2007).
An exploratory project is useful when the research questions are vague or when there is
little theory available to guide the development of hypothesis. It is designed to discover
new relationships, patterns, themes, ideas and so on. Thus it is not intended to test specific
research hypotheses (Hair Jnr et al., 2007).
Descriptive research is designed to obtain data that describes the characteristics of the topic
of interest in the research. As an example, question like: Who is likely to be most satisfied?
When should we maximise production? How much investment is required? Studies
tracking seasonal changes are good examples of descriptive studies (Hair Jnr et al., 2007).
Causal research tests whether or not an event causes another. Does X cause Y? More
precisely, a causal relationship means a change in one event brings about a corresponding
change in another event. Causality means a change in X (the cause) makes a change in Y
(the effect) occur (Hair Jnr et al., 2007).

36
3.5.1 Construction of the Instrument (Questionnaire)
(Refer to appendix for a copy of the research questionnaire)
Hair Jnr et al (2007) defined a questionnaire as a prepared set of questions (or measures)
used by respondents or interviewers to record answers (data). Questionnaires are a
structured framework consisting of a set of questions and scales designed to generate
primary data.
According to Lee and Lings (2008) without a good instrument, research data will never be
of high quality and of course this will mean that the research will also be less than
adequate. The authors further insisted that the length of the questionnaire is probably the
single most important factor in influencing how many people are going to respond to your
questionnaire.
With the above in mind the research instrument (questionnaire) was designed in two main
parts. The first part of the research questionnaire is a covering letter to the respondent
which provides information about the research topic, the university and business school,
names of the researcher and supervisor followed by a short paragraph which provides the
title of the research and also informs the respondent about the voluntary nature of his/her
participation and the fact that there is no monetary reward for participating in the research.
The first part of the questionnaire was designed to address the principle of informed
consent. According to Gray (2009) participants should be provided with sufficient
information about the project so that they can make an informed decision as to whether to
become involved or not.
The second part of the instrument is the questionnaire itself which on part one seeks
permission from the respondents for the responses to be used for academic research
purposes.
Part two of the questionnaire is made up of questions which are designed specifically to
answer the research questions. The first four questions were designed to provide the
demographic profile of the respondents in terms of their age, gender, race and level of

37
position in the organization. The last five questions of the questionnaire were designed to
answer the research questions.
3.5.2 Developing the questionnaire
The research instrument used was the questionnaire which was specifically developed to
provide answers to the research questions.
A total of nine questions were formulated with the first four questions seeking to establish
the demographic profile of the participants with respect to their gender, race, age and their
position within the company’s organogram structure.
3.5.3 Scale construction (Rating scales)
In order to quantify dimensions that are essentially qualitative ratings, ranking scales are
used in the construction of the questionnaire so as to improve the usefulness of responses
(Cooper and Schindler, 2003).
Examples of rating scales are:
Simple category scale offers mutually exclusive response choices such as agree or
disagree, yes or no or any other set of discrete category (Cooper and Schindler, 2003).
This type of scaling was preferred for gender determination of research participants on
question 3.
Multiple choices, single response scale is useful when there are multiple options for the
respondent but only one answer is sought (Cooper and Schindler, 2003).
This scaling was applied on demographic questions (question 1, 2 and 4).
Multiple choice, multiple-response scale allows the rater to select one or several
alternatives (Cooper and Schindler, 2003).
This scaling was preferred for questions 5 and 6 of the questionnaire. Respondents were
also guided by the text ‘cross as many as applicable’.

38
According to Bryman and Bell (2007) the Likert scale is the most frequently used variation
of the summated rating scale. Summated scales consist of statements that express either a
favourable or unfavourable attitude toward the object of interest. The respondent is asked
to agree or disagree with each statement. Each response is given a numerical score to
reflect its degree of attitudinal favourableness and the scores may be totalled to measure
the respondent’s attitude.
Likert scale helps us to compare one person’s score with a distribution of scores from a
well-defined sample group (Cooper and Schindler, 2003). The Likert five point scale was
used for questions 7 to 9.
3.6 Recruitment of Study Participants (Sample)
The population for this research study was the total staff compliment of the organisation
the study was conducted in.
The questionnaire (in hard copies) was distributed throughout the organisation by the
Continuous Improvement manager through the First Line Management team ensuring that
employees who were on night shift duty at the time were also involved in the data
gathering.
3.7 Validity
According to Bryman and Bell (2007) validity is concerned with the integrity of the
conclusions that are generated from a piece of research. Types of validity that are typically
distinguished are:
Measurement (Construct) validity
When we measure something, for example, a variable, with an instrument, the instrument
we use to measure the variable must measure that which it is supposed to measure.

39
In other words construct validity has to do with the question of whether or not a measure
that is devised of a concept really does reflect the concept that it is supposed to be
denoting.
Internal validity
Internal validity is concerned with the question of whether a conclusion that incorporates a
causal relationship between two or more variables holds water. If we suggest x causes y,
can we be sure that it is x that is responsible for variations in y and not something else that
is producing an apparent causal relationship?
External validity
This issue is concerned with the question of whether the results in a study can be
generalised beyond the specific research context.
In this case a questionnaire was sent to the Continuous Improvement manager of the
organisation in which the research was conducted for validation. The final questionnaire
was sent to the ethics board at the university and full approval was received.
To test the authenticity of the respondents in answering the questionnaire, and thereby
further validating the questionnaire, one of the Lean tools included in the list to choose
from was a specific Lean tool which was known to have not been implemented.
3.8 Statistical Significance
One difficulty when working with data derived from a sample is that there is often the
lingering worry that the findings may not be generalizable to the population from which
the sample was drawn due to sampling error and if that happens the sample will be
unrepresentative of the wider population and therefore any findings will be invalid. To
make matters worse there is no feasible way of finding out whether or not the findings in
fact apply to the population. This is where statistical significance and the various tests of
statistical significance come in (Bryman and Bell, 2007). According to Lind, Marchal and
Wathen (2008), to test the degree of confidence we can have in our findings when

40
exploring relationships between variables the following steps can be followed:
Set up null hypothesis
Hypothesis is a statement about a population parameter subject to verification. A null
hypothesis, designated H0, stipulates that the two variables being analysed are not related in
the population e.g. there is no relationship between gender and visiting gym in the
population from which the sample was drawn (Bryman and Bell, 2007). The alternate
hypothesis, H1, is that there is a relationship between the variables in the population as
observed in the sample (Lind, Marchal and Wathen, 2008).
Establish level of statistical significance
The level of significance is the probability of rejecting the null hypothesis when it is true.
Put differently, it is the risk one takes of rejecting the null hypothesis (implying that there
is a relationship in the population) when it should be supported (Lind, Marchal and
Wathen, 2008).
According to Hair Jnr et al (2007), the convention amongst business researchers is that the
maximum level of statistical significance that is acceptable is p<0.05, which implies that
there are fewer than 5 chances in 100 that a sample shows a relationship when there is not
one in the population.
Determine the statistical significance
The Chi-square (X2) test which is used as the test statistic is applied to the contingency
tables so as to establish the confidence level in asserting that there is relationship between
the two variables in the population. It works by calculating for each cell in the table an
expected frequency or value - that is, one that would occur on the basis of chance alone.
The Chi-square value is then calculated by calculating the difference between the actual
and expected values for each cell in the table and then summing those differences (Bryman
and Bell, 2007).
Formulate decision rule
A decision rule is a statement of the specific conditions under which the null hypothesis is
rejected and the conditions under which it is not rejected. If the findings are statistically

41
significant at the 0.05 significance the null hypothesis is rejected, which would imply that
the results are unlikely to have occurred by chance or sampling error (Bryman and Bell,
2007).
3.9 Administration of the Questionnaire
Permission was requested and granted by the gatekeeper to conduct research in the
organisation (Please refer to appendix for Ethical clearance approval letter).
Hard copies of the questionnaire were distributed through the First Line Management team
across all the shifts and once completed they were collated and submitted to the
Continuous Improvement manager.
Using Microsoft Excel a table format was designed to collate answers of all returned
copies of the questionnaires. The data was then transported into SPSS for analysis.
3.10 Summary
The research methodology introduced the concept of business research. It illustrated that
the aim and objectives of the research was determined by collecting and analysing data.
The data is needed to solve the research problem. Different types of data were explained.
Primary data for the purpose of this study was obtained using the questionnaire whilst
literature review from chapter 2 provides secondary data. The questionnaire was designed
to collect data which is quantitative in nature.
The questionnaire was adopted as an instrument suitable for collecting required data.
Hence data collection strategies focused on a questionnaire.
The participation and location of study identified the personnel in the employ of the
packaging manufacturing company located in KwaZulu-Natal, South Africa, as
participants in the research study.

42
Research design and methods described the purpose of the study. Construction of the
questionnaire, interview questions and recruitment of study participants required careful
planning. Ethical considerations were adequately covered.
Presentation, validation and administration of the questionnaire provided the processes for
quality data collection. The analysis of data by means of simple (but useful) descriptive,
and frequency statistics was adopted for the research study.
The following chapter (Chapter 4) presents all the findings from the survey that was
conducted. The findings are displayed in graphical and statistical format.

43
CHAPTER FOUR
RESULTS
4.1 Introduction
The previous chapter (Chapter three) outlined the research methodology adopted in order
to answer the developed research questions and key concepts such as data types and
research instruments that were identified and presented. A detailed explanation on the
construction of the questionnaire was provided.
This chapter presents the results (data) that were obtained through the questionnaire and
any other discussions (phenomenological discussions) that were held with management
and or respondents. The data was analysed using descriptive statistical methods in order to
summarise the data (using descriptive stats) and also establish relationships amongst
variables. Frequency tables, charts and cross tables form part of the descriptive data
analysis that was used.
4.2. Demographic Description of samples
The demographic statistics of the respondents are shown below.
The population size of the study was 120 people which represent all employees who were
employed by the organisation in which the study was conducted at the time the research
was being done.
A total of 90 questionnaires were distributed and 58 of them were returned. This represents
64 % response rate.
Only four out of the returned 58 were spoilt, meaning 6.9% of the returned questionnaires
could not be used.
The demographic analysis will be useful in establishing correlation relationships between
variables and developing an understanding of how the demographic variables such as age

44
correlate with other variables in the research study.
4.2.1 Age of respondents
The demographic spread of respondents in terms of age is shown in Table 4.1 and figure
4.1 below.
Age Group Frequency Percent Valid Percent Cumulative Percent
<25 3 5.6 5.6 5.6
25-34 16 29.6 29.6 35.2
35-44 13 24.1 24.1 59.3
45-55 22 40.7 40.7 100.0
Total 54 100.0 100.0
Table1 4.1 Age of respondents
Figure 4.1 is a pie chart diagram depicting the age spread of respondents in percentages. As
depicted in figure 4.1 the majority of respondents were in the age group category of 45-55
years. The respondents in this age group category made up to 40.7 % of the respondents
followed by age group category 25-34 years at 29.6% and then by age group category 35-
44 which constituted 24.1% of respondents. Only 5.6% of the respondents were below 25
years old, meaning 94.4 % of respondents were 25 years and above.
Figure 4.1 Respondents’ age pie chart

45
4.2.2 Race
The demographic spread of respondents in terms of age is shown in
Table 4.2 and figure 4.2 below.
Race Frequency Percent Valid Percent Cumulative
Percent
Indian 21 38.9 38.9 38.9
Black 27 50.0 50.0 88.9
White 6 11.1 11.1 100.0
Total 54 100.0 100.0
Table 4.2 Respondents’ Race
Table 4.2 is a cumulative frequency table of race split of the respondents whilst figure 4.2
depicts the pie chart of same information in percentages.
The majority of respondents were blacks, making 50% of the respondents followed by
Indians who constituted 38.9% of the respondents. White people constituted the least of the
respondents as they were only 11.1% of the respondents.
Figure 4.2 Respondents’ Race pie chart
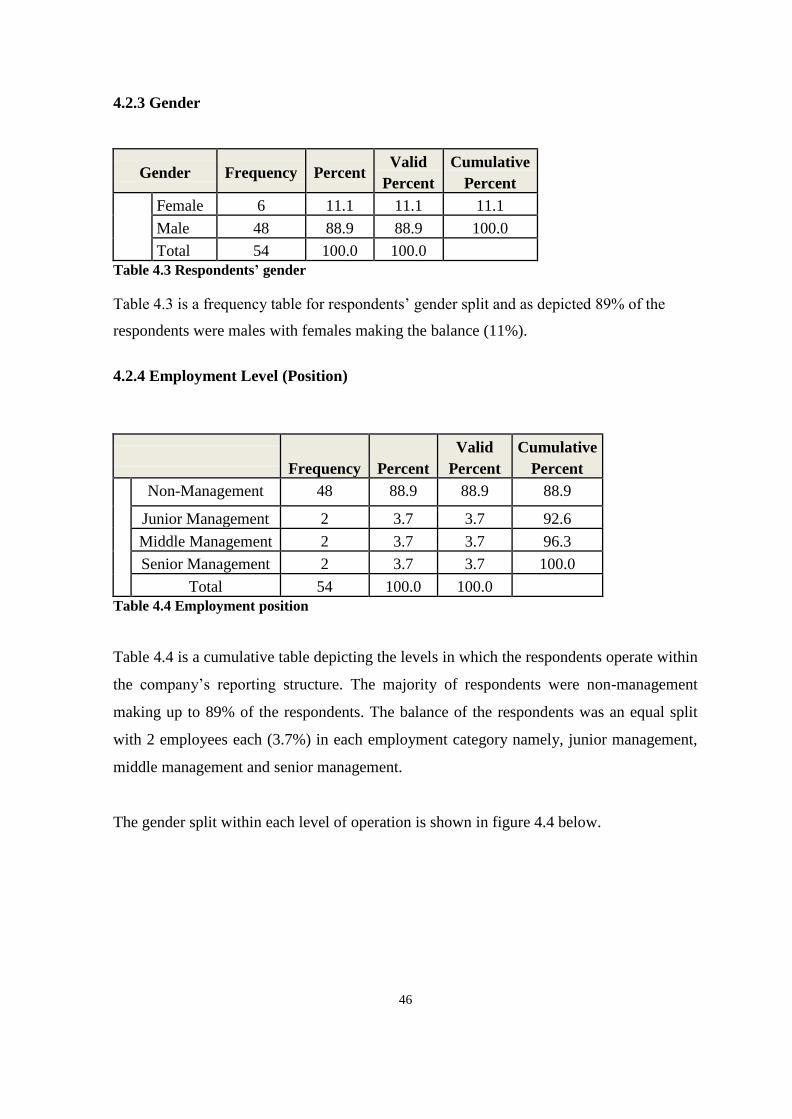
46
4.2.3 Gender
Gender Frequency Percent Valid
Percent
Cumulative
Percent
Female 6 11.1 11.1 11.1
Male 48 88.9 88.9 100.0
Total 54 100.0 100.0
Table 4.3 Respondents’ gender
Table 4.3 is a frequency table for respondents’ gender split and as depicted 89% of the
respondents were males with females making the balance (11%).
4.2.4 Employment Level (Position)
Frequency Percent
Valid
Percent
Cumulative
Percent
Non-Management 48 88.9 88.9 88.9
Junior Management 2 3.7 3.7 92.6
Middle Management 2 3.7 3.7 96.3
Senior Management 2 3.7 3.7 100.0
Total 54 100.0 100.0
Table 4.4 Employment position
Table 4.4 is a cumulative table depicting the levels in which the respondents operate within
the company’s reporting structure. The majority of respondents were non-management
making up to 89% of the respondents. The balance of the respondents was an equal split
with 2 employees each (3.7%) in each employment category namely, junior management,
middle management and senior management.
The gender split within each level of operation is shown in figure 4.4 below.

47
Figure 4.3 depicts the gender split of respondents within the company’s reporting structure.
One out of two, which is 50%, of senior management respondents was a female. There
were no female respondents in the junior management and middle management categories.
A total of 48 respondents were non-management of which 10.4% of them (5 out of 48)
were females.
4.3 Employees’ confirmation of Lean implementation
The following series of frequency tables, table 4.5 to table 4.10, provide information with
regards respondents’ understanding (knowledge) of which Lean tools have been
implemented in their organisation.
This is important to check employees understanding of which Lean tools have been
implemented against what actually has been implemented as presented by the World Class
Manufacturing (WCM) Manager of the organisation the study was conducted in.
Figure 4.3 Gender Split by employment category

48
YES/NO Frequency Percent Valid
Percent
Cumulative
Percent
No 1 1.9 1.9 1.9
Yes 53 98.1 98.1 100.0
Total 54 100.0 100.0
Table 4.5 Respondents’ confirmation of 5s implementation
Table 4.5 shows respondents’ confirmation of 5s implementation. Five S (5S) refers to five
dimensions of workplace organisation designed to organise and keep the workplace Cean
and the five S’s are defined as sort, straighten, shine, standardise and sustain (Lynch 2005).
Overwhelming majority of respondents (98%) agreed that 5s was one of the tools that have
been implemented.
YES/NO Frequency Percent
Valid
Percent
Cumulative
Percent
No 51 94.4 94.4 94.4
Yes 3 5.6 5.6 100.0
Total 54 100.0 100.0
Table 4.6 Respondents’ confirmation of Kanban implementation
Table 4.6 shows respondents’ confirmation of Kanban implementation. Kanban is a system
that uses a card to signal a need to produce or transport a container of raw materials or
partially finished products to the next stage in the manufacturing process (Webster, 2008).
Only 5.6% of respondents were of the understanding that the Kanban system has been
implemented in the factory.
YES/NO Frequency Percent
Valid
Percent
Cumulative
Percent
No 12 22.2 22.2 22.2
Yes 42 77.8 77.8 100.0
Total 54 100.0 100.0
Table 4.7 Respondents’ confirmation of Focussed Improvement implementation
Table 4.7 shows respondents’ confirmation of Focussed Improvement (FI) implementation.

49
Focused improvement is a process of continuously reviewing and improving process
standards. A total of 78% of respondents were of the understanding that FI was one of the
pillars of Lean program implemented in the organisation.
YES/NO Frequency Percent
Valid
Percent
Cumulative
Percent
Valid No 7 13.0 13.0 13.0
Yes 47 87.0 87.0 100.0
Total 54 100.0 100.0
Table 4.8 Respondents’ confirmation of Kiazen implementation
Table 4.8 shows respondents’ confirmation of Kaizen implementation. Kaizen is defined as
continuous improvement in small steps (Nahmias, 2009). The majority of respondents
(87%) knew about Kaizen as part of the Lean tools that have been implemented.
YES/NO Frequency Percent Valid
Percent
Cumulative
Percent
No 4 7.4 7.4 7.4
Yes 50 92.6 92.6 100.0
Total 54 100.0 100.0
Table 4.9 Respondents’ confirmation of Autonomous Maintenance implementation
Table 4.9 shows respondents’ confirmation of Autonomous Maintenance (AM)
implementation. Autonomous Maintenance refers to a process whereby operators are up-
skilled through training to be able to do minor machine adjustments and machine
lubrication tasks that were previously done by engineering personnel (Pollitt 2010).
An overwhelming majority of respondents (93%) confirmed that AM was implemented as
part of the Lean tools in their organisation.

50
YES/NO Frequency Percent
Valid
Percent
Cumulative
Percent
Valid No 11 20.4 20.4 20.4
Yes 43 79.6 79.6 100.0
Total 54 100.0 100.0
Table 4.10 Respondents’ confirmation of Preventative Maintenance implementation
Table 4.10 shows respondents’ confirmation of Preventative Maintenance (PM)
implementation. A total of 20% of the respondents did not know about implementation of
preventative maintenance as part of Lean program.
4.4 Employees’ confirmation of Lean training
The following series of frequency tables, table 4.11 to table 4.16, provide information with
regards respondents’ confirmation of training they have received on each of the Lean tools.
This information is important as the research will seek to establish a correlation on the
impact of training and how this affects employees’ perception of the Lean program.
YES/NO Frequency Percent Valid
Percent
Cumulative
Percent
No 6 11.1 11.1 11.1
Yes 48 88.9 88.9 100.0
Total 54 100.0 100.0
Table 4.11 Confirmation of 5s training
Table 4.11 shows respondents’ confirmation of 5s training. A total of 89% of the
respondents confirmed having received training on 5s.
YES/NO Frequency Percent Valid
Percent
Cumulative
Percent
No 52 96.3 96.3 96.3
Yes 2 3.7 3.7 100.0
Total 54 100.0 100.0
Table 4.12 Confirmation of Kanban training

51
Table 4.12 shows respondents’ confirmation of Kanban training.
The majority of employees (96%) indicated that they did not receive any training on
Kanban.
Frequency Percent Valid
Percent
Cumulative
Percent
No 21 38.9 38.9 38.9
Yes 33 61.1 61.1 100.0
Total 54 100.0 100.0
Table 4.13 Confirmation of Kaizen training
Table 4.13 shows respondents’ confirmation of Kaizen training.
As depicted on Table 4.13 above a total of 61% of the respondents confirmed that they
were trained on Kaizen principles.
Frequency Percent
Valid
Percent
Cumulative
Percent
No 30 55.6 55.6 55.6
Yes 24 44.4 44.4 100.0
Total 54 100.0 100.0
Table 4.14 Confirmation of Focussed Improvement (FI) training
Table 4.14 depicts the respondents’ confirmation of having received training on FI tools. It
was an almost equal split with 44% of the respondents acknowledging to have received
training on the FI tool.
Frequency Percent
Valid
Percent
Cumulative
Percent
No 12 22.2 22.2 22.2
Yes 42 77.8 77.8 100.0
Total 54 100.0 100.0
Table 4.15 Confirmation of Autonomous Maintenance (AM)
Table 4.15 shows the respondents’ split in terms of confirmation of AM training. The
majority of respondents acknowledge having received AM training.
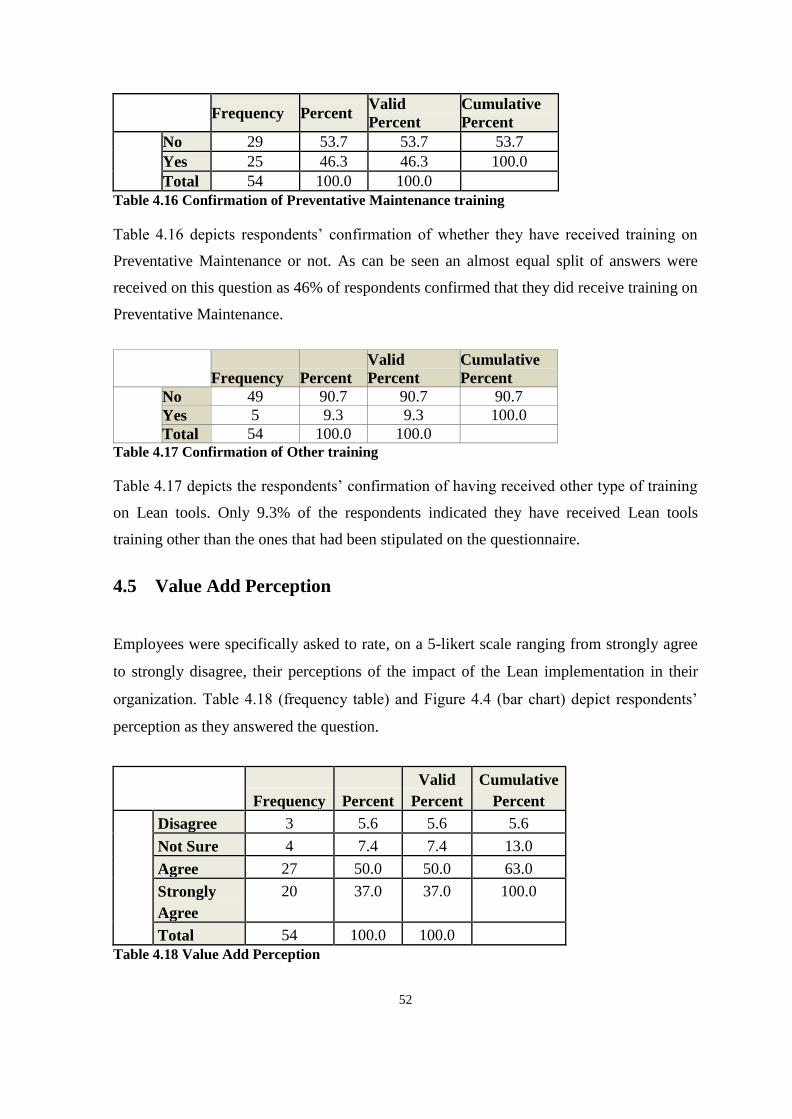
52
Frequency Percent Valid
Percent
Cumulative
Percent
No 29 53.7 53.7 53.7
Yes 25 46.3 46.3 100.0
Total 54 100.0 100.0
Table 4.16 Confirmation of Preventative Maintenance training
Table 4.16 depicts respondents’ confirmation of whether they have received training on
Preventative Maintenance or not. As can be seen an almost equal split of answers were
received on this question as 46% of respondents confirmed that they did receive training on
Preventative Maintenance.
Frequency Percent
Valid
Percent
Cumulative
Percent
No 49 90.7 90.7 90.7
Yes 5 9.3 9.3 100.0
Total 54 100.0 100.0 Table 4.17 Confirmation of Other training
Table 4.17 depicts the respondents’ confirmation of having received other type of training
on Lean tools. Only 9.3% of the respondents indicated they have received Lean tools
training other than the ones that had been stipulated on the questionnaire.
4.5 Value Add Perception
Employees were specifically asked to rate, on a 5-likert scale ranging from strongly agree
to strongly disagree, their perceptions of the impact of the Lean implementation in their
organization. Table 4.18 (frequency table) and Figure 4.4 (bar chart) depict respondents’
perception as they answered the question.
Frequency Percent
Valid
Percent
Cumulative
Percent
Disagree 3 5.6 5.6 5.6
Not Sure 4 7.4 7.4 13.0
Agree 27 50.0 50.0 63.0
Strongly
Agree
20 37.0 37.0 100.0
Total 54 100.0 100.0
Table 4.18 Value Add Perception

53
A total of 50% of the respondents agreed that the implementation of Lean has indeed added
value in their organisation whilst 37% of the respondents strongly agreed with the value
add notion. This means that 87% of the respondents at least agreed that Lean
implementation did add value in their organisation. A total of 5.6% of the respondents at
least disagree that Lean implementation added value in their organisation.
4.6 Job Improvement Perception
Table 4.19 below is a frequency table showing respondents’ perception of whether their
jobs did improve because of Lean implementation and training.
Figure 4.5 is a bar chart depicting the same.
Frequency Percent Valid
Percent
Cumulative
Percent
Not Sure 7 13.0 13.0 13.0
Agree 26 48.1 48.1 61.1
Strongly Agree 21 38.9 38.9 100.0
Total 54 100.0 100.0
Table 4.19 Respondents perception of job improvement
Figure 4.4 Value Add Perception

54
As depicted above a total of 48% of the respondents agreed that their jobs did improve as a
result of Lean implementation and training. A further 39% of the respondents strongly
agree with the notion. Meaning 87% of the respondents at least agree that their jobs have
improved attributable to Lean implementation.
4.7 Cross Tables: Training versus Value Add
The following series of cross tables, table 4.20 to table 4.25, depict the gathered
information on training and value add variables.
Figure 4.5 Employees’ perceptions of job improvement

55
Value Adding Perception
Total Disagree
Not
Sure Agree
Strongly
Agree
Training
5S
No Count 2 0 3 1 6
% within Training 5S 33.3% .0% 50.0% 16.7% 100.0%
Yes Count 1 4 24 19 48
% within Training 5S 2.1% 8.3% 50.0% 39.6% 100.0%
Total Count 3 4 27 20 54
% within Training 5S 5.6% 7.4% 50.0% 37.0% 100.0%
Table 4.20 Cross table of 5s training and value add perception
A total of 48 respondents (89% of sample size) confirmed to having been trained on 5s and
50% of them (24 respondents) agreed that they believed the implementation of Lean
program has added value in their organization with another 40% of the respondents
strongly agreeing. This means that 90% of respondents who acknowledged 5s training at
least agree that Lean program has added value in their organization.
There were only 2% of respondents who had acknowledged 5s training and disagreed that
the implementation of the Lean program has added value in their organization.
None of the respondents strongly disagreed that the implementation of Lean program has
added value in their organization.
Value Adding Perception
Total
Dis
Agree
Not
Sure Agree
Strongly
Agree
Training
Kanban
No Count 3 4 26 19 52
% within Training Kanban 5.8% 7.7% 50.0% 36.5% 100.0%
Yes Count 0 0 1 1 2
% within Training Kanban .0% .0% 50.0% 50.0% 100.0%
Total Count 3 4 27 20 54
% within Training Kanban 5.6% 7.4% 50.0% 37.0% 100.0%
Table 4.21 Cross table of Kanban training and value add perception
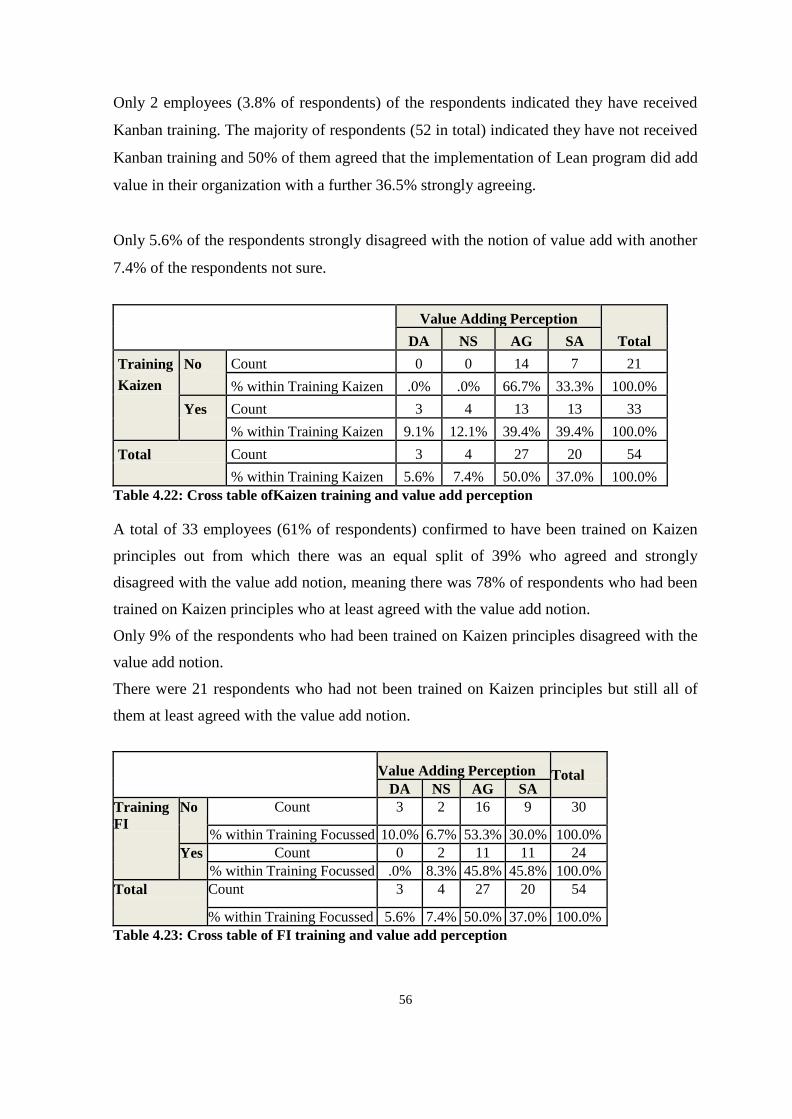
56
Only 2 employees (3.8% of respondents) of the respondents indicated they have received
Kanban training. The majority of respondents (52 in total) indicated they have not received
Kanban training and 50% of them agreed that the implementation of Lean program did add
value in their organization with a further 36.5% strongly agreeing.
Only 5.6% of the respondents strongly disagreed with the notion of value add with another
7.4% of the respondents not sure.
Value Adding Perception
Total DA NS AG SA
Training
Kaizen
No Count 0 0 14 7 21
% within Training Kaizen .0% .0% 66.7% 33.3% 100.0%
Yes Count 3 4 13 13 33
% within Training Kaizen 9.1% 12.1% 39.4% 39.4% 100.0%
Total Count 3 4 27 20 54
% within Training Kaizen 5.6% 7.4% 50.0% 37.0% 100.0%
Table 4.22: Cross table ofKaizen training and value add perception
A total of 33 employees (61% of respondents) confirmed to have been trained on Kaizen
principles out from which there was an equal split of 39% who agreed and strongly
disagreed with the value add notion, meaning there was 78% of respondents who had been
trained on Kaizen principles who at least agreed with the value add notion.
Only 9% of the respondents who had been trained on Kaizen principles disagreed with the
value add notion.
There were 21 respondents who had not been trained on Kaizen principles but still all of
them at least agreed with the value add notion.
Value Adding Perception Total DA NS AG SA
Training
FI
No Count 3 2 16 9 30
% within Training Focussed 10.0% 6.7% 53.3% 30.0% 100.0%
Yes Count 0 2 11 11 24
% within Training Focussed .0% 8.3% 45.8% 45.8% 100.0%
Total Count 3 4 27 20 54
% within Training Focussed 5.6% 7.4% 50.0% 37.0% 100.0%
Table 4.23: Cross table of FI training and value add perception
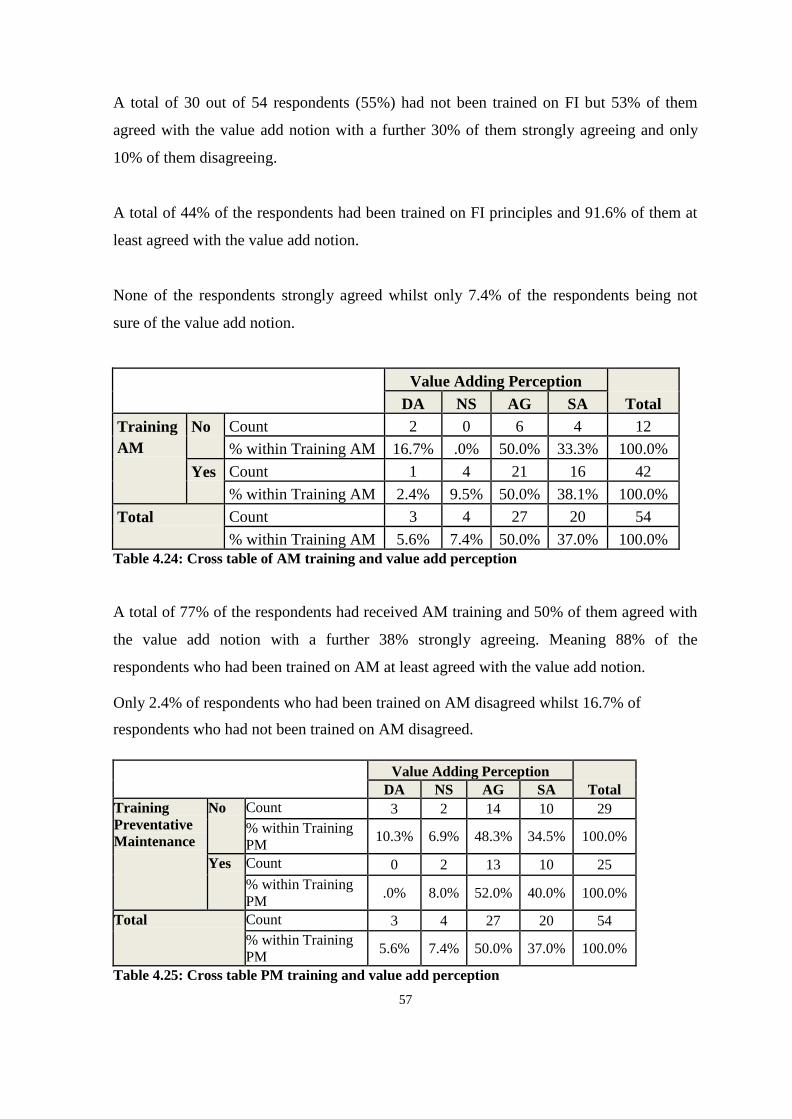
57
A total of 30 out of 54 respondents (55%) had not been trained on FI but 53% of them
agreed with the value add notion with a further 30% of them strongly agreeing and only
10% of them disagreeing.
A total of 44% of the respondents had been trained on FI principles and 91.6% of them at
least agreed with the value add notion.
None of the respondents strongly agreed whilst only 7.4% of the respondents being not
sure of the value add notion.
Value Adding Perception
Total DA NS AG SA
Training
AM
No Count 2 0 6 4 12
% within Training AM 16.7% .0% 50.0% 33.3% 100.0%
Yes Count 1 4 21 16 42
% within Training AM 2.4% 9.5% 50.0% 38.1% 100.0%
Total Count 3 4 27 20 54
% within Training AM 5.6% 7.4% 50.0% 37.0% 100.0%
Table 4.24: Cross table of AM training and value add perception
A total of 77% of the respondents had received AM training and 50% of them agreed with
the value add notion with a further 38% strongly agreeing. Meaning 88% of the
respondents who had been trained on AM at least agreed with the value add notion.
Only 2.4% of respondents who had been trained on AM disagreed whilst 16.7% of
respondents who had not been trained on AM disagreed.
Value Adding Perception
Total DA NS AG SA
Training
Preventative
Maintenance
No Count 3 2 14 10 29
% within Training
PM 10.3% 6.9% 48.3% 34.5% 100.0%
Yes Count 0 2 13 10 25
% within Training
PM .0% 8.0% 52.0% 40.0% 100.0%
Total Count 3 4 27 20 54
% within Training
PM 5.6% 7.4% 50.0% 37.0% 100.0%
Table 4.25: Cross table PM training and value add perception

58
A total of 25 respondents confirmed to have received PM training of which 52% of them
agreed with the value notion with a further 40% of them strongly agreeing.
A total of 14% of respondents who had not been trained on PM agreed with the value add
notion with a further 34.5% of them strongly agreeing.
Only 10% of the respondents who had not been trained on PM disagreed.
4.8 Cross tables: Training versus Job Improvement
The following series of cross tables, table 4.26 to table 4.31, depict the gathered
information on the training and job improvement variables.
Job Improvement
Perception
Total NS AG SA
Training
5S
No Count 1 3 2 6
% within Training 5S 16.7% 50.0% 33.3% 100.0%
Yes Count 6 23 19 48
% within Training 5S 12.5% 47.9% 39.6% 100.0%
Total Count 7 26 21 54
% within Training 5S 13.0% 48.1% 38.9% 100.0%
Table 4.26: Cross table on 5s training and job improvement perception
The majority of respondents (48/54) had been trained on 5s principles of which 48% of
them agreed that Lean tools training did result in an improvement in the way they do their
jobs with a further 40% strongly agreeing with the job improvement notion.
Only 12.5% of respondents that have been trained on 5S were not sure of job improvement.
Only 6 employees had not been trained on 5s but still 83% of them at least agreed that
Lean tools training did improve the way they do their jobs.
None of the respondents disagreed with the job improvement notion.

59
Job Improvement
Perception
Total NS AG SA
Training
Kanban
No Count 7 25 20 52
% within Training Kanban 13.5% 48.1% 38.5% 100.0%
Yes Count 0 1 1 2
% within Training Kanban .0% 50.0% 50.0% 100.0%
Total Count 7 26 21 54
% within Training Kanban 13.0% 48.1% 38.9% 100.0%
Table 4.27: Cross table on Kanban training and job improvement perception
The majority of respondents (96%) confirmed not to have received any Kanban training
however 87% of them acknowledged job improvement due to Lean tools training.
Only 13% of the total respondents were not sure of the job improvement notion.
Job Improvement
Perception
Total NS AG SA
Training
Kaizen
No Count 4 9 8 21
% within Training Kaizen 19.0% 42.9% 38.1% 100.0%
Yes Count 3 17 13 33
% within Training Kaizen 9.1% 51.5% 39.4% 100.0%
Total Count 7 26 21 54
% within Training Kaizen 13.0% 48.1% 38.9% 100.0%
Table 4.28: Cross table on Kaizen training and job improvement perception
A total of 33 respondents (61% of respondents) had received Kaizen training of which 91%
of them at least agreed with the job improvement notion with only 9.1% of them not being
sure.
A total of 39% of the respondents had not received Kaizen training but 81% of them at
least agreed that their jobs did improve as a result of Lean tools training.

60
Job Improvement
Perception
Total NS AG SA
Training
FI
No Count 5 18 7 30
% within Training FI 16.7% 60.0% 23.3% 100.0%
Yes Count 2 8 14 24
% within Training FI 8.3% 33.3% 58.3% 100.0%
Total Count 7 26 21 54
% within Training FI 13.0% 48.1% 38.9% 100.0%
Table 4.29: Cross table of FI training and job improvement perception
As per table 4.27 above 44% of the respondents confirmed that they have received FI
training and the majority (58%) of these employees who have been trained on FI strongly
agreed that their jobs improved due to Lean tools training with a further 33% of them just
agreeing with the job improvement notion.
Although a significant number of respondents (55%) had not been trained on FI none of
them disagreed with the notion that their jobs did improve. A total of 83% of respondents
who had not been trained on FI at least agreed with the job improvement notion.
Job Improvement
Perception
Total NS AG SA
Training
AM
No Count 4 4 4 12
% within Training AM 33.3% 33.3% 33.3% 100.0%
Yes Count 3 22 17 42
% within Training AM 7.1% 52.4% 40.5% 100.0%
Total Count 7 26 21 54
% within Training AM 13.0% 48.1% 38.9% 100.0%
Table 4.30: Cross table of AM training and job improvement
A total of 78% of the respondents confirmed that they have been trained on AM and 52%
of them agreed with the job improvement notion with a further 40.5% strongly agreeing.
Meaning, 93% of the respondents who had been trained on AM at least agreed with the job
improvement notion.

61
Respondents who had not been trained on AM made 22% of the total respondents and
amongst them there was an equal split of 33.3% of employees who were not sure, agree
and strongly agree with the job improvement notion.
Job Improvement Perception
Total NS AG SA
Training
PM
No Count 4 13 12 29
% within Training PM 13.8% 44.8% 41.4% 100.0%
Yes Count 3 13 9 25
% within Training PM 12.0% 52.0% 36.0% 100.0%
Total Count 7 26 21 54
% within Training PM 13.0% 48.1% 38.9% 100.0%
Table 4.31: Cross table of PM training and job improvement
The majority of respondents (54%) did not receive PM training. However 86% of those
who had not been trained on PM at least agreed that the way they do their jobs improved as
a result of Lean tools training.
Employees who acknowledge PM training were 46% of the total respondents and within
them 52% of them agreed with the job improvement notion whilst a further 36% of them
strongly agreed.
Only 13% of employees who had been trained on PM were not sure as to whether the way
they do their jobs had improved due to Lean tools training.
4.9 Most important aspect for a successful Lean implementation
Question 9 of the questionnaire requested employees to select one out of four items they
consider to be important. Figure 4.6 below depicts the results.

62
Figure 4.6 Important aspect frequencies
Figure 4.6 is a bar chart diagram depicting the frequencies of how the respondents chose
what they rated as the most important aspect for asuccessful Lean implementation as
required by question 9 of the questionnaire.
As can be seen on figure 4.6 the majority of respondents rated training as the most
important aspect for a successful Lean implementation. A total of 30 respondents (56%)
rated training as the most important aspect followed by management commitment (26%).
Communication and Union Management relationship received the least rating with only
11% and 7% of the respondents respectively.
4.10 Chi-Square (X2)
Table 4.32 below is a frequency table depicting results of question 9 and test statistics
results

63
Q9: Important aspect frequencies
Observed N Expected N Residual
Training 30 13.5 5.0
Communication 6 13.5 -13.0
Management commitment 14 13.5 17.0
Union-management relationship 4 13.5 -9.0
Total 54 54
Table 4.32: Important aspect
Test Statistics
Important aspect
Chi-square 31.037a
Df 3
Asymp. Sig. .000
a. 0 cells (.0%) have expected frequencies less than 5. The
minimum expected cell frequency is 13.5
4.11 Summary
Descriptive statistical methods were used to analyse the data provided by the respondents
through the questionnaire. The demographic patterns of the respondents were presented
both in tabular and graphical formats. The frequency table was used to capture the age
demographic information of the respondents whilst the pie chart diagram was used to
depict the same information, showing the relative size of each age group. Similarly the
respondents’ gender information was captured using the frequency table whilst the stacked
bar chart was used to depict the relative size of each gender group across the employment
positions.
Frequency tables were used to depict respondents’ answers confirming their understanding
of which Lean tools (e.g. Kanban, 5S, Focussed Improvement, Kaizen and Autonomous
Maintenance) have been implemented in their organisation.
Cross tables were used to map the correlation between training and other variable such as
value add and job improvement.
The next chapter provides a detailed discussion and analysis of the results in the context of
literature review and study objectives.

64
CHAPTER FIVE
DISCUSSION
5.1 Introduction
A detailed statistical analysis of the questionnaire results was presented in the preceding
chapter (Chapter 4). Simple descriptive statistical methods were used to analyse the data.
In this chapter the analytical results obtained in the previous chapter are used to develop an
understanding of whether the objectives of the study were met or not and also provide a
perspective of how consistent the results are with the theory and findings from other
studies as covered in chapter 2 of the research study.
The objectives of the study will be revisited before the research results are discussed to
establish the extent to which the objectives were met.
An explanation will also be provided of how the questionnaire was constructed in line with
the objectives of the study and how the questionnaire results relate to both study objectives
and theory.
A chapter summary will conclude the chapter by outlining key aspects as discussed in this
chapter.
5.2. Aims and Objectives of the study
The purpose of this study was to understand from both a management’s and employees’
perspective the relative importance of key success factors, specifically training, for
successful implementation of Lean principles and to understand the impact of training on
employees perceptions of Lean program.
The objective of the study is to research the impact that Lean training has on employees’
perceptions of Lean tools in their own workplace and overall impression of the Lean

65
program in their organisation. The following four research objectives were established:
1. Determine what Lean training has been given to employees;
2. Determine employees’ perceptions of impact of Lean tools in their own work;
3. Determine employees’ perceptions of relative success of Lean program in their
organisation;
4. Determine what other factors are considered important by employees for a successful
Lean implementation,
The results of the research are intended to benefit organisations that intend to implement
Lean principles to develop insight on some of the key factors they could focus on.
Similarly, organisations that are experiencing difficulties in successfully implementing
Lean principles could refresh their approach as guided by the findings of this research.
The questionnaire was therefore specifically designed to provide information aimed at
establishing facts in line with the four research objectives as outlined above and the results
of which are discussed below.
5.3 Demographics of Respondents
The demographic profile of the respondents was skewed in many instances towards certain
profiles e.g. for gender 89% were males, for race, Indians and blacks made 89% of
respondents.
It is however the employment category (level of employment) of respondents that could
have more direct bearing or impact on the research study. Whilst the purpose of the study
was aimed at developing an understanding of both management and employees’ (non-
management) perceptions on the subject of Lean it is important to note that the majority of
respondents (i.e. 89% of the respondents) were non-management.
It is therefore prudent to maintain a perspective that the 89% of questionnaire results are a
reflection of perception by non-management personnel in the sample.

66
5.4 Lean tools implemented
The research was conduct with the assistance of the World Class Manufacturing (WCM)
manager who had provided relevant information pertaining to the scope and breadth of the
Lean program in the organisation.
It was confirmed with the WCM manager that the following pillars of WCM had been
implemented - Focused Improvement, Autonomous Maintenance, Equipment
Maintenance, Planned Maintenance, Safety and Health, Quality Maintenance and
Environment.
It was important to establish the understanding of the respondents with regard to the
elements of WCM that have been implemented in the organisation and the specific Lean
tools training they have received as this would show understanding of WCM principles by
the employees. This was addressed in the questionnaire through questions 5 and 6 which
requested respondents to confirm elements of Lean principles that have been implemented
(question 5) by selecting from the list and also confirmed the specific training they
themselves received (Question 6).
The respondents did show to have a great knowledge of Lean tools that have been
implemented and consistent with management information that was provided they
confirmed that the following Lean tools have been implemented as follows (% of Yes
responses in brackets): 5s (98%), FI (78%), Kaizen (87%), Autonomous Maintenance
(93%), Preventative Maintenance (80%).
Employees would have been exposed to Lean tools that are relevant to their type of work
e.g. PM would be specifically relevant for employees in the Engineering department
whereas 5s is relevant to all personnel including office admin personnel. Hence 5s Lean
tool received the highest confirmation of implementation. This should then explain the
variation in the level of implementation confirmation for the Lean tools as per the
questionnaire.

67
To test the authenticity of the respondents in answering the questionnaire one of the Lean
tools included in the list to choose from was Kanban which was known to have not been
implemented.
It is for this reason that 5.6% of the respondents who ticked yes for Kanban
implementation are regarded as potentially a misunderstanding of the question by the
respondents.
The overall response on question 5 therefore provides good ground to suggest that the
respondents were generally familiar with the Lean tools that have been implemented in
their organisation which provided a reasonable platform to establish a correlation between
the Lean training respondents they received and perceptions on value added by Lean
implementation.
5.5 Lean training value add perception
The question that specifically dealt with this issue was question 7 of the questionnaire.
As reflected in the results chapter of this dissertation the outcome of this question indicated
that overall a significant majority of the respondents (87%) in a 5-likert scale at least
agreed that the implementation of the Lean program has added value in their organisation.
It was evident in the results that employees were quite clear on which Lean tools training
they have received. This ranged from the most trained Lean tool of 5s (89%) to Kanban
which had not been trained at all. However, irrespective of whether employees had
received a specific training or not the respondents were consistent in their perception of
Lean program. As an example, 86% of the 96% of the respondents who had correctly
identified that they had not been trained on Kanban had agreed that the Lean program has
indeed added value. Even on some of the Lean tools that had an almost equal split of
trained and not trained such as FI, a total of 83% of the FI trained and 96% of the FI not
trained employees believed that Lean had added value in their organisation.
The positive perception does not seem to stem from specific Lean tool training. As long as

68
employees had received Lean training relevant to their work they had positive perception
about the Lean program.
This finding is very consistent with the Lean theory as covered in chapter 2 which
suggested employee training as the heart of Lean program and more importantly having
positive impact on employee morale.
5.6 Job improvement perceptions
Has my job (or the way I do my job) improved since I was trained on Lean tools? This was
the essence of question 8 of the questionnaire.
Overall 87% of the respondents irrespective of which Lean tool training they had received
indicated they believed their jobs had improved due to Lean tool training. It is also
important to highlight that whilst there was 5.6 % of respondents who at least disagreed
with the value add notion, none of the respondents disagreed or strongly disagreed with the
notion of job improvement.
This may suggest that job improvement perception does not necessarily correlate with the
perception of value add of the Lean program. Meaning employees who believe their jobs
have improved due to Lean training may not necessarily believe that overall the Lean
program has added value in the organisation.
Similar to the value add perception findings, respondents seemed to have a positive
perception about job improvement irrespective of type of training they have received. As
an example even though employees had not been trained on the Kanban principle, a total of
87% of the employees who had correctly answered this question still believed that their
jobs had improved due to Lean training. This is because even though they may not have
been trained on Kanban specifically they would have been trained on other relevant Lean
tools.

69
5.7 Which factors are important?
One of the research objectives was to establish which factors are regarded as important for
successful Lean implementation by employees. This was addressed by question 9 of the
questionnaire.
Employees were given four choices to choose one from as follows:
Training
Communication
Management commitment
Union-management relationship
The results depicted an unequal distribution of observed frequencies across all four aspects
with 56% and 26% of the respondents choosing training and management commitment
respectively as the most important aspects for a successful Lean implementation. This
question is critical to answer before assumptions about the sample are made based on
these results.
The Chi-square test (Goodness-of-Fit Test) is applied to answer the above question as
described by Lind, Marchal and Wathen (2008).
The null hypothesis, H0, would be that there is no difference between the set of observed
frequencies and the set of expected frequencies. Meaning the difference between expected
frequencies and observed frequencies could be attributed to sampling chance. The
alternative hypothesis, H1, is that there is a difference between the observed and expected
sets of frequencies. Meaning, the difference between the two sets of frequencies is not a
sampling error but a reflection of the sample.
The level of significance selected is 0.05.
The degrees of freedom (df) is k-1 = 4-1 = 3, where k is the number of categories.

70
The critical value for df = 3 and 0.05 significance level is obtained using the Chi-squire
table and is determined to be 7.815.
Because the obtained Chi-squire value is 31.037 which is higher than the critical value of
7.815 it stands to follow that the null hypothesis must be rejected and the alternative
hypothesis be accepted. Meaning the differences between the observed sets of frequencies
and expected sets of frequencies is not a sampling chance.
It is therefore accepted as a finding of this study that the fact that 56% and 26% of the
respondents regarded training and management commitment respectively as the most
important aspects for a successful Lean implementation as not being a sampling chance.
There is however an interesting observation in that the majority of the respondents were
non-management, however, union–management relationship received the least voting with
only 4.7% of respondents voting this aspect as the most important amongst the four
choices that were provided, which are training, communication, management commitment
and union – management relationships.
5.8 Summary
The objectives of the study were revisited and the statistical results of the data were in line
with the study objectives.
It was established that respondents had a good understanding of the Lean tools that have
been implemented in the organisation and which Lean tools they have received training
for.
Overall, respondents had a good perception of the Lean program and believed that the
implementation of this program in their organisation did add value to their organisation.
Similarly the majority of respondents believed that their jobs improved due to Lean
training.
71
It was however interesting to learn that positive perception of job improvement did not
automatically translated into positive perception of value add of the Lean program in the
organisation. The positive perceptions of value add and job improvement were not
necessarily correlated to specific Lean tool training.
Another interesting observation of the study was that union-management relationship was
regarded as the least important aspect for a successful Lean implementation. Respondents
regarded training as the most important aspect for a successful Lean implementation
program.
It is the purpose of the next chapter to discuss and provide context of the findings made in
this chapter with regards implications of the findings and to provide recommendations for
future studies.

72
CHAPTER SIX
CONCLUSIONS AND RECOMMENDATIONS
6.1 Introduction
The findings of this study as discussed in the previous chapter (chapter 5) and the literature
review covered in chapter 2 provide a basis for making recommendations that should be
useful to a range of stakeholders such as management, consultants and employees as
identified in chapter 1 of the study.
The purpose of this chapter is to therefore provide a context of the extent to which the
research question, which was presented in chapter 1, was answered and to provide
recommendations and conclusions based on the findings of this study.
Recommendations for future studies will be made before concluding the chapter with a
summary.
6.2 Does training have an impact on employees’ perceptions?
Overwhelmingly employees had a very positive perception about the impact of Lean
training on their own jobs. Employees believed that the way they do their jobs did improve
as a result of Lean training.
The research findings further suggest that the respondents had a positive perception about
the value added overall in the organisation by the Lean program. There is however
evidence to suggest that positive perception about job improvement may not necessarily
mean employees will also have a positive perception about value that the Lean program
adds in the organisation.
Employees consider training, followed by management commitment, as the most important
aspects for a successful Lean implementation.

73
6.3 Findings and implications of the study
In line with the literature review and the findings of this study it is suggested that Lean
training should be regarded as an important aspect (critical factor) for a successful Lean
implementation.
A positive mind-set about Lean training should also contribute positively on employees’
morale and consequently employees’ commitment towards the Lean program should be
enhanced.
Another important finding of the study is that the positive impact of training is not
necessarily correlated to any specific Lean tool training and therefore it is important
employees are provided with Lean training that is relevant to their jobs.
Responses to question 9 of the questionnaire reflected that the majority of respondents
(59%) considered training as a critical factor for a successful Lean implementation. This
was followed by management commitment with 26% of the respondents. Employees
therefore regard management commitment as another important aspect for a successful
Lean program. It is therefore important that senior management of the organisation must
show (display) commitment towards the Lean program being implemented.
Management can show their commitment by making necessary resources (time, funds etc.)
available for Lean activities. Management can also design performance linked reward and
recognition systems to keep employees motivated and committed to the program.
Organisations that are in the process of implementing Lean can review the programs in line
with the findings of this study and specifically review their training programs and align
senior management’s organisational performance priorities to the Lean program.

74
6.4 Recommendations for Future Studies
Based on the findings as presented above it is recommended that management should
review the training being offered to employees to ensure it is relevant to their jobs and to
ensure that all employees are indeed trained. This would create a critical mass of
employees who are positively influenced by the training offered on their jobs and improved
perceptions of the Lean program overall.
This study was conducted in one organisation and it would therefore be recommended that
before the findings of this study are applied in other organisations a repeat of the study is
conducted across different organisations in different industries possibly across different
provinces (geographic locations).
There were some interesting findings coming out of the study that raises pertinent
questions, that were beyond the scope of this study to establish, and therefore would
require further investigation. Results of question 7 (value add perception question) and
question 8 (job improvement perception problem) show that there was some respondents
(5.6%) who disagreed with the value add notion even though none of the employees
disagreed with the job improvement notion. The question is therefore why would some
employees feel good about Lean training with regards job improvement but not necessarily
believe that a Lean program as a whole is adding value in the organisation?
The majority of respondents were non-management (89%) but nonetheless only 7% of
them regarded union-management relationship as important. The question is why would
employees who are predominantly non-management and presumably unionised not regard
union-management relationship as a critical factor for a successful Lean program.
A qualitative study of the same topic could enhance the findings of this study by providing
benefits associated with qualitative studies such as unstructured interviews that will not
limit respondents to provide information as directed and restricted to questions in the
questionnaire.

75
There are also a number of variables that can be investigated that never were part of the
scope of this study such as:
The impact of South African labour law on Lean manufacturing;
The impact of employees’ literacy level on Lean manufacturing;
The impact of management style and organisational culture on Lean manufacturing.
6.5 Summary
The objective of the study was to research and investigate the impact that Lean training has
on employees’ perceptions of Lean tools in their own workplace and the overall impression
of the Lean program in their organisation.
So, does training have an impact on employees’ perceptions of a Lean implementation?
The findings from this study showed that employees had a very good positive perception of
the impact that the Lean training had on their jobs. They overwhelmingly believed that
their jobs did improve due to Lean training; Employees in general also believed that the
Lean program being implemented in their organisation was adding value. The perceptions
that employees had about job improvement and value add were not necessarily linked or
correlated to specific Lean tool training. Employees’ also considered training as the most
important aspect of Lean implementation followed by management commitment whilst
communication and union-management relationship were deemed least important. The
research findings therefore fully answer the research question.

76
REFERENCE
Achanga, P., Shehab, E., Roy, R., Nelder, G. 2006. Critical success factors for Lean
implementation within SME’s. Journal of Manufacturing Technology Management
[online] 17, (4) 360-471. Available from
<http:www.ukzn.ac.za/library/database/emerald> [31 October 2010].
Awad, A. 2010. Lean improvements and challenges. M.S. diss., California State
University, Dominguez Hills,2010. In Dissertations & Theses: A&I [database on-line];
available from http://www.proquest.com (publication number AAT 1489977; accessed
August 13, 2011).
Bhasin S. 2008. Lean and performance measurement. Journal of Manufacturing
Technology Management, 19(5), 670-684. Retrieved November 20, 2010, from
ABI/INFORM Global. (Document ID: 1491531831).
Bhasin, S., and Burcher, P. 2006. Lean viewed as a philosophy. Journal of Manufacturing
Technology Management, 17(1/2), 56-72. Retrieved November 28, 2010, from
ABI/INFORM Global. (Document ID: 1009583091).
Boyle, T.A. and Scherrer, R. 2009. An empirical examination of the best practices to
ensure manufacturing flexibility. Lean alignment. Journal of manufacturing Technology
Managemnt, Vol 2o No.2, pp.348-366.Emerald Group Publishing Limited, 1741-038X
Bryman, A. B., and Bell, E. 2007. Business Research Methods. Second Edition. Oxford
University Press, New York. ISBN 978-0-19-928498-6.
Cachon, G. & Terwiesch. 2009. Matching Supply with Demand An introduction to
Operations Management. 2nd
ed. McGraw-Hill/Irwin, New York.
Cooper, D.R., and Schindler P.S. 2003. Business Research Methods. Eighth edition.
McGraw-Hill/Irwin, New York. ISBN 0-07-115160-5.

77
Davis, M.M. & Heineke, J. 2005. Operations Management - Integrating manufacturing
and services. 5th
edition. McGraw-Hill/Irwin, New York. ISBN 0-07-111408-4.
Evans, J.R., and Lindsay, W.M. 2008. The Management and Control Of Quality. 7th
edition. Thomson, Canada. ISBN 13:978-0-324-382385-8.
Finch, B.J. 2006. Operations Now: Profitability, Processes, Performance. Second edition.
McGraw-Hill/Irwin, New York. ISBN 0-07-111582-X.
Friel, D. 2003. Labour Policy Choice and the organization of work: A case study of the
efficacy of Lean Production at a German Conglomerate in the United States and Germany.
New School University, Hattam Victoria.
Gray, D.E. 2009. Doing Research in the Real World. Second edition. SAGE Publications
Ltd, London. ISBN 978-1-847-336-1.
Hair, J.F. Jr., Money, A., Samouel, P., Page, M. 2007. Research Methods For Business.
Library of Congress Cataloging-in-Publication Data, England. ISBNN -13:978-0-470-
03404-0.
Heizer, J., Render B. 2001. Principles of Operations Management. 4th
edition. Prentice-
Hall, New Jersey:. ISBN 0-13-027147-0.
Jacobs, F. R., Chase, R.B. 2008. Operations and Supply Management The Core. New
York: McGraw-Hill/Irwin. ISBN 978-0-07-110125-7.
Jacobs, F., Chase, R., and Aquilano, N. 2009 Operations and Supply Management. 12th
edition. McGraw-Hill/Irwin, New York. ISBN 978-0-07-128804-0.
Jankowicz, A.D. 2006. Business Research Projects. Fourth edition. Thomson Learning
(Send Lee Press),Singapore. ISBN-10:1-84480-082-2.

78
Keyes, J., Nahn, A., & Lauver, K.. (2009). Measuring the Effect of Lean Implementation at
a Low-Volume, High-Variety Manufacturer: A Case Study1. Production and Inventory
Management Journal, 45(2), 23-34. Retrieved November 20, 2010, from ABI/INFORM
Global. (Document ID: 2003981361).
Kilpatrick, J. 2003. Lean Principle. Manufacturing Extension Partnership. [online]
available from <http:www.googlescholar.com>[06 November 2010].
Kothari, C.R. 2006. Research Methodology - Methods and Techniques. 2nd
edition. New
Age International (P) Limited Publishers, New Delhi. ISBN 81-224-1522-9.
Lee, N. and Lings, I. 2008. Doing business research – a guide to theory and practice.
British Library Cataloguing in Publication data, London. ISBN 978-1-4129-2878-6.
Lind, A.L., Marchal W.G., Wathen S. 2008. Statistical Techniques in Business and
Economics with Global Data Sets. 13th
edition. McGraw-Hill/Irwin, New York. ISBN 978-
0-07-110151-6.
Lynch, L. L. 2005. The relationship of Lean manufacturing 5S principles to quality,
productivity, and cycle time. Ph.D. dissertation, Walden University, United States --
Minnesota. Retrieved August 14, 2011, from ABI/INFORM Global. (Publication No. AAT
3169046).
Maylor, H. and Blackmon K. 2005 Researching Business and Management. Palgrave
Macmillan, New York. ISBN-978-00333-96407-0.
McBreen, B. 2003. Notes on Lean thinking [online] Available from
<http://www.googlescholar.com>[06 April 2011].
McBreen B. 2008. Notes on Continuous Process Improvement An outline of: Lean
Thinking Banish Waste and Create waste in Your Corporation [online]. Available from
http://www.googlescholar.com [26 November 2010]

79
Melton, T. 2005. The Benefits Of Lean Manufacturing - What Lean Thinking has to Offer
the Process Industries. Chemical Engineering Research and Design [online] 83(A6): 662–
673. Available from <http:www.ukzn.ac.za/library/database/Emerald>[06 August 2011].
Nagarajan, P. 2009. Reducing changeover times in a web offset packaging
environment. M.S. diss., Rochester Institute of Technology. In Dissertations & Theses:
A&I [database on-line]; available from http://www.proquest.com (publication number
AAT 1470023; accessed August 13, 2011).
Nahmias, S.2009. Production and Operations Analysis. 6th
ed. McGraw-Hill Irwin, New
York. ISBN 978-007-126370-2.
Pieterse K., Lourens A., Louw A., Murray A., and Van der Merwe K. 2010. Implementing
Lean In South African Industry. 1st edition. TriLean Publishing, Port Elizabeth.
Pollitt, D. 2010. Training creates skilled maintenance technicians at Toyota. Training &
Management Development Methods 24, no. 4, (August 10): 581-584.
http://www.proquest.com/ (accessed August 14, 2011).
Poppendieck, M. 2002 Principles of Lean Thinking [online]. USA: Poppendieck LLC
Availble from < http:www.googlescholar.com> [06 November 2010].
Principles of Lean. 2009. [online]. Available WWW: www.Lean.org (Accessed 28
November 2010).
Sanchez, A.M, Perez, M.P. 2001. Lean indicators and manufacturing strategies.
International Journal of Operations and Production Management, vol 21 No 11, 2001
pp1433-1451. ©MCB University Press, 0144-3577.

80
Sawhney, R. and Chason, S. 2005. Human Behavior Based Exploratory Model for
Successful Implementation of Lean Enterprise in Industry. Performance Improvement
Quarterly [online] 18(2) 76-96. Available from
<http:www.ukzn.ac.za/library/database/Emerald> [26 November 2010].
Schroeder, R. G.2008. Operations Management Contemporary concepts and cases. 4th
edition. McGraw-Hill/Irwin, New York . ISBN 978-007-126386-3
Stevenson, W.J. 2009. Operations Management. 10th
edition. McGraw-Hill Irwin, New
York. ISBN 978-0-07-009177-1.
Singh, B.S., Garg, S.K.S., Sharman S. and Grewal C. 2010. Lean implementation and its
benefits to production industry. International Journal of Lean Six Sigma, 1(2), 157-168.
Retrieved November 20, 2010, from ABI/INFORM Global. (Document ID: 2080488211).
Webster, S. 2008. Principles and tools for supply management.1st ed. McGraw-Hill Irwin,
New York. ISBN 978-0-07-110126-4.
Worley, J.M., and Doolen T.L. 2006. The role of communication and management support
in a Lean manufacturing implementation. Management Decision [online] 44, (2) 228-245.
Available from <http:www.ukzn.ac.za/library/database/Emerald>[31 October 2010]
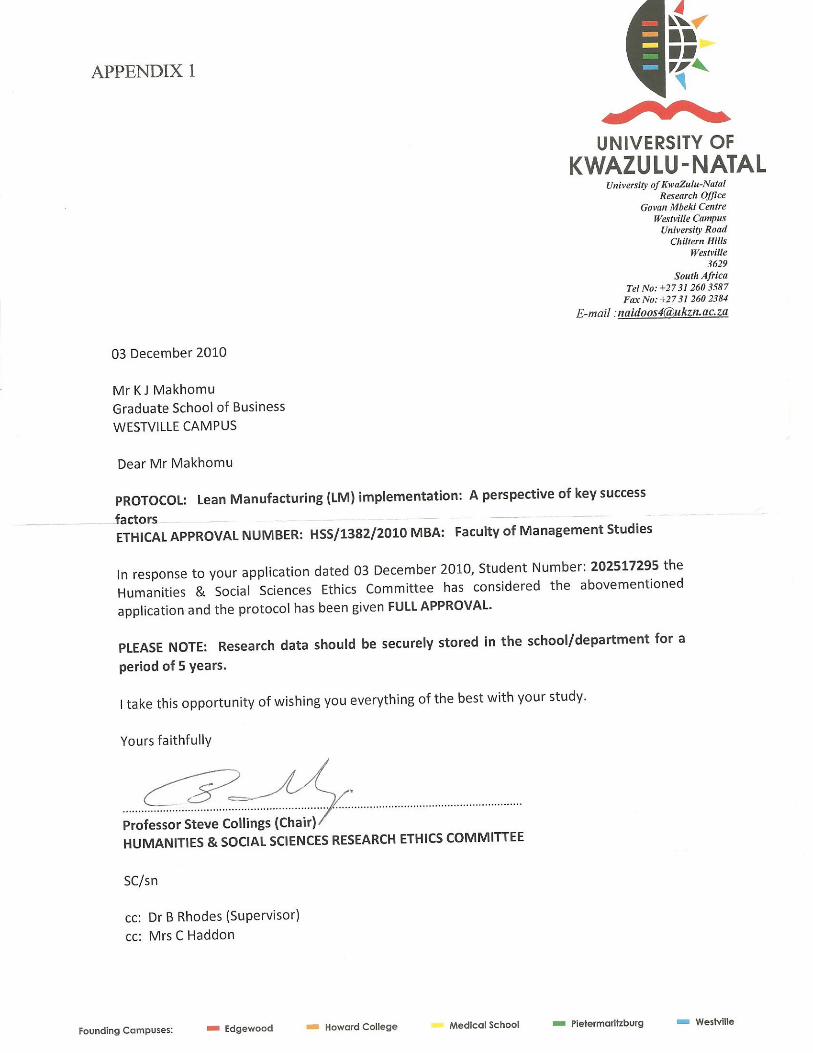

APPENDIX 2
82
MBA Research Survey Informed Consent
MBA Research Project
Researcher : Jeremiah Makhomu (031 365 7037)/(082 937 4595)
Supervisor : Danny L. McCabe (031-764 5939)/(082 567 8998)
Research Office : Tel : 031 - 260 1553
Dear Respondent,
I, Jeremiah Makhomu, an MBA student at the Graduate School of Business of the University of
Kwazulu Natal, invite you to participate in a research project entitled Lean Manufacturing (LM)
implementation: A perspective of key success factors.
The aim of this study is to understand both from management’s and employees’ perspective the
relative importance of some of the key success factors to successfully implement lean principles by
SA companies specifically in the Kwazulu-Natal province.
Through your participation I hope to understand more about factors that are considered both by
management and employees to be of importance for an organisation to successfully implement LM
principles. The results of the research are intended to benefit organisations that intend to implement
Lean principles to have insight on some of the key variables they could focus on. Similarly for
organisations that are experiencing difficulties in successfully implementing lean principles they
could refresh their approach as guided by the findings of this research.
Your participation in this project is voluntary. You may refuse to participate or withdraw from the
project at any time with no negative consequence. There will be no monetary gain from participating
in this survey/focus group. Confidentiality and anonymity of records identifying you as a participant
will be maintained by the Graduate School of Business, UKZN.
If you have any questions or concerns about completing the questionnaire or about participating in
this study, you may contact me or my supervisor at the numbers listed above.
The survey should take you about 5 minutes to complete. I hope you will take the time to complete
this survey.
Sincerely
Jeremiah Makhomu

APPENDIX 3
83
PART 1: PERMISSION TO USE MY RESPONSES FOR ACADEMIC RESEARCH
I hereby give Mr. KJ Makhomu permission to use my responses for academic purpose towards his
MBA dissertation, provided that my identity or the identity of this company is not revealed in any
way in the published records of the research.
Initials and Surname:
Postal Address:
Contact numbers:
Signature : Date:
PART 2 : GENERAL QUESTIONS
Note to the respondent
Please select your answer (s) by placing an X in the box
Please answer the questions as truthfully as you can
What you say in this questionnaire will remain confidential
1. Age group:
<25
25 -34
35-44
45-55
>55
2. Race:
Black
Coloured
Indian
White
Other, please specify

APPENDIX 3
84
3. Gender:
Male
Female
4. Employment status:
Senior Management
Middle management
Junior Management (supervisory)
Non-management
5. The following tools of lean principles have been implemented in our organisation:
(Cross as many as applicable)
5S
Kanban
Kaizen
Focussed (Continuous) Improvement
Autonomous maintenance
Preventative maintenance
Other, please specify
6. I have received training on the following lean tools
(Cross as many as applicable)
5S
Kanban
Kaizen
Focussed (Continuous) Improvement
Autonomous maintenance
Preventative maintenance
Other, please specify

APPENDIX 3
85
7. I believe the implementation of lean tools in my organisation has added value to the
organisation
(Cross only one)
Strongly agree
Agree
Not sure
Disagree
Strongly disagree
8. The implementation of lean tools has improved the way I do my job
(Cross only one)
Strongly agree
Agree
Not sure
Disagree
Strongly disagree
9. In my view the most important aspect to successfully implement lean principles is:
(Cross only one)
Training
Communication
Management commitment
Union-management relationship
Thank you for helping me with this survey.

APPENDIX 4


