
Lecture # 02-aLecture # 02-a
Introduction (cont.)Introduction (cont.)
Lecturer: Martin ParedesLecturer: Martin Paredes
2
1. Microeconomic Modeling
• Elements of models
• Solving the models
2. The Limits of Microeconomic Analysis
3
All microeconomic models rely on three analytical tools: Constrained optimisation Equilibrium analysis Comparative statics

4
Constrained optimisation problems usually have two parts: Objective function A set of constrains

5
Definition: The Objective Function specifies what the agent cares about and wants to optimize
Examples: • A consumer cares about maximizing his
satisfaction• The manager cares about:
• Raising profits• Reducing costs• Increasing “power”
6
Definition: Limits placed on the resources available to the agent
Examples:• The manager’s budget is €1M• The consumer’s income is €3000
7
The behavior of an agent can be modeled asoptimizing the objective function, subject to hisvarious constraints.
8
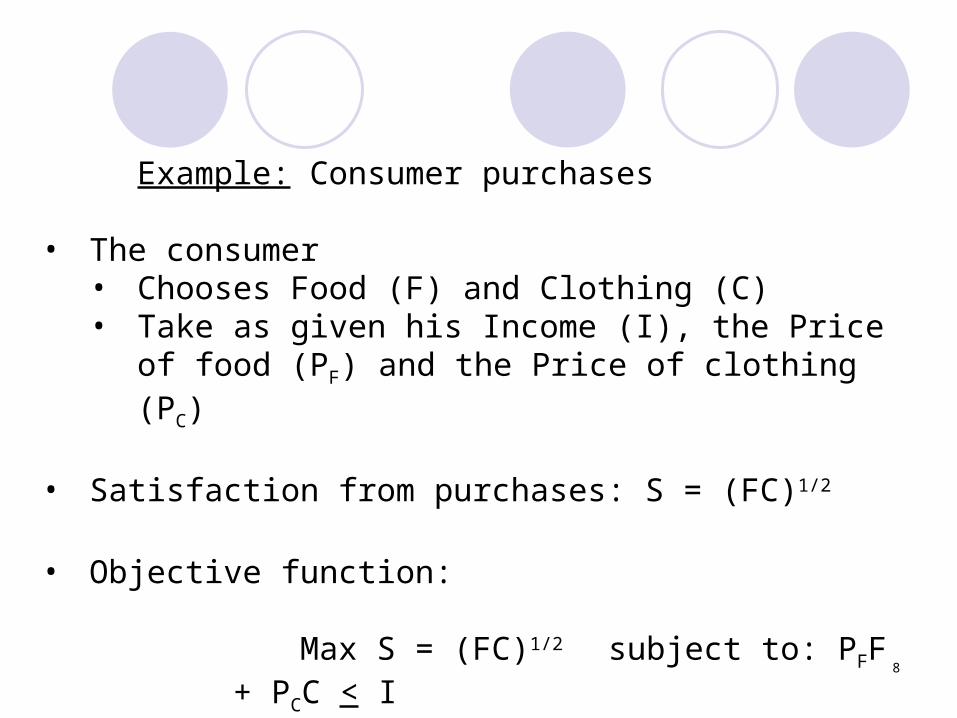
Example: Consumer purchases
• The consumer• Chooses Food (F) and Clothing (C)• Take as given his Income (I), the Price of food
(PF) and the Price of clothing (PC)
• Satisfaction from purchases: S = (FC)1/2
• Objective function:
Max S = (FC)1/2 subject to: PFF + PCC < I
(F,C)
9
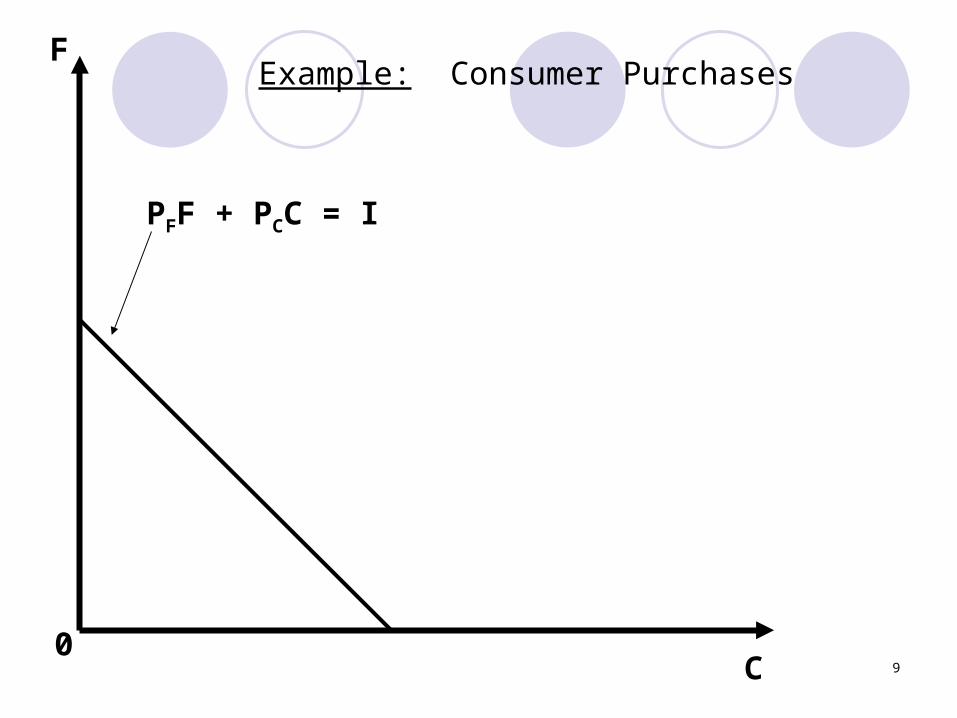
Example: Consumer Purchases
PFF + PCC = I
F
C0
10
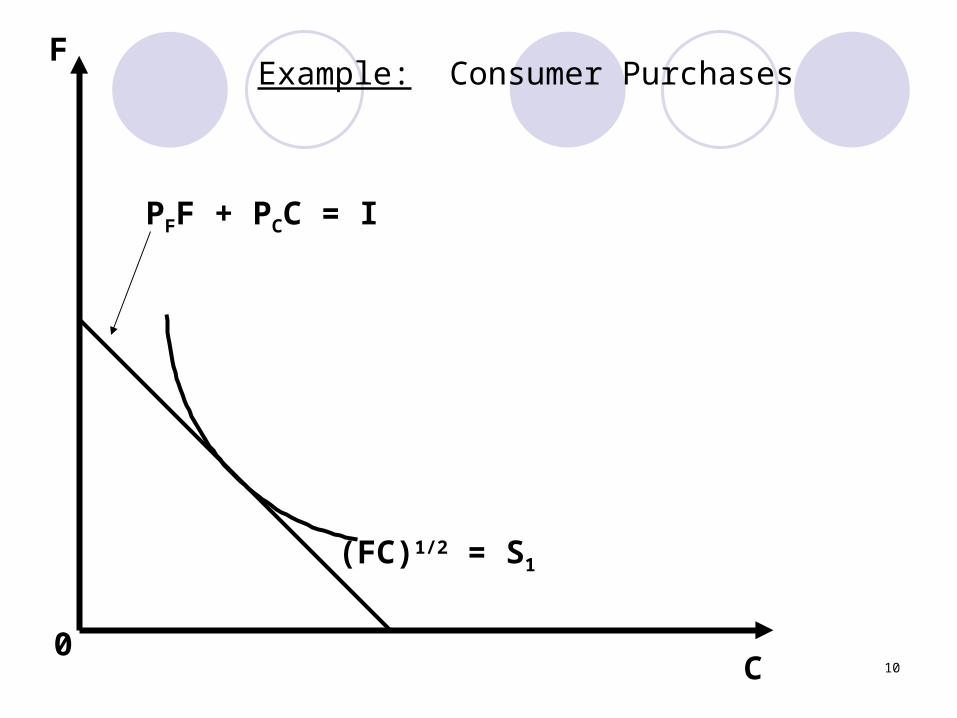
Example: Consumer Purchases
(FC)1/2 = S1
PFF + PCC = I
F
C0

11
Example: Consumer Purchases
(FC)1/2 = S1
(FC)1/2 = S0
PFF + PCC = I
F
C0
12
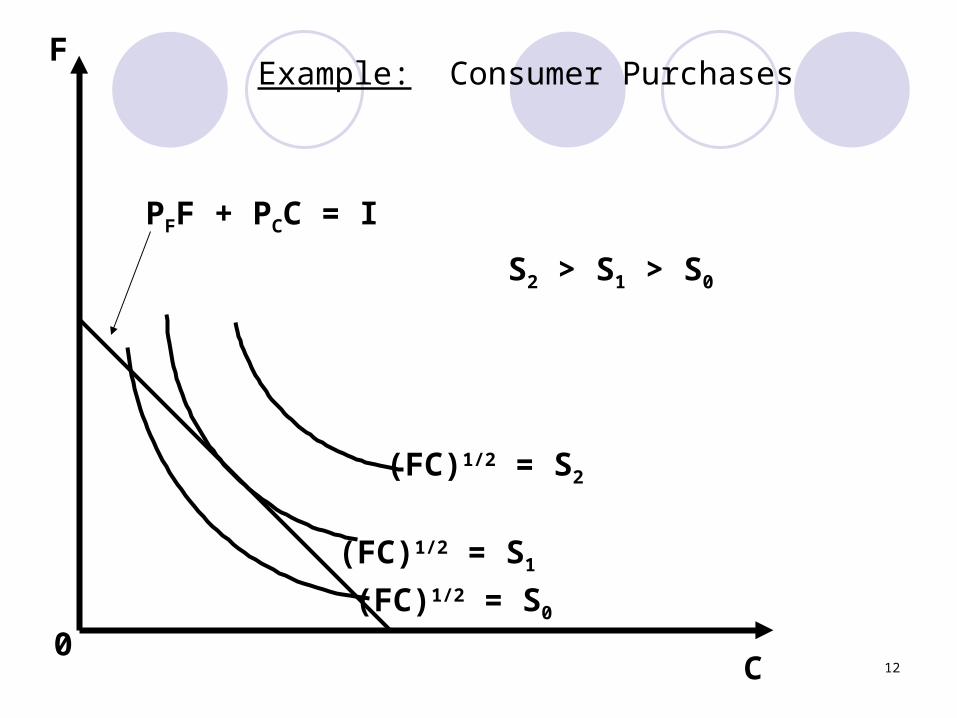
Example: Consumer Purchases
(FC)1/2 = S1
(FC)1/2 = S2
PFF + PCC = I
F
C0
S2 > S1 > S0
(FC)1/2 = S0

13
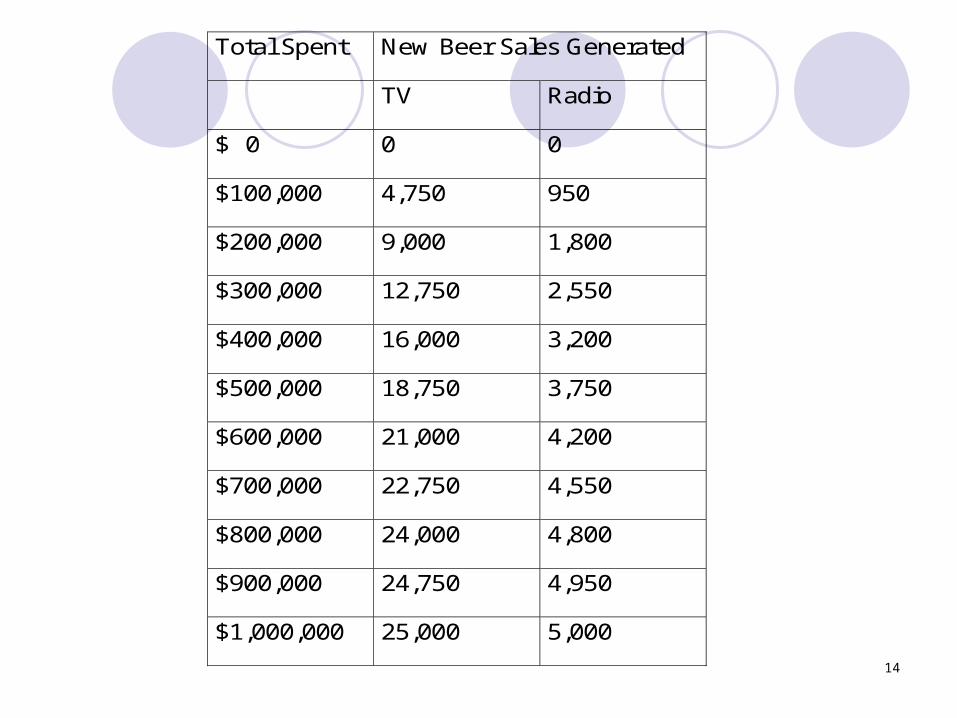
Another Example: Advertising Spots
Suppose the manager of a beer company wants to decide the firm’s advertising spots.
Budget = €1m to allocate between TV ( T ) and radio ( R )
Problem: Max B(T,R) (T,R)
subject to: pTT + pRR < €1m
where: B is "barrels“ and pT, pR are the prices of TV and radio advertising, respectively.
14
Total Spent New Beer Sales Generated
TV Radio
$ 0 0 0
$100,000 4,750 950
$200,000 9,000 1,800
$300,000 12,750 2,550
$400,000 16,000 3,200
$500,000 18,750 3,750
$600,000 21,000 4,200
$700,000 22,750 4,550
$800,000 24,000 4,800
$900,000 24,750 4,950
$1,000,000 25,000 5,000
15
Definition: Equilibrium is a state that will continue indefinitely as long
as the exogenous factors remain unchanged.

16
Example: The Market for Coffee BeansPrice per pound
Quantity, pounds
Supply (P,W)
Q*
17
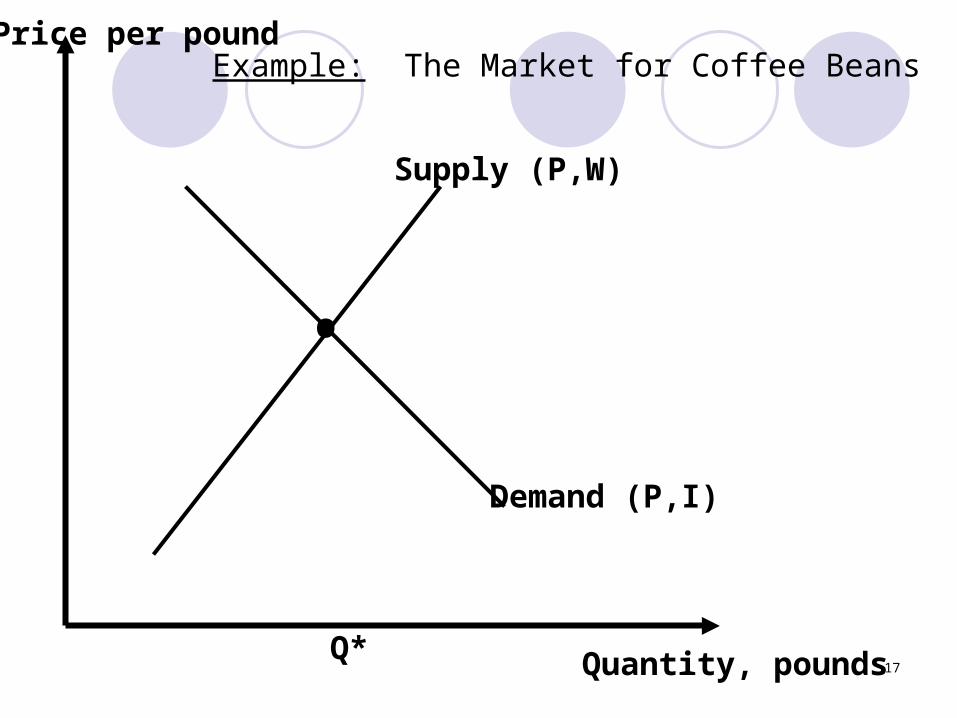
Example: The Market for Coffee BeansPrice per pound
Quantity, pounds
Supply (P,W)
Demand (P,I)
•
Q*

18
Example: The Market for Coffee BeansPrice per pound
Quantity, pounds
Supply (P,W)
Demand (P,I)
•
Q*
P*

19
Definition: In this example, Equilibrium is defined as the point where demand equals supply in this market
(i.e., the point where the demand and supply curves cross)
20
Definition: A comparative statics analysis compares the equilibrium state of a system
before a change in the exogenous variables to the equilibrium state after the change.
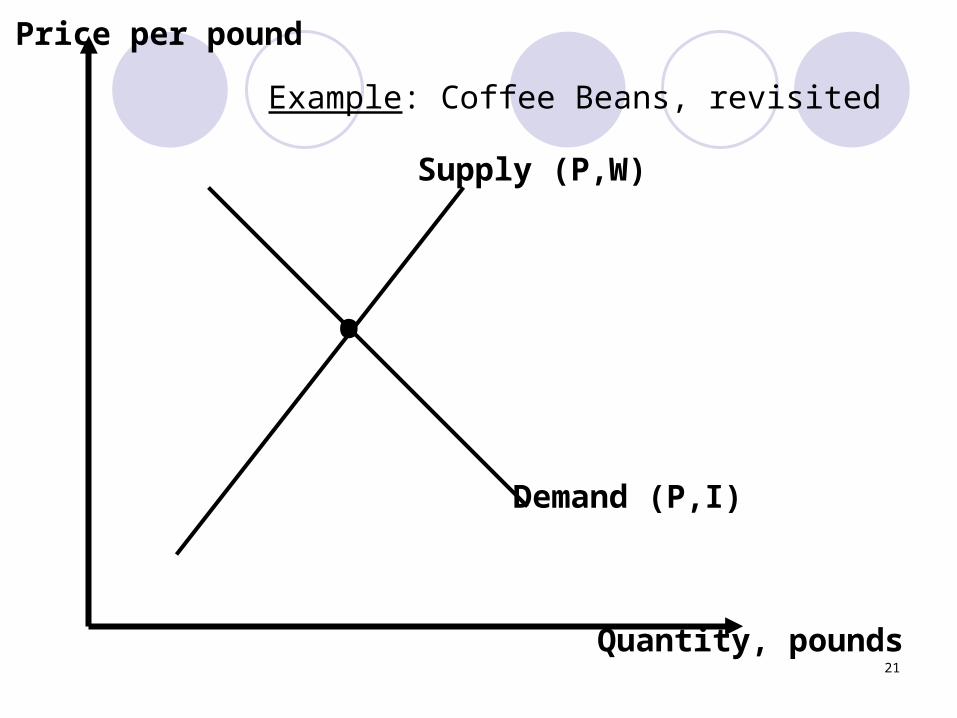
21
Price per pound
Quantity, pounds
Supply (P,W)
Demand (P,I)
•
Example: Coffee Beans, revisited
22
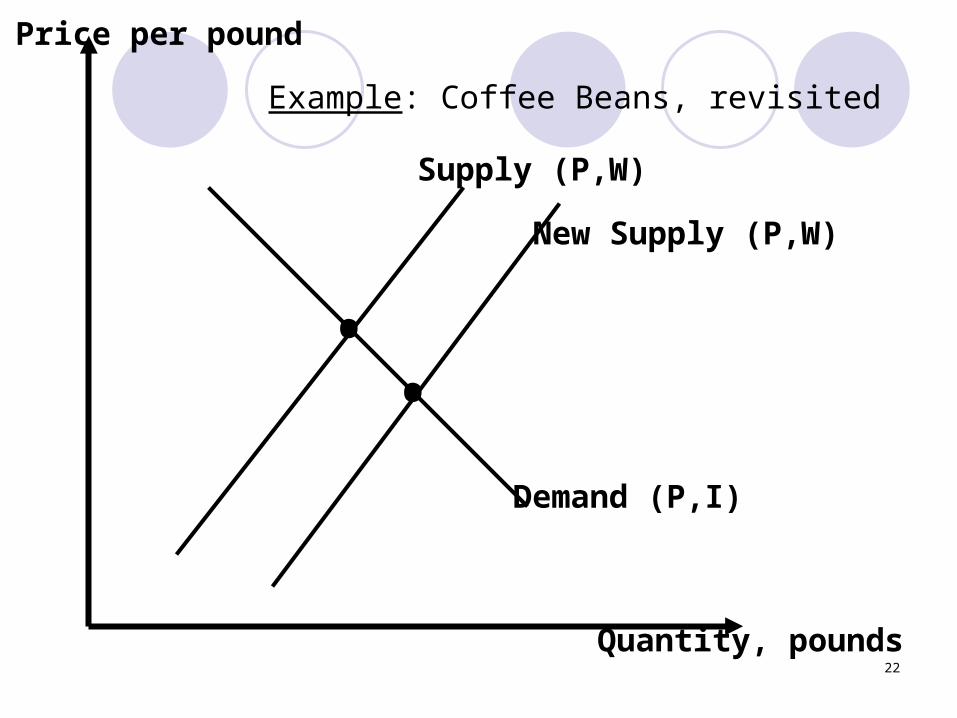
Example: Coffee Beans, revisited
Price per pound
Quantity, pounds
Supply (P,W)
Demand (P,I)
•
New Supply (P,W)
•
23
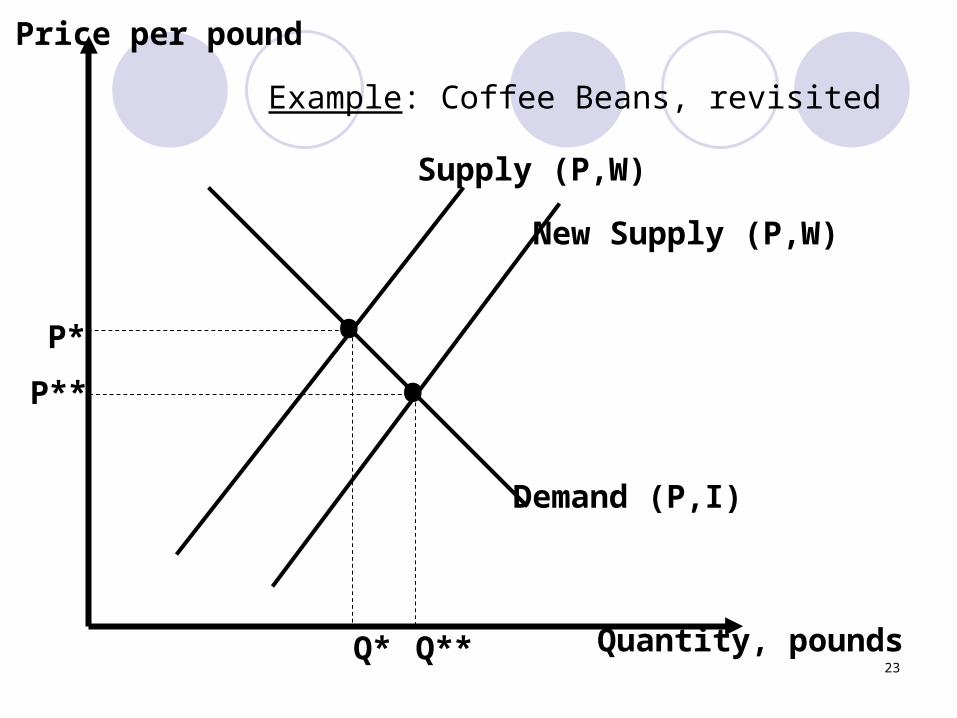
Price per pound
Quantity, pounds
Supply (P,W)
Demand (P,I)
•
Q*
P*
New Supply (P,W)
•
Q**
P**
Example: Coffee Beans, revisited
24
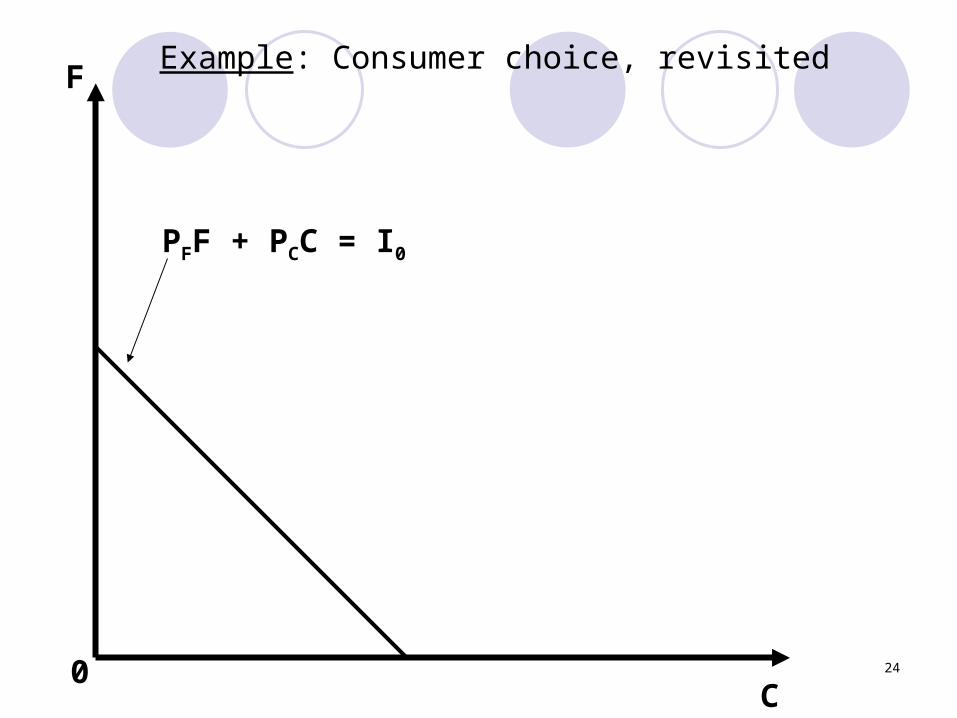
Example: Consumer choice, revisited
PFF + PCC = I0
F
C0

25
(FC)1/2 = S0
PFF + PCC = I0
F
C0
•
C** C*
Example: Consumer choice, revisited
26
(FC)1/2 = S0
PFF + PCC = I0
F
C0
••
PFF + PCC = I1
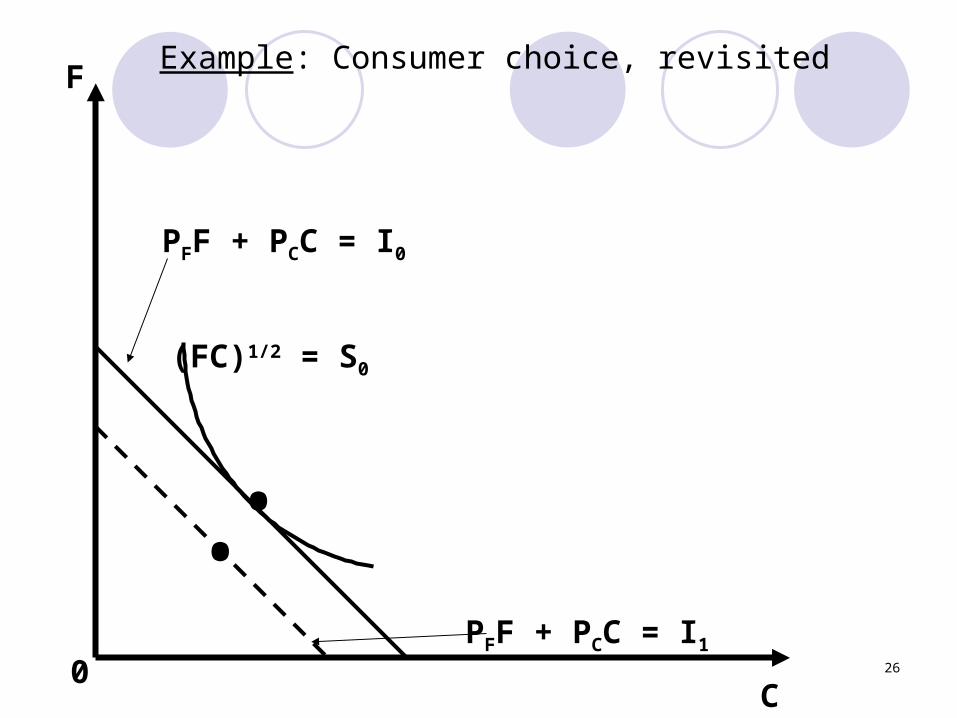
Example: Consumer choice, revisited

27
(FC)1/2 = S0
(FC)1/2 = S1
PFF + PCC = I0
F
C0
••
PFF + PCC = I1
Example: Consumer choice, revisited
28
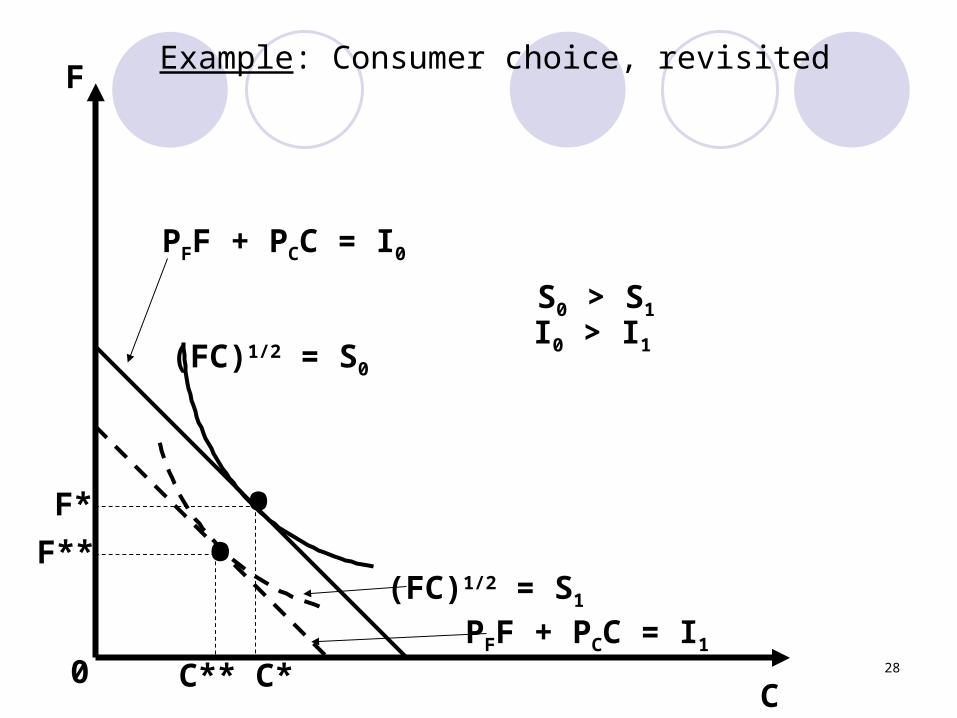
(FC)1/2 = S0
(FC)1/2 = S1
PFF + PCC = I0
F
C0
S0 > S1
••
C** C*
F*
F**
PFF + PCC = I1
I0 > I1
Example: Consumer choice, revisited

29
Definition: Positive Analysis• Can explain what has happened due to
an economic policy, or• Can predict what might happen due to
an economic policy.
Definition: Normative analysis is an analysis of what should be done
30
Examples:
• “Should we increase income equality rather than focus on economic efficiency?”
• “Should we impose a progressive income tax or a sales tax to increase income equality?”
• “Will a progressive income tax reduce aggregate hours worked?”


