
Lecture 18Lecture 18
Metals and migration through ground water systemsMetals and migration through ground water systems
1. Radioactive
2. Heavy Metal Contamination, i.e.. Pb, Hg, Cd - inorganic but toxic to mammalian life.
Factors:
Mobility in aqueous environments i.e. ground water, lakes, rivers, estuaries.– Solubility of Metal M 2+
– Adsorption on clays or organic Carbon.
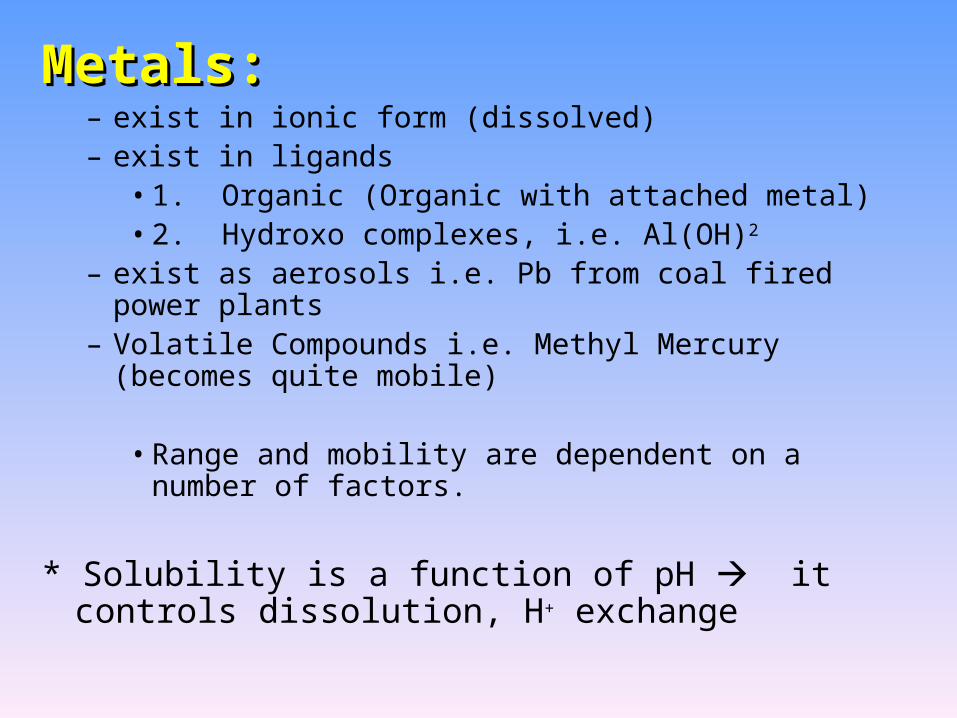
Metals:Metals: – exist in ionic form (dissolved)– exist in ligands
• 1. Organic (Organic with attached metal) • 2. Hydroxo complexes, i.e. Al(OH)2
– exist as aerosols i.e. Pb from coal fired power plants– Volatile Compounds i.e. Methyl Mercury (becomes quite
mobile)
• Range and mobility are dependent on a number of factors.
* Solubility is a function of pH it controls dissolution, H+ exchange
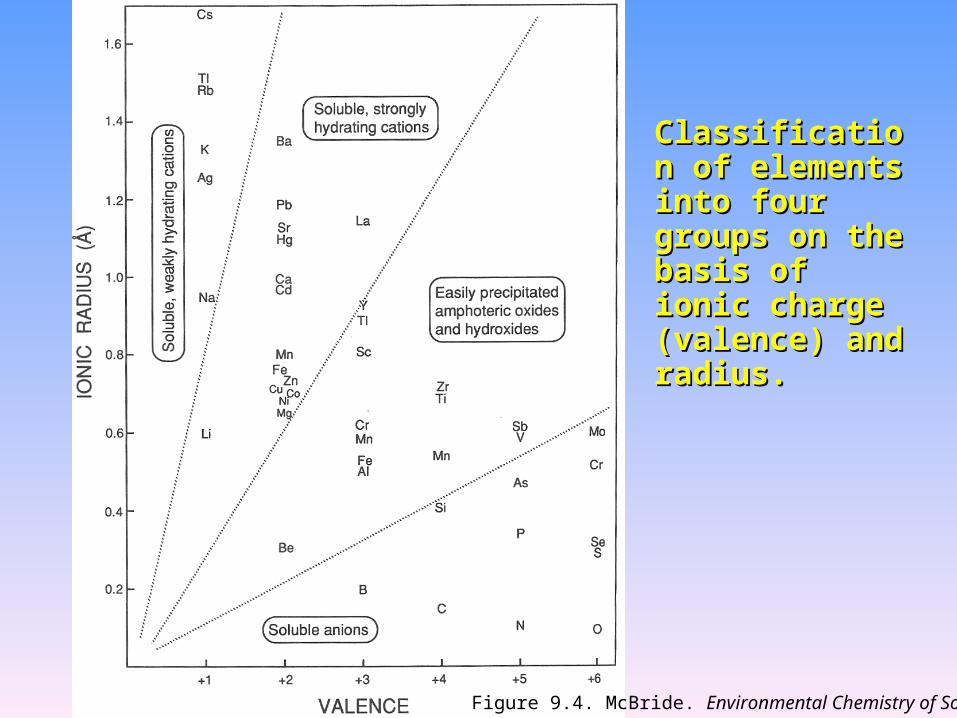
Classification of Classification of elements into elements into four groups on four groups on the basis of ionic the basis of ionic charge (valence) charge (valence) and radius.and radius.
Figure 9.4. McBride. Environmental Chemistry of Soils
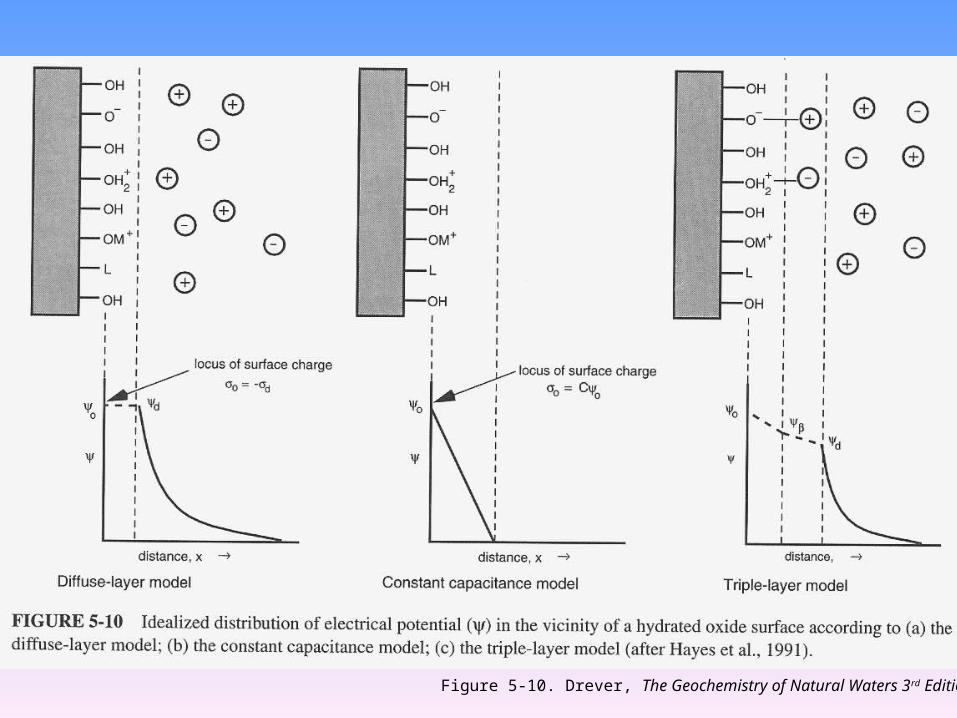
Figure 5-10. Drever, The Geochemistry of Natural Waters 3rd Edition

Schematic representation of inner-sphere (phosphate, fluoride, copper) and outer-sphere (sodium, chloride) complexes. The labels on the layers correspond to the triple-layer model (after Stumm, 1992)
Figure 5-7. Drever, The Geochemistry of Natural Waters 3rd Edition
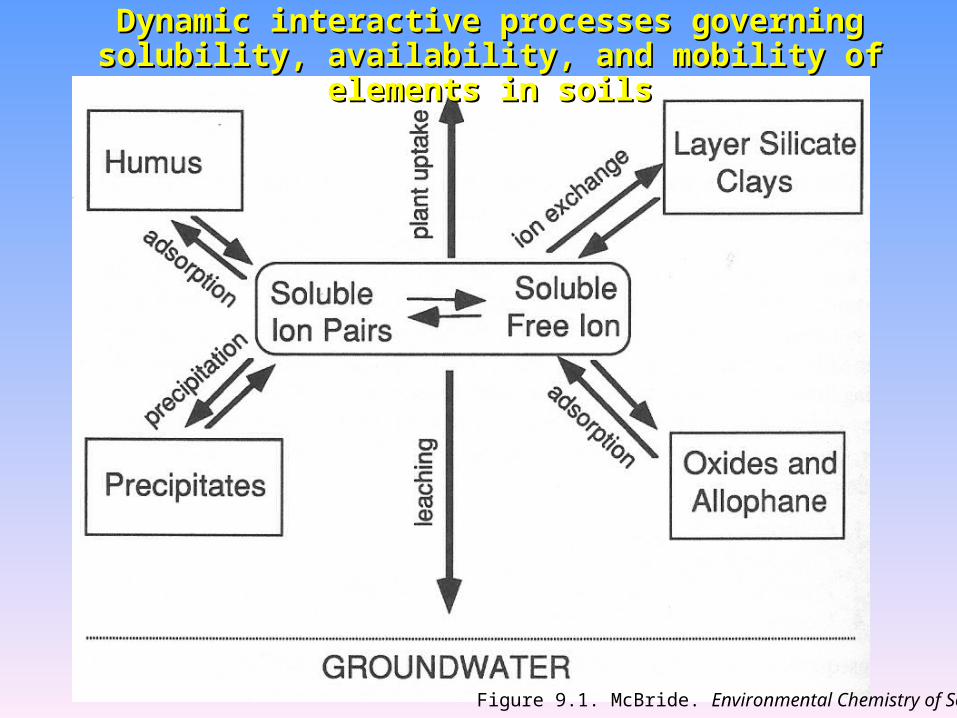
Dynamic interactive processes governing solubility, Dynamic interactive processes governing solubility, availability, and mobility of elements in soilsavailability, and mobility of elements in soils
Figure 9.1. McBride. Environmental Chemistry of Soils

Adsorption of metal cations on hydrous Adsorption of metal cations on hydrous ferric oxide as a function of pHferric oxide as a function of pH
Figure 5-8. Drever, The Geochemistry of Natural Waters 3rd Edition

Adsorption of selected anions on hydrous Adsorption of selected anions on hydrous ferric oxide as a function of pHferric oxide as a function of pH
Figure 5-9. Drever, The Geochemistry of Natural Waters 3rd Edition

Relative Retention of some metals on goethiteRelative Retention of some metals on goethite
Figure 2. L.J. Evans, 1989

Dissolution of some metal hydroxides as a function of pHDissolution of some metal hydroxides as a function of pH
Figure 3. L.J. Evans. “Chemistry of metal retention by soils” 1989

Dissolution of some metal carbonates a s a function of pHDissolution of some metal carbonates a s a function of pH
Figure 5. L.J. Evans. “Chemistry of metal retention by soils” 1989
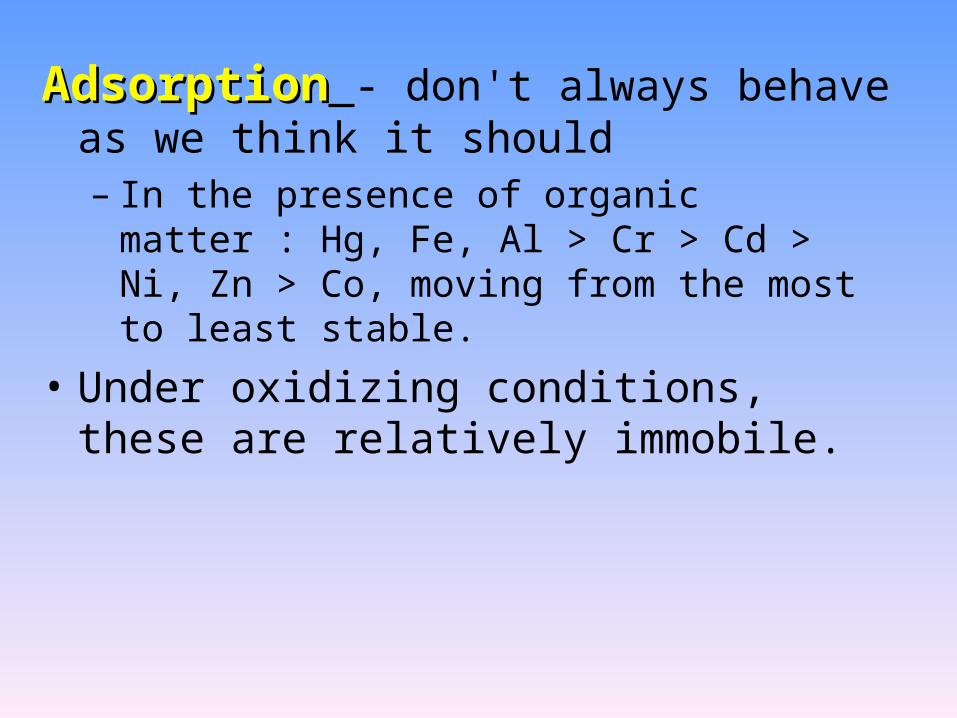
AdsorptionAdsorption - don't always behave as we think it should– In the presence of organic matter : Hg, Fe, Al >
Cr > Cd > Ni, Zn > Co, moving from the most to least stable.
• Under oxidizing conditions, these are relatively immobile.

RadioactiveRadioactive– 60Co, 90Sr, 137Cs are all radioactive and are all
related to nuclear weapon production (Co is a transition metal, while Sr is an alkali earth metal, and Cs is an alkali metal). These metals have the ability to be strongly adsorbed- even in stream conditions.
* Oak Ridge Natural Labs release a high amount of these contaminants
Found that there were only traces of the contaminant every so often in the stream - occasional spikes.
* Behave as ”time release capsules” - even after input has stopped radionuclides are slowly released from sediments by equilibrium desorption

Testing the ground water proved it to be contaminated, however, downstream was showing relatively clean water. The contaminant had easily adsorbed onto the surfaces of the grains, even upon introduction to the stream. Th spikes would show occasional leakages of this.
Strongly adsorbed onto the surfaces in the stream- inorganic adsorption.– It is hard to remediate because of this– However, the half-life of these are on the
order of 30 years- this may have time to degrade by the time the contaminant is able to move offsite.

Metal speciation and extent of dissolution
(a) Amorphous Fe-hydroxide
Figure 4(b). L.J. Evans. “Chemistry of metal retention by soils” 1989

Red-Ox (Reduction- Oxidation) Reactions
EH (or pe = electron activity) is a way to represent the oxidation or reduction potential of a given environment.– Mn, Fe can exist in many different valence
states– Fe0, Fe2+, Fe3+ in FeO(OH), Fe2+S, Fe2+O, etc.

Equivalence between electric energy and heat1 Joule = 1 volt Coulomb1 Watt = 1 Joule/second = 1 Amp*(volt)(1 mole of e-)(1 volt) = 9.65 x 10⁴ Joules = F (Faraday's number)
G = -q F EH Cu2+ + Fe Fe2+ + Cu EHo = +.78 v
This is the result of 2 half reactions:
Cu2+ + 2e- Cu EH = .34 v
Fe2+ + 2e- Fe EH = -.44 v
EH = Vcathode - Vanode + .78 • All referenced to Hydrogen electrode• Tabulated with e- on the left.• pe (electron activity) minus log concentration of
electrons
• pe = (16.8)EH pe = (F /2.303RT)EH
• Relates Electrode potential to “moles of electrons

The standard hydrogen electrode
Redox cell
Figure 7-1. Drever, The Geochemistry of Natural Waters 3rd Edition
Figure 7-2. Drever, The Geochemistry of Natural Waters 3rd Edition

Standard-State Reduction Potentials of Half-Reactions Involving Important Elements in Soils
Table 7.1 McBride. Environmental Chemistry of Soils, 1994.

How does this variation exist in natural waters?How does this variation exist in natural waters?
2H+ + 2e- H2(g)
O2(g) + 4H+ + 4e- 2H2O(l)
These two reactions are never spontaneous in natural systems (although the same results can be found with different reactions). They set the boundary limits. They should also be a function of pH
EH = EHo - 0.059 pH

2Fe3O4 + 1/2 O2 3Fe2O3
2Fe3O4 + H2O 3Fe2O3 + 2H+ + 2e-
• The 2e- represents the net result of 2Fe2+ 2Fe3+ + 2e- where oxidation of iron releases electrons.
* This is different from acid/base reactions valence state of metal will show how oxidizing or reducing the environment is.
McBride. Environmental Chemistry of Soils, 1994.

Drever, The Geochemistry of Natural Waters 3rd Edition


The relationship of redox potential Eh, to pH for important half-cell reactions in water. The bold broken lines demote that Eh at which water is oxidized to O2 (upper line) or reduced to H2 (lower line).
Figure 7.1 McBride. Environmental Chemistry of Soils, 1994

Fence DiagramsFence Diagrams
Drever, The Geochemistry of Natural Waters 3rd Edition
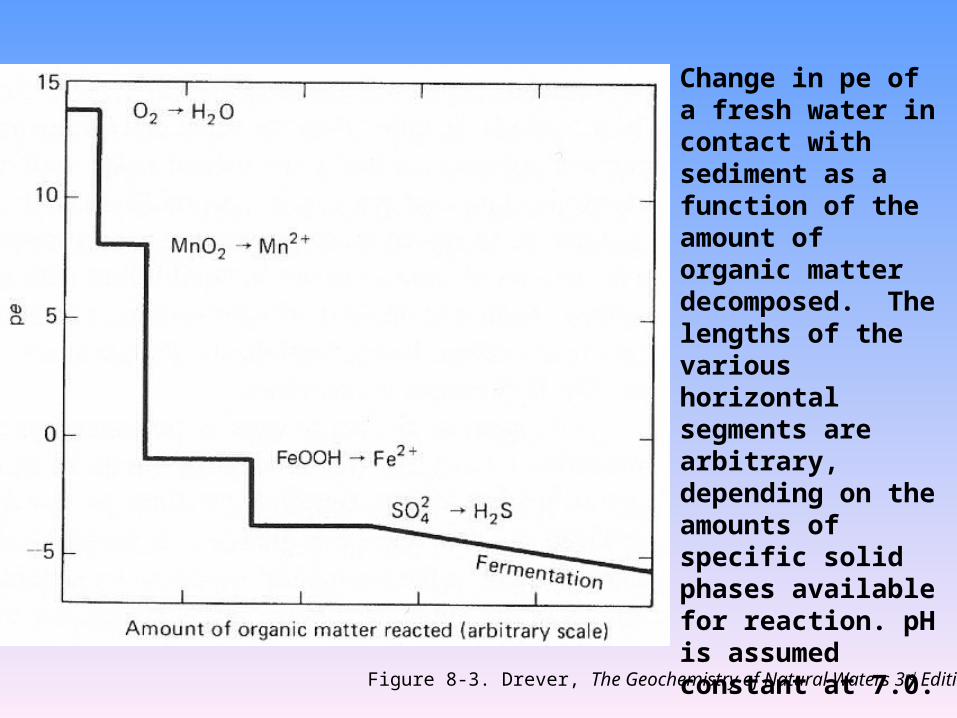
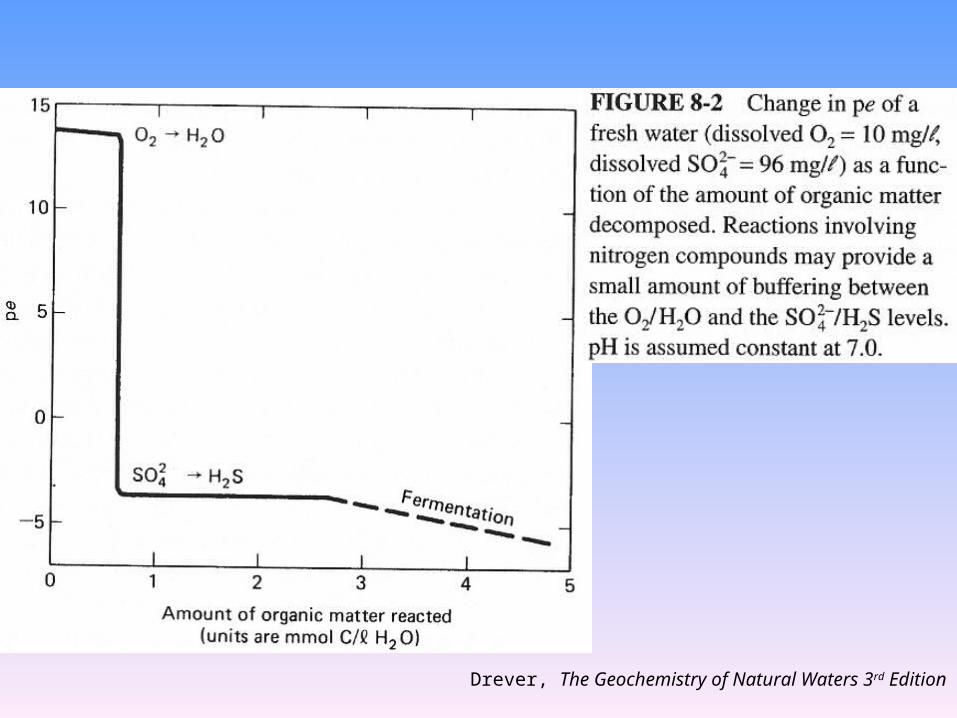
Change in pe of a fresh water in contact with sediment as a function of the amount of organic matter decomposed. The lengths of the various horizontal segments are arbitrary, depending on the amounts of specific solid phases available for reaction. pH is assumed constant at 7.0.
Figure 8-3. Drever, The Geochemistry of Natural Waters 3rd Edition

The reduction and oxidation sequence in soil solutions at pH 7
McBride. Environmental Chemistry of Soils, 1994
Drever, The Geochemistry of Natural Waters 3rd Edition

Schematic description of ferrolysis in Schematic description of ferrolysis in a soil with a perched water tablea soil with a perched water table
Figure 7.10 McBride. Environmental Chemistry of Soils, 1994
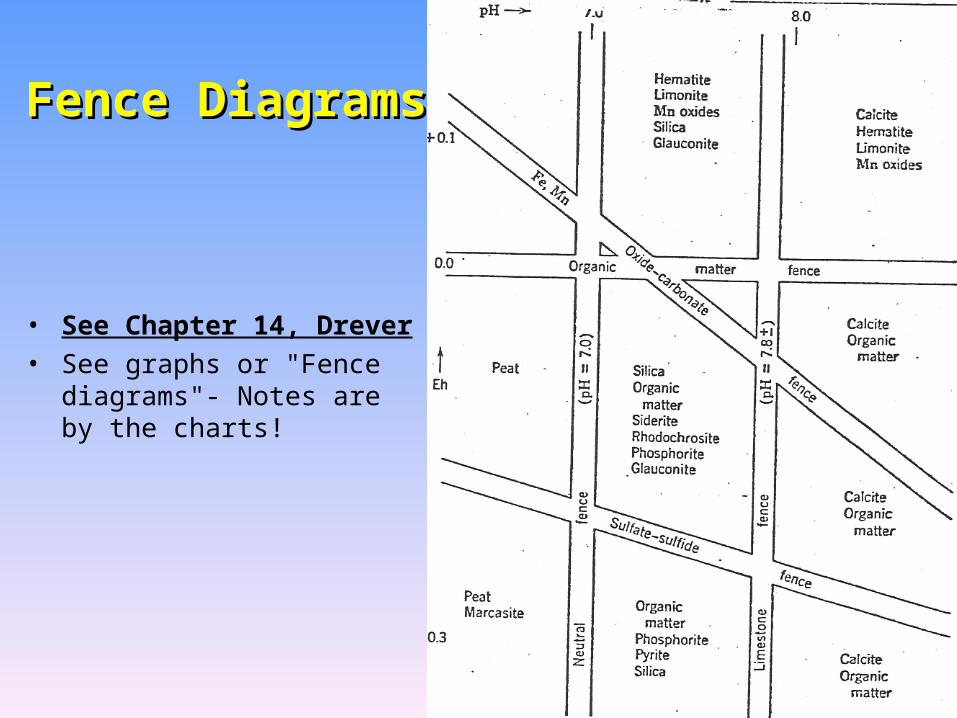
• See Chapter 14, Drever• See graphs or "Fence
diagrams"- Notes are by the charts!
Fence DiagramsFence Diagrams

In Summary:In Summary:– Red-Ox conditions in natural water– oxygen supply from atmosphere– supply versus consumption determines what
oxidation state the environment is in– Other control of red-ox conditions in water such
as reduction of ferric hydroxide• May form FeS, Mn which can act an inorganic
buffers of reduction state.
– Flow length or time of flow is important.

Lecture 19Lecture 19
Heavy MetalsHeavy Metals
http://www.epa.gov/seahome/child/mercury/merc_m.htm
Mercury

Drinking Water Standards for Heavy Metals
Tables 9-1,2. Baird, Environmental Chemistry, 1995
Densities of Some Important Heavy Metals and Important Substances
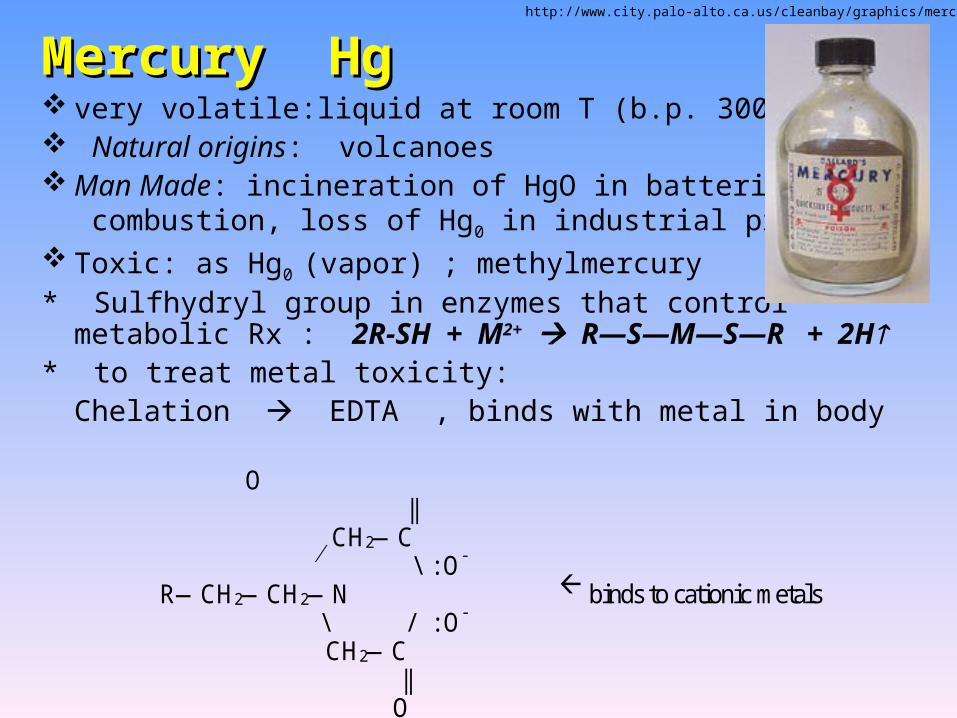
Mercury HgMercury Hg very volatile:liquid at room T (b.p. 300oC) Natural origins: volcanoes Man Made: incineration of HgO in batteries, coal
combustion, loss of Hg0 in industrial processes Toxic: as Hg0 (vapor) ; methylmercury* Sulfhydryl group in enzymes that control metabolic Rx :
2R-SH + M2+ R—S—M—S—R + 2H* to treat metal toxicity:
Chelation EDTA , binds with metal in body O || CH2—C \ : O- R—CH2—CH2—N binds to cationic metals
\ / : O- CH2—C || O
http://www.city.palo-alto.ca.us/cleanbay/graphics/mercury.jpg
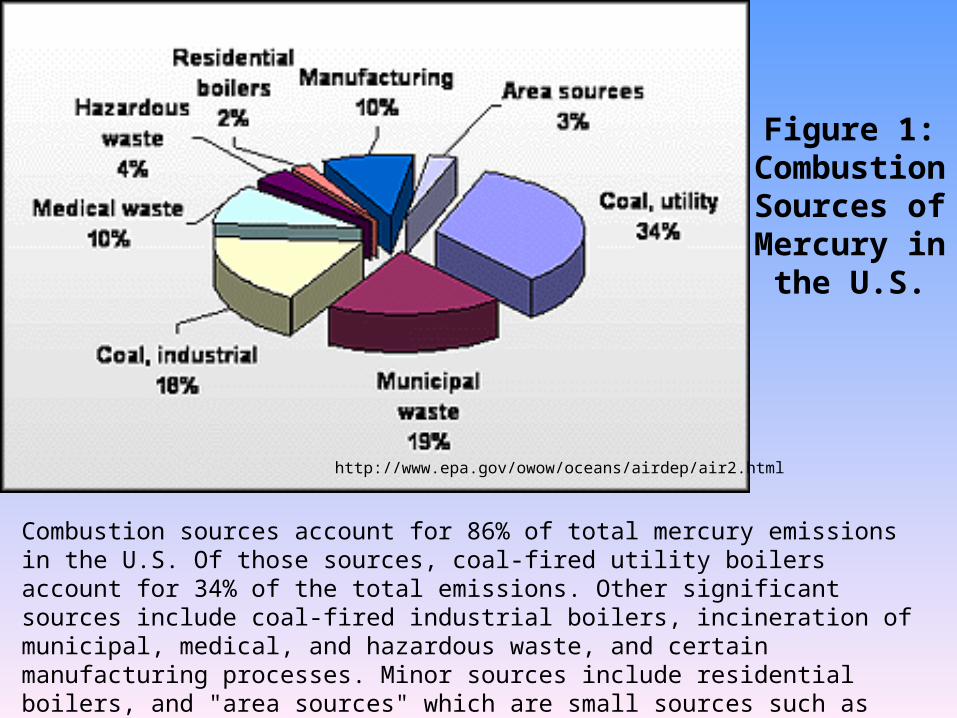
Combustion sources account for 86% of total mercury emissions in the U.S. Of those sources, coal-fired utility boilers account for 34% of the total emissions. Other significant sources include coal-fired industrial boilers, incineration of municipal, medical, and hazardous waste, and certain manufacturing processes. Minor sources include residential boilers, and "area sources" which are small sources such as laboratory and home products (see Mercury Study Report to Congress 1997).
Figure 1: Combustion Sources of Mercury in
the U.S.
http://www.epa.gov/owow/oceans/airdep/air2.html
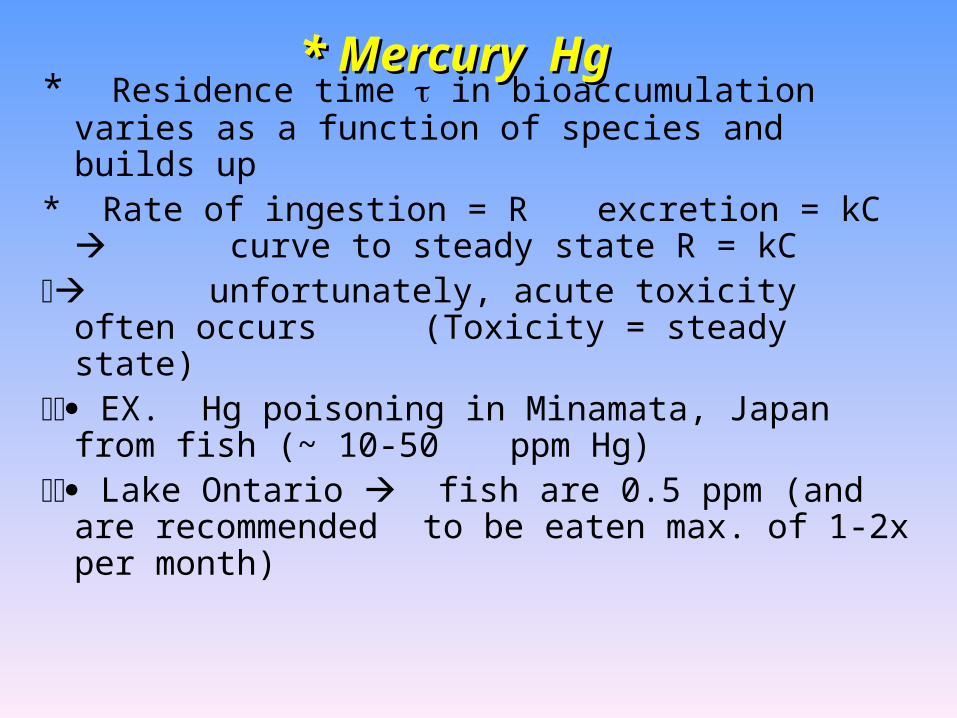
* Mercury Hg* Mercury Hg* Residence time in bioaccumulation varies as a
function of species and builds up* Rate of ingestion = R excretion = kC
curve to steady state R = kC unfortunately, acute toxicity often occurs
(Toxicity = steady state) EX. Hg poisoning in Minamata, Japan from fish
(~ 10-50 ppm Hg) Lake Ontario fish are 0.5 ppm (and are
recommended to be eaten max. of 1-2x per month)

Increase in mercury concentrations with time to steady-state level, Css
Baird, Environmental Chemistry, 1995
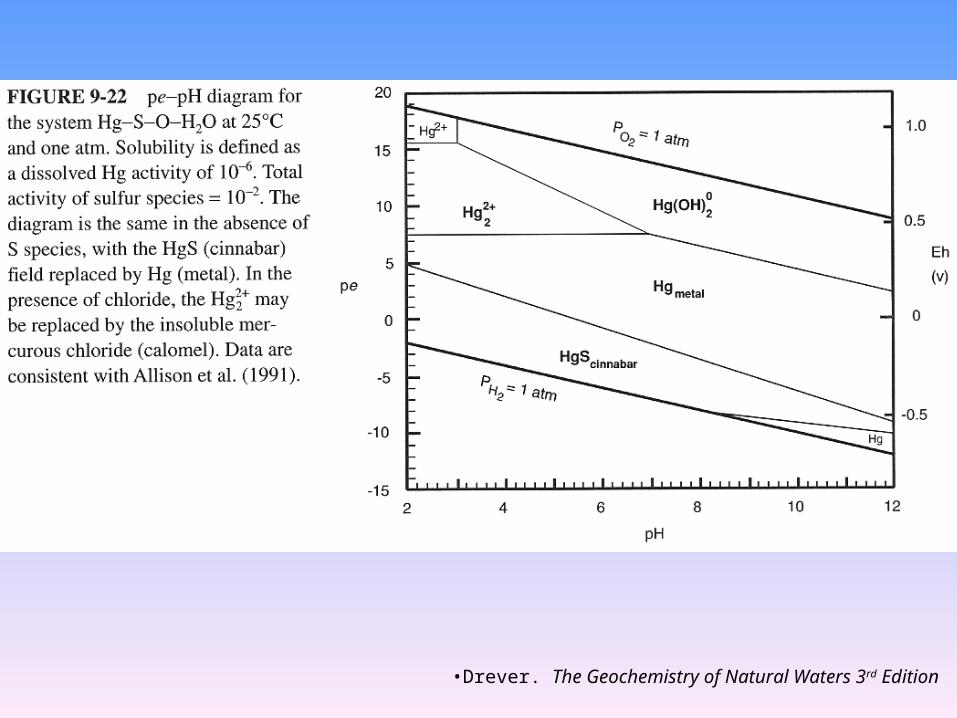
•Drever. The Geochemistry of Natural Waters 3rd Edition

•Sediment: Hg2+ , Hg -anaerobic bacteria methylate mercury CH3—Hg—CH3 = soluble in water, volatile, residence time) in body = 70 days
•methyl & phenyl mercury were once used as fungicide for pulp & paper, and seeds
The biogeochemical cycle of bacterial methylation and demethylation of mecury in sediments
•Figure 9-8. Baird, Environmental Chemistry, 1995
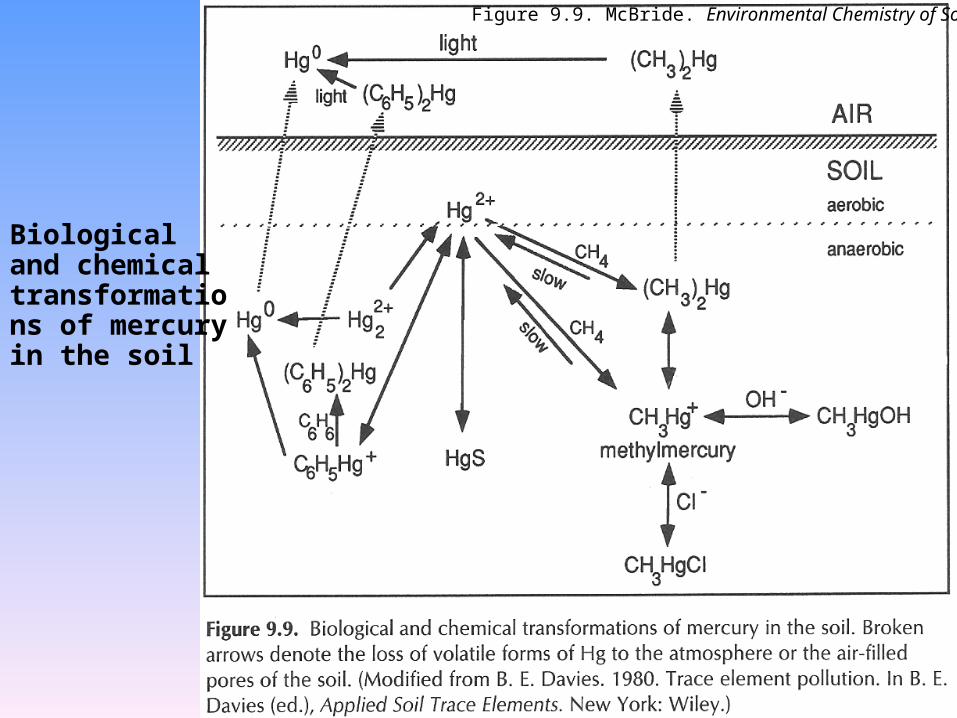
Biological and chemical transformations of mercury in the soil
Figure 9.9. McBride. Environmental Chemistry of Soils

Mercury pathways in aquatic systems
http://water.usgs.gov/pubs/circ/circ1215/major_findings.htm

http://www.ec.gc.ca/MERCURY/EN/bf.cfm

http://sofia.usgs.gov/sfrsf/rooms/acme_sics/acme/how.html
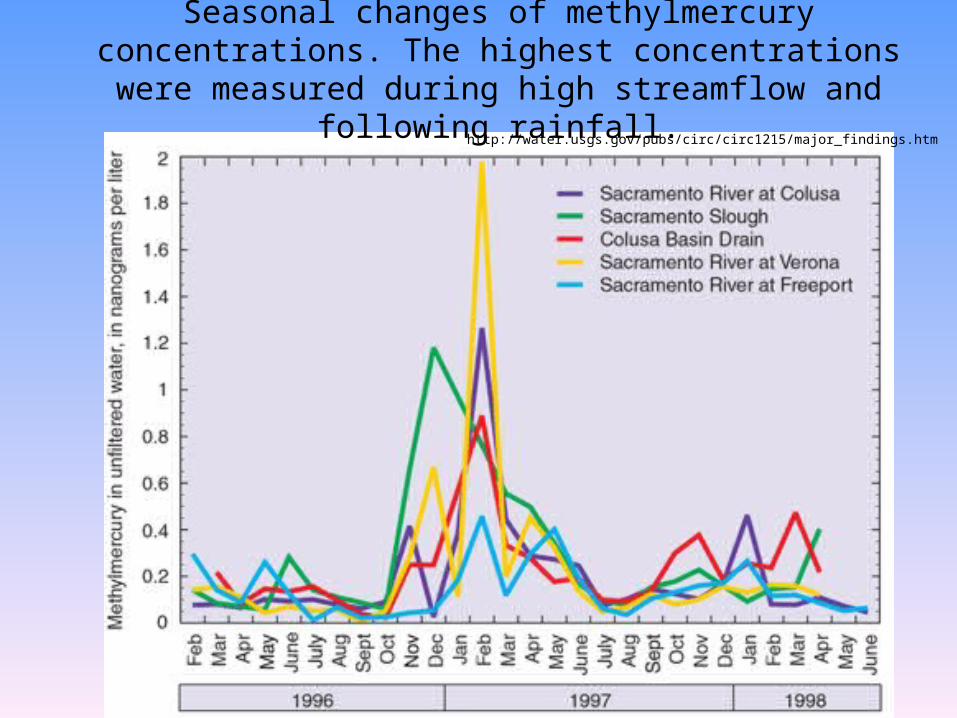
Seasonal changes of methylmercury concentrations. The highest concentrations were measured during high streamflow
and following rainfall.http://water.usgs.gov/pubs/circ/circ1215/major_findings.htm

Annual variation of mercury concentrations in walleye fish from Lake Saint Clair
Figure 9-2. Baird, Environmental Chemistry, 1995

Mercury and Methylmercury in
Water
Water, a more rapidly changing sample media, shows distinct
variations in time.
http://sofia.usgs.gov/sfrsf/rooms/acme_sics/acme/how.html
Mercury and Methylmercury in the South Florida Everglades
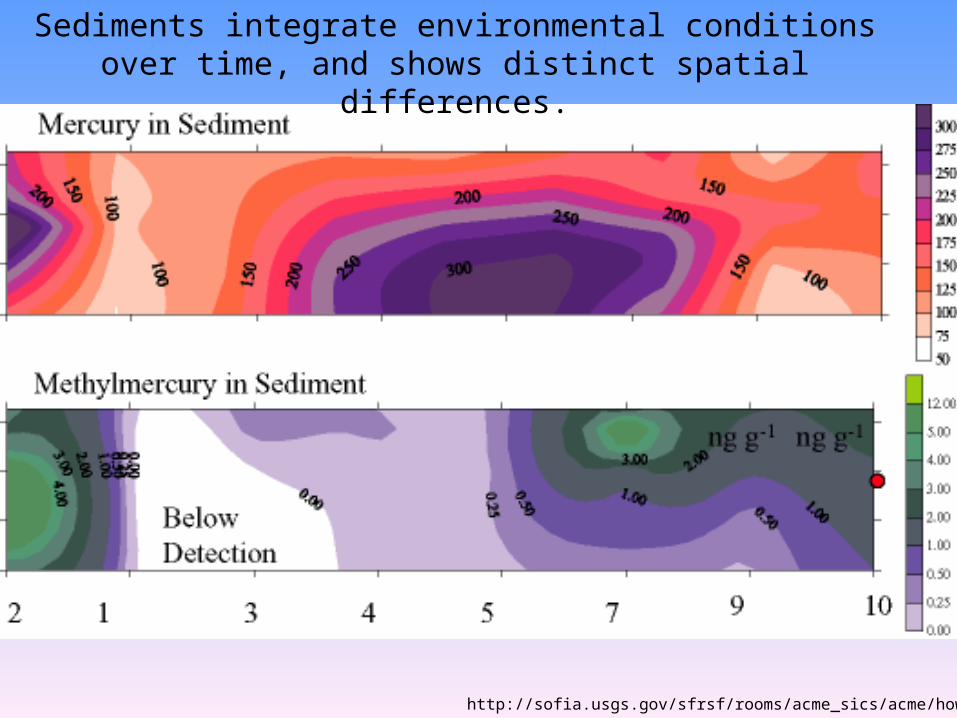
Sediments integrate environmental conditions over time, and shows distinct spatial differences.
http://sofia.usgs.gov/sfrsf/rooms/acme_sics/acme/how.html

Lead PbLead Pb low melting point: 327oC
Natural sources: formation in hydrothermal processes (with S source and high temperatures reducing environment)
Anthropogenic: paint, pipes, solder of Pb & Sn

Drever. The Geochemistry of Natural Waters 3rd Edition

The effect of prenatal exposure to lead upon the mental development of infants. Lead exposure is measured by its concentration in the blood of the umbilical cord. “Low” corresponds to <3 μg /dL, “medium” to an average of 6.7 μg/dL, and “high” to >10 μg/dL.
Figure 9-5. Baird, Environmental Chemistry, 1995
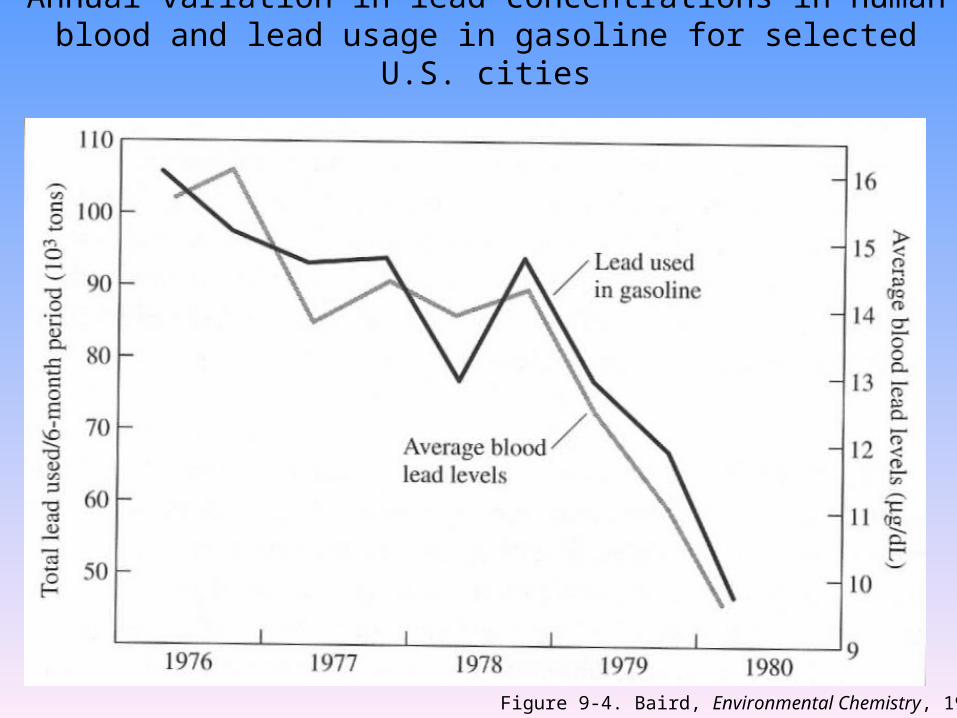
Annual variation in lead concentrations in human blood and lead usage in gasoline for selected U.S. cities
Figure 9-4. Baird, Environmental Chemistry, 1995
Forms:
* Pb2+, PbS (galena)
* Pb Pb2+ in solution
* Toxicity:
Ex. Tuna Fish Scare—lead is ubiquitous in the environment ( very easy to have lab contamination in measurements)

Lead PbLead PbEx. Tuna Fish Scare—
It was seen in the following concentrations:• 0.1-0.5ppm in the oceans & 0.5-1ppm in the cans.
Clair Patterson at Cal Tech, using very careful Pb-isotope analysis, measured:
Fresh tuna: 5-10 ppb ; can: 0.5-1ppm
HUGE DIFFERENCE
in new pressed cans, 50 ppb.
* Lead Sources :– Drinking water: Pb from solder in domestic plumbing &
Pb in distribution pipes• Pb2+ + CO3
2- PbCO3 under alkaline conditions
• 20 ppb maximum allowable limit.

Lead and mercury concentrations in the sediments of Halifax Harbor versus depth (and therefore year).
Figure 9-9. Baird, Environmental Chemistry, 1995

Diagnostic Tracers - Isotopic tracersDiagnostic Tracers - Isotopic tracers
Isotopic systems to trace metals. Lead is not only used in concentrations but has a more complex isotopic history. Used in nature or in the human body.
• 238U ---> 206Pb 4.5 billion year half-life• 235U ---> 207Pb 0.7 billion year half-life• 232Th ---> 208Pb 12 billion years

Diagnostic Tracers – Pb isotopesDiagnostic Tracers – Pb isotopes• Therefore, with different half-lives, there should be different
amounts of these lead isotopes with different times in history.• 206Pb/207Pb has moved from low to high through time.• Ratio of the radio-isotopes with a stable isotope 204Pb.• The ratio of 206Pb/204Pb was varied through time.• Mexico, Chile, Peru : 1.2, 1.3 = lead from young igneous
hydrothermal system less than 100 million years old.• Canada, Australia: .9, 1.1 = old system greater than 1 billion
year. Since these areas have characteristic lead isotope
concentrations, one can trace the source of pollution by finding out what the ratio of the isotopes of lead are

Diagnostic Tracers - by radioactive tracersIsotopic systems to trace metals.Lead is not only used in concentrations but has a more complex isotopic history. Used in nature or in the human body. 238U ---> 206Pb 4.5 billion year half-life235U ---> 207Pb 0.7 billion year half-life232Th ---> 208Pb 12 billion years Therefore, with different half-lives, there should be different amounts of these lead isotopes with different times in history. 206Pb/207Pb has moved from low to high through time.
Mexico, Chile, Peru : 1.2, 1.3 = lead from young igneous hydrothermal system less than 100 million years old.Canada, Australia: .9, 1.1 = old system greater than 1 billion year. Since these areas have characteristic lead isotope concentrations, one can trace the source of pollution by finding out what the ratio of the isotopes of lead are.


•Miss. Valley Sed. Pb paint
•Canadian “old” Pb
•Crustal Pb
•Smelter or
Gasoline Pb


Geochemical study of arsenic Geochemical study of arsenic release mechanisms in the release mechanisms in the Bengal Basin groundwaterBengal Basin groundwater
Carolyn B. Dowling, Robert J. Poreda, Asish R. Basu, and Scott L. Peters

Research Questions?
• Why do we care about Arsenic in groundwater?• Is it a problem in the Bengal Basin?• Which wells are contaminated by Arsenic?
– Where are the wells located? What are their depths?
• Does As correlate with other elements?• What are the sources of As?
– Sediments? Industrial pollution? Agricultural pollution?
• Why is it a problem in the Bengal Basin?
Some Answers
• Arsenic contamination is a real issue• Source is natural• Bulk sediments supplies As to the
groundwater– Microbial mediated reduction of iron oxy-
hydroxides – a.k.a. the microbial breakdown of FeOOH
Time Line
• World Health Organization (WHO) – Until 1970s, population used polluted rivers – Drilled 2 million groundwater wells
• Most wells are contaminated with arsenic (As)– Levels are greater than WHO maximum contaminant
level (MCL) of 0.01 ppm or 0.13 M– Symptoms of Arsenic poisoning develop slowly– 30-60% of the population is affected

Background
• Bangladesh and West Bengal State, India
• Quaternary deposits– Ganges-Brahmaputra
– Himalayas
• Sea level changes and river migration– Complex stratigraphy
of coarse and fine-grained sediment.
Brahmaputra
Ganges
India
(Modified from http://www.geoexplorer.co.uk)
Bangladesh
Himalayas^^^^^^^ ^^^^^^^^
Bay of Bengal

Sampling
• Where is the Arsenic located? – Groundwater chemistry
• Is the Arsenic coming from the sediments?– Sediment chemistry
• What is the watershed hydrology?– Groundwater flow
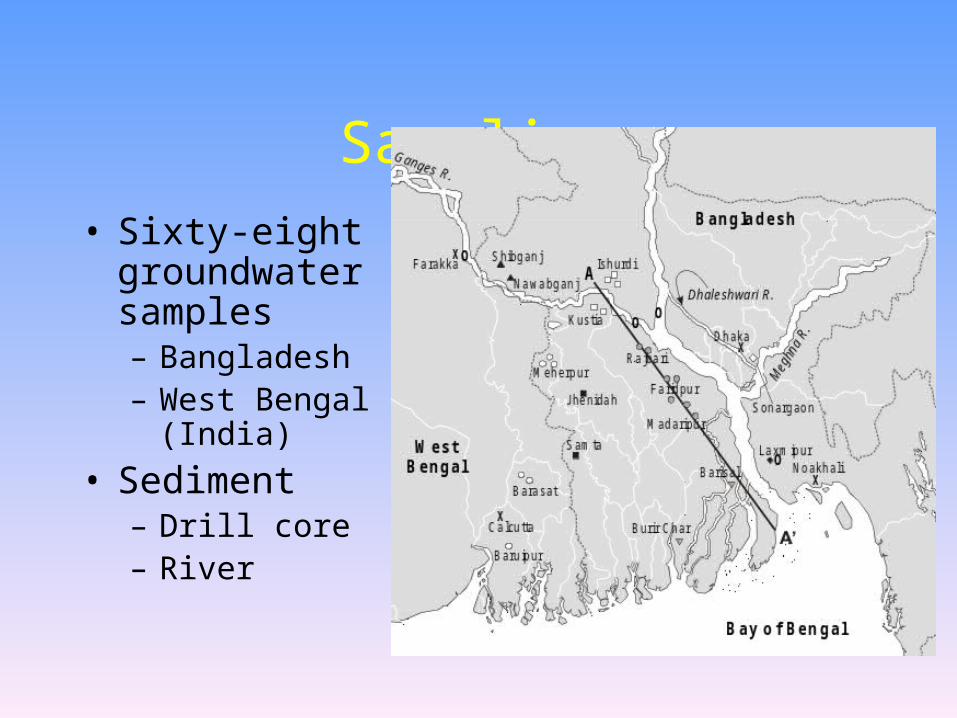
Sampling• Sixty-eight
groundwater samples– Bangladesh– West Bengal
(India)
• Sediment– Drill core– River
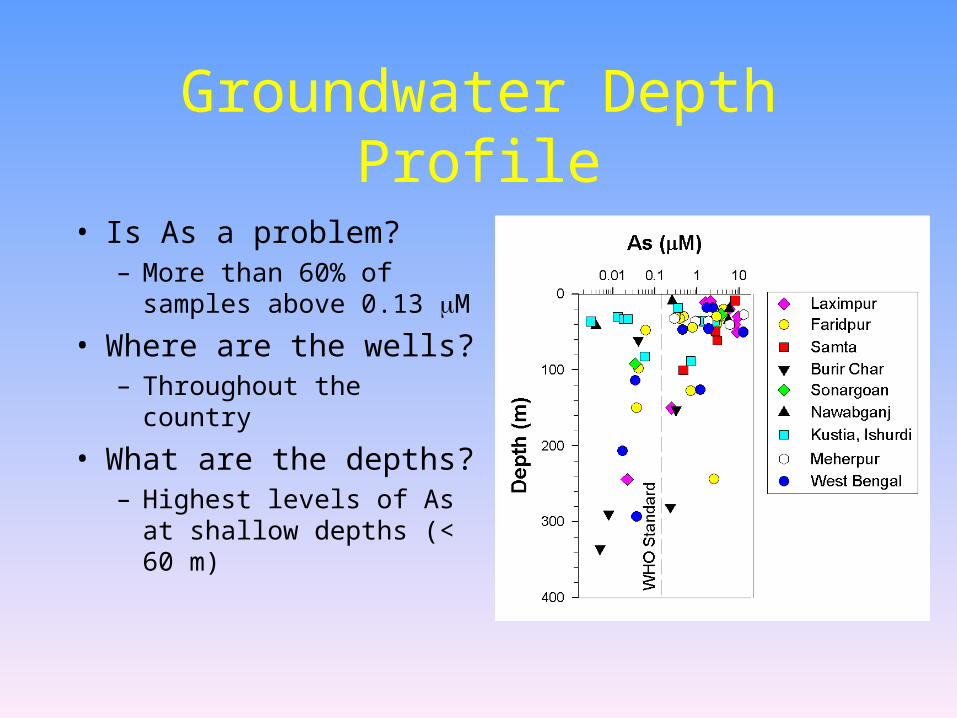
Groundwater Depth Profile
• Is As a problem?– More than 60% of
samples above 0.13 M
• Where are the wells?– Throughout the country
• What are the depths?– Highest levels of As at
shallow depths (< 60 m)

Does As correlate with others?
• Iron (Fe)– Previous studies
link As and Fe– Weak correlation
between As and Fe (r2=0.37)
• Methane (CH4) & Ammonia (NH4)– Microbial activity– Weak to modest
correlation (r2: 0.39-0.55)

Correlations with ArsenicFaridpur and Laxmipur
• As-rich areas– Faridpur
– Laxmipur
• Strong correlations with CH4, Fe, & NH4
(r2: 0.8-0.9)

Existing Theories of As Release
• Oxidation of pyrite (Rarely used anymore)
– Requires oxic water
• Competitive exchange with phosphorus – Phosphate (PO4
3-)– Dissolved As and P exchange for one another
• Dissolution of iron oxy-hydroxides (FeOOH)– FeOOH strongly adsorb As– Correlation between Fe and As– Anaerobic microbes

Are microbes involved?
• As-CH4 and As-NH4 correlations
– As microbes are oxidizing organic matter, they are breaking down FeOOH
– Microbes converting As(V) to As(III)– Microbes
• Shewanella alga BrY• MIT-13 • Geospirillum barnesii SES-3

Arsenic Geochemistry• Species
– As(V), Arsenate, AsO43-
– As(III), Arsenite, As2O42-
• 30-60X toxic and 5-10X mobile• As strongly adsorbs onto iron oxy-hydroxides (FeOOH)
• As-laden FeOOH are deposited in estuaries and wetlands

Groundwater Age Dating
• 3H/3He Age Dating Technique• Tritium (3H) is formed
– Above ground nuclear testing– Cosmogenic reactions (14N + n = 3H + 12C)
• Component of water molecule (3H2O)• 3H decays to 3He
– t1/2=12.4 yrs
• Groundwater residence time:– t=(1/)ln{1+(3He*/3H)}

Groundwater Age Dating
• Variations in ground-water velocities– ~0.4 m/yr
– ~3 m/yr
• Complicated stratigraphy
• Complex distribution of As

Watershed Hydrology

What is the source of As?
• Sediments influence groundwater– Mineralogy– Grain size– Adsorption/desorption
• Dissolved As and Fe have similar patterns
• Adsorbed As and Fe have comparable patterns
• Bulk capable of supplying As to groundwater

Sediment As-Fe
• Modest correlation at any depth– r2=0.7
• Sources of As and Fe in all solid phases may be the same– Microbial dissolution of
FeOOH
• Grain size plays an important role
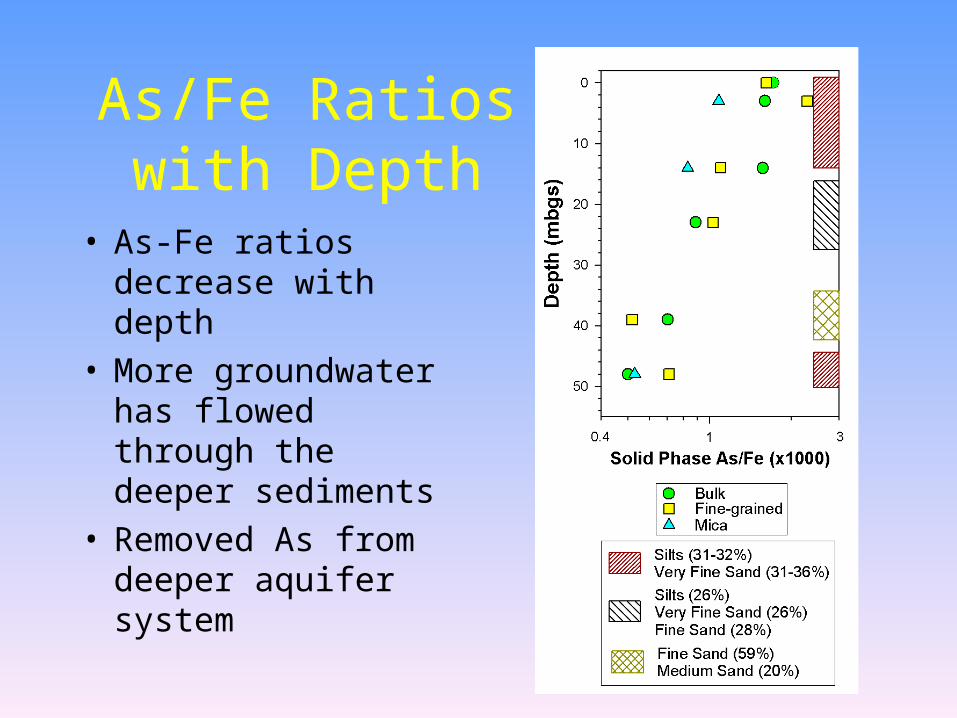
As/Fe Ratios with Depth
• As-Fe ratios decrease with depth
• More groundwater has flowed through the deeper sediments
• Removed As from deeper aquifer system

• Vadose Zone (unsaturated)
• Phreatic Zone (saturated)
– Aerobic organisms consume O2
– Anaerobic microbes reduce FeOOH
• Releases Fe and As
– Dissolved As levels• Biological activity
• Adsorption reactions
Overview of As Release
Vadose Zone
Phreatic Zone
Rain
Oxygen Present
No Oxygen Present
AsFeOOH
MicrobialActivity
Adsorption
Recharg
e

Summary
• As in groundwater – 30-60% population is affected – 60% of the samples above WHO MCL
(0.13 M)– Depth less than 60 m– Anoxic groundwater greater than 60 yrs
• Complicated distribution of As in groundwater
Summary
• Source of As– The As-laden sediments – Released from the sediments through
microbes– Bulk sediments are capable of supplying all
of the arsenic to the groundwater

Present
• The Bad News– Groundwater will have high arsenic levels
for a very long period of time.
• The Good News– The drinking supply wells can be drilled to
deeper depths.
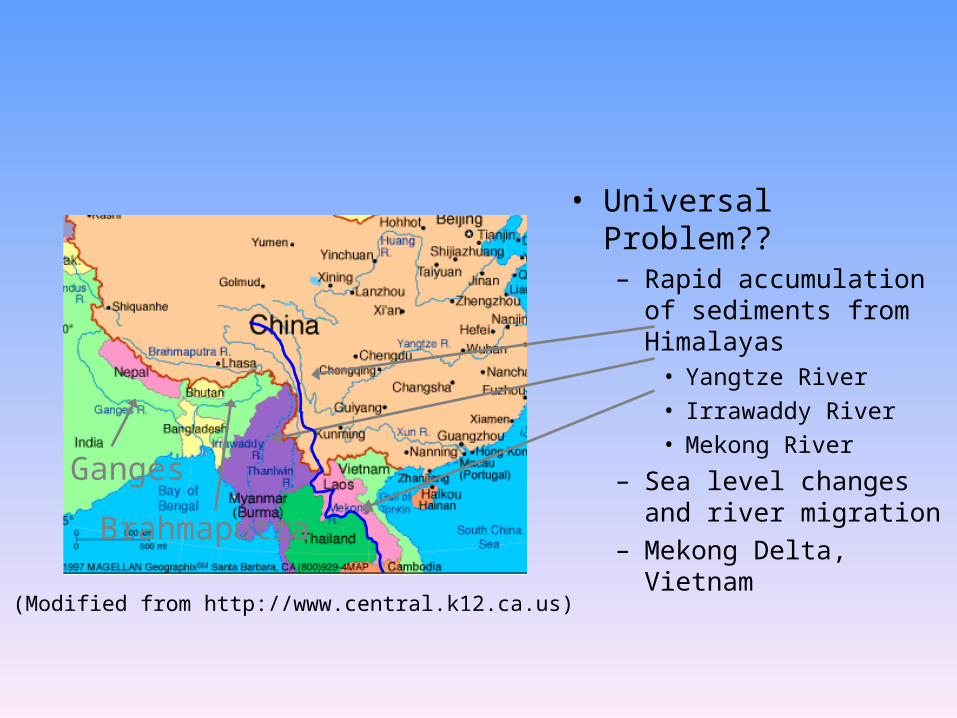
• Universal Problem??– Rapid accumulation of
sediments from Himalayas
• Yangtze River
• Irrawaddy River
• Mekong River
– Sea level changes and river migration
– Mekong Delta, Vietnam
(Modified from http://www.central.k12.ca.us)
Brahmaputra
Ganges


