LESSER SNOW GEESE A N D A G R I C U L T U R A L HABITAT USE ON THE FRASER RIVER D E L T A
by
D A V I D ROSS B R A D B E E R
B.Sc. (Agroecology), The University of British Columbia, 2004
A THESIS SUBMITTED IN PARTIAL F U L L F I L M E N T OF THE REQUIREMENTS FOR THE DEGREE OF
M A S T E R OF SCIENCE
in
THE F A C U L T Y OF G R A D U A T E STUDIES
(Animal Science)
THE UNIVERSITY OF BRITISH C O L U M B I A
April 2007
© David Ross Bradbeer, 2007

ABSTRACT
Lesser Snow Geese winter on the Fraser River delta of south-western British Columbia
and feed on upland agricultural crops. With the recent loss of foreshore marsh habitat adjacent
to the Vancouver International Airport, agricultural habitats have become more important. The
loss of foreshore habitat, combined with a growing Snow Goose population, will increase the
grazing pressure the birds exert on farm fields in West Delta. Because Snow Geese can over
graze perennial forage grasses, conflicts with farmers will likely escalate. Providing foraging
opportunities for Snow Geese while minimizing the conflict between the geese and Delta
farmers should be the goal of management efforts. To accomplish these goals, the Alaksen
National Wildlife Area (ANWA) and Greenfields cover crop program must be managed in a
way that attracts Snow Geese to these areas.
From 1995 to 2000 Snow Geese used the Alaksen National Wildlife Area during both
the fall and late winter hunting seasons. Fewer geese fed outside the Alaksen National Wildlife
Area during open hunting seasons compared to when the seasons were closed. Snow Geese
used perennial forage, cover crops, potato, and grain between 1995 and 2000. Between October
2005 and April 2006,1 documented patterns of agricultural field use on Westham Island and
Brunswick Point and assessed how crop type, hunting, and field size influenced those patterns. I
used foraging theory as a framework to assess how temporal changes in the quality and quantity
of food influenced crop use. The main determinant of field use was crop type. Nutrient content
appeared to be important to the order of crop use. Snow Geese used the crops that contained the
highest concentrations of crude protein (cover crops) and simple carbohydrates (potatoes and
barley grain) first in the fall and early winter. Perennial forage crops contained the highest
concentration of indigestible crude fibre and were not used until the higher quality crops were

depleted. Absolute crop biomass did not seem to influence crop use patterns because Snow
Geese initially ignored perennial forage fields that contained more biomass than cover crop and
potato fields. In March and April Snow Geese continued to use perennial forage fields, but also
grain stubble and cover crop fields. Use of these fields may have been related to the presence of
newly sprouting forbs and grasses. Snow Geese moved outside of the Alaksen National
Wildlife Area despite an open hunting season in November 2005. Food depletion within the
Alaksen National Wildlife Area may force Snow Geese to tolerate hunting pressure and was
likely a factor that caused the geese to use fields outside the area.
T A B L E O F C O N T E N T S
ABSTRACT .• . . . . . i i
T A B L E OF CONTENTS ! iv
List of Tables .". :....v
List of Figures ; vii
Acknowledgements ; ix
CHAPTER 1: G E N E R A L INTRODUCTION 1
CHAPTER 2: A G R I C U L T U R A L HABITAT USE B Y SNOW GEESE 7
INTRODUCTION 7 METHODS 13 RESULTS 15 DISCUSSION : 19
CHAPTER 3: PATTERNS OF A G R I C U L T U R A L FIELD USE B Y SNOW GEESE 21
INTRODUCTION 21 METHODS 24 RESULTS 32 DISCUSSION 44
CHAPTER 4: FIELD USE A N D THE QUANTITY A N D Q U A L I T Y OF FOOD 52
INTRODUCTION 52 METHODS 56 RESULTS 62 DISCUSSION 69
CHAPTER 5: THESIS S U M M A R Y A N D M A N A G E M E N T IMPLICATIONS 75
LITERATURE CITED 82
iv

List of Tables
Table 1: Classification of different crops into habitat types, and their associated characteristics. 26
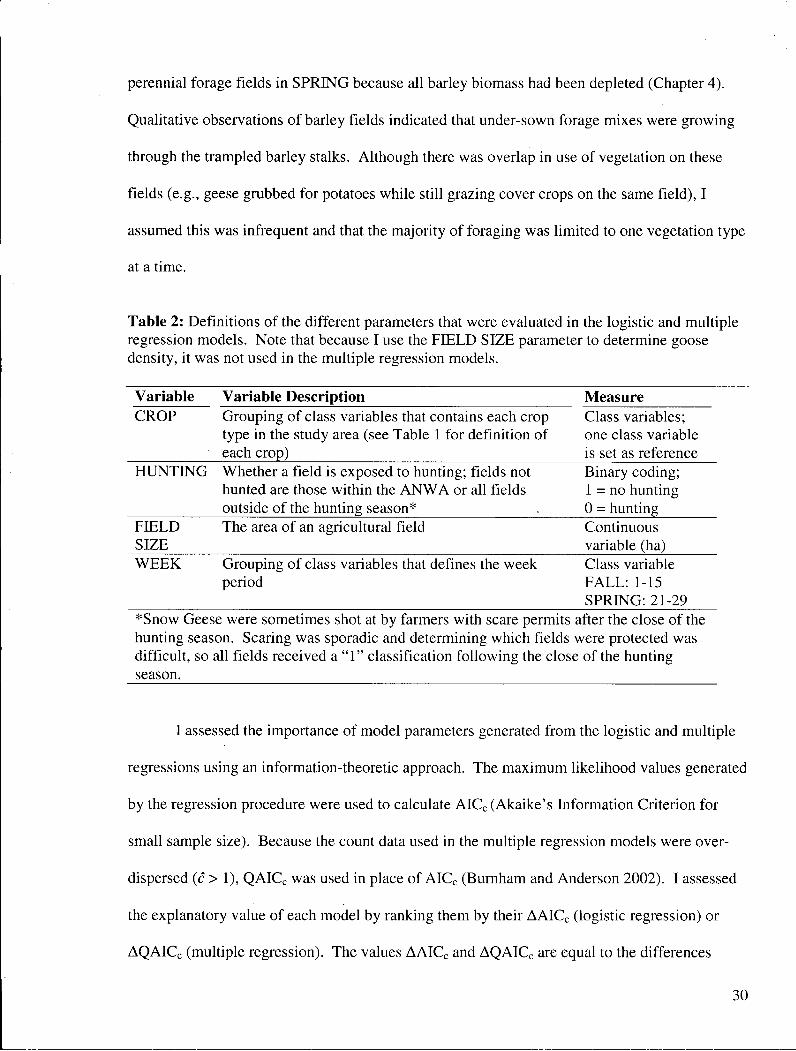
Table 2: Definitions of the different parameters that were evaluated in the logistic and multiple regression models. Note that because I use the FIELD SIZE parameter to determine goose density, it was not used in the multiple regression models 30
Table 3: Jacob's Index, indicating whether use of individual crop types was greater than or less than expected, based on crop availability. Values greater than 0 indicate selection while values less than 0 indicate avoidance. Crops that were selected are highlighted in grey 34
Table 4: Competing models used in the F A L L logistic regression and their associated R 2 , AIC C , A I C W values : 35
Table 5: Parameter estimates, summed Akaike weights (WJ), weighted parameter estimates, and' unconditional standard errors from the F A L L logistic regression analysis. The parameter estimates for ''Unknown'' and "Week 15" are the reference values for CROP and WEEK, respectively : 37
Table 6: Competing models used in the F A L L multiple regression and their associated R , QAICc, QAICw values 38
Table 7: Parameter estimates, summed Akaike weights (Wj), weighted parameter estimates and unconditional standard errors from the F A L L multiple regression analysis. The parameter estimates for "Barley Grain" and "Week 15" are the reference values for CROP and WEEK, respectively 39
Table 8: Competing models used in the SPRING logistic regression and their associated R 2 , AICc, A I C W values 40
Table 9: Parameter estimates, summed Akaike weights (WJ), weighted parameter estimates and unconditional standard errors from the SPRING logistic regression analysis. The parameter estimates for "Unknown" and "Week 29" are the reference values for CROP and WEEK, respectively 41
Table 10: Competing models used in the SPRING multiple regression and their associated R 2 , QAICc, QAICw values 42
Table 11: Parameter estimates, summed Akaike weights (WJ), weighted.parameter estimates and unconditional standard errors from the SPRING multiple regression analysis. The parameter estimate for "Potato" is the reference value for CROP 43
Table 12: Mean percentage crude protein concentrations (± % SE) for cover crops, perennial forage (forage), and potato fields across 4 sample periods. Mean values that share the same letter did not differ significantly 68
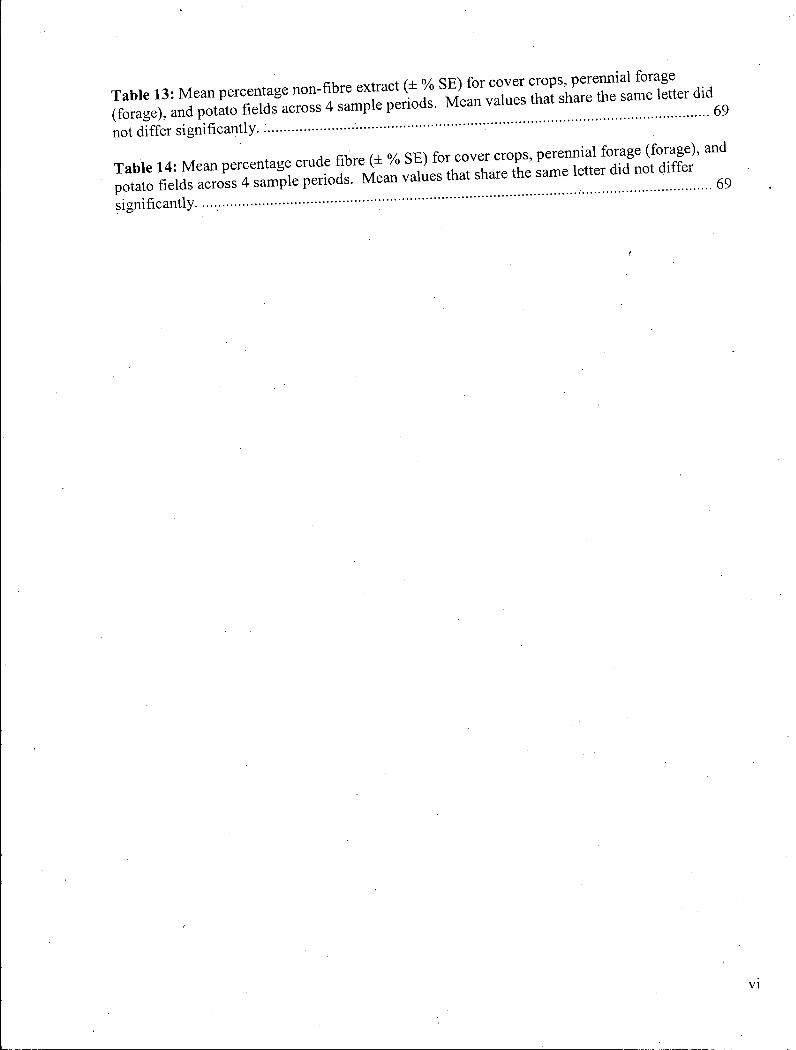
Table 13: Mean percentage non-fibre extract (± % SE) for cover crops, perennial forage (forage), and potato fields across 4 sample periods. Mean values that share the same letter did
not differ significantly.: 69
Table 14: Mean percentage crude fibre (± % SE) for cover crops, perennial forage (forage), and potato fields across 4 sample periods. Mean values that share the same letter did not differ
69
List of Figures
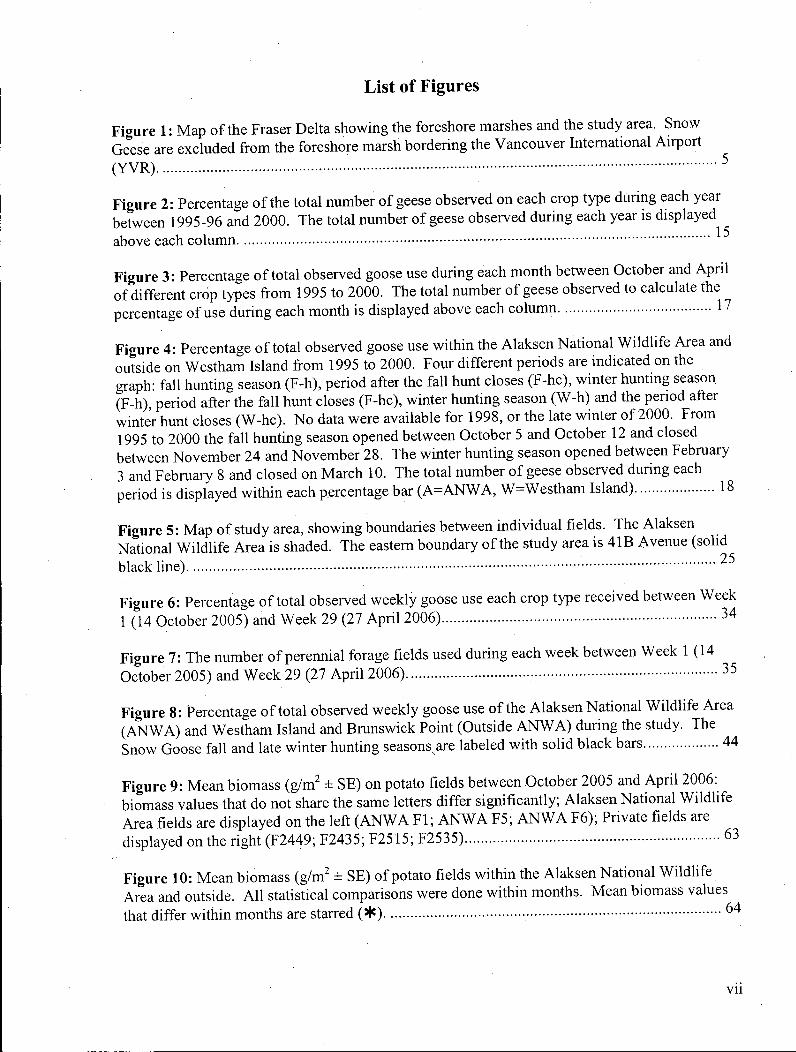
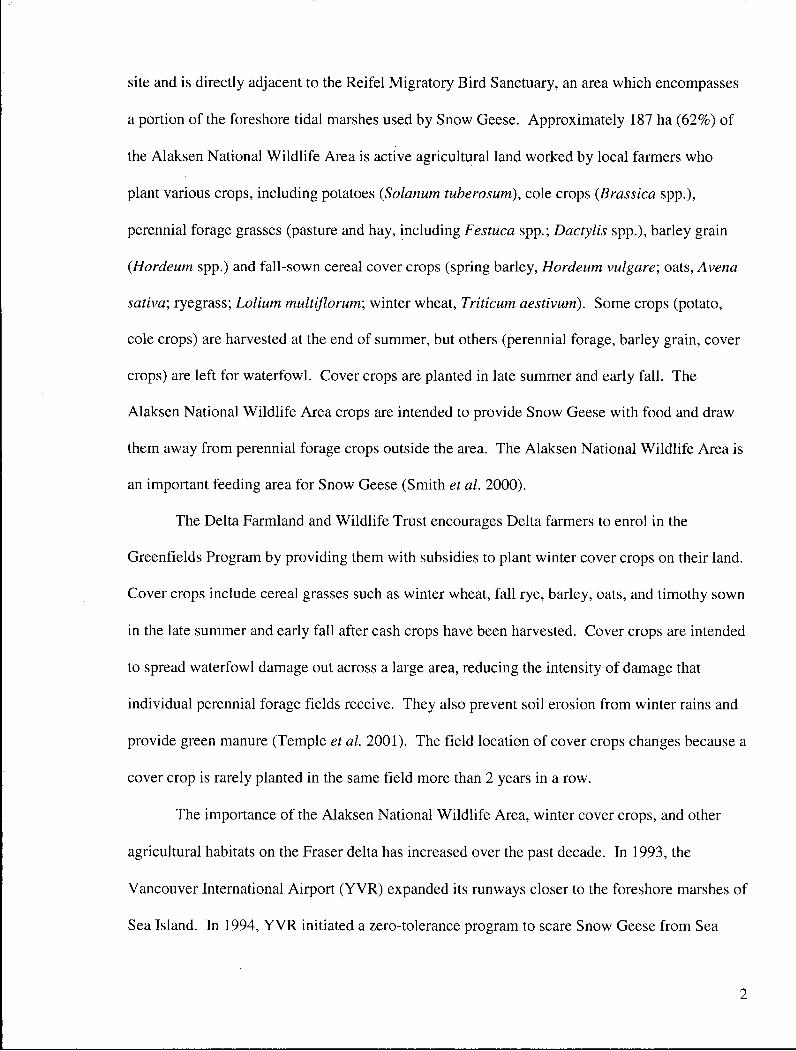
Figure 1: Map of the Fraser Delta showing the foreshore marshes and the study area. Snow Geese are excluded from the foreshore marsh bordering the Vancouver International Airport (YVR) '. 5
Figure 2: Percentage of the total number of geese observed on each crop type during each year between 1995-96 and 2000. The total number of geese observed during each year is displayed above each column 15
Figure 3: Percentage of total observed goose use during each month between October and April of different crop types from 1995 to 2000. The total number of geese observed to calculate the percentage of use during each month is displayed above each column 17
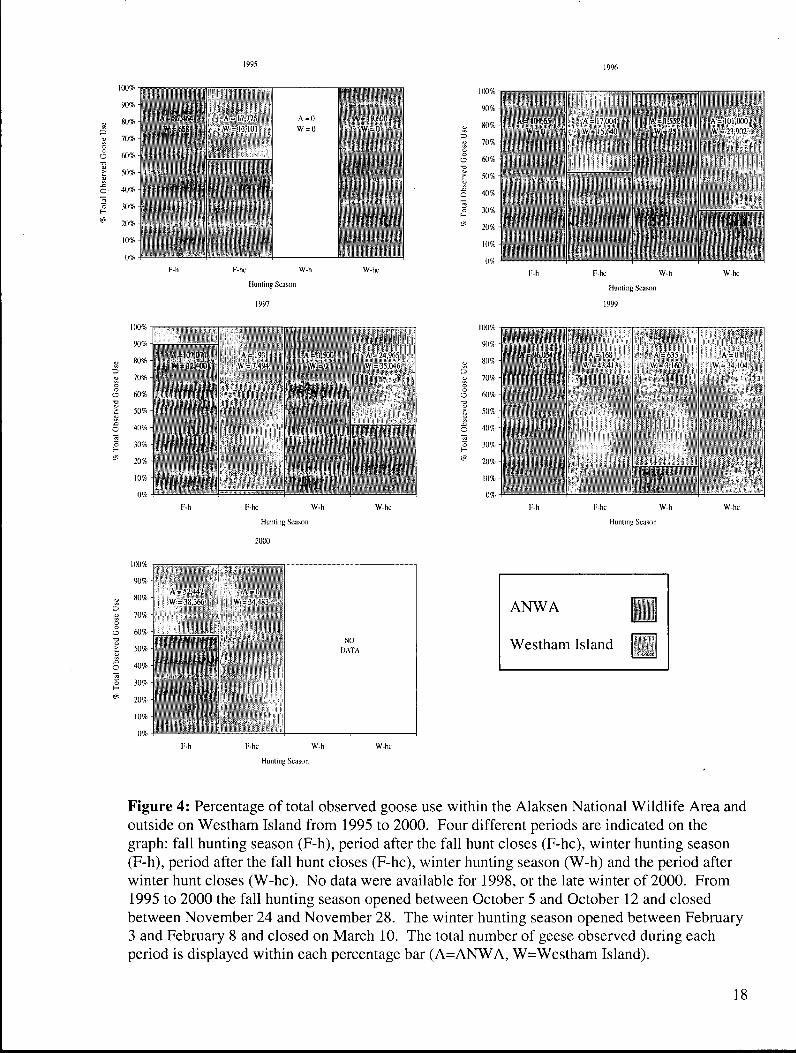
Figure 4: Percentage of total observed goose use within the Alaksen National Wildlife Area and outside on Westham Island from 1995 to 2000. Four different periods are indicated on the graph: fall hunting season (F-h), period after the fall hunt closes (F-hc), winter hunting season (F-h), period after the fall hunt closes (F-hc), winter hunting season (W-h) and the period after winter hunt closes (W-hc). No data were available for 1998, or the late winter of 2000. From 1995 to 2000 the fall hunting season opened between October 5 and October 12 and closed between November 24 and November 28. The winter hunting season opened between February 3 and February 8 and closed on March 10. The total number of geese observed during each period is displayed within each percentage bar (A=ANWA, W=Westham Island) 18
Figure 5: Map of study area, showing boundaries between individual fields. The Alaksen National Wildlife Area is shaded. The eastern boundary of the study area is 41B Avenue (solid black line) 25
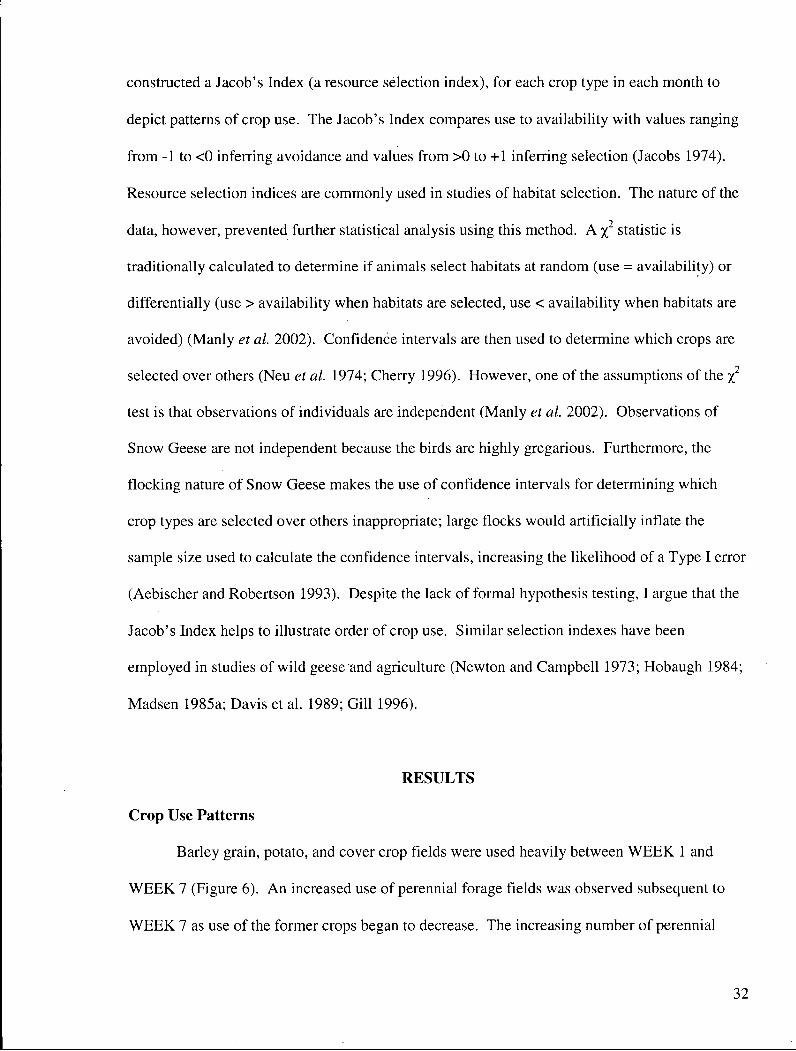
Figure 6: Percentage of total observed weekly goose use each crop type received between Week 1(14 October 2005) and Week 29 (27 April 2006) 34
Figure 7: The number of perennial forage fields used during each week between Week 1 (14 October 2005) and Week 29 (27 April 2006) 35
Figure 8: Percentage of total observed weekly goose use of the Alaksen National Wildlife Area (ANWA) and Westham Island and Brunswick Point (Outside A N W A ) during the study. The Snow Goose fall and late winter hunting seasons^are labeled with solid black bars 44
Figure 9: Mean biomass (g/m ± SE) on potato fields between October 2005 and April 2006: biomass values that do not share the same letters differ significantly; Alaksen National Wildlife Area fields are displayed on the left (ANWA F l ; A N W A F5; A N W A F6); Private fields are displayed on the right (F2449; F2435; F2515; F2535) 63
Figure 10: Mean biomass (g/m2 ± SE) of potato fields within the Alaksen National Wildlife Area and outside. A l l statistical comparisons were done within months. Mean biomass values that differ within months are starred (*) 64

Figure 11: Mean biomass (g/m2 ± SE) on cover crop fields between October 2005 and April 2006: biomass values that do not share the same letters differ significantly; Alaksen National Wildlife Area fields are displayed on the left (ANWA F2; A N W A F17); Private fields are displayed on the right (F2472; F2504; F2501) 65
Figure 12: Mean biomass (g/m2 ± SE) on perennial forage fields between October 2005 and April 2006: biomass values that do not share the same letters differ significantly; Alaksen National Wildlife Area fields are displayed on the left (ANWA F l ; A N W A F3; A N W A F4; A N W A F14); Private fields are displayed on the right (F2615; F2729; F2631) 66
Figure 13: Mean biomass (g/m2 ± SE) on barley grain fields on the Alaksen National Wildlife Area between October and December 2005: biomass values that do not share the same letters differ significantly ( A N W A F15; A N W A F14; A N W A F18; A N W A Fl). . . . . . 67
V l l l

Acknowledgements
This project has been an incredibly diverse and enriching adventure. My family and friends have been behind me every step of the way, and I could not have completed the journey without them. I have been especially fortunate to have a pair of supervisors that have provided guidance and encouragement. Both were true mentors in every sense of the word. David Shackleton (UBC), my senior supervisor, was supportive from the beginning and continually challenged my understanding, while providing much needed moral support. W. Sean Boyd (CWS), my co-supervisor, was a motivational figure who shared his passion for waterfowl biology, and inspired that same passion in me. My committee members, Art Borrike (UBC), Alton Harestad (SFU), and Kim Cheng (UBC) have provided moral and technical support that I am grateful for.
Many individuals helped me to produce this thesis and I thank them all for the contribution they made to this project. Thomas Sullivan (UBC) provided feedback, advice and encouragement. Markus Merkens (DFWT) aided me in collecting land use data and continually providing advice on the project. Wayne Temple (UBC) introduced me to the study area and the farmers of Westham Island and Brunswick Point, as well as providing advice on statistical analysis. Dan Esler (CWS, SFU) guided me through the information theoretic modeling of my data. Jason Komaromi (CWS) helped with GIS and GPS support and was instrumental in refining the random sampling point methodology. Tony Kozak (UBC) provided help with the statistical analysis of the biomass and nutrient data. Dave Smith (CWS) and Keith Perry (CWS) provided me with data on the A N W A . Dan Buffett (DUC) provided project management, including the organization of the budget. Vinee Van Beelen (DUC) gave me access to computer software and additional data sets. Kathleen Moore (CWS) helped me to interpret the Westham Island Waterfowl Surveys. Kathy Bossort (Delta Museum and Archives) provided access to historical documents. I am especially grateful to Amanda Williams, Blake Bartzen, Tracy Sutherland, and Jason Barzanti for collecting field data.
Project funding was provided by DUC, CWS, and Transport Canada. The majority of funding was from the Sea Island Snow Goose Management Plan. I am grateful to the agencies and all of the individuals who organized the funds necessary to conduct this study.
Special thanks go to my fellow graduate students, Craig Smith, Austin Spry, John Hart, and Brian Wallace who provided me with encouragement, support and insight during the writing process. I extend a big thanks to Brian Wallace, who initially suggested that this project would be "right up my alley."
Many farmers, including Jack Zellweger, John Zellweger, Don Cameron, Duncan Montgomery, Ken Montgomery, Jack Bates, and Hugh Reynolds freely shared their knowledge and provided me with fresh, local insight. I am especially grateful to all of the farmers that granted me access to their land. I extend my gratitude to these same farmers who work to provide habitat for wintering waterfowl like Snow Geese.
ix

CHAPTER 1
GENERAL INTRODUCTION
Snow Geese and Agriculture on the Fraser Delta
The Wrangel Island population of Lesser Snow Geese (Chen caerulescens caerulescens)
breeds on Wrangel Island in Northern Siberia, Russia. More than half of the Wrangel Island
population winters on the Fraser (British Columbia, Canada) and Skagit (Washington, USA)
River deltas (Pacific Flyway Council 2006). Between late September and mid April, the geese
use foreshore salt marshes and upland agricultural habitats on both deltas. Traditionally,
foreshore marshes were the only habitats used, however, in the past 25 years, the geese have
increasingly used agricultural habitats on the Fraser delta and are now commonly recorded
consuming grass crops (perennial forage, fall-sown cereals), crop residues (potatoes and corn
stubble), and grain on Westham Island and Brunswick Point (Hatfield 1991; Boyd 1995; Smith
et al. 1998; Temple et al. 2001).
Agricultural crops make up a significant portion of the flock's winter diet and this
sometimes brings Snow Geese into conflict with farmers. The geese can overgraze perennial
forage fields, causing economic loss by reducing yields (Zbeetnoff and McTavish 2004).
Refuges have been established and programs have been initiated to mitigate goose damage to
perennial forage crops. The Alaksen National Wildlife Area (ANWA) is a refuge where
agricultural crops are grown for migratory birds. The Greenfields Program, administered by the
Delta Farmland and Wildlife Trust, shares the cost with local farmers of planting cereal crops
for waterfowl. Damage to crops is also mitigated by crop residues available on private land
(e.g., potatoes and corn) at no cost to producers and managers.
The Alaksen National Wildlife Area is managed by the Canadian Wildlife Service
(CWS). Established in 1972 at the north end of Westham Island, it is part of a 586 ha Ramsar
1
site and is directly adjacent to the Reifel Migratory Bird Sanctuary, an area which encompasses
a portion of the foreshore tidal marshes used by Snow Geese. Approximately 187 ha (62%) of
the Alaksen National Wildlife Area is active agricultural land worked by local farmers who
plant various crops, including potatoes (Solarium tuberosum), cole crops (Brassica spp.),
perennial forage grasses (pasture and hay, including Festuca spp.; Dactylis spp.), barley grain
(Hordeum spp.) and fall-sown cereal cover crops (spring barley, Hordeum vulgare; oats, Avena
sativa; ryegrass; Lolium multiflorum; winter wheat, Triticum aestivum). Some crops (potato,
cole crops) are harvested at the end of summer, but others (perennial forage, barley grain, cover
crops) are left for waterfowl. Cover crops are planted in late summer and early fall. The
Alaksen National Wildlife Area crops are intended to provide Snow Geese with food and draw
them away from perennial forage crops outside the area. The Alaksen National Wildlife Area is
an important feeding area for Snow Geese (Smith et al. 2000).
The Delta Farmland and Wildlife Trust encourages Delta farmers to enrol in the
Greenfields Program by providing them with subsidies to plant winter cover crops on their land.
Cover crops include cereal grasses such as winter wheat, fall rye, barley, oats, and timothy sown
in the late summer and early fall after cash crops have been harvested. Cover crops are intended
to spread waterfowl damage out across a large area, reducing the intensity of damage that
individual perennial forage fields receive. They also prevent soil erosion from winter rains and
provide green manure (Temple et al. 2001). The field location of cover crops changes because a
cover crop is rarely planted in the same field more than 2 years in a row.
The importance of the Alaksen National Wildlife Area, winter cover crops, and other
agricultural habitats on the Fraser delta has increased over the past decade. In 1993, the
Vancouver International Airport (YVR) expanded its runways closer to the foreshore marshes of
Sea Island. In 1994, Y V R initiated a zero-tolerance program to scare Snow Geese from Sea
2

Island to avoid bird/aircraft collisions (B. MacKinnon. Transport Canada, pers. comm. 4 April
2005) thus effectively denying a portion of foreshore habitat to Snow Geese. Compounding the
impact of the habitat loss is a doubling of the Fraser-Skagit Snow Goose population from ca.
40,000 individuals in 1995 to ca. 80,000 in 2005 (Pacific Flyway Council 2006; S. Boyd.
Canadian Wildlife Service, unpublished data).
The reduction of available habitat and increase in the population has likely resulted in
greater foraging pressure on agricultural fields. Current crop management practices might not
provide sufficient food to support Snow Geese over the winter. Furthermore, perennial forage
fields outside the Alaksen National Wildlife Area could experience increased grazing pressure,
resulting in greater economic loss to local farmers. Therefore, management efforts should
attempt to attract and concentrate Snow Geese on the Alaksen National Wildlife Area and
Greenfields cover crops, thereby providing them with foraging opportunities while diverting
them from economically important crops.
To achieve these goals factors influencing crop selection by Snow Geese must be
understood. I investigate these factors by describing patterns of agricultural field use by Snow
Geese on the Fraser delta. In Chapter 2,1 review the history of field feeding by wild geese and
present data collected during 1995-1997 and 1999-2000 to explore patterns of crop use on the
Fraser delta in recent history. I address 3 questions: 1) What is the relative importance of
different crop types to Snow Geese in years prior to my study?; 2) Is there a consistent seasonal
pattern of crop use across years?; and 3) Do Snow Geese aggregate within the Alaksen National
Wildlife Area during the hunting season? In Chapter 3,1 quantify patterns of crop use
throughout the fall, winter, and spring of 2005/2006, and in Chapter 4, relate patterns of crop
use to crop biomass and crop nutrient content. I analyze these contemporary data to answer the
questions: 1) Is the pattern of observed crop use explained by variables including crop type,
3

hunting pressure, and field size?; and 2) Does the quality and quantity of available crops
influence crop use? Contemporary data were collected between September 2005 and April 2006
on Westham Island and Brunswick Point.
Study Area
Westham Island and Brunswick Point in Delta, British Columbia are located at the
mouth of the South Arm of the Fraser River, approximately 20 km from the city of Vancouver
(123° 10' W latitude, 49° 05'24" N longitude). The study area (Figure 1) is about 1540 ha; the
eastern boundary is enclosed by 41B Avenue (Brunswick Point). Westham Island and
Brunswick Point are separated by Canoe Pass.
Average annual rainfall and mean temperature, measured at the Vancouver International
Airport between 1971 and 2000, are 1154.7 mm and 10.1 °C, respectively (Environment Canada
2004). Average rainfall is greatest in the late fall and early winter, with an average of 900 mm
falling between October and March. November experiences the greatest rainfall with a monthly
average of 178.5 mm. January is the coldest month with an average temperature of 3.3 °C.
Average snowfall between October and March is 7.95 cm.
The study area is comprised almost completely of diked agricultural fields. Additional
landscape features include farmyards (equipment storage, livestock housing, and packing/
processing facilities) and residential housing. The Alaksen National Wildlife Area also contains
sloughs and forested habitats. The composition of agricultural habitats fluctuates yearly as
crops are rotated. The main annual crops are potatoes, corn (Zea maiys), peas (Pissum spp.),
beans (Viciafaba), cole crops (cabbage, broccoli, turnip, and rutabaga), grain (barley, wheat,
and oats), and grass cover crops (wheat, barley, timothy, oats). The main perennial crops are
4
forage grasses (for hay, silage and pasture) and berries (raspberry, Rubus spp.; strawberry,
Frigaria spp.; and blueberry, Vaccinium spp).
Figure 1: Map of the Fraser Delta showing the foreshore marshes and the study area. Snow Geese are excluded from the foreshore marsh bordering the Vancouver International Airport (YVR).
Directly adjacent to the study area are foreshore tidal marshes with zones that can be
classified by the dominant vegetation. The most important zones are the lower three-square
bulrush zone dominated by the American three-square bulrush (Schoenoplectus americanus) and
the sedge zone dominated by Lynbei's sedge (Carex lyngbei). The bulrush zone is used by
Snow Geese during winter and the sedge zone primarily during spring staging (Boyd 1995).
5

The Fraser River delta is an important stopover and wintering ground for an estimated
1.4 million migratory birds (Butler and Campbell 1987). Thirty four species of waterfowl use
the delta annually (Hatfield 1991). Several waterfowl species use upland agricultural habitats in
the study area; the most frequently observed are Mallard (Anas platyrhynchos), Northern Pintail
(Anas acuta), American Wigeon (Anas americanus), Green-winged Teal (Anas crecca),
Gadwall (Anas strepera) and Trumpeter Swan (Cygnus buccinator). Bald Eagles (Haliaeetus
leucocephalus) and coyotes (Canis latrans) are common in and around agricultural fields
(Hatfield 1991).
6

CHAPTER 2
AGRICULTURAL HABITAT USE BY SNOW GEESE
INTRODUCTION
Snow Geese have used agricultural fields on the Fraser River delta consistently since
1980 (Hatfield 1991). Many wild goose species across the northern hemisphere have adopted
similar behaviour. In this chapter, I present a brief history of agricultural use by wild geese in
North America and Europe, including suspected causes for the shift to these habitats and the
implications for goose populations. I then discuss the history of Snow Geese and agricultural
habitat use on the Fraser delta, with a brief summary of agricultural production over the last
century. Finally, I present historical data of field use as a comparison for the data collected
during my study.
Wild Geese and Agriculture in the 20th Century
Most species of wild geese feed on agricultural crops during migration and wintering
periods (Abraham and Jefferies 1997; Vickery and Gil l 1999). Nearctic and Palearctic geese
traditionally occupied coastal marshes, raised bogs, and fens on their wintering and staging
grounds where they foraged on seeds, rhizomes, and green vegetation (van Eerden et al. 2005).
Geese began to use agricultural habitats extensively following World War II (Kear 1963;
Robertson and Slack 1995). Mechanization increased the amount of land that was worked and
also increased the amount of crop residue compared to traditional harvesting methods (i.e., hand
picking) (Kear 1963; Krapu et al. 1995). The use of fertilizers increased the amount of food
produced and selective plant breeding introduced highly-palatable grasses (Owen 1980; van
Eerden et al. 1996). This presented wild geese with an abundance of highly digestible foods in
habitats adjacent to traditional feeding areas.
7
The shift from natural to agricultural habitats has been documented for many goose
species in North America including Lesser Snow Geese (Alisauskas and Ankney 1988;
Robertson and Slack 1995; Hobaugh 1984; Davis et al. 1989), Greater Snow Geese (Chen
caerulescens atlanticus) (Bedard and Gauthier 1989), White-fronted Geese (Anser albifrons)
(Ackerman et al. 2006) and Canada Geese (Branta canadensis) (Gates et al. 2001). Similarly,
in Europe such habitat shifts have been reported for Pink-footed Geese (Anser brachyrnchus)
(Owen 1977), Greylag Geese (Anser anser) (Amat 1986), Dark-bellied Brant Geese (Branta
bernicla bernicla) (Summers and Stansfield 1991; Vickery et al. 1994), and Barnacle Geese
(Branta leucopsis) (Prins and Ydenberg 1985; Owen et al. 1987).
The shift from natural to agricultural habitats represents a major change in diet. Drent et
al. (1978/79) hypothesized that geese use habitats that provide the greatest net intake of energy.
Comparisons of the nutritional content of natural versus crop plants revealed that many
agricultural diets allow geese to maximize energy and/or protein intake (Reed 1976; Madsen
1985c; Bedard and Gauthier 1989; Spaans and Postma 2001). It is important to note that geese
have not entirely abandoned traditional habitats or food sources (e.g., marshes). Agricultural
diets are not always the most profitable foraging options, due in part to temporal increases in the
nutritional composition of natural diets and low levels of disturbances in traditional habitats
(e.g., Prins and Ydenberg 1985; Rowcliffe et al. 2001).
Farmers in Europe reported reduced yields due to overgrazing soon after geese began
feeding on managed pastures and cereals (Owen 1973). Several studies confirmed that geese
can have a negative effect on the yields of grass crops (Bedard et al. 1989; Jepsen 1991;
Percival and Houston 1992; McKay et al. 1993; McKay et al. 2001; Borman et al. 2002; Amano
et al. 2004). To address crop depredation, Owen (1973) suggested that refuges should be
established on managed agricultural lands. The intent of the refuges (sometimes called
8
alternative feeding areas, AFAs) was to provide wild geese with preferred foods to draw them
away from economically important crops (Owen 1990; Percival 1993; McKay et al. 1994;
Vickery et al. 1994; Vickery and Gil l 1999). The ability of AFAs to attract geese depends on
several factors, including proximity to traditional ranges, freedom from disturbances (Fox and
Madsen 1997), and availability of high quality food plants (Vickery and Gi l l 1999).
Maximizing the carrying capacity of AFAs means that an adequate amount of profitable
biomass must be available for geese (Riddington et al. 1997).
European AFAs have been largely successful in attracting geese (Vickery and Gil l 1999;
Cope et al. 2002). Often these AFAs are made more attractive to geese by mowing grass (Owen
1975) or applying nitrogen fertilizer to increase its nitrogen content and, thus, digestibility
(Percival 1993; Riddington et al. 1997; Hassall and Lane 2001; Patterson and Fuchs 2001).
Some biologists argue that AFAs may not be a solution to goose-farmer conflicts
(Spaans and Postma 2001). Subsidizing geese with agricultural crops allows populations to
increase beyond limiting factors on their traditional wintering habitats (Gauthier et al. 2005).
These claims are supported by the dramatic increases in North American and European goose
populations over the past 30 years. The mid-continent population of Lesser Snow Geese
increased at a growth rate of 5-7% per year, up to a maximum of 6 million geese in 1998
(Abraham et al. 2005a). Populations of Greater White-fronted Geese, Ross's Geese (Chen
rossii), Greater Snow Geese, and Canada Geese in North America have increased substantially
(Abraham and Jefferies 1997). Many European populations have increased since the early
1960s, including Pink-footed Geese, White-fronted Geese, Greylag Geese, Barnacle Geese, and
Brant Geese (Owen and Black 1991; Vickery and Gil l 1999; Fox et al. 2005).
The population increases are due to several factors, but the provisioning of agricultural
foods, the establishment of refuges and a warmer climate are suspected to be the main causes
9
(Abrahams and Jefferies 1997; Abrahams et al. 2005a; Fox et al. 2005). Beginning in the late
1940s and early 1950s agricultural crops such as corn, rice, forage grasses, and cereals became
abundant in the winter ranges of both North American and European wild geese. This, in
combination with the creation of hunting free refuges in and around agricultural areas,
encouraged geese to feed on these crops (Abrahams and Jefferies 1997). The inclusion of these
foods in their diet decreased mortality and improved the body condition of birds returning to
their breeding grounds (Owen and Black 1991; van Eerden et al. 1996). This resulted in an
increase in the mean number of offspring fledged because as body condition improves geese
produce more offspring (Ankney and Maclnnes 1978; Fox et al. 2005). Warmer climates over
the past 50 years have allowed geese to expand their winter range further northward into
agricultural areas (Abrahams and Jefferies 1997). Warming in the arctic has reduced breeding
failures caused by harsh weather, allowing recruitment to remain high. Reduced hunting may
have aided the growth of some European goose populations (Owen 1990; Ebbinge 1991; Owen
and Black 1991) but hunting failed to control population growth in North America and harvest
rates decreased despite steady and even increased hunting pressure (Abrahams and Jefferies
1997).
Mid-continent Lesser Snow Geese have greatly reduced the amount of food available on
their summer range in the Canadian sub-Arctic and Arctic (Abraham et al. 2005a; Abraham et
al. 2005b). Overgrazed arctic vegetation is unlikely to re-grow rapidly because of continued
grazing pressure from geese, salinization of soil, and low soil accretion rates (Kotanen and
Jefferies 1997; Abraham and Jefferies 1997; Abraham et al. 2005b). In short, agriculture and
refuges have allowed mid-continent Snow Geese to escape the food limitations of traditional
wintering habitats only to encounter food limitations of arctic breeding habitats (Jefferies et al.
10

2004). As traditional breeding areas are abandoned due to overgrazing the geese have colonized
new areas, threatening the vegetation of those habitats (Abraham and Jefferies 1997).
Snow Geese and Fraser Delta Agriculture
Snow Geese have increased their use of upland agricultural habitats on the Fraser River
delta, although this behaviour occurred relatively recently compared to other wild geese in the
Northern Hemisphere. The geese may have first learned to use crops on the Skagit River delta
where they have consistently used agricultural fields since the 1960's (M. Axelson. pers. comm.
29 Jan 2007). Prior to the 1980's, Snow Geese would only use agricultural fields sporadically
on Westham Island (Hatfield 1991). Snow Geese were not consistently observed on the
Alaksen National Wildlife Area in great numbers until 1980 Snow Geese but have been
recorded returning to the area every year since (Hatfield 1991). Snow Geese also increased their
use of agricultural fields on the rest of Westham Island and Brunswick Point since the 1980's
(Smith et al 2000; Temple et al. 2001).
Crops of the Fraser Delta: Historical Patterns and Current Trends
In the early part of the 20 t h century hay was the dominant crop grown on the Fraser delta
(Taylor 1958) but farmers gradually began to produce grain and potato crops (Delta Board of
Trade 1927). Potatoes and hay continued to be important crops during the mid century with
1,152 ha planted to potatoes and 2,104 ha planted to hay in the municipality of Delta (Delta
Farmers Institute 1949). Similar to agricultural production in Europe and the rest of North
America, potato production on the Fraser delta increased in the late 1940s and 1950s (Taylor
1958).
11
A greater variety of crops was produced in the second half of the 20 century, including
vegetables such as beans, peas, and corn (Statistics Canada 1981). Dairy herds also became
more prevalent, along with the hay and silage grass fields required to feed the cattle. Forage
production was intensified with the advent of chemical fertilizers and new grass varieties.
These advents, in conjunction with mechanized combines, allowed farmers to take multiple cuts
of hay. Potatoes continued to be an important crop on Delta with 2,184 ha planted in 1981 and
2,010 ha planted in 1991 (Statistics Canada 1981; Statistics Canada 1991).
In the 1990's the amount of land devoted to canning vegetables (beans, peas, and corn)
decreased due to low market values for these foods (Smith 1995). In response, farmers
diversified their farming operations or switched to more profitable cash crops. Potatoes and
dairy herds were the mainstay of Delta farmers during the 1990s and early 2000s. Berry crops
were planted as an alternative to canning vegetables with berry production in the Greater
Vancouver Regional District increasing from 1,420 ha in 1981 (Statistics Canada 1981) to 2,076
ha in 1991 (Statistics Canada 1991). Of the berry crops, blueberries have been the most
extensively planted since 1995 (Smith 1995). The high prices blueberries demand prompted
many farmers to convert vegetable production to blueberries. Blueberry production in Delta
increased from 125 ha in 1995 to over 300 ha in 2004 (Agriculture Canada, unpublished data).
Chapter Objectives
Historical data facilitate a comparison of patterns of habitat use to those observed during
contemporary studies. The Canadian Wildlife Service (CWS) conducted waterfowl surveys
(Westham Island Waterfowl Surveys, WIWS) between 1995 and 2000 to determine patterns of
habitat use. I used these data to describe historical patterns of crop use by Snow Geese,
specifically to determine 1) the relative importance of different crop types to Snow Geese in
12

years prior to my study and 2) if there is a consistent seasonal pattern of crop use between 1995
and 2000. I also wanted to determine if Snow Geese responded to hunting pressure by 1)
making greater use of the Alaksen National Wildlife Area during hunting seasons than Westham
Island and 2) if Snow Geese made greater use of Westham Island when hunting was closed.
METHODS
Data Analysis
The Westham Island Waterfowl Surveys were conducted by CWS between 1995 and
2000 to document habitat use. No data are available for the winter of 1998/99 because surveys
were suspended for a year. Additionally, no data are available for the winter and spring of 2001
because surveys were suspended at the end of December 2000. Waterfowl use of Westham
Island was quantified by counting birds along a transect that encompassed all of Westham
Island, including the Alaksen National Wildlife Area and private farmlands (Smith et al. 2000).
Surveys were conducted 3 times per week in 1995, and reduced to 1 survey per week for the
remaining years. The surveys began at high tide. A l l waterfowl were counted and the habitat
type the birds were using was recorded, including the type of agricultural crop. Crops were
classified as cover crop, perennial forage, grain, potato, corn stubble, or a mixture of grass and
grain.
I used the Westham Island Waterfowl Surveys to describe patterns of crop use across
Westham Island, including the Alaksen National Wildlife Area. To describe the amount of use
each crop type received during each year I summed the total goose use each crop type received.
I used this total to calculate the percentage of geese that used each crop type. I also calculated
the percentage of use that each crop received during each month of each year. I was unable to
13
determine preference for any given crop because there was no reliable estimate of area by crop
collected during the study.
The Westham Island Waterfowl Surveys also allowed a comparison of Snow Goose use
of the Alaksen National Wildlife Area across seasons. I divided each year into 4 periods: the
fall hunting season (F-h), the period following the close of the fall hunting season (F-hc), the
winter hunting season (W-h), and the period following the close of the winter hunting season
(W-hc). I used the total number of Snow Geese observed during each of the 4 periods to
calculate the percentage of use that each area (Alaksen and Westham Island) received. From
1995 to 2000 the fall hunting season opened between 5-12 October and closed between 24-28
November. During the same years the winter hunting season opened between 3-8 February and
closed on 10 March.
The data precluded the use of formal statistical tests. Observations of gregarious animals
such as Snow Geese are not independent and violate the assumptions of many statistical tests
(e.g., a x analysis would be inappropriate to test for differences between the amount of use the
Alaksen National Wildlife Area and the rest of Westham Island received during the hunting
season because flock counts would artificially inflate the sample size) (Aebischer and Robertson
1993; Manly et al. 2002). Such analysis of Snow Goose count data would always result in the
null hypothesis being rejected due to the inflated sample size, regardless of any biological
significance. Therefore, I simply present the percentage of use that each crop type received for
each year and each month and the percentage of use that the Alaksen National Wildlife Area and
Westham Island received during the hunting seasons.
14

RESULTS
Crop Use
The crops that received the greatest proportion of use between 1995 and 2000 were
perennial forage, potato, and cover crops (Figure 2). Grain crops consistently received a small
amount of use. Grass/grain crops were used more heavily in 1995 and 1996 compared to later
years. Potatoes were used uniformly between years except during 1997-98 when they received
over 30% of the total observed use. The use of cover crops by Snow Geese increased from a
low of 10% in 1995 to a high of over 40% in 2000. Contrary to this trend, the use of perennial
forage decreased from a high of over 55% in 1995 to less than 30% in 2000.
138,584 172,828 190,419 177,535 122,905
1995-96 1996-97 1997-98
Year
1999-00 2000
• Cover Crop • Perennial Forage H Potato @ Grass/Grain ID Grain • Com Stubble
Figure 2: Percentage of the total number of geese observed on each crop type during each year between 1995-96 and 2000. The total number of geese observed during each year is displayed above each column.
15

The monthly crop use data do not show a consistent pattern between years (Figure 3). In
1995 and 1997 perennial forage were used first by Snow Geese, followed by cover crops. The
opposite trend is true in 1996 and 1999 when cover crops were used before perennial forage.
The order in which potatoes were used also fluctuated between years. During the first two years
of the study, a greater percentage of Snow Geese used perennial forage crops during March.
This trend became less apparent in 1997 when approximately equal proportions of observed
Snow Geese used perennial forage and cover crops. The use of cover crops in March and April
2000 was higher than the use of perennial forage crops.
Refuge Use
Between 1995 and 1999 Snow Geese aggregated within the Alaksen National Wildlife
Area during the fall hunting season (Figure 4). Additionally, feweer geese fed outside the
Alaksen National Wildlife Area during open hunting seasons compared to when the seasons
were closed. In the fall hunting season of 1996 and 1999, no Snow Geese were sighted outside
of the Alaksen National Wildlife Area. In 1995 and 1997, Snow Geese fed outside of the
Alaksen National Wildlife Area but these birds only accounted for a small proportion of all
geese on farm fields during October and November. Following the close of the hunting season
at the end of November, Snow Geese fed outside the Alaksen National Wildlife Area. Snow
Geese also used the Alaksen National Wildlife Area during the winter hunting seasons of 1996
and 1997.
16

Figure 3: Percentage of total observed goose use during each month between October and April of different crop types from 1995 to 2000. The total number of geese observed to calculate the percentage of use during each month is displayed above each column.
17
1995 1996
100%
90%
80%
70%
60%
50%
40%
30%
20%
10%
0%
100%
90%
80%
70%
60%
50%
40%
30%
20%
10%
0%
100%
90%
80%
70%
60%
50%
40%
30%
20%
10%
• 0%
A=0
* . lit KS|55 :||| W = 0
F-hc W-h
Hunting Season
l___ipw A= 193 IlilllilH '• A = 24,965,
W = 7,494 • W = 35.046
i Hiiiiiip P • •HH|HH| H|flH__fl|
• • • M B F-hc W-h
Hunling Season
2000
A =52,442 W = 38.366 W= 34,483
lIl BiHilKBi NO
DATA
• B f l H l ^ Bllliiii
100%
90%
80%
70%
60%
50%
40% H
30%
20%
10%
0%
HSIllilH -. W = 15.640
H H H H
H U
HjHHHI HjHHHI • • • • • •••••1
11; B •HHH1
F-hc W-h
Hunling Season
1999
l(X)%
90%.
80%
70%
60%
50%
40%
30%
20%
10%
0%>
SlPBBSiilft!^ IlilpSiPII - A =168
_-,W =43,413 A = 615
W = 3,160
A — n
pIllll B
IB|jjHB| • B H B H |
H-h F-hc W-h W-hc
Hunting Season
A N W A
Westham Island
F-hc W-h
Hunling Season
Figure 4: Percentage of total observed goose use within the Alaksen National Wildlife Area and outside on Westham Island from 1995 to 2000. Four different periods are indicated on the graph: fall hunting season (F-h), period after the fall hunt closes (F-hc), winter hunting season (F-h), period after the fall hunt closes (F-hc), winter hunting season (W-h) and the period after winter hunt closes (W-hc). No data were available for 1998, or the late winter of 2000. From 1995 to 2000 the fall hunting season opened between October 5 and October 12 and closed between November 24 and November 28. The winter hunting season opened between February 3 and February 8 and closed on March 10. The total number of geese observed during each period is displayed within each percentage bar (A=ANWA, W=Westham Island).
18

DISCUSSION
Crop Use
The increasing annual use of cover crops between 1995 and 2000 combined with the
concurrent decreasing use of perennial forage is interesting, although the trend is difficult to
explain. It is possible that there was a change in the area of land devoted to these two crop
types; the shift could be explained simply by the changing proportions of available crops.
However, the area of cover crops enrolled in the Greenfields program on Westham Island only
increased from 138 ha in 1995 to 158 ha in 1999 (DFWT, unpublished data), and does not seem
to explain the increased use of cover crops. Without complete data pertaining to crop
availability between years a habitat selection index cannot be constructed and the reason for the
shift cannot be explained. The shift does, however, indicate that cover crops may be an
increasingly important food source for wintering Snow Geese on the Fraser delta.
Potato fields received the greatest proportion of use during 1997, which may be due to
the abundance of unharvested potatoes during that year (K. Moore. Canadian Wildlife Service,
pers. comm. November 2006). Heavy rains prevented farmers from harvesting and the resulting
abundance of potatoes likely attracted Snow Geese to these fields. Grain fields likely received
only a small proportion of use because this crop type is only found on a few fields within the
Alaksen National Wildlife Area during any given year.
A consistent pattern of monthly crop use between years was not evident from the data.
This is contrary to some studies of wild geese that have reported consistent patterns of habitat
use between years (e.g., Madsen 1985c; Prins and Ydenberg 1985; McKay et al. 1994;
Rowcliffe et al. 2001). However, changes in the availability of different foods between years
could explain the inconsistent pattern of crop use. For example, the availability of sprouting
forbs and grasses on fallow fields and rangeland influenced whether Central Flyway Snow
19

Geese used pastures during winter (Hobaugh 1984). It is possible that the availability of
different crop types varied between years and Snow Geese responded by using crops in a
different order. Without data on crop availability, it is difficult to determine why the order of
crop use differed between years.
Refuge Use
Between 1995 and 2000 Snow Geese tended to remain within the Alaksen National
Wildlife Area during the fall hunting season. Additionally, the number of Snow Geese using
Westham Island when the hunting seasons were closed was always higher than when they were
open. These results indicate that Snow Geese avoid hunting pressure on the rest of Westham
Island by aggregating within the Alaksen National Wildlife Area. This behaviour is similar to
that of many waterfowl species, which move within the safety of hunting-free refuges (Fox and
Madsen 1997; Madsen 1998).
Snow Geese did use fields outside the safety of the Alaksen National Wildlife Area
during the hunting season, but the number using fields outside during the hunting season was
always less than when hunting was closed. This may have occurred because crop fields outside
of the Alaksen National Wildlife Area were more profitable than those inside. Snow Geese
foraging on Westham Island during the hunting season may have been willing to trade safety for
greater foraging rewards. Food shortages within the Alaksen National Wildlife Area or a
relaxation in hunting pressure outside are alternative explanations. The influence of hunting on
goose movements will be discussed in greater detail in Chapter 3.
20

CHAPTER 3
PATTERNS OF AGRICULTURAL FIELD USE BY SNOW GEESE
INTRODUCTION
The Snow Goose population wintering on the Fraser and Skagit River deltas is
inextricably linked to agricultural habitats. Management strategies must address the need to
provide an adequate amount of foraging habitat and at the same time ameliorate conflict
between farmers and geese. Understanding how factors like crop type and hunting affect habitat
use patterns of the geese will aid the formulation of management strategies.
Agricultural habitats occupy the landscape in a mosaic of different crop types, with each
field representing a discrete patch of food. Although variation in plant architecture (e.g., height)
and nutrient content exists within any given crop, it is useful to classify agricultural habitats by
crop type when analyzing patterns of habitat use (e.g., Madsen 1985a; Sutherland and Crockford
1993; Krapu et al. 1995; Gi l l 1996; Hi l l and Fredrick 1997). Different crop fields fit well within
Hutto's (1985, p. 456) definition of habitat, "...a spatially contiguous vegetation type that
appears more or less homogenous throughout and is physiognomically distinctive from other
such types."
Geese select crops on the basis of food availability and quality (Bos et al. 2005) and
differences in crop nutrient composition and biomass will result in differential patterns of
habitat use. Crop type is a proximate factor in how geese select agricultural habitats but can be
used to understand how causative factors like food biomass and nutrient content influence field
selection. Therefore, it is important to determine if Snow Geese select crops differentially, and
if so, which crops are used and when. Applied research on Snow Goose habitat use patterns will
21

improve understanding of habitat selection and how the availability and quality of food (Chapter
4) affects the distribution of geese.
Field size influences agricultural habitat use by wild geese. Geese avoid areas that
experience heavy disturbances (Madsen 1985b; Gi l l et al. 1996a) and geese may be exposed to
more disturbances on small fields because of the proximity to field edges (Meire and Kuijken
1991). Dark-bellied Brant Geese wintering in southern England tended to select the largest
available fields (Mckay et al. 1996). Pink-footed Geese wintering in Norfolk would not use
fields smaller than 6 ha (Gill 1996). Pink-footed and Greylag Geese wintering on the Moray
Firth were reported to avoid fields smaller than 3 ha (Stenhouse 1996) and Bean Geese (Anser
fabalis) in Norfolk avoided fields smaller than 5 ha (Allport 1991, as cited by Vickery and Gil l
1999). Non-migratory Greylag Geese also tend to select the largest available fields (Mckay et
al. 2006).
Predation risk can influence habitat use and animals may reduce feeding in patches with
high predation risk that would otherwise be suitable for heavier exploitation (Holbrook and
Schmitt 1988; Cresswell 1994). The concept of predation risk has been extended to examine the
role of disturbance and hunting in agricultural field use by wild geese. Pink-footed Geese use
per hectare was negatively related to the rate of disturbance (Gill et al. 1996a). Disturbances
were found to deter use by Greater Snow Geese (Belanger and Bedard 1989), resulting in
reduced energy intake and, consequently, decreased survival (Belanger and Bedard 1990).
Decreased use of fields caused by disturbances can occur irrespective of the profitability of the
food on the field (Fox and Madsen 1997).
Snow Geese are legally hunted on the Fraser delta during two seasons. In 2005, the first
season opened on 8 October 2005 and closed on 2 January 2006. The second season opened on
21 February and closed 10 March 2006. Hunting occurs on fields outside of the Alaksen
22

National Wildlife Area. To quantify disturbance and predation risk, I compared the use of
agricultural fields inside the Alaksen National Wildlife Area (a no-hunting area) with field use
outside. If hunting influences agricultural field use by Snow Geese, I predicted that a greater
proportion of the goose population should be found within the Alaksen National Wildlife Area
where hunting is prohibited. However, confinement to the Alaksen National Wildlife Area will
likely not be absolute. As crop biomass within a non-hunting area is reduced due to feeding,
geese may be forced outside to find suitable food despite the risk of being shot (van Eerden
1997).
The proportion of young birds in the flock may also influence the degree to which fields
outside the Alaksen National Wildlife Area are used. Juveniles and their associated family
groups may venture outside the safety of the Alaksen National Wildlife Area for two reasons.
First, naive juveniles have no former experience of hunting risk and therefore may lead their
family group into hunting areas. Second, juveniles have a greater demand for protein than
adults (Raveling and Zezulak 1991). For both reasons juveniles are likely more risk tolerant,
and family groups with juveniles may feed outside the Alaksen National Wildlife Area as food
within is depleted. Therefore, if the proportion of juveniles in the flock is high, the incidence of
feeding outside the Alaksen National Wildlife Area may be correspondingly high.
Chapter Objectives
In this chapter, I examine the patterns of agricultural field use by Snow Geese to
determine if habitat (crop) type, hunting, field area, and week period influence field use. I
determine if crop types were used differentially (e.g., certain types used more than others), if
field use was limited on fields that were open to hunting, and if use varied with field size and
week.
23

METHODS
Study Period and Study Area
The study period was defined by the arrival and departure dates of Snow Geese on the
Fraser delta, beginning in September 2005 and continuing until April 2006. During most years,
Snow Geese arrive on the delta between late September and mid-October (Boyd 1995) and
remain until mid-January, at which time almost all move south to the Skagit River delta. The
geese usually return between late February and early March, before migrating to northern
staging areas between mid and late April (Boyd 1995). The study area comprised Westham
Island and Brunswick Point, as far east as 41B Avenue (Figure 5). The boundaries were based
on previous work by Boyd (1995) which indicated that Snow Geese did not use agricultural
fields outside of this area.
Agricultural Habitat Classification and Field Identification
Crop type on all fields within the study area was recorded in the late summer of 2005.
Agricultural fields were classified as one of 12 habitat types based on crop type and crop
characteristics (Table 1). Crop identifications were converted into a shape file using ArcMap
9.2 (ESRI) which was used to calculate the area of each field. Fields were surveyed again in
October 2005 to identify which fields contained cover crops. I did not differentiate between the
different cole crops, the legumes (bean, pea) or the different berry crops (strawberry, raspberry,
blueberry). Use of these crop types by Snow Geese was nominal.
24
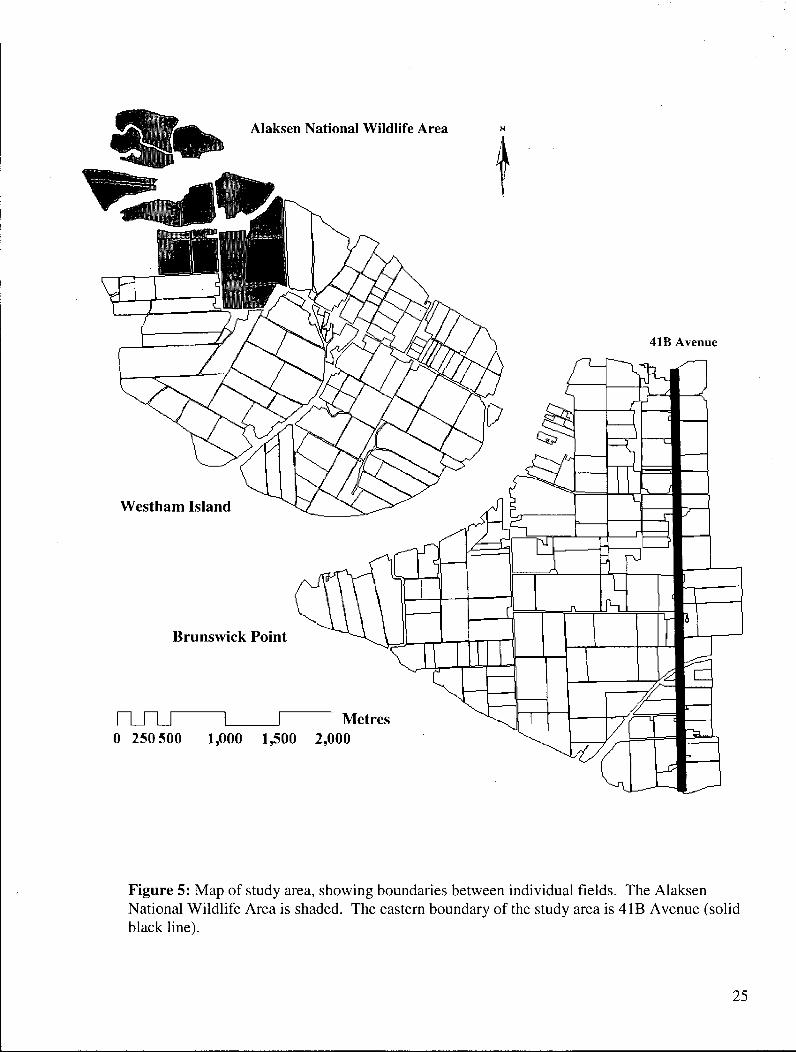
F i g u r e 5: Map of study area, showing boundaries between individual fields. The Alaksen National Wildlife Area is shaded. The eastern boundary of the study area is 4IB Avenue (solid black line).
25

Table 1: Classification of different crops into habitat types, and their associated characteristics.
Habitat Type Characteristics Berry Includes blueberry, strawberry, raspberry and mixed berry plantings;
berry crops have bare soil or grass between rows. Potato Fields are harvested and cull potatoes are found buried in the soil
(partially or completely), or resting on the soil surface. Crop Residue/ Bare
This large category contains a mix of crops that received little use from Snow Geese. Harvested bean or pea fields, where very little biomass remains; cole crops, including cabbage, broccoli, rutabagas, and turnips, these crops are harvested and the remains of the plant are left to rot on the field; weedy growth; miscellaneous vegetable; and harvested and unharvested pumpkin remains; bare fields with no vegetation.
Perennial Forage
Perennial forage fields cut for hay, grazed as pasture, or both; mix of species within these fields varies, but common grasses are orchard grass and tall fescue. Clover may also be present.
Cover Crop Late summer/early fall sown cereals comprised of winter wheat, barley, rye grass, or oats.
Barley Grain Grain either intentionally left standing, or unharvested; the seed head is left on the plant. This crop, found almost exclusively on the Alaksen National Wildlife Area is under seeded with a forage mix.
Grain Stubble Grain that has been harvested; the stems of the harvested plant and spilt seeds remain, as well as any planted forage or volunteer grass that may be growing between the stubble.
Corn The stubble of harvested corn, or occasionally unharvested corn; the corn stalk and culled ears are left on the field to rot.
Grassland Set-aside
Grass land set-asides, ranging in age from 1 to 4 years; grass is generally taller and thicker in older set-asides.
Greenhouse Land covered by glass greenhouses; greenhouses usually occupy almost all of a field
Miscellaneous Vegetables
Market garden vegetables grown in relatively small plots of land; residues left on field after harvest.
Unknown Crop fields not identified.
A field was defined as a contiguous area of one crop type. Large fields with more than
one crop were divided into smaller fields based on crop type. Fields that contained similar crop
types but were separated by a barrier (e.g. hedgerow, trees, fences, and ditches) were also
classified as separate fields.
26
Transects
The use of agricultural fields by Snow Geese was quantified by estimating the number of
geese using different crop types. A survey transect was established that followed the major and
minor roads of Westham Island and Brunswick Point. The transect route allowed surveillance
of almost every field (> 98%) within the study area.
An observer drove the transect 3 times/day, starting at 09:00, 12:00, and 15:00 hours
(Pacific Standard Time). Whenever a flock numbering more than -25 individuals was spotted,
the observer would stop and estimate the flock size. A spotting scope (20X60 zoom) was used
to estimate large flocks or flocks that were on fields far from the transect route. The time of the
survey, crop type, and flock location were recorded on a map; the map was later compared to a
GIS shape file to confirm the crop's identity.
Surveys were conducted daily from 14 October 2005 until 12 November 2005 and 6
days a week from 13 November 2005 until 19 January 2005. Surveys were ceased on 20
January 2006 by which time almost all geese were on the Skagit River delta. When I traversed
the study area to conduct biomass sampling, no geese were seen on fields between 20 January
2005 and 1 March 2005. Transects were resumed on 1 March 2005 when Snow Geese began
returning from the Skagit River delta. Surveys continued 6 days/week until 27 April 2005 at
which time < 100 Snow Geese were seen using agricultural fields (of these, many were
juveniles and/or injured birds).
Snow Geese occasionally use fields during the night (J. Zellweger, pers. comm., winter
2005; pers. obs.) but because of the logistical difficulties of locating flocks in the dark, I did not
quantify nocturnal use. I assume that night feeding by Snow Geese was an infrequent event
during my study, although reports from 2006/07 indicate that night feeding is becoming an
27
increasingly frequent behaviour on the Skagit River delta (M. Axelson. pers. comm. 29 Jan
2007)
Correcting Flock Size Estimations
Estimates of flocks with more than 2000 individuals tend to be biased low (Boyd 2000).
I used a correction factor developed from photographic counts to correct for potential observer
bias in estimates of flock size. Following Boyd's (1995; 2000) method of estimating Snow
Goose numbers from aerial photographs, I used photographs of flocks taken from the ground to
determine flock size. Flocks were photographed 3 times in December 2005, twice in March
2006, and twice in April 2006. Observers estimated the flock size concurrently with the
photographs being taken. Each observer recorded his/her estimate separately to avoid
influencing the other observer's estimates.
It was assumed that photograph counts were error free although this assumption is not
entirely correct; birds were occasionally obscured behind others due to the shallow angle that
the photographs were taken at. This biased some of the flock counts low, but I assumed that this
was not by an appreciable amount. I used the photographic counts to produce a correction
factor for each observer that was applied to flock estimates > 500 birds.
Statistical Analysis
To quantify field use, I organized all flock estimates by individual fields over 29 one-
week periods. Counts were corrected for survey effort (e.g., the number of surveys conducted
per week) (after Hobaugh 1984). Counts were summed across individual survey times (e.g.
09:00, 12:00, or 15:00) each week and divided by the number of surveys for that week. These
weighted averages were summed and then divided by 3 (the number of daily time periods
28

surveyed) to obtain a weighted daily average for each week. I calculated goose density of the i
field in the j t h week as follows:
Use of Fieldj.Weekj = [((Scount09oo)/no9oo + (£counti2oo)/ni2oo + (2counti5oo)/ni5oo))/3]/areai
where n x is the number of surveys conducted during the x t h time period during week j ,
and areaj is the area (ha) of the i t h field.
Many of the fields within the study area were never used. Following the methods of
Summers and Critchley (1990), I compared used fields to unused fields with standard
(dichotomous) logistic regression to determine the effect of crop type, field size, week period
and hunting risk. Eleven models were assessed using logistic regression. Following the
methods of Zydelis et al. (2005) for modelling scoter {Melanitta spp.) habitat use, I used
multiple regression to determine if crop type, week period, and hunting were important factors
in determining goose density. I modelled the goose density per field using a negative binomial
distribution (after Moore and Black 2006). This distribution is appropriate when the variance of
the response variable is expected to be greater than that of a Poisson distribution due to the
clumping of observations (Waite 2000; Manly et al. 2002). Eight models were assessed using
multiple regression. Table 2 provides definitions of the different parameters used in the models.
I separated the analysis into 2 time periods, F A L L (14 October 2005 to 20 January 2006) and
SPRING (1 March to 27 April 2006). Note that the F A L L period extends from late fall to mid
winter, and the SPRING period extends from late winter to early spring.
I re-coded two field types to adequately describe the vegetation on those fields. Cover
crops planted on potato fields were initially coded as cover crops, but were re-coded in
December as potato fields after the grass was grazed off. Barley grain was re-coded as
29
perennial forage fields in SPRING because all barley biomass had been depleted (Chapter 4).
Qualitative observations of barley fields indicated that under-sown forage mixes were growing
through the trampled barley stalks. Although there was overlap in use of vegetation on these
fields (e.g., geese grubbed for potatoes while still grazing cover crops on the same field), I
assumed this was infrequent and that the majority of foraging was limited to one vegetation type
at a time.
Table 2: Definitions of the different parameters that were evaluated in the logistic and multiple regression models. Note that because I use the FIELD SIZE parameter to determine goose density, it was not used in the multiple regression models.
Variable Variable Description Measure CROP Grouping of class variables that contains each crop Class variables;
type in the study area (see Table 1 for definition of one class variable each crop) is set as reference
HUNTING Whether a field is exposed to hunting; fields not Binary coding; hunted are those within the A N W A or all fields 1 = no hunting outside of the hunting season* 0 = hunting
FIELD The area of an agricultural field Continuous SIZE variable (ha) W E E K Grouping of class variables that defines the week Class variable
period F A L L : 1-15 SPRING: 21-29
*Snow Geese were sometimes shot at by farmers with scare permits after the close of the hunting season. Scaring was sporadic and determining which fields were protected was difficult, so all fields received a "1" classification following the close of the hunting season.
I assessed the importance of model parameters generated from the logistic and multiple
regressions using an information-theoretic approach. The maximum likelihood values generated
by the regression procedure were used to calculate AIC C (Akaike's Information Criterion for
small sample size). Because the count data used in the multiple regression models were over-
dispersed (c > 1), QAIC C was used in place of AIC C (Burnham and Anderson 2002). I assessed
the explanatory value of each model by ranking them by their AAIC C (logistic regression) or
A Q A I Q (multiple regression). The values AAIC C and AQAIC C are equal to the differences
30

between the A I Q or Q A I Q of each model to that of the best-fitting model (lowest AIC C or
QAIQ).
I used Akaike weights (WJ) as a measure of model likelihood and R 2 values as a measure
of overall model fit. To measure the strength of each explanatory variable, I summed the
Akaike weights of each model that contained the variable of interest. This provided a parameter
likelihood value that measured the ability of the variable of interest to explain variation in the
response.
Estimates of model parameters may vary between models and there can be uncertainty as
to which is the most accurate parameter estimate. I used model averaging to reduce this
uncertainty and obtain an estimate of each parameter generated by the multiple regression
(Burnham and Anderson 2002). I used the Akaike weights of each model that contained the
parameter of interest to obtain a weighted average of the parameter. CROP and W E E K
parameters were included as a group. One of the category values in each group was set to zero
to act as a reference for the rest of the parameter estimates (barley grain in F A L L , potato in
SPRING). I also used the Akaike weights to calculate unconditional standard errors for each
parameter estimate. The individual parameter estimates for each category in CROP and W E E K
shared a common Akaike weight because they were always entered into a model as a group. No
model averaging was necessary for the parameters generated by the logistic models as the
highest rated model had an Akaike weight greater than 0.90 (Burnham and Anderson 2002).
Because parameters were not averaged for the logistic models, there was no need to calculate
unconditional standard errors.
To assess patterns of crop use, I relied on the regression models to determine if there was
differential use of crop types. I plotted the percentage of total use of each crop type to illustrate
the order and relative usage that each crop type received during F A L L and SPRING. I
31
constructed a Jacob's Index (a resource selection index), for each crop type in each month to
depict patterns of crop use. The Jacob's Index compares use to availability with values ranging
from -1 to <0 inferring avoidance and values from >0 to +1 inferring selection (Jacobs 1974).
Resource selection indices are commonly used in studies of habitat selection. The nature of the
data, however, prevented further statistical analysis using this method. A x 2 statistic is
traditionally calculated to determine if animals select habitats at random (use = availability) or
differentially (use > availability when habitats are selected, use < availability when habitats are
avoided) (Manly et al. 2002). Confidence intervals are then used to determine which crops are
selected over others (Neu et al. 1974; Cherry 1996). However, one of the assumptions of the %
test is that observations of individuals are independent (Manly et al. 2002). Observations of
Snow Geese are not independent because the birds are highly gregarious. Furthermore, the
flocking nature of Snow Geese makes the use of confidence intervals for determining which
crop types are selected over others inappropriate; large flocks would artificially inflate the
sample size used to calculate the confidence intervals, increasing the likelihood of a Type I error
(Aebischer and Robertson 1993). Despite the lack of formal hypothesis testing, I argue that the
Jacob's Index helps to illustrate order of crop use. Similar selection indexes have been
employed in studies of wild geese and agriculture (Newton and Campbell 1973; Hobaugh 1984;
Madsen 1985a; Davis et al. 1989; Gi l l 1996).
R E S U L T S
Crop Use Patterns
Barley grain, potato, and cover crop fields were used heavily between W E E K 1 and
W E E K 7 (Figure 6). An increased use of perennial forage fields was observed subsequent to
W E E K 7 as use of the former crops began to decrease. The increasing number of perennial
32
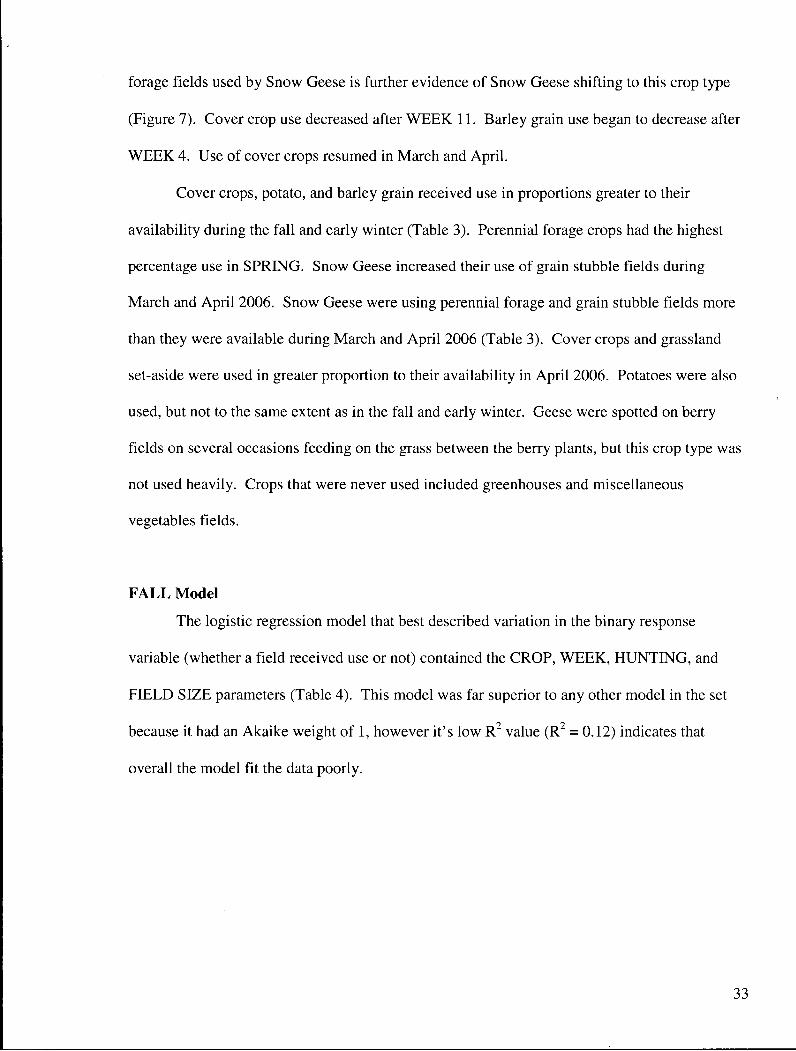
forage fields used by Snow Geese is further evidence of Snow Geese shifting to this crop type
(Figure 7). Cover crop use decreased after W E E K 11. Barley grain use began to decrease after
W E E K 4. Use of cover crops resumed in March and April.
Cover crops, potato, and barley grain received use in proportions greater to their
availability during the fall and early winter (Table 3). Perennial forage crops had the highest
percentage use in SPRING. Snow Geese increased their use of grain stubble fields during
March and April 2006. Snow Geese were using perennial forage and grain stubble fields more
than they were available during March and April 2006 (Table 3). Cover crops and grassland
set-aside were used in greater proportion to their availability in April 2006. Potatoes were also
used, but not to the same extent as in the fall and early winter. Geese were spotted on berry
fields on several occasions feeding on the grass between the berry plants, but this crop type was
not used heavily. Crops that were never used included greenhouses and miscellaneous
vegetables fields.
F A L L Model
The logistic regression model that best described variation in the binary response
variable (whether a field received use or not) contained the CROP, W E E K , HUNTING, and
FIELD SIZE parameters (Table 4). This model was far superior to any other model in the set
because it had an Akaike weight of 1, however it's low R 2 value (R 2 = 0.12) indicates that
overall the model fit the data poorly.
33
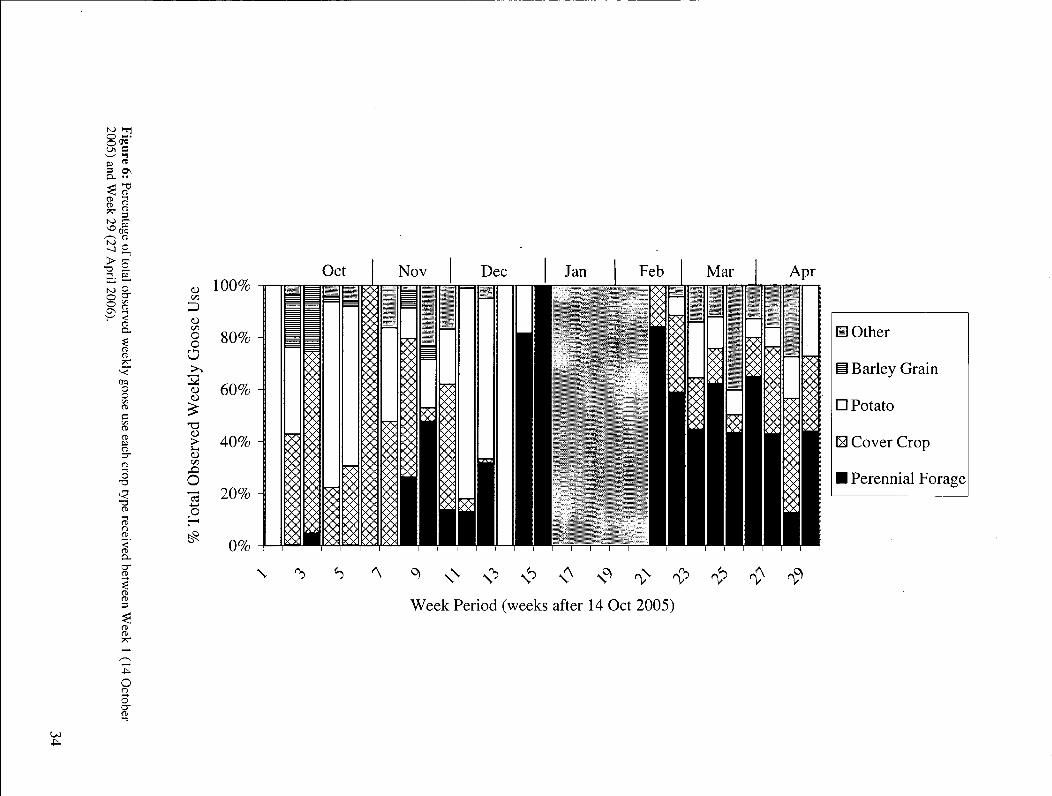
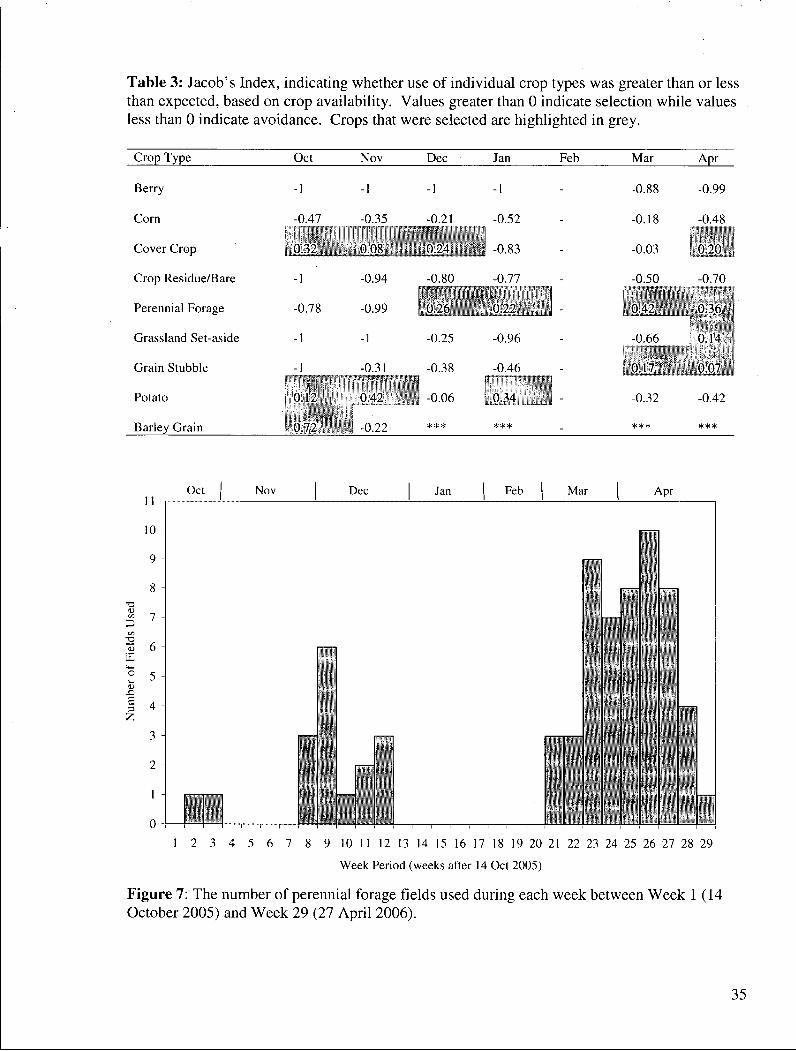
Table 3: Jacob's Index, indicating whether use of individual crop types was greater than or less than expected, based on crop availability. Values greater than 0 indicate selection while values less than 0 indicate avoidance. Crops that were selected are highlighted in grey.
Crop Type Oct Nov Dec Jan Feb Mar Apr
Berry -1 -1 -1 -1 -0.88 -0.99
Corn -0.47 -0.35 -0.21 -0.52 1
-0.18 -0.48
Cover Crop 0.32 0.0^ _J)_24 -0.03 , 0.20 ,
Crop Residue/Bare -1 -0.94 -0 KO 0 -0.50 -0.70
Perennial Forage -0.78 -0.99 '.0 26 0 42 o.vs
Grassland Set-aside -1 -1 -0.25 -0.96 -0.66_ 0.14
Grain Stubble -1 -0.31 -0.38 -0.46 0 17 0.07, •
Potato 0.12 0.42 • j -0.06 . 0.34 -0.32 -0.42
Barley Grain 0 72 -0.22 *** ***
Oct 1 Nov 1 11 1 1
Dec | Jan 1 F e b 1 Mar j Apr
10 -
9 -
8 1
3 - I— I— I I— j—
2 - I—
1 - | 1 1 ;
0 —— I— i— i i 1 1—I I—I—I—i 1 1 1 1 1 1 1—[—I—I—I—I—I—I—I— 1 2 3 4 5 6 7 8 9 10 11 12 13 14 15 16 17 18 19 20 21 22 23 24 25 26 27 28 29
Week Period (weeks after 14 Oct 2005)
Figure 7: The number of perennial forage fields used during each week between Week 1 (14 October 2005) and Week 29 (27 April 2006).
35

Table 4: Competing models used in the F A L L logistic regression and their associated R , AAICc, A I C W values.
Model R 2 AAICc AIC W
Crop + Week + Hunting + Field Size 0.12 0 1.00
Crop + Week + Hunting 0.09 103.44 0.00
Crop + Week 0.09 112.63 0.00
Crop + Field Size 0.07 131.56 0.00
Field Size 0.05 191.02 0.00
Crop + Hunting 0.05 222.84 0.00
Crop • 0.05 231.84 0.00
Crop + Week + Hunting + Field Size + Crop*Week 0.14 257.15 0.00
Hunting 0.00 357.30 0.00
Intercept (Null) 0.00 362.20 0.00
Crop+ Week +Crop*Week 0.11 375.14 0.00
The estimate of the HUNTING parameter was positive, indicating that Snow Geese
likely selected fields that were within the Alaksen National Wildlife Area when possible (Table
5). There was support for FIELD SIZE, indicating that field size positively influenced whether
a field was used. CROP was an important grouping of variables, indicating that there was
differential selection of crops in F A L L . A l l of the crop types that were used by Snow Geese in
F A L L received positive parameter estimates, with no clear differentiation among them.
Greenhouses, berry, and miscellaneous vegetable fields were not used by Snow Geese and
accordingly had negative parameter estimates and large standard errors.
36
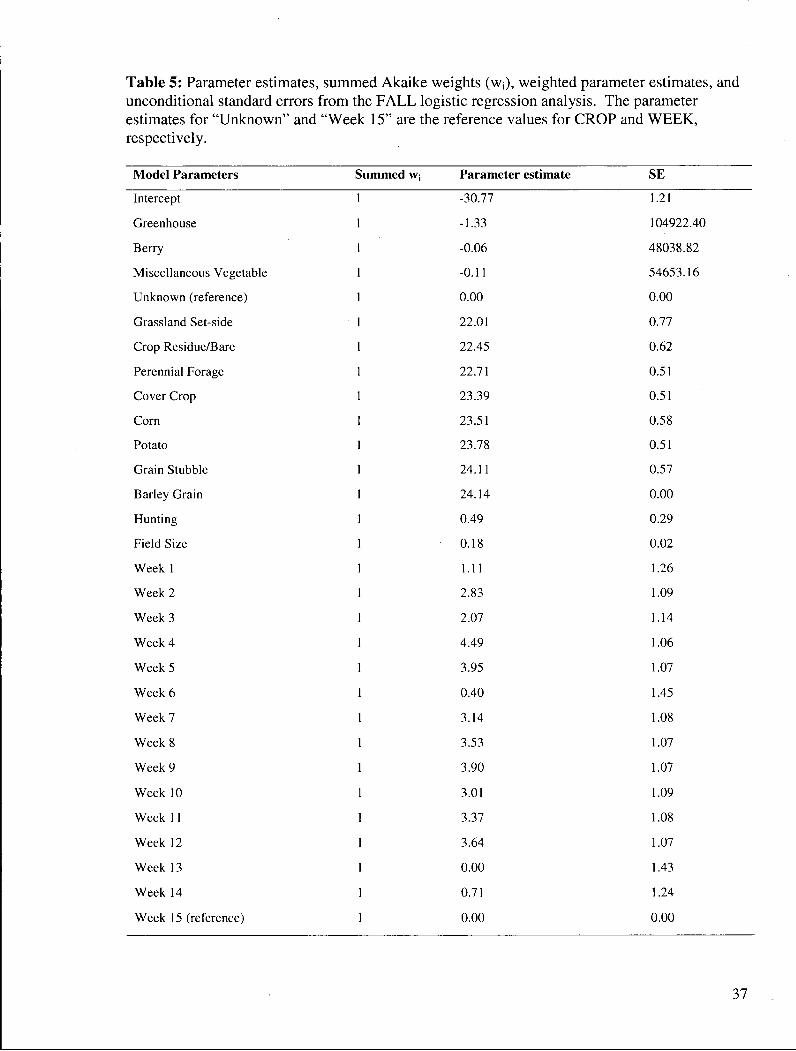
Table 5: Parameter estimates, summed Akaike weights (WJ), weighted parameter estimates, and unconditional standard errors from the F A L L logistic regression analysis. The parameter estimates for "Unknown" and "Week 15" are the reference values for CROP and W E E K , respectively.
Model Parameters Summed w. Parameter estimate SE
Intercept 1 -30.77 1.21
Greenhouse 1 -1.33 104922.40
Berry 1 -0.06 48038.82
Miscellaneous Vegetable 1 -0.11 54653.16
Unknown (reference) 1 0.00 0.00
Grassland Set-side 1 22.01 0.77
Crop Residue/Bare 1 22.45 0.62
Perennial Forage 1 22.71 0.51
Cover Crop 1 23.39 0.51
Corn 1 23.51 0.58
Potato 1 23.78 0.51
Grain Stubble 1 24.11 0.57
Barley Grain 1 24.14 0.00
Hunting 1 0.49 0.29
Field Size 1 0.18 0.02
Week 1 1 1.11 1.26
Week 2 1 2.83 1.09
Week 3 1 2.07 1.14
Week 4 1 4.49 1.06
Week 5 1 3.95 1.07
Week 6 1 0.40 1.45
Week 7 1 3.14 1.08
Week 8 1 3.53 1.07
Week 9 1 3.90 1.07
Week 10 1 3.01 1.09
Week 11 1 3.37 1.08
Week 12 1 3.64 1.07
Week 13 1 0.00 1.43
Week 14 1 0.71 1.24
Week 15 (reference) 1 0.00 0.00
37
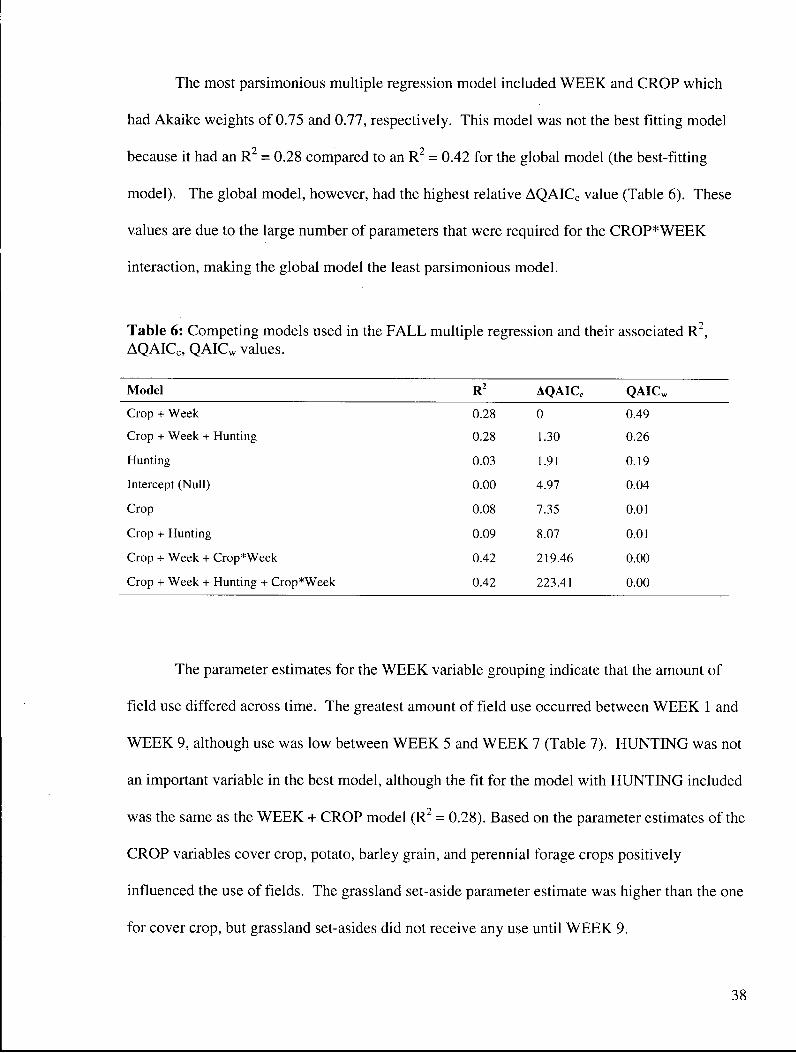
The most parsimonious multiple regression model included W E E K and CROP which
had Akaike weights of 0.75 and 0.77, respectively. This model was not the best fitting model
because it had an R 2 = 0.28 compared to an R 2 = 0.42 for the global model (the best-fitting
model). The global model, however, had the highest relative AQAIC C value (Table 6). These
values are due to the large number of parameters that were required for the CROP*WEEK
interaction, making the global model the least parsimonious model.
Table 6: Competing models used in the F A L L multiple regression and their associated R 2 , AQAIC C , QAIC W values.
Model R 2 AQAICC QAIC W
Crop + Week 0.28 0 0.49
Crop + Week + Hunting 0.28 1.30 0.26
Hunting 0.03 1.91 0.19
Intercept (Null) 0.00 4.97 0.04
Crop 0.08 7.35 0.01
Crop + Hunting 0.09 8.07 0.01
Crop + Week + Crop*Week 0.42 219.46 0.00
Crop + Week + Hunting + Crop*Week 0.42 223.41 0.00
The parameter estimates for the W E E K variable grouping indicate that the amount of
field use differed across time. The greatest amount of field use occurred between W E E K 1 and
W E E K 9, although use was low between W E E K 5 and W E E K 7 (Table 7). HUNTING was not
an important variable in the best model, although the fit for the model with HUNTING included
was the same as the W E E K + CROP model (R 2 = 0.28). Based on the parameter estimates of the
CROP variables cover crop, potato, barley grain, and perennial forage crops positively
influenced the use of fields. The grassland set-aside parameter estimate was higher than the one
for cover crop, but grassland set-asides did not receive any use until W E E K 9.
38
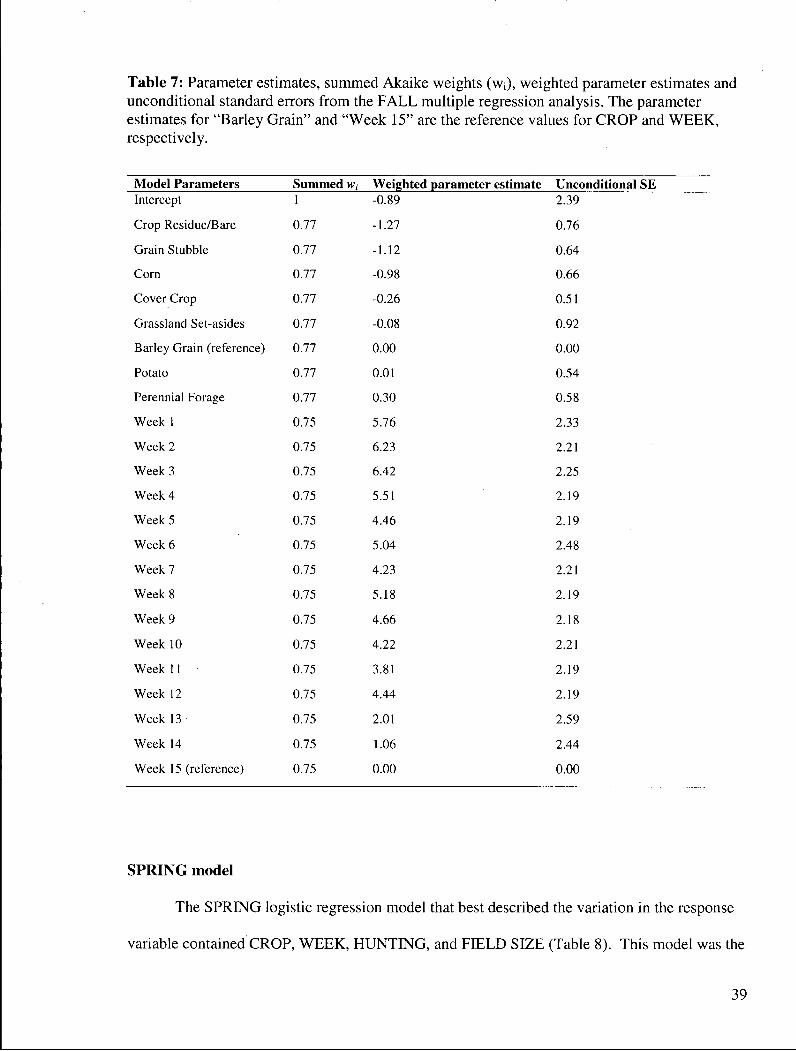
Table 7: Parameter estimates, summed Akaike weights (WJ), weighted parameter estimates and unconditional standard errors from the F A L L multiple regression analysis. The parameter estimates for "Barley Grain" and "Week 15" are the reference values for CROP and W E E K , respectively.
Model Parameters Summed w,- Weighted parameter estimate Unconditional SE Intercept 1 -0.89 2.39
Crop Residue/Bare 0.77 -1.27 0.76
Grain Stubble 0.77 -1.12 0.64
Corn 0.77 -0.98 0.66
Cover Crop 0.77 -0.26 0.51
Grassland Set-asides 0.77 -0.08 0.92
Barley Grain (reference) 0.77 0.00 0.00
Potato 0.77 0.01 0.54
Perennial Forage 0.77 0.30 0.58
Week 1 0.75 5.76 2.33
Week 2 0.75 6.23 2.21
Week 3 0.75 6.42 2.25
Week 4 0.75 5.51 2.19
Week 5 0.75 4.46 2.19
Week 6 0.75 5.04 2.48
Week 7 0.75 4.23 2.21
Week 8 0.75 5.18 2.19
Week 9 0.75 4.66 2.18
Week 10 0.75 4.22 2.21
Week 11 0.75 3.81 2.19
Week 12 0.75 4.44 2.19
Week 13 0.75 2.01 2.59
Week 14 0.75 1.06 2.44
Week 15 (reference) 0.75 0.00 0.00
SPRING model
The SPRING logistic regression model that best described the variation in the response
variable contained CROP, W E E K , HUNTING, and FIELD SIZE (Table 8). This model was the
39

same as the one that best explained variation in the F A L L response variable. It was one of the
best fitting models (R 2 = 0.14) but this low R 2 value indicates that the model results should be
interpreted with caution,.
Table 8: Competing models used in the SPRING logistic regression and their associated R 2 , AAICc, A I C W values.
Model R 2 AAICc AIC W
Crop + Week + Hunting + Field Size 0.14 0 1.00
Crop + Week + Hunting 0.11 78.39 0.00
Crop + Field Size 0.09 103.09 0.00
Crop + Week 0.09 125.92 0.00
Crop + Hunting 0.08 140.19 0.00
Field Size 0.06 169.05 0.00
Crop 0.06 187.90 0.00
Hunting 0.02 255.10 0.00
Crop + Week + Hunting + Field Size + Crop*Week 0.16 125.73 0.00
Intercept 0.00 306.20 0.00
Crop + Week + Crop*Week 0.12 251.58 0.00
The parameter estimate for HUNTING was positive (Table 9), although the inference
gained from this value is weak because the Snow Goose hunting season closed on 14 March
2006 (WEEK 23), effectively allowing geese to use any field free of hunting pressure. As with
the F A L L model, FIELD SIZE was an important variable. C R O P was an important set of
variables, indicating that Snow Geese selected crops differentially. Time (WEEK variable
grouping) was also and important factor in explaining variation in the number of fields used
throughout the spring.
40
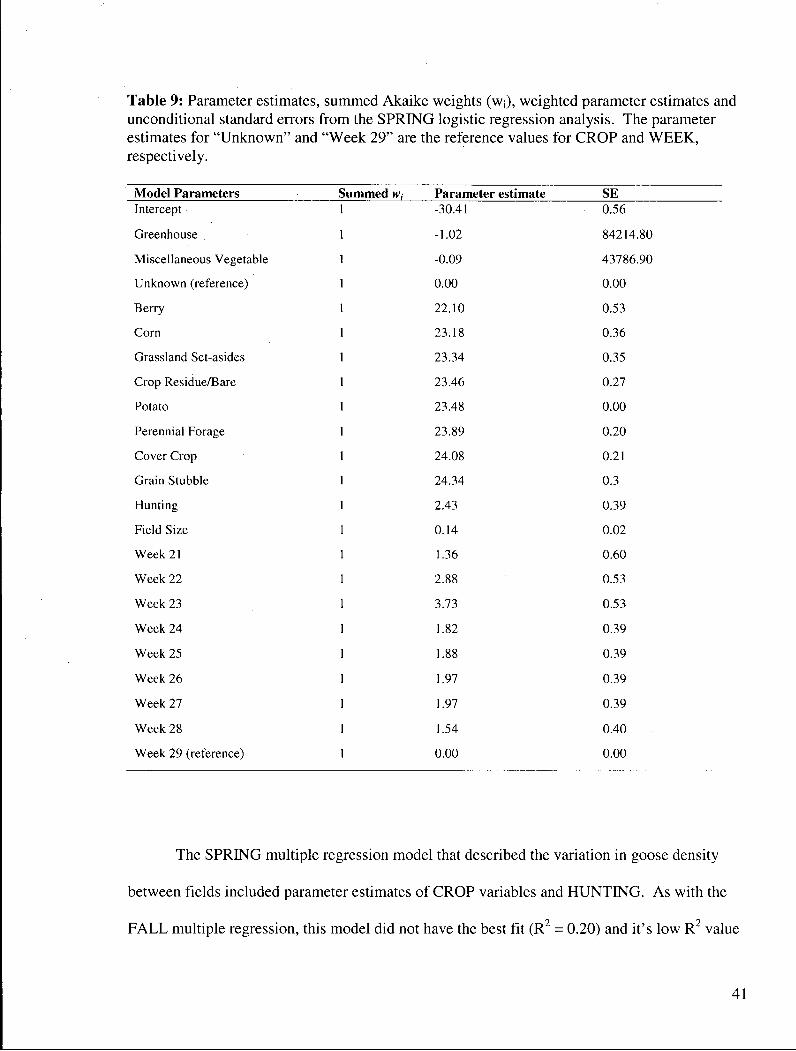
Table 9: Parameter estimates, summed Akaike weights (WJ) , weighted parameter estimates and unconditional standard errors from the SPRING logistic regression analysis. The parameter estimates for "Unknown" and "Week 29" are the reference values for CROP and W E E K , respectively.
Model Parameters Summed M>, Parameter estimate SE Intercept 1 -30.41 0.56
Greenhouse 1 -1.02 84214.80
Miscellaneous Vegetable 1 -0.09 43786.90
Unknown (reference) 1 0.00 0.00
Berry 1 22.10 0.53
Corn 1 23.18 0.36
Grassland Set-asides 1 23.34 0.35
Crop Residue/Bare 1 23.46 0.27
Potato 1 23.48 0.00
Perennial Forage 1 23.89 0.20
Cover Crop 1 24.08 0.21
Grain Stubble 1 24.34 0.3
Hunting 1 2.43 0.39
Field Size 1 0.14 0.02
Week 21 1 1.36 0.60
Week 22 1 2.88 0.53
Week 23 1 3.73 0.53
Week 24 1 1.82 0.39
Week 25 1 1.88 0.39
Week 26 1 1.97 0.39
Week 27 1 1.97 0.39
Week 28 1 1.54 0.40
Week 29 (reference) 1 0.00 0.00
The SPRING multiple regression model that described the variation in goose density
between fields included parameter estimates of CROP variables and HUNTING. As with the
F A L L multiple regression, this model did not have the best fit (R 2 = 0.20) and it's low R 2 value
41

suggests that results should be interpreted with caution. The global model was the best fitting
model, but like the F A L L model, had the highest A Q A I Q due to the large number of parameters
for the CROP*WEEK interaction (Table 10).
Table 10: Competing models used in the SPRING multiple regression and their associated R 2 , A Q A I C C , QAICw values.
Model R 2 AQAICC QAIC W
Crop + Hunting 0.20 0 0.80
Crop 0.17 3.32 0.15
Crop + Week 0.30 6.17 0.04
Crop + Week + Hunting 0.30 8.59 0.01
Intercept (Null) 0.00 21.24 0.00
Hunting 0.00 22.70 0.00
Crop + Week+ Crop*Week 0.43 154.74 0.00
Crop + Week+ Hunting + Crop*Week 0.43 158.52 0.00
The Wj for the parameters CROP and HUNTING were 1 and 0.81, respectively (Table
11). This model indicated that there was no differential amount of use over time, unlike the
F A L L multiple regression model. Similar to the logistic regression model, the HUNTING
parameter should be interpreted with caution due to the close of the hunting season in W E E K 23
which effectively made all fields in the study area free from hunting.
Unlike crop use in F A L L , there was no clearly defined crop switch, but a wider variety
of crops were used. Crop types that showed the highest individual parameter estimates were
perennial forage, grain stubble, grassland set-asides, crop residues, and cover crops.
42

Table 11: Parameter estimates, summed Akaike weights (WJ), weighted parameter estimates and unconditional standard errors from the SPRING multiple regression analysis. The parameter estimate for "Potato" is the reference value for CROP.
Model Parameters Summed \V; Weighted parameter estimate Unconditional SE Intercept 1 -1.78 1.60
Berry 1 -0.05 0.57
Potato (reference) 1 0.00 0.00
Corn 1 0.29 0.36
Cover Crop 1 0.64 0.19
Crop Residue/Bare 1 0.75 0.26
Grassland Set-asides 1 0.78 0.35
Grain Stubble 1 1.20 0.27
Perennial Forage 1 1.33 0.19
Hunting 0.81 -0.36 0.24
Use of Alaksen National Wildlife Area
Snow Geese initially used the Alaksen National Wildlife Area in F A L L (Figure 8).
Snow Geese began to use fields outside of the Alaksen National Wildlife Area beginning in
W E E K 4 and continued to use these almost exclusively W E E K 15. Snow Geese made mixed
use of the Alaksen National Wildlife Area and the fields outside the area in SPRING. There
was no clear pattern to use of the Alaksen National Wildlife Area.
43
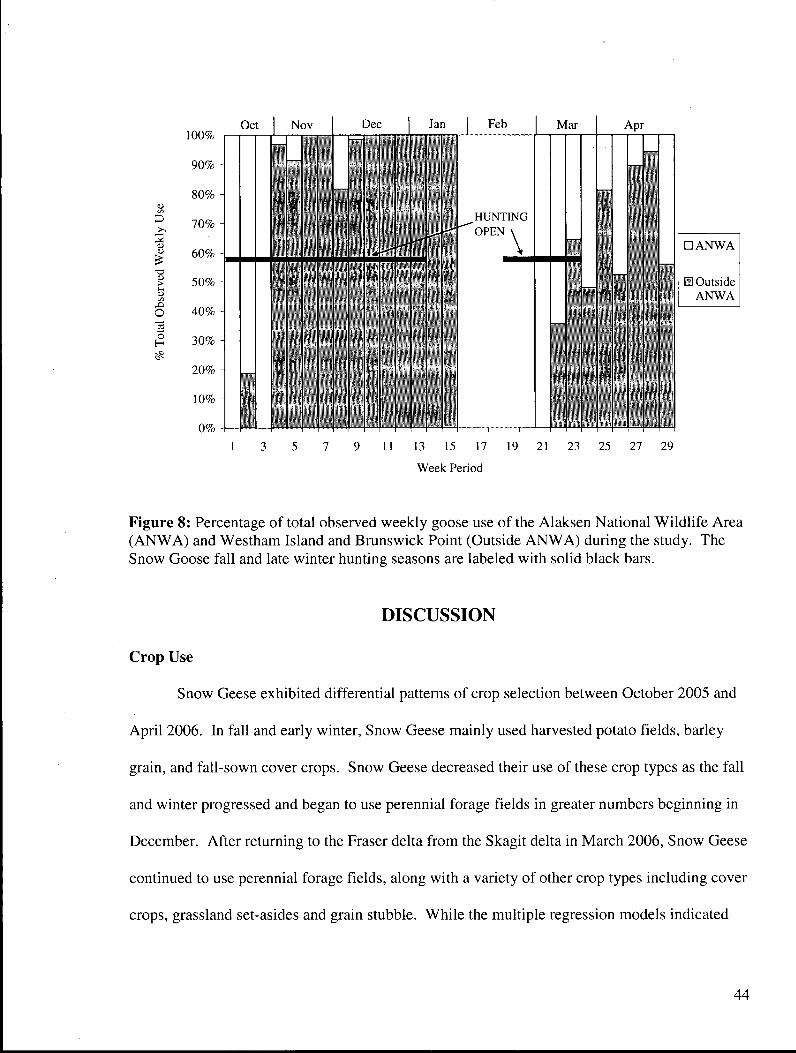
-a >
.0 O o
H i
100%
90% H
Oct
70%
60%
50%
40%
30%
20%
10%
0%
Nov Dec
1 3 5 7
Jan Feb Mar
.HUNTING OPEN \
Apr
• A N W A
H Outside A N W A
11 13 15 17 19 21 23 25 27 29
Week Period
Figure 8: Percentage of total observed weekly goose use of the Alaksen National Wildlife Area (ANWA) and Westham Island and Brunswick Point (Outside ANWA) during the study. The Snow Goose fall and late winter hunting seasons are labeled with solid black bars.
DISCUSSION
Crop Use
Snow Geese exhibited differential patterns of crop selection between October 2005 and
April 2006. In fall and early winter, Snow Geese mainly used harvested potato fields, barley
grain, and fall-sown cover crops. Snow Geese decreased their use of these crop types as the fall
and winter progressed and began to use perennial forage fields in greater numbers beginning in
December. After returning to the Fraser delta from the Skagit delta in March 2006, Snow Geese
continued to use perennial forage fields, along with a variety of other crop types including cover
crops, grassland set-asides and grain stubble. While the multiple regression models indicated
44

that crops were selected differentially, the low R 2 of the models indicates that the models poorly
reflect the biology of the system.
Differential patterns of crop use are likely due to the availability of preferred crop types.
Greater Snow Geese wintering in Delaware exhibited a marked switch from feeding on corn
between October and January to grain fields in February after the corn had been depleted (Hill
and Fredrick 1997). Pink-footed Geese switched from feeding on pasture grasses to newly-
sown grain fields during spring staging in Denmark because energy intake was higher on the
newly sown fields (Madsen 1985c). Dark-bellied Brant Geese wintering in Norfolk, England
exhibited a switch from a natural habitat, algal beds, to agricultural habitats and salt marshes
when algal biomass was depleted (Rowcliffe et al. 2001). Dark-bellied Brant wintering in West
Sussex, England switched from winter cereals to pasture grasses in early winter, possibly to first
maximize protein intake (on cereals) and later energy intake (on pasture grasses) (McKay et al.
1994).
Geese tend to select foods that contain high concentrations of digestible proteins and
soluble carbohydrates and tend to avoid foods that are high in indigestible fibres (Drescher et al.
2006). Foods that impart the greatest net intake of energy and protein (the most profitable) will
be used first followed by less profitable foods after the former have been depleted below a given
threshold (Rowcliffe et al. 1999). In this study, cover crops, potatoes, and barley grain were
likely more profitable than perennial forage grasses. Profitability and its relation to food
availability and nutrient content are discussed in greater detail in Chapter 4.
Snow Geese used similar crop types as those used between 1995 and 2000 (Chapter 2).
Interestingly, Snow Geese made greater use of perennial forage grass earlier in the fall during
the 1990s and it appeared that there was no switch from cover crops, barley grain, and potato
habitats to perennial forage habitats. In 2 of the years (1995-96, 1997-98) perennial forage
45
fields were used before cover crops. These results seem counter to the use observed in 2005-06.
It is difficult to explain these patterns of use without data pertaining to the availability of
different crop types during the earlier years.
It is possible that between 1995 and 2000 hunting influenced flock movements to a
greater extent than during my study. Between 1995 and 1999 Snow Geese made almost
exclusive use of the Alaksen National Wildlife Area during October and November (Chapter 2).
The geese may have remained within the Alaksen National Wildlife Area to avoid hunting, even
if preferred crop types were outside of the area. In contrast, geese ventured outside the safety of
the Alaksen National Wildlife Area much earlier in 2005 (second week of November) despite an
open hunting season.
The inference of crop use patterns that can be drawn from this study is limited because
data were collected only over one year. Long term data sets are crucial to understanding habitat
use patterns of long-lived birds, especially because factors that influence habitat use (e.g. crop
availability and hunting pressure) change from year to year. The study year was atypical,
because the Fraser-Skagit population was the highest ever recorded (ca. 80,000 individuals) and
contained the highest proportion of juvenile bird ever recorded (ca. 32,000 individuals).
Because juveniles may influence field choice, the results of this study should be interpreted
cautiously. Additionally, geese exhibit site philopatry on wintering grounds (Black et al. 1991)
and new patterns may form gradually. The historical data do provide some comparison but is
limited without crop area data between 1995 and 2000. Future studies should continue to
monitor patterns of field use by Snow Geese, along with crop availability. Research that
quantifies patterns of field use on the Skagit River delta would also provide a comparison to
data collected on the Fraser River delta.
46

Field Size
Field size was an important variable in determining if a field was used by Snow Geese,
as indicated by the logistic regression model that explained the greatest variation in the binary
response variable (whether or not a field was used). However, the low R 2 value this model
indicates that this result should be interpreted with caution. Snow Geese tended to use larger
fields more than smaller fields, similar to other wild goose species (Gill 1996; Mckay et al.
1996; Stenhouse 1996; Mckay et al. 2006). Larger fields may be used more than small fields
because they represent larger food patches with more available food. Use of larger fields may
also be influenced by a flock's perception of disturbance. The escape flight distance is the
distance at which the flock will no longer tolerate a disturbance (e.g. eagle, human, or vehicle)
and flushes (Madsen and Fox 1997; Laursen et al. 2005). On smaller fields, geese are closer to
the edge of fields and thus are more likely to have disturbances occur within the bounds of their
escape flight distance.
Hunting
The logistic regression model results suggested that hunting was an important factor in
determining field use by Snow Geese during F A L L , although the R 2 value of this model was
very low, indicating that the model is not adequate. However, Snow Geese did use fields
outside the Alaksen National Wildlife Area during an open hunting season in November 2005.
Because of the problems with interpreting the SPRING results (e.g., all fields effectively free of
hunting by 10 March 2006), this discussion will be limited to Snow Goose movements in fall
and early winter. In studies of other waterfowl species, human disturbance, including hunting,
is an important factor in determining the distribution of waterfowl across a landscape (Owen
1973; Fox and Madsen 1997; Percival et al. 1997). Greylag, Barnacle, and Brant Geese
47

responded to experimental manipulations of hunting by aggregating in refuges (Madsen 1998;
Madsen 2001).
The Westham Island Waterfowl Surveys show that Snow Geese aggregated within the
Alaksen National Wildlife Area during the hunting season (Chapter 2). The pattern of refuge
use was pronounced between 1995 and 1999 when Snow Geese rarely used fields outside the
Alaksen National Wildlife Area during the hunting season (Chapter 2). This pattern may have
been due to food availability within the Alaksen National Wildlife Area, the lower proportion of
juveniles in the population, changes in hunting pressure, or a combination of the three. If little
or no food is available within unhunted (i.e., safe) areas, such as the Alaksen National Wildlife
Area, geese may elect to feed outside despite the threat from hunters (van Eerden 1997).
Between 1995 and 2000 when Snow Geese remained within the Alaksen National Wildlife
Area, the proportion of juveniles within the Fraser-Skagit flock was lower than in 2005-06 when
Snow Geese ventured outside the area (mean of 14% versus 40%) (Pacific Flyway Council
2006; Boyd unpublished data). Because they are still growing, juveniles have higher demands
for protein-rich foods (Raveling and Zezulak 1991) and may feed outside the Alaksen National
Wildlife Area despite hunting pressure, especially when high protein foods within are depleted.
Adults may follow juveniles into hunting areas to maintain family group cohesion.
Because hunting influences which fields are used by geese, it can be an important tool
for mitigating damage to perennial forage crops. Hunting pressure would help concentrate
Snow Geese in hunting-free areas such as the Alaksen National Wildlife Area and the foreshore
marsh of the Reifel Migratory Bird Sanctuary. However, concentrating birds within these two
areas exposes both to heavy grazing pressure. Waterfowl movements are also defined by food
stocks and not simply refuge distribution (van Eerden 1997). If Snow Geese are to be confined
to these areas during the hunting season, adequate and suitable food resources must be available.
48

If food resources are insufficient in these relatively safe habitats, Snow Geese will eventually
venture into hunting areas to find food (Brown and Kotler 2004). Food depletion is likely one
factor that caused Snow Geese to use fields outside the safety of the Alaksen National Wildlife
Area during 2005-06 and will be addressed further in Chapter 4.
Week Period
The inclusion of the W E E K parameter in the most parsimonious F A L L multiple
regression model indicates that there was differential amounts of crop use across weeks. This
was likely due to the fluctuating numbers of Snow Geese using the Fraser delta between 14
October 2005 and 15 January 2006. The two multiple regression models that contained the
WEEK*CROP interaction were the best fitting models in both the F A L L and SPRING, but also
had the highest Q A I Q values. Although these models were not selected as the best ones (based
on their high Q A I Q values), the high R 2 values of these models infer that the use of crops over
time differed.
Temporal differences in crop use patterns can be explained by temporal changes in
intrinsic (nutritional requirements, physiological condition) and extrinsic (food availability,
predation or hunting risk) factors. Geese have small digestive tracts and each day must consume
large amounts of plant material high in digestible proteins and soluble carbohydrates and low in
indigestible fibres (Prop and Vulink 1992; Sedinger 1997). Consequently, geese tend to
aggregate in habitats that contain vegetation high in protein/soluble carbohydrates to maximize
their intake of these nutrients (Prins and Ydenberg 1985; Therkildsen and Madsen 2000; Amano
et al. 2004a). Soluble carbohydrates can be readily used for energy, whereas protein is a less
efficient energy source (Alisauskas and Ankney 1992; Klasing 1998). Protein, however, is
required for maintenance, reproduction, and growth (Krapu and Reinecke 1992; White 1993;
49

Klasing 1998). Whether geese select habitats based on protein or soluble carbohydrate content
of food depends on the physiological state of the birds, which varies temporally. Geese require
protein during egg-laying but may also require it before and after migration to replace muscle
(Alisauskas and Ankney 1992; Gauthier et al. 1992; McKay et al. 1994). Energy is required for
metabolism, activity and thermoregulation, as well as for fat accumulation prior to wintering
periods, migration and breeding (Gates et al. 2001; Alisauskas 2002).
Food availability within an agricultural habitat varies across time and geese will leave a
habitat when its food resources are depleted below a profitable threshold (Rowcliffe et al. 1999).
Many factors can influence the availability of food over time. The types of food available
(crops) are dependent on annual market forces and weather conditions: crops may not be planted
because farmers cannot market the food and weather can prevent or delay planting or harvest.
Plant growth (and therefore available biomass) is affected by weather (temperature and
precipitation) and farm management (mowing, fertilization, and pesticide application). The
presence of herbivores (e.g., livestock, herbivorous waterfowl) also affects food availability.
Herbivores remove vegetation as they feed, reducing the amount of food for other animals.
Grazing can also facilitate the growth of plants such as grasses, maintaining them in young stage
of growth for extended periods of time (Bos et al. 2004).
Predation risk, such as hunting, also varies temporally. The fall and winter hunting
seasons on the Fraser delta run from mid-October to the end of December and mid February to
mid-March, respectively. During these seasons, fields outside of the Alaksen National Wildlife
Area may be temporarily unavailable as long as Snow Geese are unwilling to risk death from
hunting. When the seasons close or the number of active hunters declines, Snow Geese may
feed outside the Alaksen National Wildlife Area. The presence of Bald Eagles around
agricultural habitats may also influence field choice by Snow Geese. When eagles fly over
50
geese the flocks flush into the air. Taking flight expends energy (Klasing 1998) and interrupts
feeding; because of this geese may be more likely to select fields or areas that contain fewer
eagles.
51
CHAPTER 4 FIELD USE AND THE QUANTITY AND QUALITY OF FOOD
INTRODUCTION
Snow Geese exhibited a switch from feeding on barley grain, potatoes, and cover crops
to perennial forage fields in early winter (Chapter 3). In spring, Snow Geese continued to feed
on perennial forage fields, but also cover crop and grain stubble. In this chapter, I describe this
observed pattern of crop use using foraging theory as a framework.
Foraging theory predicts that an animal should select the habitats (and associated food
items) that maximize foraging profitability (Kamil and Sargent 1981). Profitability, a concept
first introduced in Royma's (1970) study of Great Tits (Parus major), is traditionally defined as
the amount of energy gained per unit time spent searching for and handling food (Stephens et al
1986; Guillemette et al. 1992). The most profitable habitat is the one that allows the greatest net
energy intake per unit time, and should be used proportionately more than habitats that are less
profitable (Pulliam 1976).
The abundance of food within a habitat can affect the rate at which foragers encounter
food items and therefore profitability (Gross et al. 1993). A simple theoretical example is
Holling's disc equation, in which a forager's intake rate increases as prey abundance increases
(Holling 1959). Many studies have shown that foragers aggregate where food is most abundant.
Examples include Starlings (Sturnus vulgaris) concentrating where leather]acket (Tipula
paludosa) densities are highest (Tinbergen 1981), fox squirrels (Sciurus niger) foraging in areas
with the largest conifer cones (which contain the greatest abundance of seeds) (Steele and Weigl
1992), and Brant Geese aggregating in the densest patches of eelgrass (Zostera spp.) (Percival et
al. 1996).
52
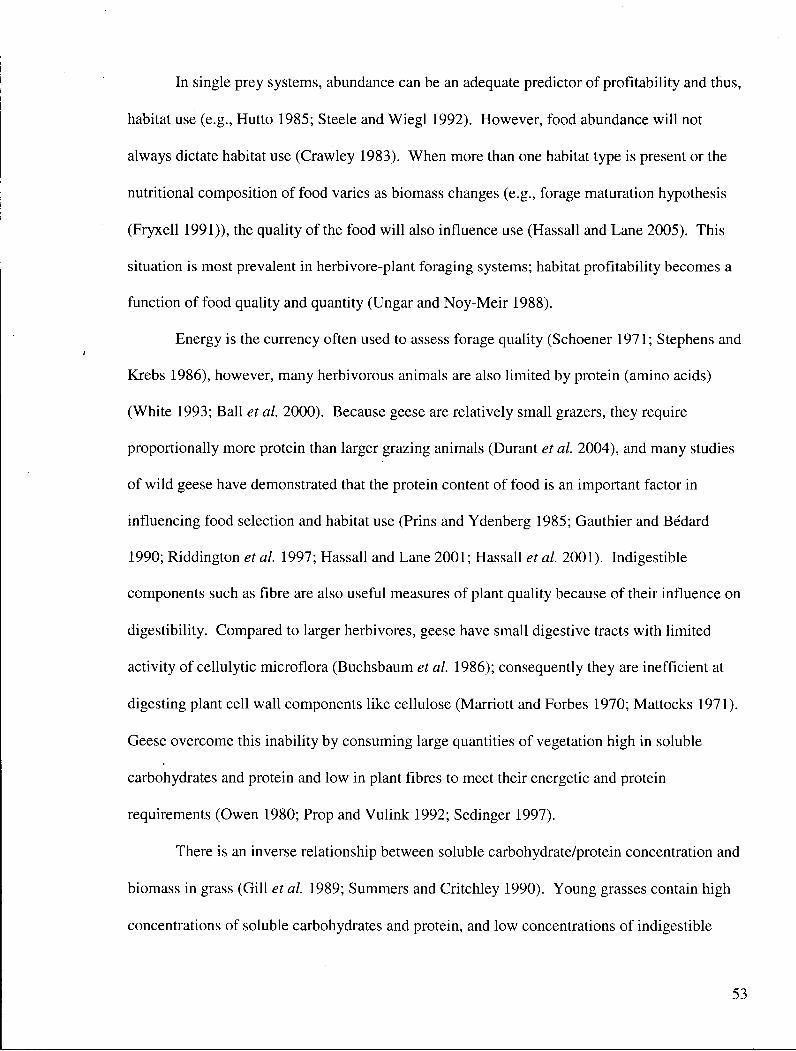
In single prey systems, abundance can be an adequate predictor of profitability and thus,
habitat use (e.g., Hutto 1985; Steele and Wiegl 1992). However, food abundance will not
always dictate habitat use (Crawley 1983). When more than one habitat type is present or the
nutritional composition of food varies as biomass changes (e.g., forage maturation hypothesis
(Fryxell 1991)), the quality of the food will also influence use (Hassall and Lane 2005). This
situation is most prevalent in herbivore-plant foraging systems; habitat profitability becomes a
function of food quality and quantity (Ungar and Noy-Meir 1988).
Energy is the currency often used to assess forage quality (Schoener 1971; Stephens and
Krebs 1986), however, many herbivorous animals are also limited by protein (amino acids)
(White 1993; Ball et al. 2000). Because geese are relatively small grazers, they require
proportionally more protein than larger grazing animals (Durant et al. 2004), and many studies
of wild geese have demonstrated that the protein content of food is an important factor in
influencing food selection and habitat use (Prins and Ydenberg 1985; Gauthier and Bedard
1990; Riddington et al. 1997; Hassall and Lane 2001; Hassall et al. 2001). Indigestible
components such as fibre are also useful measures of plant quality because of their influence on
digestibility. Compared to larger herbivores, geese have small digestive tracts with limited
activity of cellulytic microflora (Buchsbaum et al. 1986); consequently they are inefficient at
digesting plant cell wall components like cellulose (Marriott and Forbes 1970; Mattocks 1971).
Geese overcome this inability by consuming large quantities of vegetation high in soluble
carbohydrates and protein and low in plant fibres to meet their energetic and protein
requirements (Owen 1980; Prop and Vulink 1992; Sedinger 1997).
There is an inverse relationship between soluble carbohydrate/protein concentration and
biomass in grass (Gill et al. 1989; Summers and Critchley 1990). Young grasses contain high
concentrations of soluble carbohydrates and protein, and low concentrations of indigestible
53
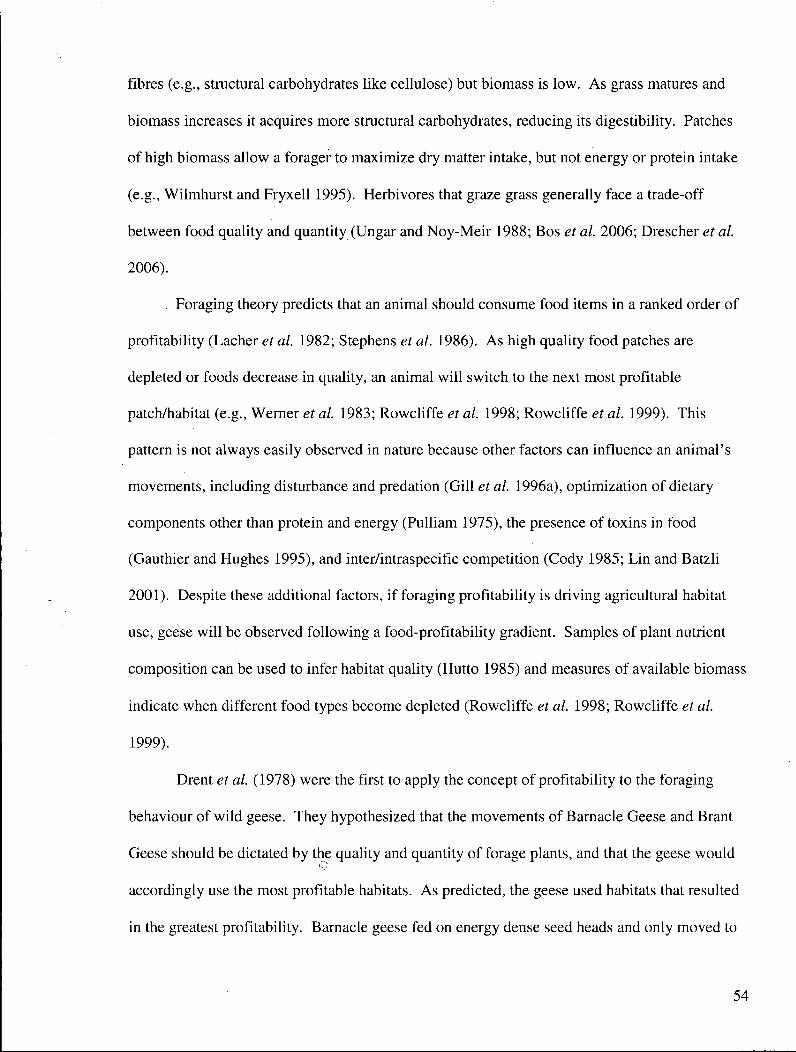
fibres (e.g., structural carbohydrates like cellulose) but biomass is low. As grass matures and
biomass increases it acquires more structural carbohydrates, reducing its digestibility. Patches
of high biomass allow a forager to maximize dry matter intake, but not energy or protein intake
(e.g., Wilmhurst and Fryxell 1995). Herbivores that graze grass generally face a trade-off
between food quality and quantity (Ungar and Noy-Meir 1988; Bos et al. 2006; Drescher et al.
2006).
Foraging theory predicts that an animal should consume food items in a ranked order of
profitability (Lacher et al. 1982; Stephens et al. 1986). As high quality food patches are
depleted or foods decrease in quality, an animal will switch to the next most profitable
patch/habitat (e.g., Werners al. 1983; Rowcliffe et al. 1998; Rowcliffe et al. 1999). This
pattern is not always easily observed in nature because other factors can influence an animal's
movements, including disturbance and predation (Gill et al. 1996a), optimization of dietary
components other than protein and energy (Pulliam 1975), the presence of toxins in food
(Gauthier and Hughes 1995), and inter/intraspecific competition (Cody 1985; Lin and Batzli
2001). Despite these additional factors, if foraging profitability is driving agricultural habitat
use, geese will be observed following a food-profitability gradient. Samples of plant nutrient
composition can be used to infer habitat quality (Hutto 1985) and measures of available biomass
indicate when different food types become depleted (Rowcliffe et al. 1998; Rowcliffe et al.
1999).
Drent et al. (1978) were the first to apply the concept of profitability to the foraging
behaviour of wild geese. They hypothesized that the movements of Barnacle Geese and Brant
Geese should be dictated by the quality and quantity of forage plants, and that the geese would 'y
accordingly use the most profitable habitats. As predicted, the geese used habitats that resulted
in the greatest profitability. Barnacle geese fed on energy dense seed heads and only moved to
54

less nutritious grass swards when the seeds were depleted. Brant Geese used Enteromorpha
(algae) more than upper salt marsh vegetation that contained less energy.
Foraging theory has since been used to explain habitat selection for a number of wild
goose species, including agricultural field use. Boudewijn (1984) investigated how Brant Geese
switched from feeding on pasture to salt marsh during the spring. Captive Brant Geese were
used in digestibility trials for the two different habitat types to determine which was the most
profitable. The digestibility trials indicated that pasture grass was initially more digestible until
spring, when new growth increased the digestibility, and therefore profitability, of the salt marsh
vegetation. This change in profitability corresponded with the habitat switch made by the geese.
Similarly, Prins and Ydenberg (1985) examined the use of dairy pasture (polder) and salt
marsh habitat by Barnacle Geese. They discovered that the geese would use the dairy pasture
when it provided a greater concentration of protein than did the salt marsh. In spring, salt marsh
vegetation would undergo a rapid growth and protein would increase to levels equal to that of
the polder. At this time, the Barnacle Geese would begin feeding on the salt marsh and would
neglect the polder.
Madsen (1985b) examined habitat switching from pastures to newly sown barley fields
by Pink-footed Geese. By comparing the energetic intake of the geese, Madsen was able to
quantify the relative profitabilities of the two crop types. He determined that barley was the
most profitable foraging option, indicating that the geese were feeding in the most profitable
habitat available to them at the time. These results were further corroborated by another study
that compared the energy content of winter wheat and pasture grasses, and the intake rates on
the two field types (Therkildsen and Madsen 2000). It showed that Pink-footed Geese were
selecting the more profitable winter wheat over the pasture grasses. The geese would only use
pasture grass when it became as profitable as winter wheat during spring growth.
55
Studies of Snow Geese on the Fraser delta suggest that the profitability of crops
influences agricultural habitat use. Snow Geese grazing cover crops made the heaviest use (as
evidenced by the amount of grazing damage) of late planted winter wheat cover crops and
clover. The late planted cover crops had higher concentrations of crude protein compared to
early planted ones, indicating that the high digestibility of the young plants influenced field use
(Temple et al. 2001).
Chapter Objectives
In this chapter, I relate changes in available crop biomass and nutrient content to patterns
of use by geese (Chapter 3). If the observed patterns of crop use are due to Snow Geese
following a food-profitability gradient, the crops used should be those that have the highest
concentrations of digestible compounds (protein and soluble carbohydrates) and the lowest
concentrations of indigestible compounds (fibre). As the highest quality crops are depleted or
their nutrient content changes, geese should switch to the next best crops.
METHODS
Biomass Measurements
Biomass was measured on fields containing cover crops, residue potato, perennial
forage, and barley grain. Twenty-four fields were selected for sampling in total (7 potato, 5
cover crop, 8 perennial forage, and 4 barley grain). Fields were sampled within the Alaksen
National Wildlife Area and on other farms across Westham Island and Brunswick Point (private
farmland); 13 fields were inside the Alaksen National Wildlife Area (3 potato, 2 cover crop, 4
perennial forage, and 4 barley grain). Four of the 5 cover crop fields were planted to winter
wheat and one to spring barley. Fields were systematically selected using an archived GIS
56

shape file of the study area. The number of fields sampled from each crop type was selected
arbitrarily. Sampling was biased towards fields within the Alaksen National Wildlife Area to
adequately describe patterns of crop depletion within. Samples had identifying codes assigned
to them from the archived GIS shape file. Fields within the Alaksen National Wildlife Area are
labelled with the code A N W A in addition to the field code. One field within Alaksen National
Wildlife Area (ANWA F l ) was comprised of potato, barley grain and perennial forage, and
another field contained both perennial forage and barley grain (ANWA F14). Each crop type
within the fields shares the same field code.
A l l fields were sampled once each month, from October 2005 to April 2006 (with the
exception of barley grain fields, which were not sampled after December due to total removal of
all seed biomass). During sampling, biomass was measured at 30 random points in the field.
Random points were generated using an archived Arc View shape file of all farm fields within
the study area. ArcMap 9.2 was used to select the sample fields from the archived shape file. I
used Hawth's Analysis Tools v3.20 (Beyer 2004) to randomly generate points within each field.
The points were then uploaded to a Garmin GPS Map76 handheld unit using DNR Garmin v5.0
(Pouliot and Loesch 2005). Once in the field, the GPS unit was used to navigate to each random
point.
Potato biomass was measured once a month from October 2005 to April 2006. Each
month, thirty randomly selected plots were sampled per field. A 0.25-m2 quadrat (50 cm x 50
cm) was placed at the centre of each random sample point. A small hand rake was used to
excavate the soil to a depth of approximately 5 cm. A l l potatoes found at the soil surface or
buried within the plot were removed and placed in a labelled zip-lock bag.
The samples were brought to a laboratory and rinsed to remove soil clinging to the
potatoes. Care was taken to avoid washing away pieces of potato, especially because the tubers
57
became more desiccated and fragile as the study progressed. The individual samples were towel
dried, placed in brown paper bags, weighed to the nearest 0.01 g (wet weight), and placed in a
forced-air drying oven for 10 days at 55° C. After 10 days, the samples were reweighed to the
nearest 0.01 g to obtain dry weights.
In the first month of the study (October 2005), only wet weights were obtained for 4 of
the 7 sample fields. To estimate the sample dry weights for these fields, I used linear regression
to compare the sample dry weights of the remaining 3 potato fields to their sample wet weights.
The regression equation (dry weight = 0.23(wet weight) - 0.06, n = 55, r 2 = 0.88, p < 0.0001)
provided a correction factor that I used to estimate the sample dry weights for the 4 fields in
October 2005.
Grass biomass was measured once a month from October 2005 to April 2006. Grass
fields were divided into perennial forage (7 fields) and cover crop (5 fields) fields. Perennial
forage fields were further subdivided into pastures (3 fields), orchard/fescue forage fields (3
fields), and fescue fields (1 field). Each perennial forage subtype had slightly different species
compositions. Pastures were predominately orchard grass (Dactylis glomerata), tall fescue
(Festuca arundinacea) and clover (Trifolium spp.), but contained a mix of other forage grasses.
Orchard/fescue forage fields were a mix of orchard grass and fescue, with a small percentage of
clover. Fescue fields were almost completely fescue.
Winter wheat was the most extensive cover crop (approximately 50% of all cover crop
area), and therefore the cover crops sampled were almost exclusively winter wheat (4 fields)
plus 1 field of spring barley. A l l of the winter wheat fields sampled were drilled whereas the
barley field was broadcast seeded.
Each month, 30 randomly selected points were sampled per field. A Filip's Folding
Plate Pasture Meter (herein referred to as a pasture meter) was used to measure grass biomass at
58
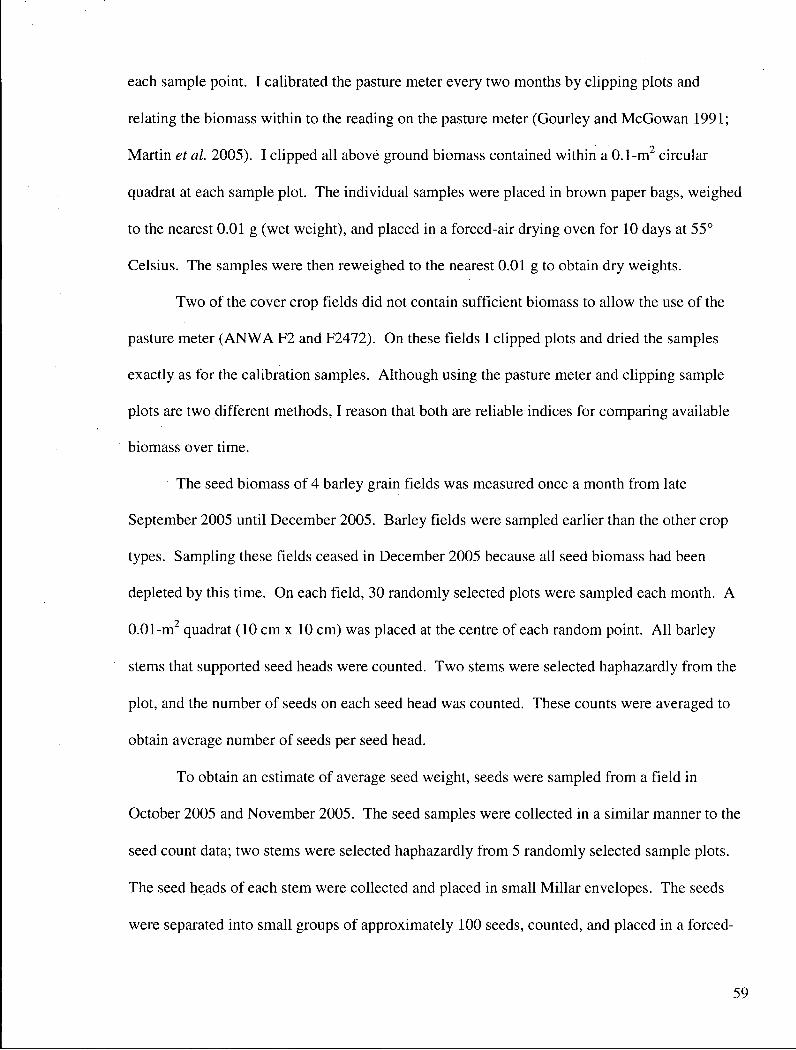
each sample point. I calibrated the pasture meter every two months by clipping plots and
relating the biomass within to the reading on the pasture meter (Gourley and McGowan 1991;
Martin et al. 2005). I clipped all above ground biomass contained within a 0.1-m circular
quadrat at each sample plot. The individual samples were placed in brown paper bags, weighed
to the nearest 0.01 g (wet weight), and placed in a forced-air drying oven for 10 days at 55°
Celsius. The samples were then reweighed to the nearest 0.01 g to obtain dry weights.
Two of the cover crop fields did not contain sufficient biomass to allow the use of the
pasture meter (ANWA F2 and F2472). On these fields I clipped plots and dried the samples
exactly as for the calibration samples. Although using the pasture meter and clipping sample
plots are two different methods, I reason that both are reliable indices for comparing available
biomass over time.
The seed biomass of 4 barley grain fields was measured once a month from late
September 2005 until December 2005. Barley fields were sampled earlier than the other crop
types. Sampling these fields ceased in December 2005 because all seed biomass had been
depleted by this time. On each field, 30 randomly selected plots were sampled each month. A
0.01-m2 quadrat (10 cm x 10 cm) was placed at the centre of each random point. A l l barley
stems that supported seed heads were counted. Two stems were selected haphazardly from the
plot, and the number of seeds on each seed head was counted. These counts were averaged to
obtain average number of seeds per seed head.
To obtain an estimate of average seed weight, seeds were sampled from a field in
October 2005 and November 2005. The seed samples were collected in a similar manner to the
seed count data; two stems were selected haphazardly from 5 randomly selected sample plots.
The seed heads of each stem were collected and placed in small Millar envelopes. The seeds
were separated into small groups of approximately 100 seeds, counted, and placed in a forced-
59
air drying oven for 2 days at 75° C. After 2 days, the samples were reweighed to the nearest
0.01 g to obtain dry weights. The total weight of each dry sample was divided by the number
of seeds to obtain an average seed weight. To obtain the biomass (g/m ) of each sample plot the
average seed weight was multiplied by the average number of seeds per seed head, and then by
the number of seed heads counted within each sample plot.
Nutrient Measurements
Crop nutrient content was measured 4 times throughout the study period. Samples were
collected in the third weeks of October and November 2005 and the third weeks of February and
March 2006. Six fields were sampled in total; three perennial forage fields, two cover crop
fields (both winter wheat) and one potato field. Samples were not taken from barley grain
fields. Ten samples were collected from randomly located points on each field during each
sampling period using a 0.25-m quadrat. For grass crops, all grass was clipped approximately
2-3 cm above the ground, placed in a labelled zip-lock bag. Each sample contained about 30 g
dry mass. When there was insufficient biomass in a plot, several quadrats had to be clipped for
one plot. Quadrats were always moved forward after the initial plot had been clipped; this
ensured that observers did not bias the location of the quadrat. In potato fields, all tubers within
the 0.25-m2 plot (to a depth of about 5 cm) were collected and placed in a labelled zip-lock bag.
Nutrient data were collected only from cover crop fields in late-October and late-
November because no grass remained within the sample fields by the third sampling period in
February. Biomass in the potato field sampled was also depleted by February. Samples were
pooled from the sample potato field along with samples collected from other potato fields in
February in March. Perennial forage samples were collected during all sample periods but due
60
to overgrazing, samples were not obtained from one field during the fourth sampling period at
the end of March.
Samples were frozen and sent to Norwest Labs (Lethbridge, Alberta) to be analyzed for
concentrations of ash, crude protein (CP), crude fibre (CF), and total fats (ether extract). These
concentrations were subtracted from 100% to obtain the concentration of nitrogen-free extract
(NFE) (starches and simple sugars). I did not compare the fat contents of the different
agricultural foods because it does not contribute significantly to energy metabolism in geese
(Buchsbaum et al. 1986; Prop and Vulink 1992; Bruinzeel et al. 1997).
Statistical Analysis
I compared crop biomass within each field over each month of sampling to describe
patterns of crop depletion. I used a one-way A N O V A with multiple comparisons (two-tailed t-
test) to detect significant differences in biomass across time (a = 0.05). A l l multiple
comparisons were corrected using Bonferonni's correction (Zar 1999). I used a two-tailed t-test
to compare potato and cover crop biomass within the Alaksen National Wildlife Area and
outside. Mean biomass values between the two areas were compared monthly between October
2005 and January 2006.
To assure that the assumptions of the A N O V A were met, homogeneity of variance was
tested using Bartlett's test and the normality of residuals with the Kolmogorov-Smirnov test.
These tests were both assessed by setting a = 0.01. Residual plots were also used to
subjectively determine if the residuals were normally distributed. When residuals were not
normally distributed or the variance was heterogeneous, I transformed the data using log,
log(y+l), or square root transformations. Data that could not be normalized with
transformations were compared using the nonparametric Kruskal-Wallis test. Following
61

significant results obtained from the Kruskal-Wallis test, I conducted multiple comparisons of
biomass between different time periods; all comparisons were corrected with an experiment
wise error rate (Daniel 1990).
I compared the nutrient content (dry CF, dry CP, and dry NFE) of the different crop
types to each other over the four sampling periods. I used a two-way A N O V A with t-test
multiple comparisons to test differences in nutrient content between different crop types over
time (a = 0.05). A l l multiple comparisons were corrected using Bonferonni's method (Zar
1999). As with the biomass data, the normality and homogeneity of variance was assessed
using the Kolmogorov-Smirnov test and Bartlett's test, respectively. Non-normal distributions
were transformed with log or power (y ) transformations. Because samples were not taken from
cover crops in February and March 2006,1 compared cover crops, perennial forage, and potato
samples separately from perennial forage and potato samples in February and March 2006 (the
zero values for cover crops during the last two sample periods made normalizing the data
impossible).
RESULTS
Crop Biomass Measurements
a) Potato
Biomass on all potato fields decreased between October 2005 and January 2006 across
the study season (Figure 9). Potato biomass within Alaksen National Wildlife Area was lower
than that found outside of the area in early October 2005 (Figure 10). In early November, there
was no significant difference between biomass on fields within the Alaksen National Wildlife
Area and biomass on fields outside the area, but by December biomass within the area was
significantly lower.
62

250 H
E
"a
/ ,^ ^ ^ / / ^ Sample Dale
^ ^ ^ ^ ^ ^ ^ ^ ^ ^
c& c& A * A * A * v# A * ^ ^P t e
£ X ^ N ,0> ,<^X «5* >cC> , * X ,CN>X
Sample Dale
^ ^ s ^ ^ ^ ^ ^ ^ ^ ^
A * A * A *
0 \ X r(>X
s O X ^ ^ X # ^ N%X
NW ^
Sample Date
c>x
^ ^dP J * jdP
# ^ # # ^ # / # # Sample Dale
E
•a,
G
^ S<F" ^ ^ ^ ^ / ^ s S #N # # # s# s# ^
Sample Dale
# , # ^ ^ X ^ „ N \ S ^ > S ^ S r p ' (ST # % ^ ^
Sample Dale
Figure 9: Mean biomass (g/m2 ± SE) on potato fields between October 2005 and April 2006: biomass values that do not share the same letters differ significantly; Alaksen National Wildlife Area fields are displayed on the left (ANWA F l ; A N W A F5; A N W A F6); Private fields are displayed on the right (F2449; F2435; F2515; F2535).
63

120
100
E "So
B o S
80
60
40 -\
20 H
Oct
- o - N W A
- O - O u t
Nov Dec Jan
Month
Figure 10: Mean biomass (g/m ± SE) of potato fields within the Alaksen National Wildlife Area and outside. A l l statistical comparisons were done within months. Mean biomass values that differ within months are starred (*).
b) Cover Crop
Biomass on cover crop fields decreased between October and December 2005 (Figure
11). In no month was cover crop biomass significantly different between Alaksen National
Wildlife Area fields and those outside.
c) Perennial Forage
Perennial forage fields exhibited differential patterns of depletion and regrowth (Figure
12). Unlike cover crops, potato, and barley grain, perennial forage biomass was not completely
depleted during the winter. Within the Alaksen National Wildlife Area, all 4 perennial forage
fields experienced crop depletion due to waterfowl grazing between October 2005 and April
2006 (Figure 12). Perennial forage biomass did not change as drastically on private farmlands
64
as it did within the Alaksen National Wildlife Area: biomass on some private fields increased
over the study period.
/ / / / / / s / / / /
Sample Dale
^ . / Z 5 Z5 y / • ^ S"-' V" S N V
Sample Dale
e "a
^ / #N #s / #s #s ^ N# Sample Dale
# # ^ ^ s / #N
1" 1 T 3 ™ ^ ™ ! 1
A * n \ *
/ / / / Sample Date
A
\ h'2504
\ " It
\ J C C
50
40
30
20
10
0 4
J& J& J *
Sample Date
Figure 11: Mean biomass (g/m2 ± SE) on cover crop fields between October 2005 and April 2006: biomass values that do not share the same letters differ significantly; Alaksen National Wildlife Area fields are displayed on the left (ANWA F2; A N W A F17); Private fields are displayed on the right (F2472; F2504; F2501).
65
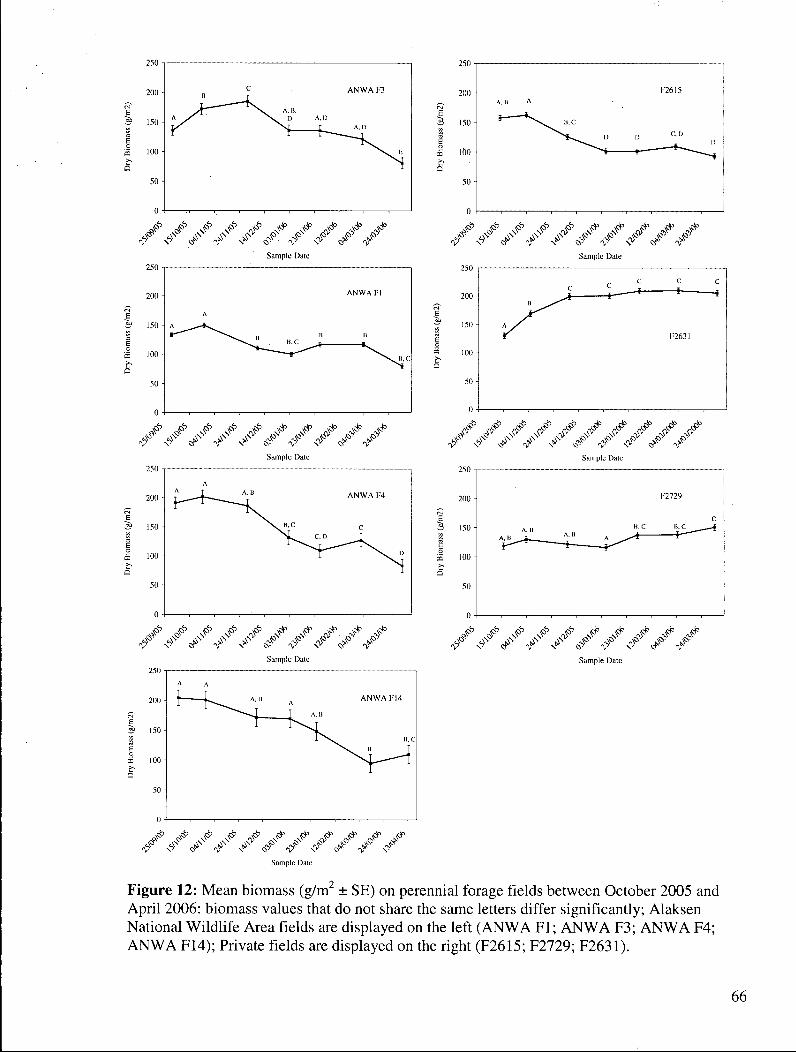
0 1 , , , , , , , , , , - 1
„ \ * A * Ov* „ \ * A * A *
<? # N* <S> <\> T!" \ *
Sample Date
Figure 12: Mean biomass (g/m2 ± SE) on perennial forage fields between October 2005 and April 2006: biomass values that do not share the same letters differ significantly; Alaksen National Wildlife Area fields are displayed on the left (ANWA F l ; A N W A F3; A N W A F4; A N W A F14); Private fields are displayed on the right (F2615; F2729; F2631).
66
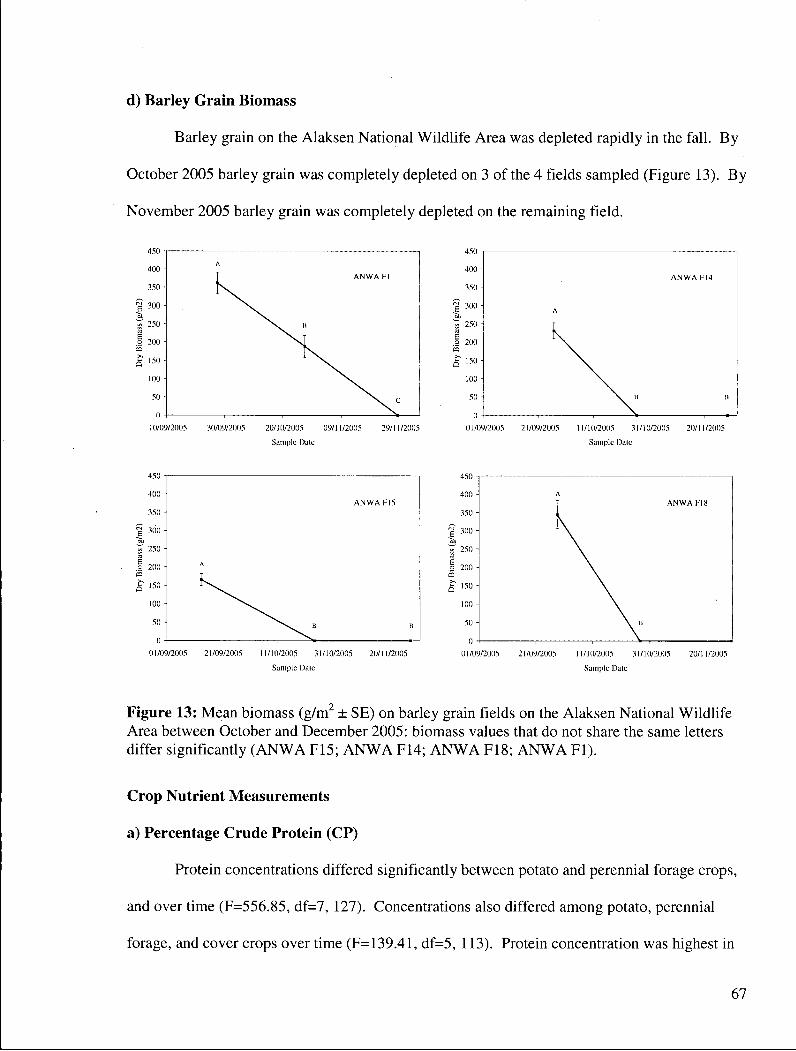
d) Barley Grain Biomass
Barley grain on the Alaksen National Wildlife Area was depleted rapidly in the fall. By
October 2005 barley grain was completely depleted on 3 of the 4 fields sampled (Figure 13). By
November 2005 barley grain was completely depleted on the remaining field.
10/09/2005 30/09/2005 20/10/2005 09/11/2005 29/11/2005 01/09/2005 21/09/2005 11/10/2005 31/10/2005 20/11/2005
Sample Date Sample Dale
A N W A K1K
01/09/2005 21/09/2005 11/10/2005 31/10/2005 20/11/2005 01/09/2005 21/09/2005 11/10/2005 31/10/2005 20/11/2005
Sample Dale Sample Dale
Figure 13: Mean biomass (g/m2 ± SE) on barley grain fields on the Alaksen National Wildlife Area between October and December 2005: biomass values that do not share the same letters differ significantly (ANWA F15; A N W A F14; A N W A F18; A N W A F l ) .
Crop Nutrient Measurements
a) Percentage Crude Protein (CP)
Protein concentrations differed significantly between potato and perennial forage crops,
and over time (F=556.85, df=7, 127). Concentrations also differed among potato, perennial
forage, and cover crops over time (F=139.41, df=5, 113). Protein concentration was highest in
67
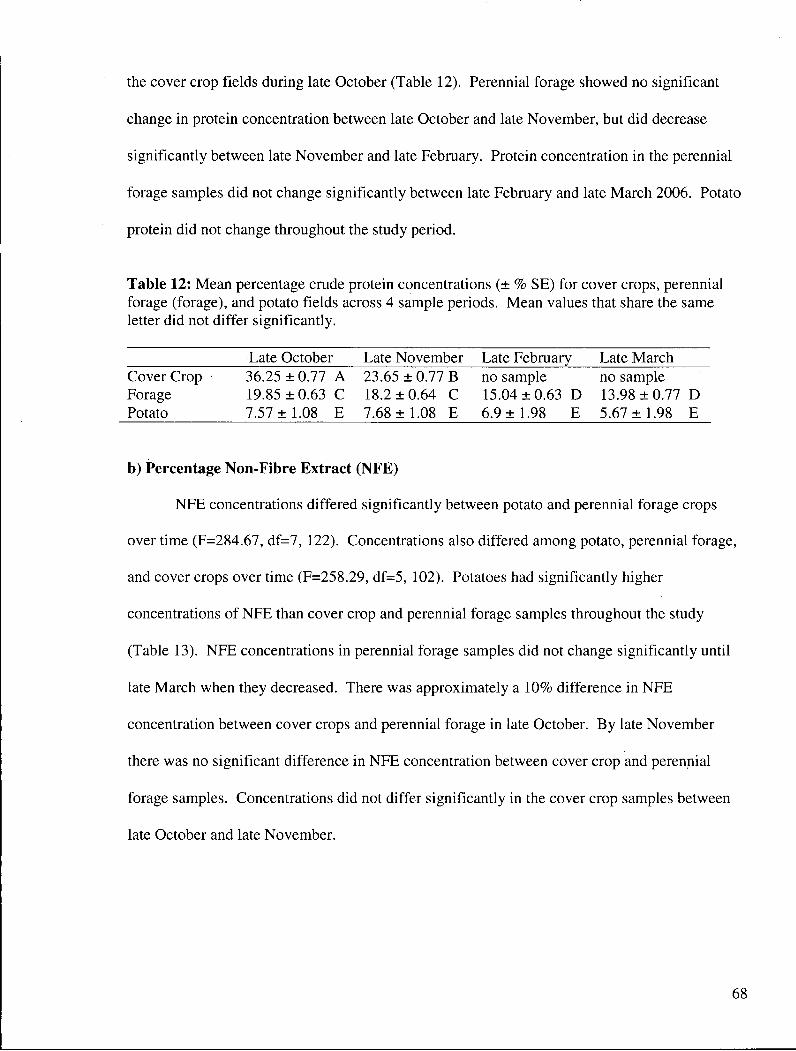
the cover crop fields during late October (Table 12). Perennial forage showed no significant
change in protein concentration between late October and late November, but did decrease
significantly between late November and late February. Protein concentration in the perennial
forage samples did not change significantly between late February and late March 2006. Potato
protein did not change throughout the study period.
Table 12: Mean percentage crude protein concentrations (± % SE) for cover crops, perennial forage (forage), and potato fields across 4 sample periods. Mean values that share the same letter did not differ significantly.
Late October Late November Late February Late March Cover Crop 36.25 ±0.77 A 23.65 ± 0.77 B no sample no sample Forage 19.85 ±0.63 C 18.2 ±0.64 C 15.04 ±0.63 D 13.98 ±0.77 D Potato 7.57 ± 1.08 E 7.68 ±1.08 E 6.9 ±1.98 E 5.67 ±1.98 E
b) Percentage Non-Fibre Extract (NFE)
NEE concentrations differed significantly between potato and perennial forage crops
over time (F=284.67, df=7, 122). Concentrations also differed among potato, perennial forage,
and cover crops over time (F=258.29, df=5, 102). Potatoes had significantly higher
concentrations of NFE than cover crop and perennial forage samples throughout the study
(Table 13). NFE concentrations in perennial forage samples did not change significantly until
late March when they decreased. There was approximately a 10% difference in NFE
concentration between cover crops and perennial forage in late October. By late November
there was no significant difference in NFE concentration between cover crop and perennial
forage samples. Concentrations did not differ significantly in the cover crop samples between
late October and late November.
68
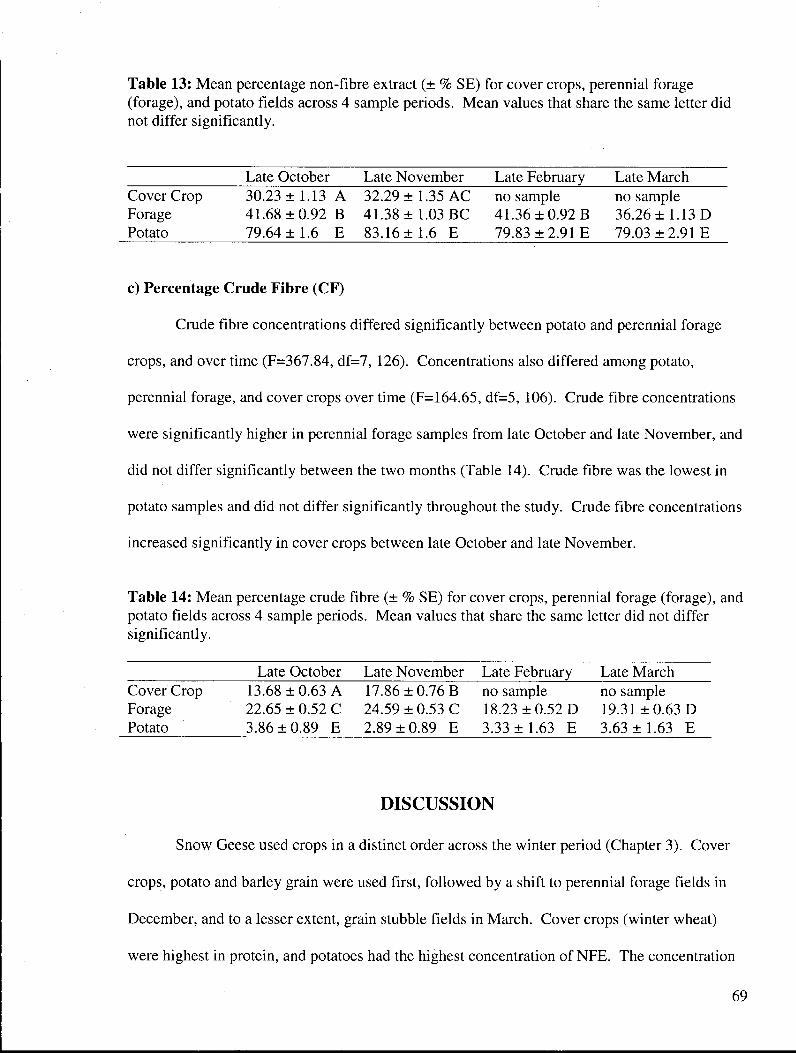
Table 13: Mean percentage non-fibre extract (± % SE) for cover crops, perennial forage (forage), and potato fields across 4 sample periods. Mean values that share the same letter did not differ significantly.
Late October Late November Late February Late March Cover Crop 30.23 ± 1.13 A 32.29 ± 1.35 A C no sample no sample Forage 41.68 ±0.92 B 41.38 ± 1.03 BC 41.36 ± 0.92 B 36.26 ± 1.13 D Potato 79.64 ± 1.6 E 83.16 ±1.6 E 79.83 ± 2.91 E 79.03 ± 2.91 E
c) Percentage Crude Fibre (CF)
Crude fibre concentrations differed significantly between potato and perennial forage
crops, and over time (F=367.84, df=7, 126). Concentrations also differed among potato,
perennial forage, and cover crops over time (F=164.65, df=5, 106). Crude fibre concentrations
were significantly higher in perennial forage samples from late October and late November, and
did not differ significantly between the two months (Table 14). Crude fibre was the lowest in
potato samples and did not differ significantly throughout the study. Crude fibre concentrations
increased significantly in cover crops between late October and late November.
Table 14: Mean percentage crude fibre (± % SE) for cover crops, perennial forage (forage), and potato fields across 4 sample periods. Mean values that share the same letter did not differ significantly.
Late October Late November Late February Late March Cover Crop Forage Potato
13.68 ±0.63 A 22.65 ± 0.52 C 3.86 ±0.89 E
17.86 ± 0.76 B 24.59 ± 0.53 C 2.89 ±0.89 E
no sample 18.23 ±0.52 D 3.33 ±1.63 E
no sample 19.31 ±0.63 D 3.63 ±1.63 E
DISCUSSION
Snow Geese used crops in a distinct order across the winter period (Chapter 3). Cover
crops, potato and barley grain were used first, followed by a shift to perennial forage fields in
December, and to a lesser extent, grain stubble fields in March. Cover crops (winter wheat)
were highest in protein, and potatoes had the highest concentration of NFE. The concentration
69
of protein in cover crops dropped significantly between October and November, likely because
Snow Geese and American Wigeon had removed many of the primary and secondary tillers
which are higher in protein than the rest of the plant (Summers and Atkins 1991; Therkildsen
and Madsen 1999). Crude fibre, which is inversely related to digestibility (Drent et al. 1978/79;
Sedinger 1997), was lowest in potatoes and second lowest in cover crops. Overall, perennial
forage had the highest crude fibre content, lower protein content than cover crops, and lower
soluble carbohydrate content than potatoes.
I did not collect nutrient samples of barley grain so any inference concerning its
nutritional quality was obtained from the literature. Raveling and Zezulak (1991) reported the
concentration of protein in barley grain as 13.4%. The National Academy of Sciences (NAS)
(1971) reported a slightly lower concentration of 6.0 %. The NAS (1971) reported barley grain
is composed of 75.7% NFE and 13% crude fibre. Norwest Labs, the company that analyzed the
nutrient samples in this study, reported that barley grain contains 12.5 ± 1.92 % SD crude
protein, 77.1± 2.40 % SD NFE, and 5.5 ± 1.30 % SD crude fibre (Norwest Labs, unpublished
data). This evidence suggests that barley grain is similar to potatoes in terms of NFE content
and contains a greater concentration than winter wheat cover crops and perennial forage grasses.
Cover crops and perennial forage are higher in both protein and crude fibre than barley grain.
Snow Geese did not seem to select crops on the basis of food availability because there
were large amounts of perennial forage available on fields during the fall and early winter that
were not used. The crops used first in the fall season were the highest in either protein or
starches/simple sugars and lowest in crude fibre. Protein and energy intake rates were likely
highest on cover crops and potato/barley fields, respectively because they possessed the highest
concentrations of these nutritional components (Bos et al. 2004).
70

The shift to perennial forage fields in December coincides with the depletion of barley
grain, potato, and cover crops. I reason that the shift from these crops to perennial forage fields
was not based on changes in nutrient content; rather, the majority of the higher quality crops had
been depleted below a biomass threshold that was profitable. Geese must balance food quality
with intake (Bos et al. 2005); when a standing crop drops below some threshold level, geese will
switch to lower quality foods to maintain intake rates that maximize net energy or net protein
intake (Riddington et al. 1997; Therkildsen and Madsen 1999; Rowcliffe et al. 2001).
Snow Geese appeared to exercise partial preference for several different crop types. No
crop contained the highest concentrations of both protein and simple carbohydrates. This partial
preference likely reflects a separate demand for energy (in the form of starches and simple
sugars) and protein. Energy is most efficiently obtained from carbohydrates and is less
efficiently obtained by deaminating proteins (Alisauskas and Ankney 1992; Klasing 1998).
However, geese have a significant requirement for protein and must consume foods with
relatively high concentrations (White 1993). The requirement for protein varies temporally,
with greater amounts required after migration to wintering areas (Gauthier et al. 1992; McKay
et al. 1994) and prior to and during migration to breeding grounds (McLandress and Raveling
1981; Prop et al. 1984 Amat et al. 1991; Alisauskas and Ankney 1992; Sedinger 1997; Gates et
al. 2001).
Additionally, it is possible that the proportion of juveniles in the flock influences
whether protein or energy rich crops are used. Cackling Geese (Branta hutchinsii) adults and
juveniles select crops differentially in the fall; juveniles select cereals and forage grasses to
obtain protein for growth and adults select cereal grains high in carbohydrates for energy
(Raveling and Zezulak 1991). Therefore, the observed use of both protein and carbohydrate rich
crops may be due to differential selection by family groups with juveniles and adult geese that
71

do not have young. During this study, the proportion of juveniles in the Fraser-Skagit
population was a record high (32,000 individuals). Because of the influence juvenile birds may
have on field selection, the results of this study should be interpreted cautiously. Unfortunately
because I did not distinguish between adults and juveniles when quantifying field use, I was
unable to relate patterns of use to age class. Future studies should differentiate between
juveniles and adults.
The use of fields outside the Alaksen National Wildlife Area during the hunting season
(Chapter 3) may be explained in part due to food depletion within the area. Barley grain was
depleted within the Alaksen National Wildlife Area by the beginning of November and by the
beginning of December there was significantly more potato biomass outside the area. Despite
an open hunting season, Snow Geese may have fed outside the Alaksen National Wildlife Area
because there was relatively less potato biomass within. Alternatively, hunting pressure outside
the Alaksen National Wildlife Area may have subsided, allowing geese to feed outside.
Snow Geese made use of many different types of crop fields in April, including cover
crops, grain stubble, and even grassland set-asides. Despite depletion of all the sample fields,
some cover crops still had green biomass in April. Use of these crops was most likely related to
plant growth associated with warmer late winter and early spring temperatures. Other species of
wild geese, including Brant and Barnacle Geese, begin feeding on vegetation as it begins to
grow in spring (Prins and Ydenberg 1985; Spaans and Postma 2001; Bos et al. 2005). I
observed Snow Geese feeding on forbs and grasses that were sprouting on depleted cover crop,
grain stubble, crop residue, and corn fields. Snow Geese of the Central Flyway population have
been observed making extensive use of rangeland and fallow fields in wet winters when
sprouting forbs and grasses were profuse, and ignored improved pastures (Hobaugh 1984). In
dry winters when the forbs and grasses were not abundant, Central Flyway Snow Geese
72

increased their use of improved pastures, indicating a preference for the former (Hobaugh
1984). The emergence of forbs and grasses in spring likely represents a source of protein rich
vegetation for Snow Geese, which require protein before and during spring migration to build
flight muscle (McLandress and Raveling 1981; Prop et al. 1984 Amat et al. 1991; Alisauskas
and Ankney 1992; Sedinger 1997; Gates et al. 2001). Further study is required to determine the
nutritive content of this vegetation type and its relation to annual precipitation. Continued
quantification of crop-use patterns would be required to determine how crop use varies with
varying abundance of unsown forbs and grasses.
Providing waste sugar beets for Pink-footed Geese in Europe (Gill et al. 1996b) and rice
grain for White-fronted Geese on harvested fields in Japan (Amano et al. 2004a; Amano et al.
2004b) have been suggested to limit damage to economically important cereal crops. Similarly,
provisioning potatoes (leaving portions of fields unharvested or dumping cull potatoes on fields)
may limit over-grazing of perennial forage fields by attracting geese to the Alaksen National
Wildlife Area. Anecdotal evidence suggests that supplying potatoes would attract Snow Geese
to fields. Between 13 October and 30 November 2004,1 conducted observations of fields
within the Alaksen National Wildlife Area when heavy rains prevented farmers from bringing
their machinery onto fields to harvest approximately 30 ha of potatoes. During this period, I
only observed Snow Geese feeding on unharvested potato fields where biomass was visibly
higher than in harvested potato fields (pers. obs.). Snow Geese were not observed using cover
crops or perennial forage fields (and barley grain had been consumed by ducks prior to the
arrival of Snow Geese). Similarly, rainfall prevented the harvest of potatoes in 1997 and this
crop type received proportionality more use from Snow Geese compared to previous and
subsequent years (Chapter 2). Although anecdotal, these observations suggest that geese will
neglect other crop types when potatoes are abundant. This pattern likely occurs because
73

unharvested potatoes represent an abundant, energy-rich food source and I hypothesize that the
number of goose days supported would increase as potato biomass increased. The 2005-06 data
supports this because goose use declined as potato biomass decreased but experimental
manipulations of potato biomass would be necessary to test this hypothesis.
I did not quantify intake rates, foraging effort, or nutrient digestibility in this study.
Consequently, I cannot compare the relative profitabilities of the different crop types. Such
measures have proven to be useful for investigating foraging profitability, and the resulting
information can help explain differential crop use by wild geese (e.g., Drent et al. 78;
Therkildsen and Madsen 2000; Rowcliffe et al. 2001; van der Graaf et al. 2006). I recommend
these measures be made in future studies to explore energy and protein intakes from different
crop types. These values can then be used to generate predictive models that test whether geese
forage to maximize energy or protein intake (sensu Amano et al. 2004a). As well, research is
required to determine how Snow Geese trade-off the demand for protein and energy during the
fall, winter, and spring.
74

CHAPTER 5
THESIS SUMMARY AND MANAGEMENT IMPLICATIONS
Thesis Summary
Lesser Snow Geese use agricultural fields on the Fraser delta during the fall, winter, and
spring. Snow Geese may exert greater foraging pressure on agricultural crops due to the recent
loss of foreshore habitat adjacent to the Vancouver International Airport. The Alaksen National
Wildlife Area and Greenfields cover crops should be managed in such a way to provide Snow
Geese with foraging opportunities and prevent crop depredation. This can be accomplished by
providing crops that attract and concentrate geese to the Alaksen National Wildlife Area and
Greenfields cover crops. Doing so requires a basic understanding of crop use by Snow Geese
and the factors that influence use of fields.
During the fall, winter and spring of 2005-06,1 quantified patterns of crop use by Snow
Geese. I assessed patterns of crop growth and depletion and measured nutritional composition.
This study was conducted in an atypical year; the population was the highest ever recorded (ca.
80,000 individuals) and was composed of a record number of juveniles (40% of the total
population or ca. 32,000). Because of the influence juvenile geese may have on the selection of
crop fields, the results of the study should be interpreted cautiously. Snow Geese selected crops
differentially through the fall and winter. Barley grain, cover crops, and potatoes were used first
during the fall but the geese gradually switched to using perennial forage grasses in December.
In spring, geese continued to use perennial forage fields as well as grain stubble fields and cover
crops. Crop types used first ranked highest in either protein or starch/simple sugar content in
the fall. They also had the lowest crude fibre concentrations. Geese were likely maintaining
high intakes of both protein and energy by feeding on these crops. Their increased use of
perennial forage fields in December corresponded with the depletion of biomass on barley,
75

cover crop, and potato fields. This suggests that Snow Geese follow a food-profitability
gradient throughout the fall, winter and spring. The use of grain stubble and then cover crops in
the spring may be related to grasses and forbs sprouting on these fields.
Snow Geese could be attracted to the Alaksen National Wildlife Area by providing crops
that are high in either soluble carbohydrates (potato, cereal grains) or protein (fall-sown cereals),
and low in fibre. Greenfield cover crops should be planted to varieties that are highest in crude
protein (e.g. winter wheat) to attract geese. Perennial forage fields contain a high amount of
biomass relative to other crop types (e.g. cover crops) and likely represent an important source
of food for Snow Geese once the highest quality ones have been depleted.
Hunting influenced field use by geese between 1995 and 2000. Snow Geese tended to
use fields that were within the Alaksen National Wildlife Area during the hunting season,
however, the depletion of crop biomass within the area and the availability of crops outside
likely drove Snow Geese to feed outside during 2005-06. Despite these results, hunting could
be used to keep geese within the Alaksen National Wildlife Area and protect perennial forage
fields if an adequate amount of high quality crops are maintained within the area.
Future Research
Future research should assess how to further attract and concentrate Snow Geese on the
Alaksen National Wildlife Area and Greenfields cover crops. M y study shows that food
availability and quality influences agricultural field use by geese. The availability and quality of
crop plants can be manipulated by land managers to attract and hold geese on the Alaksen
National Wildlife Area. Agricultural habitat use by Snow Geese should be modelled further to
investigate assumptions of foraging behaviour (sensu Amano et al. 2004a) and the effect of
extrinsic (food availability, predation or hunting risk) and intrinsic (nutritional requirements,
76
physiological condition) factors on field use. Experimentation should follow the modelling to
corroborate the model findings. I recommend that several manipulative experiments be
conducted, the results of which can be used to generate best management practices for the
Alaksen National Wildlife Area and explain how varying levels of biomass and nutrient content
affect crop use:
• Determine the relationship between goose use (goose days supported) and potato
biomass; this can be accomplished by leaving portions of potato fields unharvested.
• Determine the relationship between nitrogen content of perennial forage grasses and
goose use (goose days supported). Experiment with applying varying rates of fertilizer
on perennial forage fields to increase the protein content of grass and determine how
goose use varies with application rates (Percival 1993; Hassall and Lane 2001; Hassall
et al. 2001).
• Assess the effect of mowing perennial forage grasses on field use (see Owen 1975).
• Further assess the effect of planting date and planting densities of cover crops on field
use (see Temple et al. 2001).
The profitabilities of different crop types and of crop types exposed to different
management practices should be examined. Foraging profitability can either be determined with
captive geese (Boudewijn 1984) or by assessing the digestibility of crops by wild geese using
indigestible markers (Drent et al. 1978). Like the manipulative experiments described above,
studies of foraging profitability would help managers plant crops that attract Snow Geese. For
example, young grass does not provide large amounts of biomass but as the grass matures, it
becomes less digestible (see Chapter 4 for detailed discussion). Assessing how profitability
varies with grass maturity would allow managers to provide grasses that maximize foraging
profitability and attract geese to fields. Studying foraging profitability would also provide a
77
theoretical basis for constructing models that could be used to predict how changes in cropping
patterns would affect goose movements. They could also be used to assess the carrying capacity
of agricultural areas like the Alaksen National Wildlife Area (sensu Inger at al. 2006).
Understanding how different agricultural diets influence fitness of Snow Geese is also
important. Wildlife managers have currently set a goal of 50,000 to 70,000 white (adult) birds
for the Fraser-Skagit population (Pacific Flyway Council 2006). However, the population is
beginning to exhibit signs of steady annual increase (Pacific Flyway Council 2006), a pattern
already observed in the mid-continent population of Lesser Snow Geese (Abraham et al. 2005).
In 2005 the Fraser-Skagit population was approximately 80,000 birds, a record high (Pacific
Flyway Council 2006). Energy and protein rich foods like potatoes, grain, and fall-sown cereals
may increase the amount of fat stored by Snow Geese, reducing winter mortality and increasing
breeding success, resulting in the observed population growth (Alisauskas 2002; Amano et al.
2004; Fox et al. 2005; Gauthier et al. 2005). An increasing population would put greater
foraging pressure on agricultural fields and the foreshore marshes of the Fraser delta. The
continued growth of the Fraser-Skagit population should be monitored and future research
should examine the interaction between Snow Geese, traditional marsh habitats, and upland
agricultural habitats. The carrying capacity of the foreshore marsh and different agricultural
areas should be assessed.
Snow Geese use upland farm crops more on the Skagit delta compared to Fraser delta
geese that continue to rely on foreshore marshes (S. Boyd. CWS. pers. comm. October 2006).
Habitat quality may differ between the Fraser and Skagit deltas. Differences in habitat quality
have been implicated in observed differences in reproductive success in wild geese (Black et al.
1991; Fox et al. 2005; Ward et al. 2005) and these differences may influence the future
78
distribution of Snow Geese. Understanding how fitness differs between the two populations
would be an asset to managers.
Providing Crops that Support Waterfowl
This study has shown that potato residues, barley grain, cover crops, and perennial
forages are important food sources for wintering Snow Geese. The total area of these crops
planted in a given year depends on the marketability of the crops. Cover crops are further
dependent on funding supplied to the Delta Farmland and Wildlife Trust, the non-profit
organization that administers the Greenfields Program.
Berry production, especially blueberry production, is growing in popularity due to the
high prices paid for these crops (Chapter 2). Consequently, farmland that was used to produce
vegetables is being converted to blueberries, which are rarely used by Snow Geese.
Furthermore, land that is converted to berry production cannot be readily used to produce
vegetables like potatoes, and grow cover crops. Increasing the acreage planted to berries
equates to less available land to support migratory waterfowl like Snow Geese.
Initiatives to protect vegetable and livestock farming by purchasing agricultural land
from farmers have proven successful. Ducks Unlimited Canada has obtained 142 ha on
Westham Island and Brunswick Point (V. Vanbeelen. DUC. pers. comm. summer 2006). The
land is leased to local farmers who work with Ducks Unlimited Canada to plan crop rotations
that will provide forage for migratory waterfowl. An additional 44 ha on Brunswick Point is
managed in cooperation with Ducks Unlimited Canada and local farmers to provide crops
beneficial to waterfowl.
Providing farmers with incentives to continue vegetable farming may also help limit the
planting of crops that do not support waterfowl. Consumers may be willing to pay more for
79
vegetables grown on farms that provide habitat for waterfowl (Pretty 2000). Non-profit
agencies like Ducks Unlimited Canada or Delta Farmland and Wildlife Trust could administer a
program that labelled local vegetables as "wildlife friendly" to encourage consumers to purchase
them. The extra income generated by such a program could encourage farmers to support
wildlife programs on their property.
Interactions with Other Waterfowl Species and Bald Eagles
Several other waterfowl species including American Wigeon, Trumpeter Swans, and
Canada Geese use agricultural habitats on the Fraser River delta. These species compete with
Snow Geese for crops and both likely depress the amount of available food for the other. A
similar example exists in the United Kingdom where Bean Geese and Eurasian Wigeon (Anas
penelope) compete for agricultural foods and biologists there have attempted to understand how
competition between the two species affects the carrying capacity of grass crops (Sutherland and
Allport 1993). Future research should consider how waterfowl species interact with each other
and their agricultural food supply. Fluctuations in either the Snow Goose population or other
waterfowl populations using the Fraser delta could affect other species drastically by increasing
or decreasing competition for food resources.
A specific example of interspecies competition involves barley and Canada Geese on the
Alaksen National Wildlife Area. Barley grain planted on the Alaksen National Wildlife Area
was a relatively rare (3% of my study area) but important crop type as it attracted Snow Geese.
Barley is planted in the late spring and early summer and left to mature over the summer and
early fall. The newly planted barley can be grazed by non-migratory Canada Geese (Branta
canadensis maxima). Barley plants that have their growth retarded due to grazing generally do
not produce seed heads because they are out competed by weeds (pers. obs.). If Canada Geese
80

graze spring and summer-sown barley, there may be less available grain biomass in the fall for
Snow Geese and other migratory waterfowl. This is likely the case because wheat and barley
yields grazed by Egyptian Geese (Alopochen aegyptiacus) can be reduced by as much as 65%
(Mangnall and Crowe 2002). It is important to assess this damage and take steps to alleviate it.
If non-migratory Canada Geese cause significant decreases in barley grain yields, it may be
necessary to exclude them from barley fields on the Alaksen National Wildlife Area during
summer.
Bald Eagles are predators of Snow Geese and flocks will flush when eagles pass
overhead. Taking flight expends energy (Klasing 1998) and interrupts feeding. Snow Geese
may avoid areas where the density of eagles is high in order to reduce disturbance and,
therefore, energy expenditure. Future research should examine how Bald Eagles influences
agricultural field use by Snow Geese.
81

LITERATURE CITED
Abraham, K.F. & Jefferies, R.L. (1997). High goose populations: causes, impacts and
implications. In Arctic Ecosystems in Peril: Report of the Arctic Goose Habitat Working
Group (ed B.D.J. Batt), pp. 7-72. U.S. Fish and Wildlife Service and Canadian Wildlife
Service, Washington, D.C and Ottawa.
Abraham, K.F. , Jefferies, R.L. & Alisauskas, R.T. (2005a) The dynamics of landscape change
and Snow Geese in mid-continent North America. Global Change Biology, 11(6), 841-
55.
Abraham, K.F., Jefferies, R.L. & Rockwell, R.F. (2005b) Goose-induced changes in vegetation
and land cover between 1976 and 1997 in an arctic coastal marsh. Arctic Antarctic and
Alpine Research, 37(3), 269-75.
Ackerman, J.T., Takekawa, J.Y., Orthmeyer, D.L., Fleskes, J.P., Yee, J.L. & Kruse, K . L . (2006)
Spatial use by wintering Greater White-fronted Geese relative to a decade of habitat
change in California's central valley. Journal of Wildlife Management, 70(4), 965-76.
Aebischer, N.J. & Robertson, P.A. (1993) Testing for resource use and selection in marine birds:
a comment. Journal of Field Ornithology, 65(2), 210-13.
Alisauskas, R.T. (2002) Arctic climate, spring nutrition, and recruitment in midcontinent Lesser
Snow Geese. Journal of Wildlife Management, 66(1), 181-93.
Alisauskas, R.T. & Ankney, C D . (1992). The cost of egg laying and its relationship to nutrient
reserves in waterfowl. In Ecology and management of breeding waterfowl (eds D.J. Batt,
A.D. Afton, M . G . Anderson, C D . Ankney, D.H. Johnson, J.A. Kadlec & G.L. Krapu),
pp. 30-61. University of Minnesota, Minnesota.
Alisauskas, R.T. & Ankney, C D . (1992) Spring habitat use and diets of midcontinent adult
Lesser Snow Geese. Journal of Wildlife Management, 56(1), 43-54.
82

Allport, G. (1991) The feeding ecology and habitat requirements of western taiga Bean Geese
(Anser fabalis fabalis), Ph.D. Dissertation, University of East Anglia, East Anglia,
Norwich.
Amano, T., Ushiyama, K., Fujita, G. & Higuchi, H . (2004a) Alleviating grazing damage by
White-fronted Geese: an optimal foraging approach. Journal of Applied Ecology, 41(4),
675-88.
Amano, T., Ushiyama, K., Fujita, G. & Higuchi, H . (2004b) Factors affecting rice grain density
unconsumed by White-fronted Geese in relation to wheat damage. Agriculture
Ecosystems & Environment, 102(3), 403-07
Amat, J.A. (1986) Numerical trends, habitat use, and activity of Greylag Geese wintering in
southwestern Spain. Wildfowl, 37, 35-45.
Amat, J.A., Garcia-Criado, B. & Garcia-Ciudad, A. (1991) Food, feeding behaviour and
nutritional ecology of wintering Greylag Geese Anser anser. Ardea, 79(2), 271-82.
Ankney, C D . & Maclnnes, C D . (1978) Nutrient reserves and reproductive performance of
female Lesser Snow Geese. Auk, 95(3), 459-71.
Ball, J.P., Danell, K. & Sunesson, P. (2000) Response of a herbivore community to increased
food quality and quantity: an experiment with nitrogen fertilizer in a boreal forest.
Journal of Applied Ecology, 37(2), 247-55.
Bedard, J. & Gauthier, G. (1989) Comparative energy budgets of Greater Snow Geese Chen
caerulescens atlantica staging in two habitats in spring. Ardea, 77(1), 3-20.
Bedard, J., Nadeau, A. & Gauthier, G. (1986) Effects of spring grazing by Greater Snow Geese
on hay production. Journal of Applied Ecology, 23(1), 65-75.
Belanger, L. & Bedard, J. (1989) Responses of staging Greater Snow Geese to human
disturbance. Journal of Wildlife Management, 53(3) 713-19.
83

Belanger, L. & Bedard, J. (1990) Energetic cost of man-induced disturbance to staging Snow
Geese. Journal of Wildlife Management, 54(1), 36-41.
Black, J .M., Deerenberg, C. & Owen, M . (1991) Foraging behaviour and site selection of
Barnacle Geese Branta leucopsis in a traditional and newly colonised spring staging
habitat. Ardea, 79(2), 349-58.
Borman, M . , Louhaichi, M . , Johnson, D.E., Krueger, W.C., Karow, R.S. & Thomas, D.R.
(2002) Yield mapping to document goose grazing impacts on winter wheat. Agronomy
Journal, 94(5), 1087-93.
Bos, D., Drent, R.H., Rubinigg, M . & Stahl, J. (2005) The relative importance of food biomass
and quality for patch and habitat choice in Brent Geese Branta bernicla. Ardea, 93(1), 5-
16.
Bos, D. & Stahl, J. (2003) Creating new forage opportunities for Dark-bellied Brent Branta
bernicla and Barnacle Geese Branta leucopsis in spring- insights from a large-scale
experiment. Ardea, 91(2), 153-65.
Bos, D., van de Koppel, J. & Weissing, F.J. (2004) Dark-bellied Brant Geese aggregate to cope
with increased levels of primary production. Oikos, 107(3), 485-96.
Boudewijn, T. (1984) The role of digestibility in the selection of spring feeding sites by Brent
Geese. Wildfowl, 35, 97-105.
Boyd, W.S. (1995) Lesser Snow Geese (Anser c. caerulescens) and American three-square
bulrush (Scirpus americanus) on the Fraser and Skagit River deltas, Ph.D. Dissertation,
Simon Fraser University, Burnaby, British Columbia.
Boyd, W.S. (2000) A comparison of photo counts versus visual estimates for determining the
size of Snow Goose flocks. Journal of Field Ornithology, 71(4), 686-90.
84
Brown, J .S . & Kotler, B.P. (2004) Hazardous duty pay and the foraging cost of predation.
Ecology Letters, 7(10), 999-1014.
Bruinzeel, L.W., van Eerden, M.R., Drent, R.H. & Vulink, J . T ! (1997). Scaling metabolisable
energy intake and daily energy expenditure in relation to the size of herbivorous
waterfowl: limits set by available foraging time and digestive performance. In
Patchwork, patch use, habitat exploitation and carrying capacity for water birds in
Dutch freshwater wetlands (ed M.R.v. Eerden), pp. 111-32. D. G. Rijkswaterstaat,
Lelystad.
Buchsbaum, R., Wilson, J . , &Valiela, I. (1986). Digestibility of plant constituents by Canada
Geese and Atlantic Brant. Ecology, 67(2), 386-393
Butler, R.W. & Campbell, R.W. (1987). The birds of the Fraser River delta: populations,
ecology and international significance. Canadian Wildlife Service Occasional Paper, pp.
71. Canadian Wildlife Service, Pacific and Yukon Region.
Cherry, S. (1996) A comparison of confidence interval methods for habitat use-availability
studies. Journal of Wildlife Management, 60(3), 653-58.
Cody, M . L . (1985). An introduction to habitat selection in birds. In Habitat selection in birds
(ed M . L . Cody), pp. 4-56. Academic, Orlando.
Cope, D.R., Pettifor, R.A., Giffin, L.R. & Rowcliffe, J . M . (2003) Integrating farming and
wildlife conservation: the Barnacle Goose management scheme. Biological
Conservation, 110(1), 113-22.
Crawley, M . J . (1983) Herbivory: the dynamics of animal-plant interactions Blackwell
Scientific, Oxford.
Cresswell, W. (1994) Age-dependent choice of Redshank (Tringa tetanus) feeding location:
profitability or risk? Journal of Animal Ecology, 63(3), 589-600.
85

Daniel, W.W. (1990) Applied nonparametric statistics, 2 edn. PWS-Kent, Boston.
Davis, S.E. & Klaas, E.E.K., K.J . (1989) Diurnal time-activity budgets and habitat use of Lesser
Snow Geese Anser caerulescens in the middle Missouri River Valley during winter and
spring. Wildfowl, 40, 45-54.
Delta Board of Trade. (1927). The Prolific Delta. In Delta Board of Trade, Ladner.
Delta Farmers Institute. (1949). No Title. In The Delta Optimist, November 24, 1949 Delta.
Drent, R., Ebbinge, E. & Weijand, B. (1978/1979) Balancing the energy budgets of arctic-
breeding geese throughout the annual cycle: a progress report. Verhandlung
Ornithologische Gesellschaft Bayern, 23, 239-64.
Drescher, M„ Heitkonig, I.M.A., Van Den Brink, P.J. & Prins, H.H.T. (2006) Effects of sward
structure on herbivore foraging behaviour in a South African savannah: an investigation
of the forage maturation hypothesis. Austral Ecology, 31(1), 76-87.
Durant, D., Fritz, H. & Duncan, P. (2004) Feeding patch selection by herbivorous Anatidae: the
influence of body size, and of plant quantity and quality. Journal of Avian Biology,
35(2), 144-52.
Ebbinge, B.S. (1991) The impact of hunting on mortality rates and spatial distribution of geese
wintering in the western Palearctic. Ardea, 79(2), 197-210.
Environment Canada. (2004). Canadian climate normals 1971-2000.
<http://www.climate.weatheroffice.ec.gc.ca/climate_normals/results_e.html> Last
updated February 25, 2004. Last accessed July 6, 2006
Fox, A.D. & Madsen, J. (1997) Behavioural and distributional effects of hunting disturbance on
waterbirds in Europe: implications for refuge design. Journal of Applied Biology, 34(1),
1-13.
86

Fox, A.D. , Madsen, J., Boyd, FL, Kuijken, E., Norriss, D.W., Tombre, I.M. & Stroud, D.A.
(2005) Effects of agricultural change on abundance of two-arctic nesting goose
populations. Global Change Biology, 11(6), 881-93.
Fryxell, J .M. (1991) Forage quality and aggregation by large herbivores. American Naturalist,
138(2), 478-98.
Gates, R.J., Caithamer, D.F., Moritz, W.E. & Tacha, T.C. (2001) Bioenergetics and nutrition of
Mississippi Valley population Canada geese during winter and migration. Wildlife
Monographs, 146, 1-65.
Gauthier, G. & Bedard, J. (1990) The role of phenolic compounds and nutrients in determining
food preference in Greater Snow Geese. Oecologia, 84(4), 553-58.
Gauthier, G., Giroux, J.F. & Bedard, J. (1992) Dynamics of fat and protein reserves during
winter and spring migration in greater snow geese. Canadian Journal of Zoology,
70(11), 2077-87.
Gauthier, G., Giroux, J.F., Reed, A. , Bechet, A. & Belanger, L. (2005) Interactions between land
use, habitat use, and population increase in Greater Snow Geese: what are the
consequences for natural wetlands? Global Change Biology, 11(6), 856-68.
Gauthier, G. & Hughes, R.J. (1995) The palatability of arctic willow for Greater Snow Geese:
the role of nutrients and deterring factors. Oecologia, 103(3), 390-92.
Gi l l , J.A. (1996) Habitat choice in Pink-footed Geese: quantifying the constraints determining
winter site use. Journal of Applied Ecology, 33(4), 884-92.
Gi l l , J.A., Sutherland, W.J. & Watkinson, A.R. (1996a) A method to quantify the effects of
human disturbances on animal populations. Journal of Applied Ecology, 33(4), 786-92.
87
Gil l , J.A., Watkinson, A.R. & Sutherland, W.J. (1996b) The impact of sugar beet farming
practices on wintering Pink-footed Goose Anser brachyrhynchus populations. Biological
Conservation, 76(2), 95-100.
Gi l l , M . , Beever, D.E. & Osbourn, D.F. (1989). The feeding value of grass and grass products.
In Grass: its production and utilization (ed W. Homes), pp. 89-129. Blackwell, Oxford.
Gross, J.E., Shipley, L .A. , Hobbs, N.T., Spalinger, D.E. & Wunder, B.A. (1993) Functional
response of herbivores in food-concentrated patches: tests of a mechanistic model.
Ecology Letters, 74(3), 778-91.
Guillemette, M . , Ydenberg, R.C. & Himmelman, J.H. (1992) The role of energy-intake in prey
and habitat selection of Common Eiders Somateria mollissma in winter: a risk sensitive
interpretation. Journal of Animal Ecology, 61(3), 599-610.
Hassall, M . & Lane, S.J. (2001) Effects of varying rates of autumn fertilizer applications to
pastures in eastern England on feeding sites selection by Brent Geese Branta b. bernicla.
Agriculture Ecosystems & Environment, 86(2), 203-09.
Hassall, M . & Lane, S.J. (2005) Partial feeding preferences and the profitability of winter-
feeding sites for Brent Geese. Basic and Applied Ecology, 6(6), 559-70.
Hassall, M . , Riddington, R. & Helden, A . (2001) Foraging behaviour of Brent Geese, Branta b.
bernicla, on grasslands: effects of sward length and nitrogen content. Oecologia, 127(1),
97-104.
Hatfield, J.P. (1991). Use of the Alaksen National Wildlife Area by waterfowl, 1973-1987.
Technical Report Series No. 113, pp. 82. Canadian Wildlife Service, Pacific and Yukon
Region, Delta.
Hi l l , M.R.J. & Fredrick, R.B. (1997) Winter movements and habitat use by Greater Snow
Geese. Journal of Wildlife Management, 61(4), 1213-21.
88
Hobaugh, W.C. (1984) Habitat use by Snow Geese wintering in southeast Texas. Journal of
Wildlife Management, 48(4), 1085-96.
Holbrook, S.J. & Schmitt, R.J. (1988) The combined effects of predation risk and food reward
on patch selection. Ecology Letters, 69(1), 125-34.
Holling, C S . (1959) Some characteristics of simple types of predation and parasitism. Canadian
Entomologist, 91, 385-98.
Hutto, R.L. (1985). Habitat selection by nonbreeding migratory land birds. In Habitat selection
in birds, (ed M . L . Cody), pp. 455-76. M . L . Academic, Orlando.
Inger, R., Ruxton, G.D., Newton, J., Colhoun, K., Mackie, K., Robinson, J.A. & Bearhop, S.
(2006) Using daily ration models and stable isotope analysis to predict biomass depletion
by herbivores. Journal of Applied Ecology, 43(5), 1022-30.
Jacobs, J. (1974) Quantitative measurement of food selection: a modification of the forage ratio
and Ivlev's index. Oecologia, 14(4), 413-17.
Jefferies, R.L., Rockwell, R.F. & Abraham, K.E . (2004) Agricultural food subsidies, migratory
connectivity and large-scale disturbance in arctic coastal systems: A case study.
Integrative and Comparative Biology, 44(2), 130-39.
Jepsen, P.U. (1991) Crop damage and management of the Pink-footed Goose Anser
brachyrhynchus in Denmark. Ardea, 79(2), 191-94.
Kear, J. (1963) The history of potato-eating by wildfowl in Britain. Wildfowl, 14, 54-65.
Klasing, K . C (1998) Comparative avian nutrition C A B International, Walingford.
Kotanen, P. & Jefferies, R.L. (1997) Long-term destruction of wetland vegetation by Lesser
Snow Geese. Ecoscience, 4(2), 1895-98.
89
Krapu, G.L. & Reinecke, K.J . (1992). Foraging ecology and nutrition. In Ecology and
management of breeding waterfowl (eds D.J. Batt, A.D. Afton, M . G . Anderson, C D .
Ankney, D.H. Johnson, J.A. Kadlec & G.L. Krapu), pp. 1-29. University of Minnesota,
Minnesota.
Krapu, G.L., Reinecke, K.J . , Jorde, D.G. & Simpson, S.G. (1995) Spring-staging ecology of
midcontinent Greater White-fronted Geese. Journal of Wildlife Management, 59(4), 736-
46.
Lacher Jr., T.E., Willig, M.R. & Mares, M . A . (1982) Food preference as a function of resource
abundance with multiple prey types: an experimental analysis of optimal foraging
theory. American Naturalist, 120(3), 297-316.
Laursen, K., Kahlert, J. & Frikke, J. (2005) Factors affecting escape distances of staging
waterbirds. Wildlife Biology, 11(1), 13-19.
Lin, Y . K . & Batzli, G.O. (2001) The effect of interspecific competition on habitat selection by
voles: an experimental approach. Canadian Journal of Zoology, 79(1), 110-20.
Madsen, J. (1985a) Habitat selection of farmland feeding geese in West Jutland, Denmark: an
example of niche shift. Ornis Scandinavica, 16(2), 140-44.
Madsen, J. (1985b) Impact of disturbance on field utilization of Pink-footed Geese in Jutland,
Denmark. Biological Conservation, 33(1), 53-63.
Madsen, J. (1985c) Relations between changes in spring habitat selection and daily energetics of
Pink-footed Geese Anser brachyrhynchus. Ornis Scandinavica, 16(3), 222-28.
Madsen, J. (1998) Experimental refuges for migratory waterfowl in Danish wetlands. II. tests of
hunting disturbance effects. Journal of Applied Ecology, 35(3), 398-417.
Madsen, J. (2001) Can geese adjust their clocks? Effects of diurnal regulation of goose shooting.
Wildlife Biology, 7(3), 213-22.
90
Madsen, J. & Fox, A.D. (1995) Impacts of hunting disturbance on waterbirds - a review.
Wildlife Biology, 1(4), 193-207.
Mangnall, M.J. & Crowe, T .M. (2002) Population dynamics and the physical and financial
impacts to cereal crops of the Egyptian Goose Alopochen aegyptiacus on the Agulhas
Plain, Western Cape, South Africa. Agriculture, Ecosystems and Environment, 90(3),
231-46.
Manly, B.F.J., MacDonald, L .L . , Thomas, D.L., MacDonlad, T.L. & Erickson, W.P. (2002)
Resource selection by animals: statistical design and analysis for field studies, 2 ed.
Kluwer Academics, Dordrecht.
Marriot, R.W. & Forbes, D.K. (1970) The digestion of lucerne chaff by Cape Barren Geese,
Cereopsis novaehollandiae Latham. Australian Journal of Zoology, 18(3), 257-63.
Martin, R . C , Astatkie, T., Cooper, J .M. & Fredeen, A . H . (2005) A comparison of methods used
to determine biomass on naturalized swards. Journal of Agronomy and Crop Science,
191(2), 152-60.
Mattocks, J.G. (1971) Goose feeding and cellulose digestion. Wildfowl, 22, 107-13.
McKay, H.V., Bishop, J.D. & Ennis, D.C. (1994) The possible importance of nutritional
requirements for Dark-bellied Brent Geese in the seasonal shift from winter cereals to
pasture. Ardea, 82(1), 123-32.
McKay, H.V., Bishop, J.D., Feare, C J . & Stevens, M.C. (1993) Feeding by Brent Geese can
reduce yield of oilseed rape. Crop Protection, 12(2), 101-05.
McKay, H.V., Langton, S.D., Milsom, T.P. & Feare, C J . (1996) Prediction of field use by Brent
Geese; an aid to management. Crop Protection, 15(3), 259-68.
91

McKay, H.V., Milsom, T.P., Feare, C.J., Ennis, D.C, O'Connell, D.P. & Haskell, D.J. (2001)
Selection of forage species and the creation of alternative feeding areas for Dark-bellied
Brent Geese Branta bernicla bernicla in southern UK coastal areas. Agriculture,
Ecosystems and Environment, 84(2), 99-113.
McKay, H.V., Watola, G.V., Langton, S.D. & Langton, S.A. (2006) The use of agricultural
fields by re-established Greylag Geese (Anser anser) in England: a risk assessment.
Crop Protection, 25(9), 996-1003.
McLandress, M.R. & Raveling, D.G. (1981) Changes in diet and body composition of Canada
Geese before spring migration. Auk, 98(1), 65-79.
Meire, P. & Kuijken, E. (1991) Factors affecting the number and distribution of wintering geese
and some implications for their conservation in Flanders Belgium. Ardea, 79(2), 143-58.
Milinski, M . (1985) Risk of predation taken by parasitised fish under competition for food.
Behaviour, 93(2), 203-16.
Moore, J.E. & Black, J.M. (2006) Slave to the tides: spatiotemporal foraging dynamics of spring
staging Black Brant. Condor, 108(3), 661-77.
National Academy of Sciences. (1971) Atlas of nutritional data of United States and Canadian
feeds National Academy of Sciences, Washington, DC.
Neu, C.W., Byers, C R . & Peek, J.M. (1974) A technique for analysis of utilization-availability
data. Journal of Wildlife Management, 38(3), 541-45.
Newton, I. & Campbell, C.R.G. (1973) Feeding of geese on farmland in Scotland. Journal of
Applied Ecology, 10(3), 781-801.
Owen, M . (1972) Movements and feeding ecology of White-fronted Geese at the New Grounds,
Slimbridge. Journal of Applied Ecology, 9(2), 385-98.
Owen, M . (1973) The management of grassland areas for wintering geese. Wildfowl, 24, 123-30.
92

Owen, M . (1975) Cutting and fertilizing grassland for winter goose management. Journal of
Wildlife Management, 39(1), 163-67.
Owen, M . (1980) Wild geese of the world: their life history and ecology Batsford, London.
Owen, M . (1990) The damage-conservation interface illustrated by geese. Ibis, 132(2), 238-52.
Owen, M . & Black, J .M. (1991) Geese and their future fortune. Ibis, 133(1), 28-35.
Owen, M . , Black, J .M., Agger, M . K . & Campbell, C.R.G. (1987) The use of the Solway Firth,
Britain, by Barnacle Geese Branta leucopsis in relation to refuge establishment and
increases in numbers. Biological Conservation, 39(1), 63-81.
Pacific Flyway Council. (2006). Pacific flyway management plan for the Wrangel Island
population of Lesser Snow Geese, pp. 40. White Goose Subcommitee and Pacific
Flyway Study Commitee, Portland, unpublished report.
Patterson, I.J. (1991) Conflict between geese and agriculture: does goose grazing cause damage
to crops? Ardea, 79(2), 179-86.
Patterson, I.J. & Fuchs, R.M.E. (2001) The use of nitrogen fertilizer on alternative grassland
feeding refuges for Pink-footed Geese in spring. Journal of Applied Ecology, 38(3), 637-
46.
Percival, S.M. (1993) The effects of reseeding, fertilizer application and disturbance on the use
of grasslands by barnacle geese, and the implications for refuge management. Journal of
Applied Ecology, 30(3), 437-43.
Percival, S.M., Halpin, Y . & Houston, D.C. (1997) Managing the distribution of Barnacle Geese
on Islay, Scotland, through deliberate human disturbance. Biological Conservation,
82(3), 273-77.
Percival, S.M. & Houston, D.C. (1992) The effect of winter grazing by Barnacle Geese on
grassland yields on Islay. Journal of Applied Ecology, 29(1), 35-40.
93
Percival, S.M., Sutherland, W.J. & Evans, P.R. (1996) A spatial depletion model of the
responses of grazing waterfowl to the availability of intertidal vegetation. Journal of
Applied Ecology, 33(4), 979-92.
Pouliot, C.L. & Loesch, T.N. (2005) DNR Garmin V 5 . l l . State of Minnesota, Department of
Natural Resources, St. Paul.
Pretty, J. (2000) Towards sustainable food and farming systems in industrialized countries.
International Journal of Agricultural Resources, Governance and Ecology, 1(1), 77-94.
Prevett, J.P. & Maclnnes, C D . (1980) Family and other social groups in snow geese. Wildlife
Monographs, 71, 6-44.
Prins, H.H.T. & Ydenberg, R . C (1985) Vegetation growth and a seasonal habitat shift of the
Barnacle Goose {Branta leucopsis). Oecologia, 66(1), 122-25.
Prop, J. & Deerenberg, C. (1991) Spring staging in Brent Geese Branta bernicla: feeding
constraints and the impact of diet on the accumulation of body reserves. Oecologia,
87(1), 19-28.
Prop, J., van Eerden, M.R. & Drent, R.H. (1984) Reproductive success of the Barnacle Goose
Branta leucopsis in relation to food exploitation on the breeding grounds in western
Spitsbergen. Norsk Polarinstitutt Skriftner, 181, 87-117.
Prop, J. & Vulink, T. (1992) Digestion by Barnacle Geese in the annual cycle: the interplay
between retention time and food quality. Functional Ecology, 6(2), 180-89.
Raveling, D.G. & Zezulak, D.S. (1991) Autumn diet of Cackling Canada Geese in relation to
age and nutrient demand. California Fish and Game, 77(1), 1-9.
Riddington, R., Hassall, M . & Lane, S.J. (1997) The selection of grass swards by Brent Geese
Branta b. bernicla: interactions between food quality and quantity. Biological
Conservation, 81(1-2), 153-60.
94
Robertson, D.G. & Slack, R.D. (1995) Landscape change and its effects on the wintering range
of Lesser Snow Goose Chen caerulescens caerulescens population: a review. Biological
Conservation, 71(2), 179-85.
Rowcliffe, J .M., Sutherland, W.J. & Watkinson, A.R. (1999) The functional and aggregative
responses of a herbivore: underlying mechanisms and spatial implications for plant
depletion. Journal of Animal Ecology, 68(5), 853-68.
Rowcliffe, J .M., Watkinson, A.R. & Sutherland, W.J. (1998) Aggregative responses of Brent
Geese on salt marsh and their impact on plant community dynamics. Oecologia, 114(3),
417-26.
Rowcliffe, J .M., Watkinson, A.R., Sutherland, W.J. & Vickery, J.A. (2001) The depletion of
algal beds by geese: a predictive model and test. Oecologia, 127(3), 361-71.
Schoener, T.W. (1971) Theory of feeding strategies. Annual Review of Ecology and Systematics,
2,369-404.
Sedinger, J.S. (1997) Adaptations to and consequences of an herbivorous diet in grouse and
waterfowl. Condor, 99(2), 314-26.
Smith, B. (1995). Agricultural Exhibition. Delta Museum and Archives, Delta
Smith, D.W., Moore, K., Fry, K., Buffet, D., Komaromi, J. & Porter, M . (2000). Winter
waterfowl use on Westham Island, British Columbia 1995-1997, pp. 15. Canadian
Wildlife Service, Pacific and Yukon Region, unpublished report.
Spaans, B. & Postma, P. (2001) Inland pastures are an appropriate alternative for salt-marshes as
a feeding area for spring-fattening Dark-bellied Brent Geese Branta bernicla. Ardea,
89(3), 427-40.
Statistics Canada. (1981). Agriculture: British Columbia. Minister of Supply and Services,
Ottawa.
95

Statistics Canada. (1991). Agriculture: British Columbia. Minister of Supply and Services,
Ottawa.
Steele, M . A : & Weigl, P.D. (1992) Energetics and patch use in the fox squirrel Sciurus niger.
responses to variation in prey profitability and patch density. American Midland
Naturalist, 128(1), 156-67.
Stenhouse, I.J. (1996) The feeding behaviour of Greylag and Pink-footed Geese around the
Moray Firth, 1992-93. Scottish Birds, 18, 223-30.
Stephens, D.W. & Krebs, J.R. (1986) Foraging theory Princeton University Press, New Jersey.
Stephens, D.W., Lynch, J.F., Sorensen, A.E . & Gordon, C. (1986) Preference and profitability:
theory and experiment. American Naturalist, 127(4), 533-53.
Summers, R.W. & Atkins, C. (1991) Selection by Brent Geese Branta bernicla for different leaf
lengths of Aster tripolium on saltmarsh. Wildfowl, 42, 33-36.
Summers, R.W. & Critchley, C.N.R. (1990) Use of grassland and field selection by Brent Geese
Branta bernicla. Journal of Applied Ecology, 27(3), 834-46.
Summers, R.W. & Stansfield, J. (1991) Changes in the quantity and quality of grassland due to
winter grazing by Brent Geese {Branta bernicla). Agriculture, Ecosystems, and
Environment, 36(1-2), 51-57.
Sutherland, W.J. & Allport, G.A. (1993) A spatial depletion model of the interaction between
Bean Geese and Wigeon with the consequences for habitat management. Journal of
Applied Ecology, 63(1), 51-59.
Sutherland, W.J. & Crockford, N.J. (1993) Factors affecting the feeding distribution of Red-
breasted Geese Branta ruficollis wintering in Romania. Biological Conservation, 63(1),
61-65.
96
Temple, W.D., Bomke, A . A . , L. , P., A. , P. & Smith, R. (2001). Farmland stewardship in Delta:
final report, p 174. Delta Farmland and Wildlife Trust, Delta, unpublished report.
Therkildsen, O.R. & Madsen, J. (1999) Goose selectivity along a depletion gradient. Ecography,
22(5), 516-20.
Therkildsen, O.R. & Madsen, J. (2000) Energetic of feeding on winter wheat versus pasture
grasses: a window of opportunity for winter range expansion in the Pink-footed Goose
Anser brachyrhynchus. Wildlife Biology, 6(2), 65-74.
Tinbergen, J .M. (1981) Foraging decisions in Starlings (Sturnus vulgaris). Ardea, 69(1), 1-67.
Ungar, E.D. & Noy-Meir, I. (1998) Herbage intake in relation to availability and sward
structure: grazing processes and optimal foraging. Journal of Applied Ecology, 25(3),
1045-62.
van der Graaf, A. , P., C. & Stahl, J. (2006) Sward height and bite size affect the functional
response of Barnacle Geese Branta leucopsis. Journal of Ornithology, 147(3), 479-84.
van Eerden, M.R. (1997). Waterfowl movements in relation to food stocks. In Patchwork, patch
use, habitat exploitation and carrying capacity for water birds in Dutch freshwater
wetlands (ed M.R.v. Eerden), pp. 151-64. D. G. Rijkswaterstaat, Lelystad.
van Eerden, M.R., Drent, R.H., Stahl, J. & Bakker, J.P. (2005) Connecting seas: western
Palaearctic continental flyway for waterbirds in the perspectives of changing land use
and climate. Global Change Biology, 11(6), 894-908.
van Eerden, M.R., Zijlstra, M . , van Roomen, M . & Timmerman, A. (1996) The response of
Anatidae to changes in agricultural practice: long-term shifts in the carrying capacity of
wintering waterfowl. Gibier Faune Sauvage, 13(2), 681-706.
Vickery, J.A. & Gi l l , J.A. (1999) Managing grassland for wild geese in Britain: a review.
Biological Conservation, 89(1), 93-106.
97
Vickery, J.A., Watkinson, A.R. & Sutherland, W J . (1994) The solution to the Brent Goose
problem: an economic analysis. Journal of Applied Ecology, 31(2), 371-82.
Waite, S. (2000) Statistical ecology in practice: a guide to analysing environmental and
ecological field data Prentice Hall, Harlow.
Ward, D.H., A. , R., Sedinger, J.S., Black, J .M., Derksen, D.V. & Castelli, P .M. (2005) North
American Brant: effects of changes in habitat and climate on population dynamics.
Global Change Biology, 11(6), 869-80.
Werner, E.E., Mittelbach, G.G. & Hall, D.J. (1983) Experimental tests of optimal habitat use in
fish: the role of relative habitat profitability. Ecology, 64(6), 1525-39.
White, T.C.R. (1991) The inadequate environment: nitrogen and the abundance of animals
Springer-Verlag, Berlin.
Wilmhurst, J.F. & Fryxell, J .M. (1995) Patch selection by red deer in relation to energy and
protein intake: a re-evaluation of Langvatn and Hanley's (1993) results. Oecologia,
104(3), 297-300.
Zar, J.H. (1999) Biostatistical analysis, 4 ed. Prentice Hall, New Jersey.
Zbeetnoff, D . M . & McTavish, R.B. (2004). BC wildlife damage compensation pilot projects:
evaluation report, pp. 85. Zbeetnoff Agro-Environmental Consulting and McTavish
Resource and Management Consultants Ltd., White Rock and Surrey.
Zydelis, R., Esler, D., Boyd, W.S., Lacroix, D.L. & Kirk, M . (2006) Habitat use by wintering
Surf and White-wing Scoters: effects of environmental attributes and shellfish
aquaculture. Journal of Wildlife Management, 70(6), 1754-62.
98


