Leveraging Technology, Market Creation and the Private Sector to Improve Global Access to Power
Briefing to Japan MOFA Advisory Panel on Climate Change | March 5, 2018

2
Power Critical for Development: Access to power is essential to achieve the Twin Goals of poverty alleviation and shared prosperity
1
…as the power sector is one of the most important drivers of development
There is a significant need to scale up investment in emerging market power…
Access
1.2 billion individualscurrently lack access to electricity
Reliability
Outages are more than 6x more likelyin emerging markets Efficiency &
Sustainability
Total GHG emissions in LICs and MICs are 2.2x larger than HICs
Growth Gender Literacy Health
Recent gas-fired project in Bangladesh increased employment by ~1 million and increased GDP by 1.7% annually1
Female employment rates increased by 9% after rural households in South Africa gained access to electricity2
In the Indian state of Assam, complete rural electrification could raise the literacy rate from 63% to 74%3
Household electrification in El Salvador reduced the incidence of acute respiratory infections among children by 34%3
1 IFC internal estimates using SAM input/output models 2 Makoto Kanagawa and Toshihiko Nakata, “Assessment of access to electricity and the socioeconomic 2 World development report 2012: Gender equality and development, World Bank, September 2011. 3 Manuel Barron and Maximo Torero, “Household electrification and Indoor Air Pollution,” OCF Berkeley impacts in rural areas of developing countries,” Energy Policy, volume 36, issue 6, June 2008

3
Power Critical for Development: Power investments are needed to address energy access, reliability and climate change across regions
1 World Bank WDI Database – Electricity access rates 2014, CO2 emissions 20132 Doing Business – Getting Electricity Database 2016, Reliability and Transparency of Tariff Index, inverse (0=most reliable, 8= least reliable)3 Doing Business – Getting Electricity Database 2016, measured as cost of obtaining permanent electricity connection for a newly constructed warehouse
as a percentage of average income per capita
1
Development potential in power sector by regionOf the 1bn+people in LICs and MICs without access to electricity, ~90% are found in Sub-Saharan Africa (~600mn) and South Asia (~340mn)
Electricity supply is unreliable across developing regions, but the problem is acute in Sub-Saharan Africa (7.4) and South Asia (5.9)
CO2 emissions are most concentrated in regions with relatively better electricity access, such as Europe & Central Asia, and East Asia
High residential tariffs are common across Africa, e.g. Cape Verde ($0.54/kwh), Burkina Faso ($0.32/kwh), Mali ($0.29/kwh), Namibia ($0.29/kwh),
Access and reliability needs are prevalent in regions with high proportion of LIC-IDA and FCS countries
Electricity access gap (% of population without electricity)1
Unreliability of electricity supply (0-8)2
Cost of electricity (multiple of average income per capita)3
CO2 emissions (gigatons)1
Latin America and Caribbean
3.13.8 10x
1.7
Sub-Saharan Africa
62.5 7.4 39x
0.9
Middle East and North Africa
3.53.8
8x 1.4
South Asia
20.0
5.9
12x 2.3
Europe and Central Asia0.0 2.8 4x
3.1
East Asia and Pacific
3.8
4.47x
11.6

4SOURCE: EIA, GTM research, WEF, World Energy Investment, UNEP's 10th Global Trends in Renewable Energy Investment, Bloomberg New Energy Finance
Power for Development: The power sector is experiencing profound changes, driven by shifts in technology and business models
1 As reported by the World Economic Forum in Dec 2016
1
Shift in generation away from fossil fuels to renewables
▪ Power generation is shifting away from fossil fuels to renewables, as solar PV and wind have reached price parity with new fossil fuel capacity in more than 30 countries1
– Renewables made up more than half of cumulative planned capacity additions by end of 2016
Increasing importance of grid flexibility and resiliency
▪ Grids must be made more flexible and resilient via new investments and technologies to accommodate new renewables and increase efficiency– Global smart grid market is expected to surpass $60bn in 2020; although
majority is expected to be in OECD, investments in emerging markets are expected to follow
Rapid growth of distributed generation
▪ In regions where the grid is unavailable, unreliable or the cost of connection and power is high, there will be continued growth in distributed generation– Distributed generation accounted for $46bn of investment in 2015
Increase in new business model innovations
▪ Innovative businesses that deliver power as a service directly to consumers are growing (e.g., Mobisol which provides solar home systems via a PAYGOmodel) and are increasing their market share of consumer spend on power at the expense of traditional utilities.
Shift in capital flows to key sub-sectors and emerging markets
▪ Capital flows are shifting to renewables, distributed generation and to select emerging markets, creating more competitive capital markets– Lower cost capital for power sector investments is increasingly being provided
by local and international commercial banks, regional development banks, export credit agencies, and bilateral financing agencies – often via auctions
5
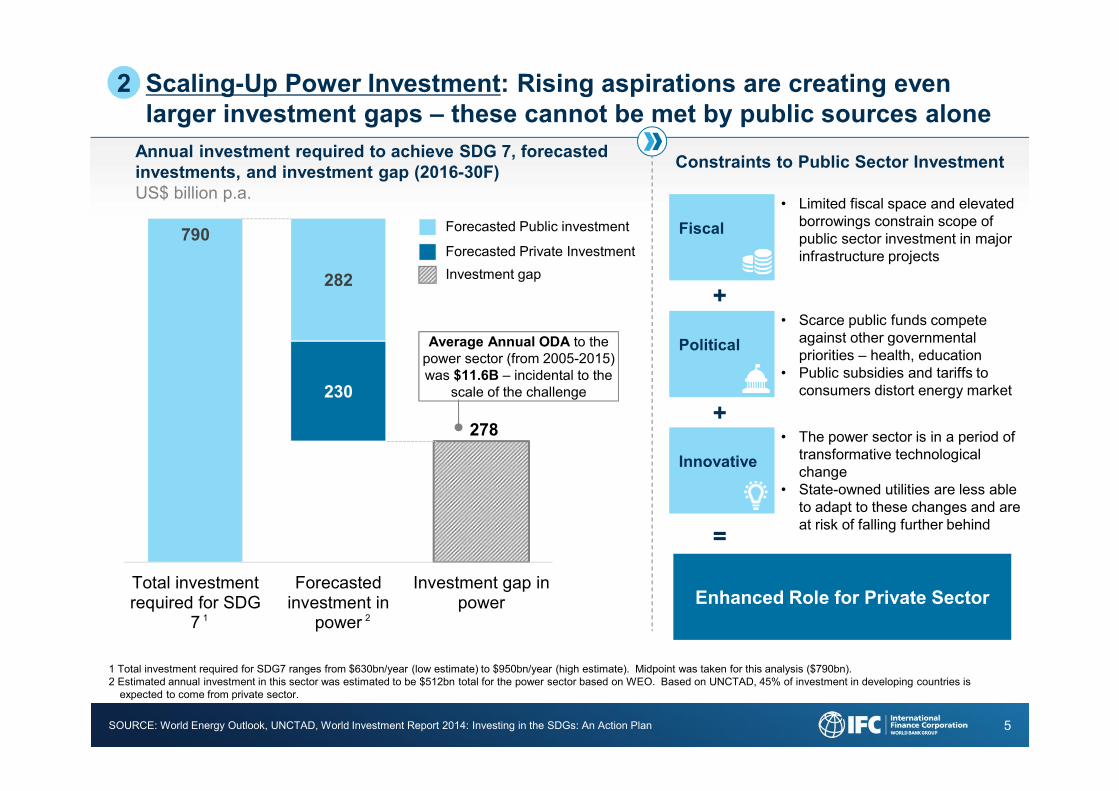
Scaling-Up Power Investment: Rising aspirations are creating even larger investment gaps – these cannot be met by public sources alone
2
SOURCE: World Energy Outlook, UNCTAD, World Investment Report 2014: Investing in the SDGs: An Action Plan
1 Total investment required for SDG7 ranges from $630bn/year (low estimate) to $950bn/year (high estimate). Midpoint was taken for this analysis ($790bn). 2 Estimated annual investment in this sector was estimated to be $512bn total for the power sector based on WEO. Based on UNCTAD, 45% of investment in developing countries is
expected to come from private sector.
Annual investment required to achieve SDG 7, forecasted investments, and investment gap (2016-30F)US$ billion p.a.
Forecasted Public investment
Investment gap
Average Annual ODA to the power sector (from 2005-2015) was $11.6B – incidental to the
scale of the challenge
790
278
230
282
Total investmentrequired for SDG
7
Forecastedinvestment in
power
Investment gap inpower
Forecasted Private Investment
Constraints to Public Sector Investment
Fiscal
Political
Innovative
• Limited fiscal space and elevated borrowings constrain scope of public sector investment in major infrastructure projects
• Scarce public funds compete against other governmental priorities – health, education
• Public subsidies and tariffs to consumers distort energy market
• The power sector is in a period of transformative technological change
• State-owned utilities are less able to adapt to these changes and are at risk of falling further behind
+
+
=
Enhanced Role for Private Sector 1 2

6
Scaling-Up Power Investment: Private sector also faces challenges in scaling-up investment
2
Generation
Disruptive Technology
Challenges in attracting private investment▪ Lack of adequate procurement regimes in emerging markets inhibits direct
investment in generation projects
▪ Strong public sector presence for political economy reasons, limiting competition and crowding out private investment
▪ Subsidies and below market tariffs inhibit cost recovery and necessary upkeep
▪ Financially weak utilities and lack of alternate buyers
Transmission&Distribution
▪ Poor performance of T&D sub-sector undermines the soundness of the entire power sector
▪ Sub-sector traditionally operated by SOEs across emerging markets– SOEs with weak governance and corporate structures as well as low
operational efficiency dissuade private investment
▪ Rural and remote customers in areas with high-need complicate T&D economics and limit scale and scope of progress
▪ Governments are unable to keep up with the rapid pace of technology-driven change within the power sector and hence are behind in creating business enabling environment to capitalize on new technology
7
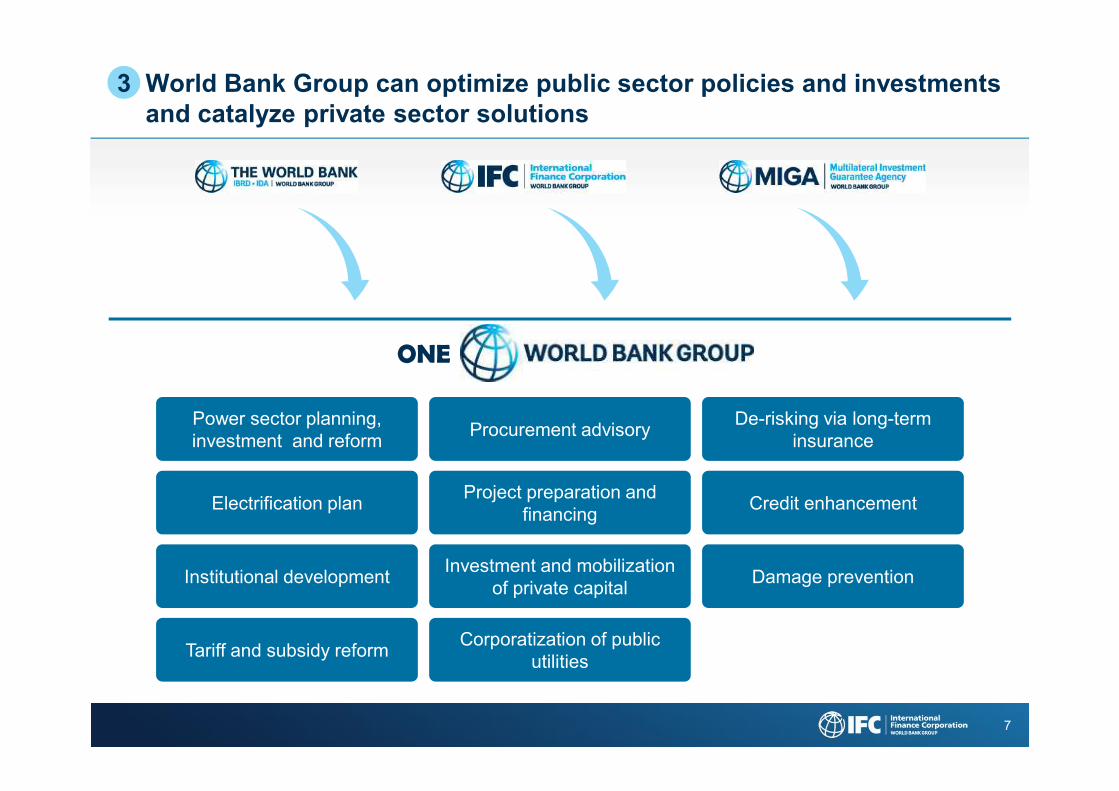
World Bank Group can optimize public sector policies and investments and catalyze private sector solutions
3
ONE
Power sector planning, investment and reform
De-risking via long-term insurance
Electrification plan Credit enhancement
Institutional development Damage prevention
Tariff and subsidy reform
Procurement advisory
Project preparation and financing
Investment and mobilization of private capital
Corporatization of public utilities
8
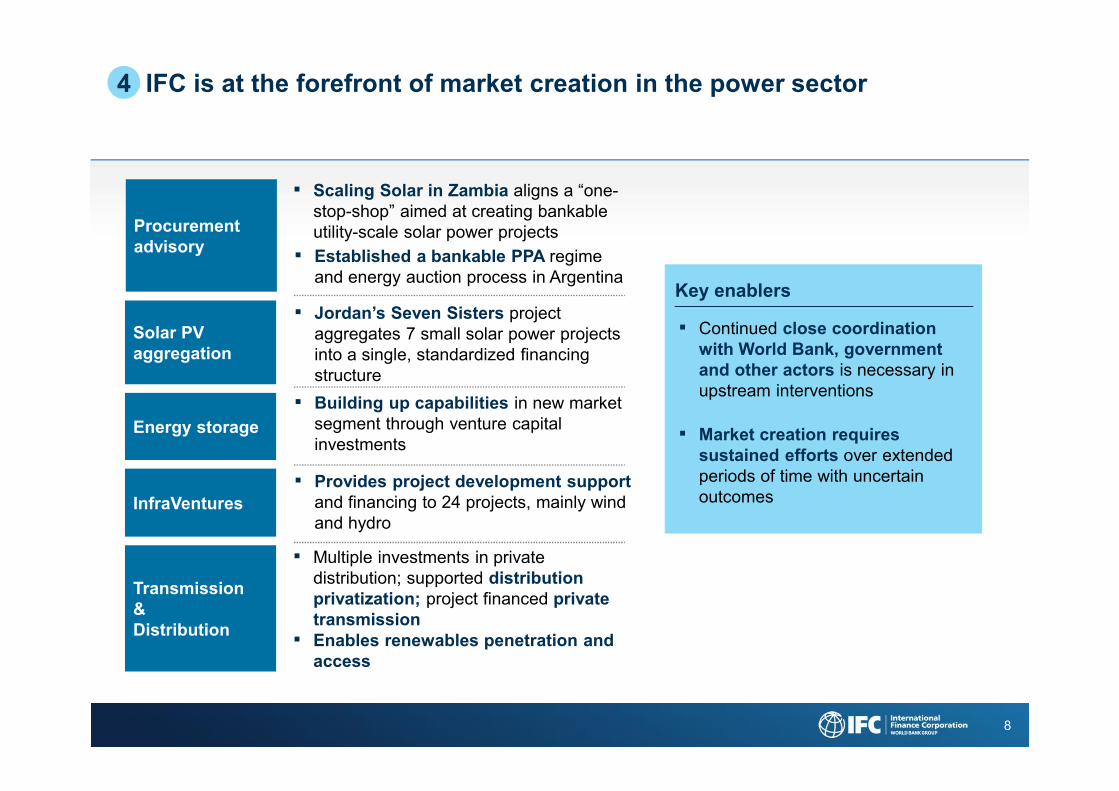
IFC is at the forefront of market creation in the power sector4
Procurement advisory
Solar PV aggregation
InfraVentures
Transmission&Distribution
▪ Continued close coordination with World Bank, government and other actors is necessary in upstream interventions
▪ Market creation requires sustained efforts over extended periods of time with uncertain outcomes
Energy storage
▪ Jordan’s Seven Sisters project aggregates 7 small solar power projects into a single, standardized financingstructure
▪ Scaling Solar in Zambia aligns a “one-stop-shop” aimed at creating bankable utility-scale solar power projects
▪ Provides project development support and financing to 24 projects, mainly wind and hydro
▪ Established a bankable PPA regime and energy auction process in Argentina
▪ Multiple investments in private distribution; supported distribution privatization; project financed private transmission
▪ Building up capabilities in new market segment through venture capital investments
Key enablers
▪ Enables renewables penetration and access

9
IFC has reoriented its strategy towards renewables
IFC Power sector portfolio shares by subsector and region (FY07 to FY16), % portfolio share
Gas Generation
T&D
Other
20162007
Renewable Generation
Other Fossil Fuel Generation
$5.8bn$1.8bn
Sub-Saharan Africa
2007
$1.8bn
South Asia
Middle East and North Africa
East Asia and the Pacific
$5.8bn
Europe and Central Asia
Latin America and the Caribbean
2016
4
Power is the largest real sector component of IFC’s portfolio, averaging $2.2bn in Commitments + Mobilization from FY12-FY16
4%
Expected decline in share
Expected increase in shareLimited expected change
Lessons learned
▪ Integration of renewables into energy systems carries a number of technical risks, notably oversupply, curtailment and interconnection delay
▪ Resource risk is significant in geothermal and biomass projects
▪ Technical risks in hydropower remain very material
▪ Changing economics in the power sector can pose significant stress on sponsors
▪ Policy support underpinning renewables investments may not always be stable
▪ Policy risk remains high in a number of IDA countries, notably with respect to tariff adjustments
▪ E&S issues are emerging in wind projects
12%
8%
56%
26%
16%
28%
14%
12%
9%20%
21%
21%
35%
19%16%
17%
14%
15%20%
8%12%
Expected change in portfolio share
10
0
200
400
600
800
1000
1200
1400
1600
1800
1998 2000 2004 2005 2006 2007 2008 2009 2010 2011 2012 2013 2014 2015 2016 2017 2018 H1
USD
milli
on
Wind Power Solar Small Hydro (<10MW)
Biomass Geothermal Renewable Funds
RE Holding Companies RE Financial Intermediaries
3
3
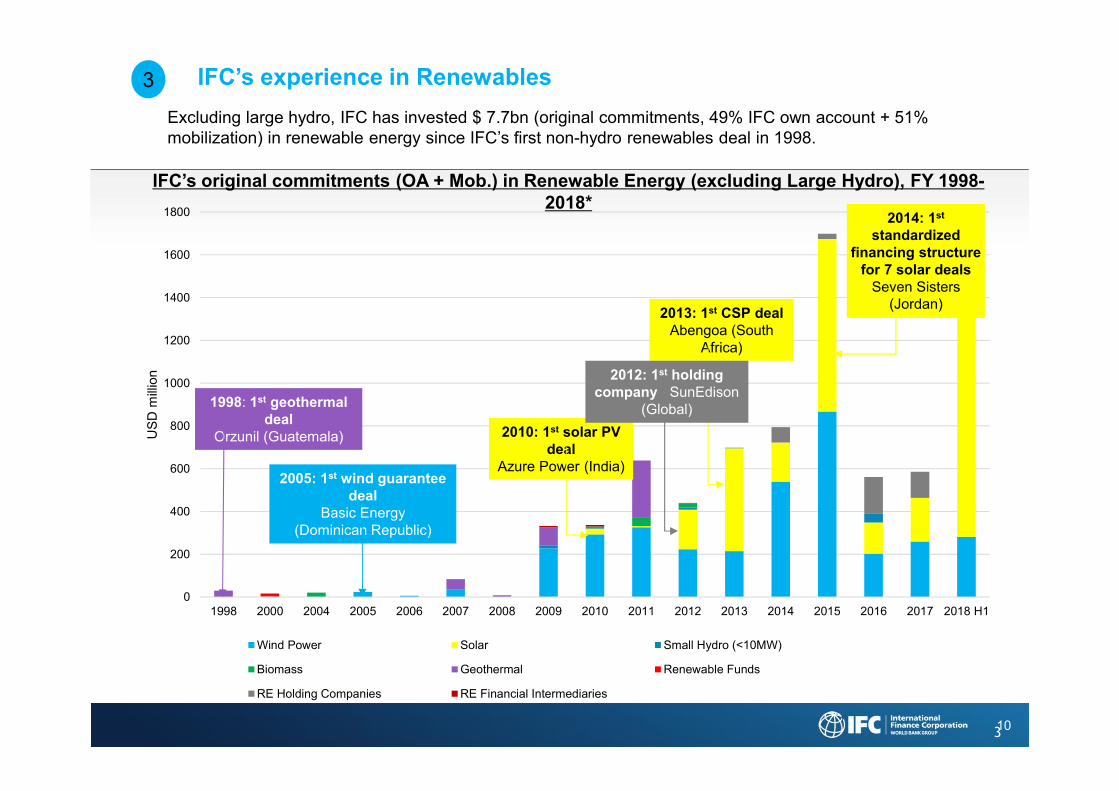
IFC’s original commitments (OA + Mob.) in Renewable Energy (excluding Large Hydro), FY 1998-2018*
Excluding large hydro, IFC has invested $ 7.7bn (original commitments, 49% IFC own account + 51% mobilization) in renewable energy since IFC’s first non-hydro renewables deal in 1998.
IFC’s experience in Renewables
1998: 1st geothermal deal
Orzunil (Guatemala)
2005: 1st wind guarantee deal
Basic Energy (Dominican Republic)
2010: 1st solar PV deal
Azure Power (India)
2013: 1st CSP deal Abengoa (South
Africa)
2012: 1st holding company SunEdison
(Global)
2014: 1st
standardized financing structure
for 7 solar dealsSeven Sisters
(Jordan)
11
3
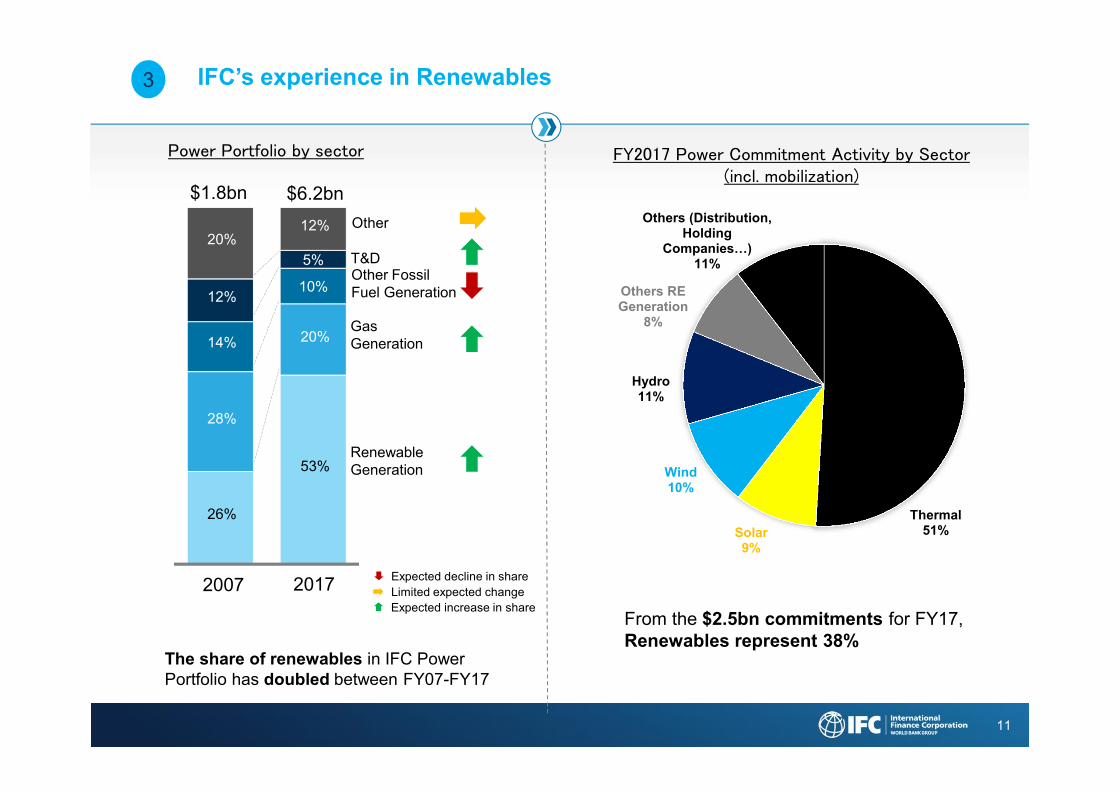
FY2017 Power Commitment Activity by Sector(incl. mobilization)
Thermal51%Solar
9%
Wind10%
Hydro11%
Others RE Generation
8%
Others (Distribution, Holding
Companies…)11%
From the $2.5bn commitments for FY17, Renewables represent 38%
The share of renewables in IFC Power Portfolio has doubled between FY07-FY17
IFC’s experience in Renewables
Gas Generation
T&D
Other
20172007
Renewable Generation
Other Fossil Fuel Generation
$6.2bn$1.8bn
Expected decline in share
Expected increase in shareLimited expected change
26%
53%
28%
20%14%
10%12%
5%20%
12%
Power Portfolio by sector
12
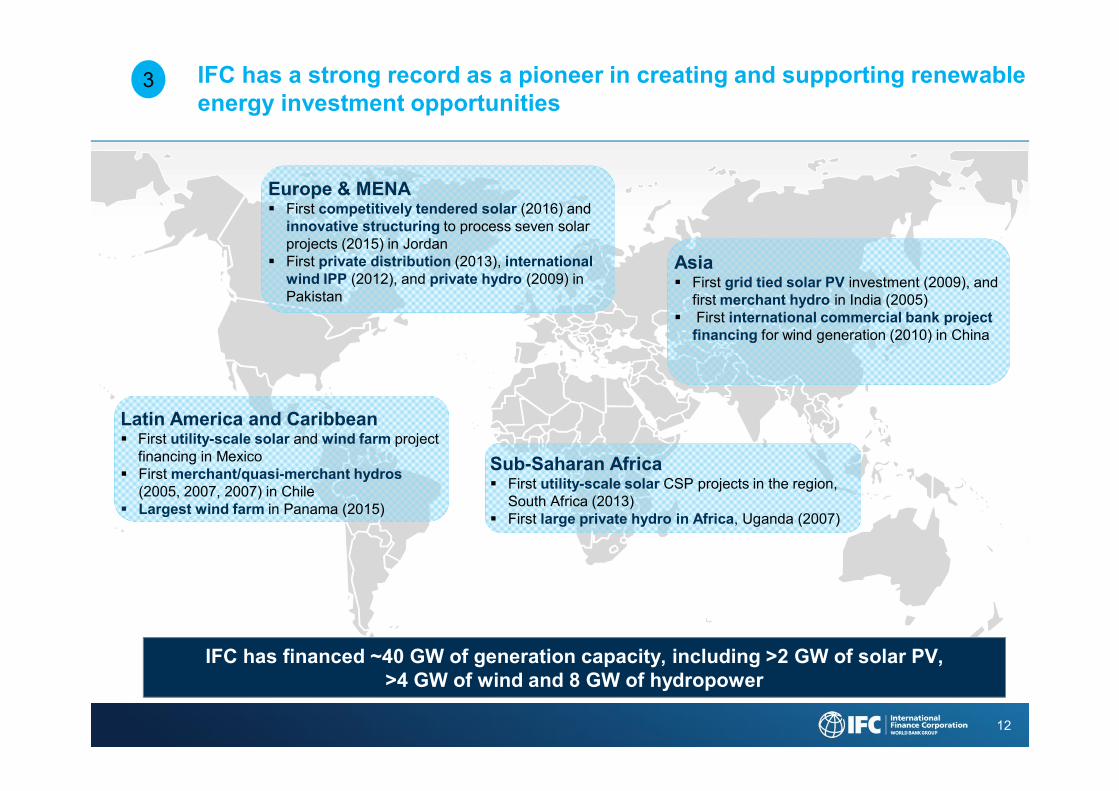
3 IFC has a strong record as a pioneer in creating and supporting renewable energy investment opportunities
Latin America and CaribbeanFirst utility-scale solar and wind farm project financing in MexicoFirst merchant/quasi-merchant hydros(2005, 2007, 2007) in ChileLargest wind farm in Panama (2015)
Sub-Saharan AfricaFirst utility-scale solar CSP projects in the region, South Africa (2013)First large private hydro in Africa, Uganda (2007)
Europe & MENAFirst competitively tendered solar (2016) and innovative structuring to process seven solar projects (2015) in JordanFirst private distribution (2013), international wind IPP (2012), and private hydro (2009) in Pakistan
AsiaFirst grid tied solar PV investment (2009), and first merchant hydro in India (2005)First international commercial bank project financing for wind generation (2010) in China
IFC has financed ~40 GW of generation capacity, including >2 GW of solar PV, >4 GW of wind and 8 GW of hydropower
1313
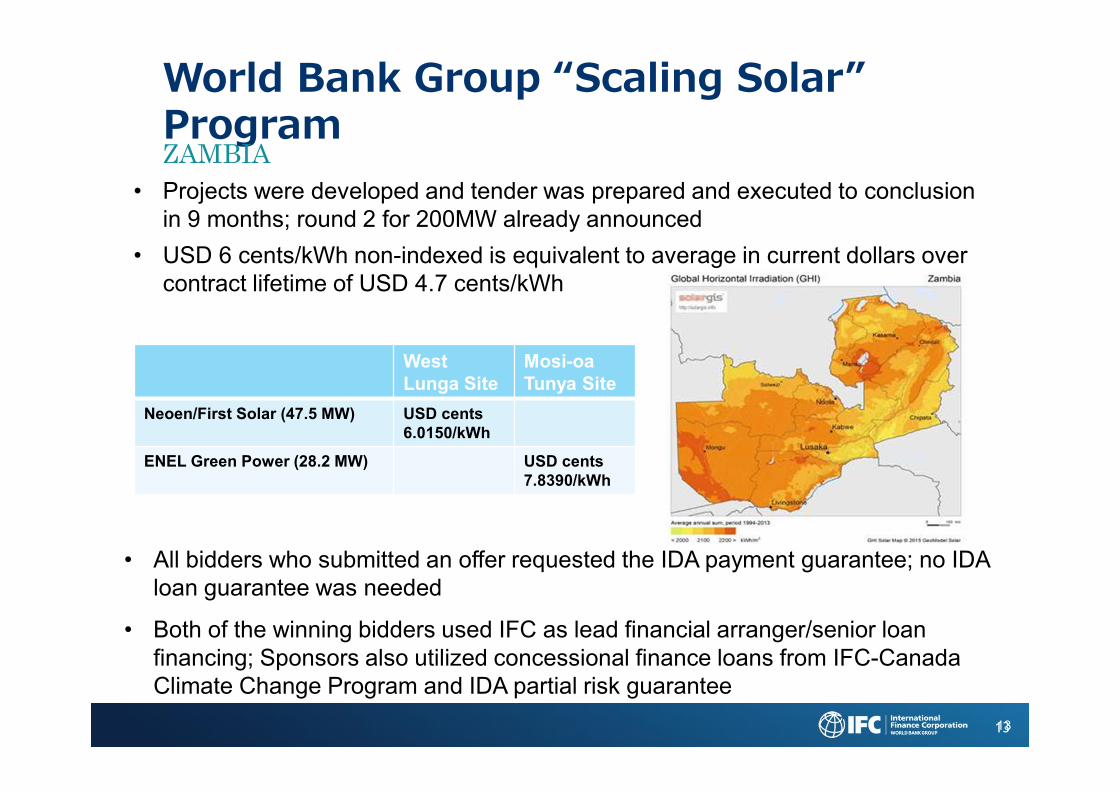
World Bank Group “Scaling Solar” ProgramZAMBIA
• Projects were developed and tender was prepared and executed to conclusion in 9 months; round 2 for 200MW already announced
• USD 6 cents/kWh non-indexed is equivalent to average in current dollars over contract lifetime of USD 4.7 cents/kWh
West Lunga Site
Mosi-oaTunya Site
Neoen/First Solar (47.5 MW) USD cents6.0150/kWh
ENEL Green Power (28.2 MW) USD cents 7.8390/kWh
• All bidders who submitted an offer requested the IDA payment guarantee; no IDA loan guarantee was needed
• Both of the winning bidders used IFC as lead financial arranger/senior loan financing; Sponsors also utilized concessional finance loans from IFC-Canada Climate Change Program and IDA partial risk guarantee


