0© Lexia Analytics
LEXIA LITE – PROSPECTUS
– Strictly Private & Confidential –
© Lexia Analytics - all rights reserved
All intellectual property in these materials, including copyright is owned by Lexia Analytics. These materials are confidential
between Lexia Analytics and Lexia’s direct client. These materials must not be copied or used in whole or in part or disclosed
to/by any party without the express written permission of Lexia Analytics Limited.
1© Lexia Analytics
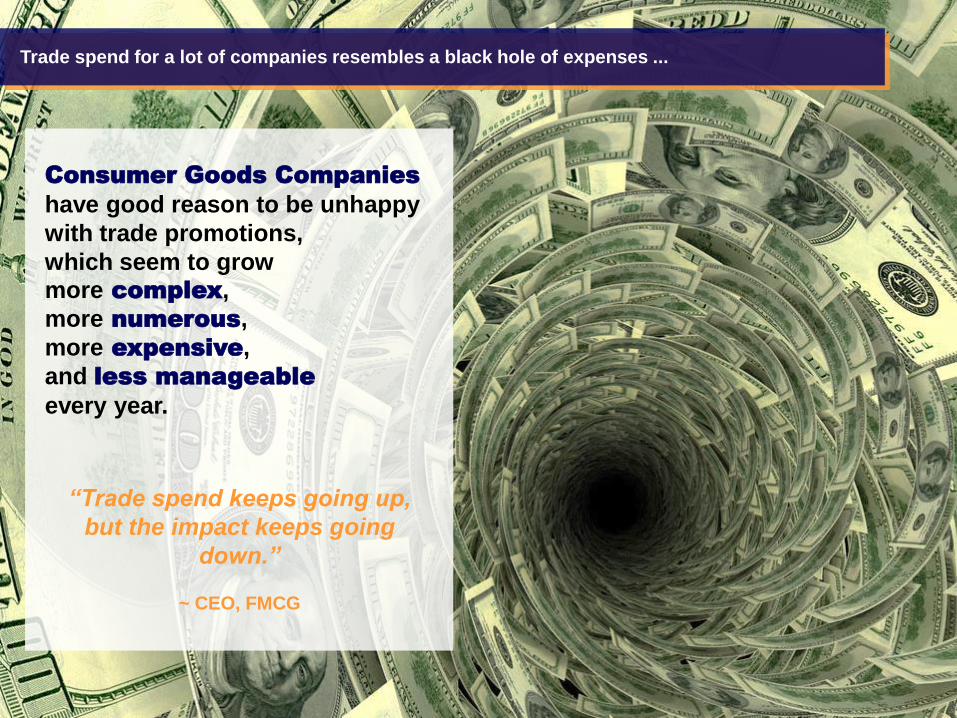
Consumer Goods Companies
have good reason to be unhappy
with trade promotions,
which seem to grow
more complex,
more numerous,
more expensive,
and less manageable
every year.
“Trade spend keeps going up,
but the impact keeps going
down.”
~ CEO, FMCG
Trade spend for a lot of companies resembles a black hole of expenses ...
2© Lexia Analytics
4-6%
5-10%
4-6%
7-12%
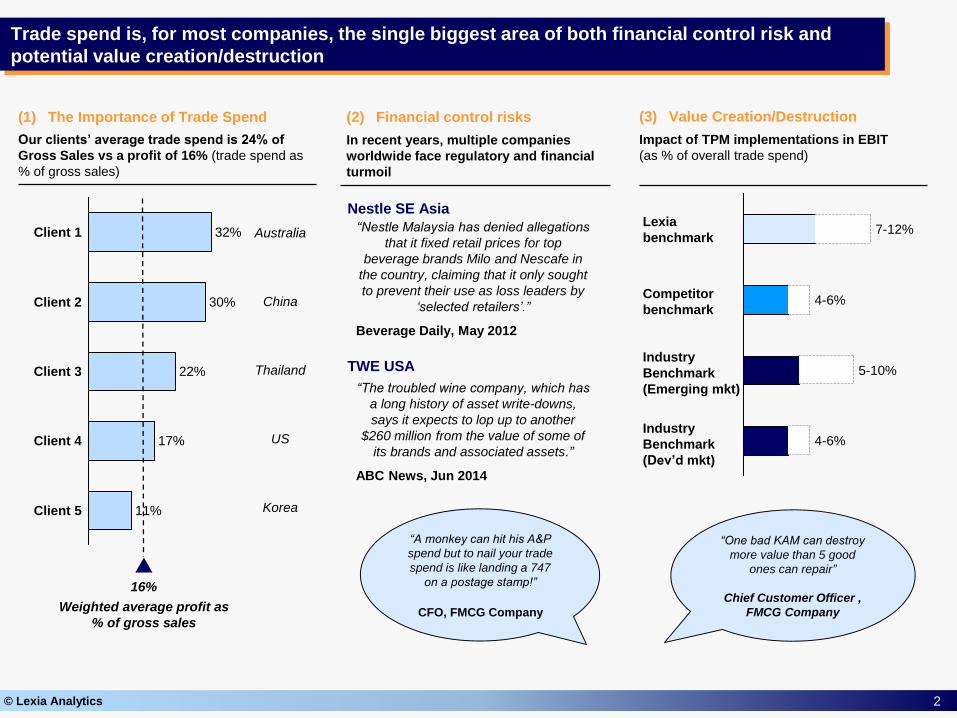
Our clients’ average trade spend is 24% of
Gross Sales vs a profit of 16% (trade spend as
% of gross sales)
Trade spend is, for most companies, the single biggest area of both financial control risk and
potential value creation/destruction
30%
32%
22%
Client 2
Client 1
Client 3
17%
Client 5 11%
Client 4
16%
Weighted average profit as
% of gross sales
Australia
China
Thailand
US
Korea
(1) The Importance of Trade Spend (2) Financial control risks
“Nestle Malaysia has denied allegations
that it fixed retail prices for top
beverage brands Milo and Nescafe in
the country, claiming that it only sought
to prevent their use as loss leaders by
‘selected retailers’.”
Beverage Daily, May 2012
In recent years, multiple companies
worldwide face regulatory and financial
turmoil
Nestle SE Asia
“The troubled wine company, which has
a long history of asset write-downs,
says it expects to lop up to another
$260 million from the value of some of
its brands and associated assets.”
ABC News, Jun 2014
TWE USA
“A monkey can hit his A&P
spend but to nail your trade
spend is like landing a 747
on a postage stamp!”
CFO, FMCG Company
Lexia
benchmark
Impact of TPM implementations in EBIT
(as % of overall trade spend)
Competitor
benchmark
(3) Value Creation/Destruction
“One bad KAM can destroy
more value than 5 good
ones can repair”
Chief Customer Officer ,
FMCG Company
Industry
Benchmark
(Emerging mkt)
Industry
Benchmark
(Dev’d mkt)
3© Lexia Analytics
• Intranet-based paperless
system integrated with SAP
• End-to-end reporting and spend
capture
• Company-wide enforced for any
promotion over pre-agreed
amount
• Optimisation across different
customer formats and across
region and customers
• All basic processes
standardised across business
• Customer segmentation and
regional allocation
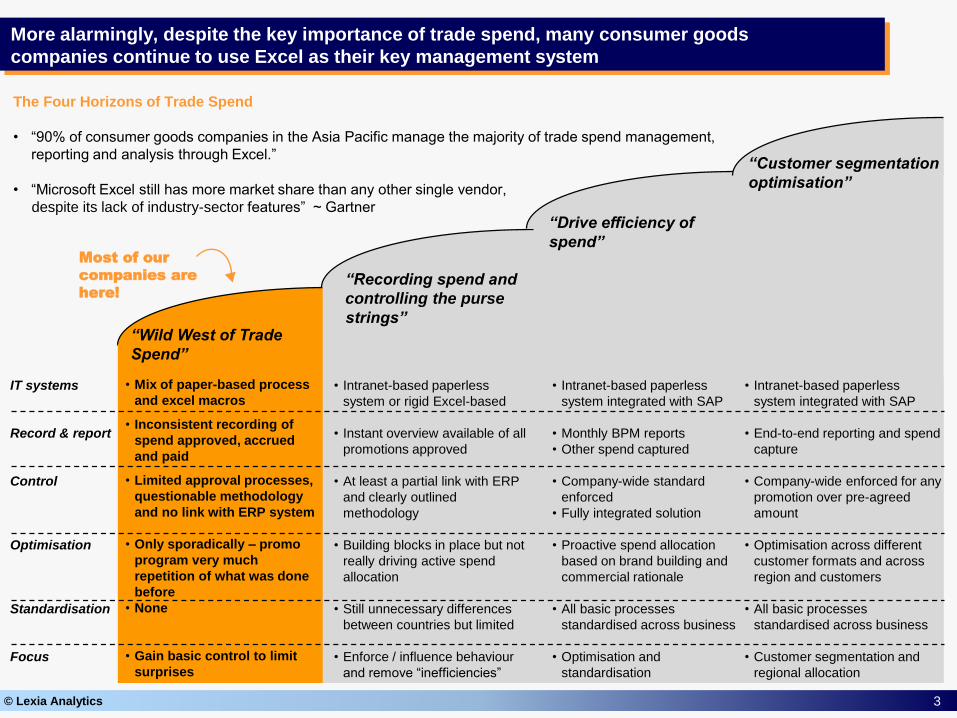
More alarmingly, despite the key importance of trade spend, many consumer goods
companies continue to use Excel as their key management system
“Wild West of Trade
Spend”
“Recording spend and
controlling the purse
strings”
“Drive efficiency of
spend”
IT systems
Record & report
Control
Optimisation
Standardisation
Focus
• Mix of paper-based process
and excel macros
• Inconsistent recording of
spend approved, accrued
and paid
• Limited approval processes,
questionable methodology
and no link with ERP system
• Only sporadically – promo
program very much
repetition of what was done
before
• None
• Gain basic control to limit
surprises
• Intranet-based paperless
system or rigid Excel-based
• Instant overview available of all
promotions approved
• At least a partial link with ERP
and clearly outlined
methodology
• Building blocks in place but not
really driving active spend
allocation
• Still unnecessary differences
between countries but limited
• Enforce / influence behaviour
and remove “inefficiencies”
• Intranet-based paperless
system integrated with SAP
• Monthly BPM reports
• Other spend captured
• Company-wide standard
enforced
• Fully integrated solution
• Proactive spend allocation
based on brand building and
commercial rationale
• All basic processes
standardised across business
• Optimisation and
standardisation
The Four Horizons of Trade Spend
• “90% of consumer goods companies in the Asia Pacific manage the majority of trade spend management,
reporting and analysis through Excel.”
• “Microsoft Excel still has more market share than any other single vendor,
despite its lack of industry-sector features” ~ Gartner
Most of our
companies are
here!
“Customer segmentation
optimisation”
4© Lexia Analytics
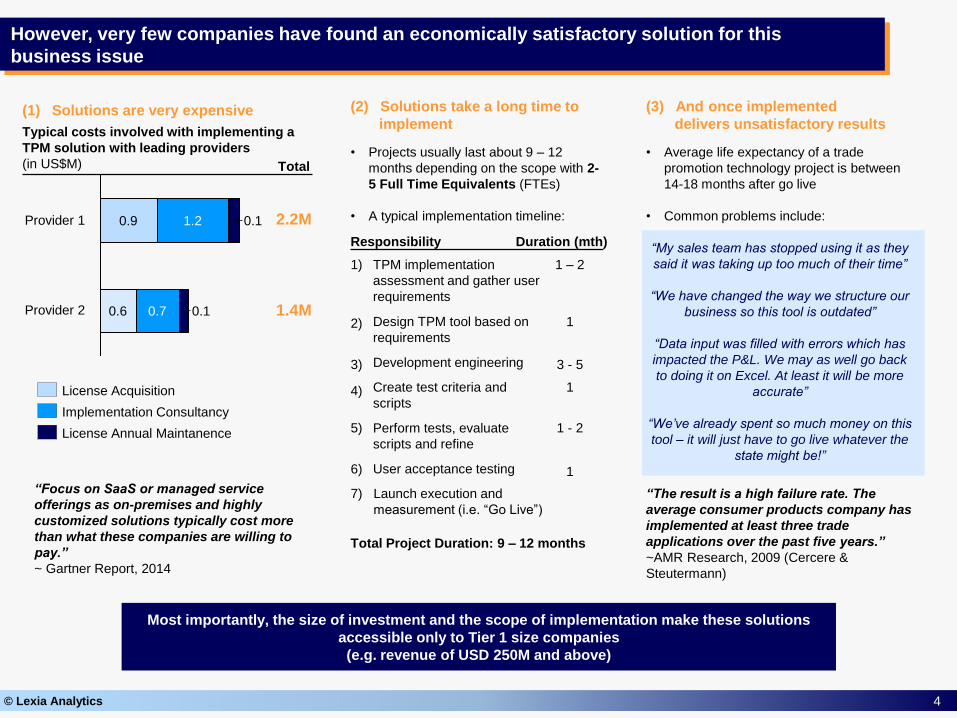
(1) Solutions are very expensive
Most importantly, the size of investment and the scope of implementation make these solutions
accessible only to Tier 1 size companies
(e.g. revenue of USD 250M and above)
Typical costs involved with implementing a
TPM solution with leading providers
(in US$M)
0.10.7
0.1
0.6
0.9 1.2
License Acquisition
License Annual Maintanence
Implementation Consultancy
Provider 1
Total
2.2M
1.4M
(2) Solutions take a long time to
implement
• Projects usually last about 9 – 12
months depending on the scope with 2-
5 Full Time Equivalents (FTEs)
• A typical implementation timeline:
Total Project Duration: 9 – 12 months
“Focus on SaaS or managed service
offerings as on-premises and highly
customized solutions typically cost more
than what these companies are willing to
pay.”
~ Gartner Report, 2014
Provider 2
(3) And once implemented
delivers unsatisfactory results
“The result is a high failure rate. The
average consumer products company has
implemented at least three trade
applications over the past five years.”
~AMR Research, 2009 (Cercere &
Steutermann)
• Average life expectancy of a trade
promotion technology project is between
14-18 months after go live
• Common problems include:
“My sales team has stopped using it as they
said it was taking up too much of their time”
“We have changed the way we structure our
business so this tool is outdated”
“Data input was filled with errors which has
impacted the P&L. We may as well go back
to doing it on Excel. At least it will be more
accurate”
“We’ve already spent so much money on this
tool – it will just have to go live whatever the
state might be!”
Responsibility Duration (mth)
TPM implementation
assessment and gather user
requirements
1) 1 – 2
Design TPM tool based on
requirements2) 1
Development engineering 3) 3 - 5
Create test criteria and
scripts4) 1
Perform tests, evaluate
scripts and refine
5) 1 - 2
User acceptance testing6) 1
Launch execution and
measurement (i.e. “Go Live”)
7)
However, very few companies have found an economically satisfactory solution for this
business issue
5© Lexia Analytics
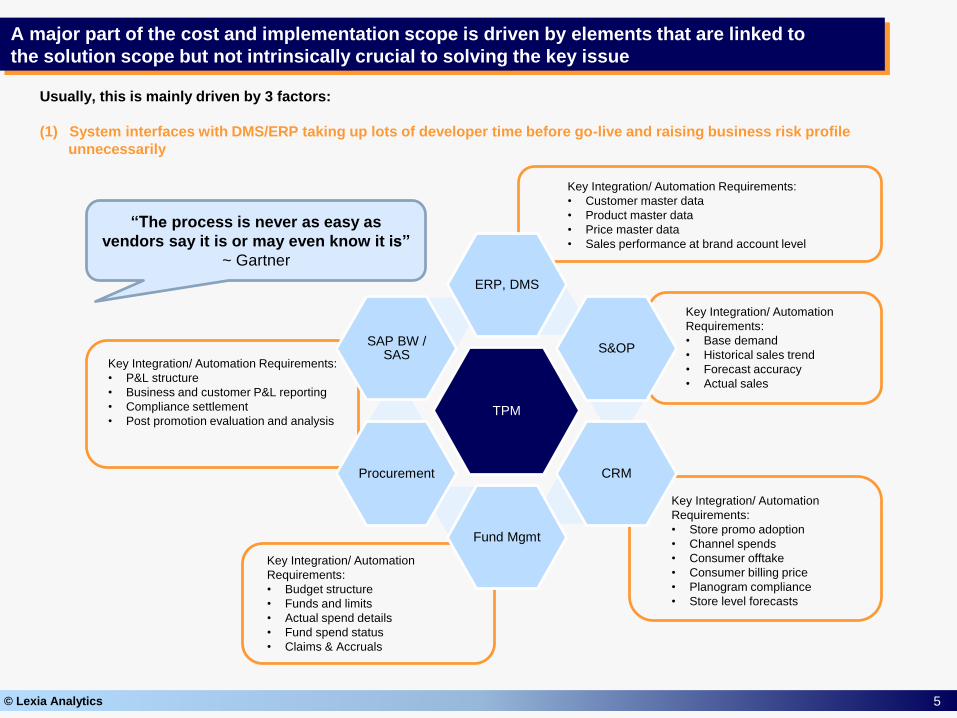
A major part of the cost and implementation scope is driven by elements that are linked to
the solution scope but not intrinsically crucial to solving the key issue
Usually, this is mainly driven by 3 factors:
(1) System interfaces with DMS/ERP taking up lots of developer time before go-live and raising business risk profile
unnecessarily
TPM
ERP, DMS
S&OP
CRM
Fund Mgmt
Procurement
SAP BW / SAS
“The process is never as easy as
vendors say it is or may even know it is”
~ Gartner
Key Integration/ Automation Requirements:
• Customer master data
• Product master data
• Price master data
• Sales performance at brand account level
Key Integration/ Automation
Requirements:
• Base demand
• Historical sales trend
• Forecast accuracy
• Actual sales
Key Integration/ Automation
Requirements:
• Store promo adoption
• Channel spends
• Consumer offtake
• Consumer billing price
• Planogram compliance
• Store level forecasts
Key Integration/ Automation
Requirements:
• Budget structure
• Funds and limits
• Actual spend details
• Fund spend status
• Claims & Accruals
Key Integration/ Automation Requirements:
• P&L structure
• Business and customer P&L reporting
• Compliance settlement
• Post promotion evaluation and analysis
6© Lexia Analytics
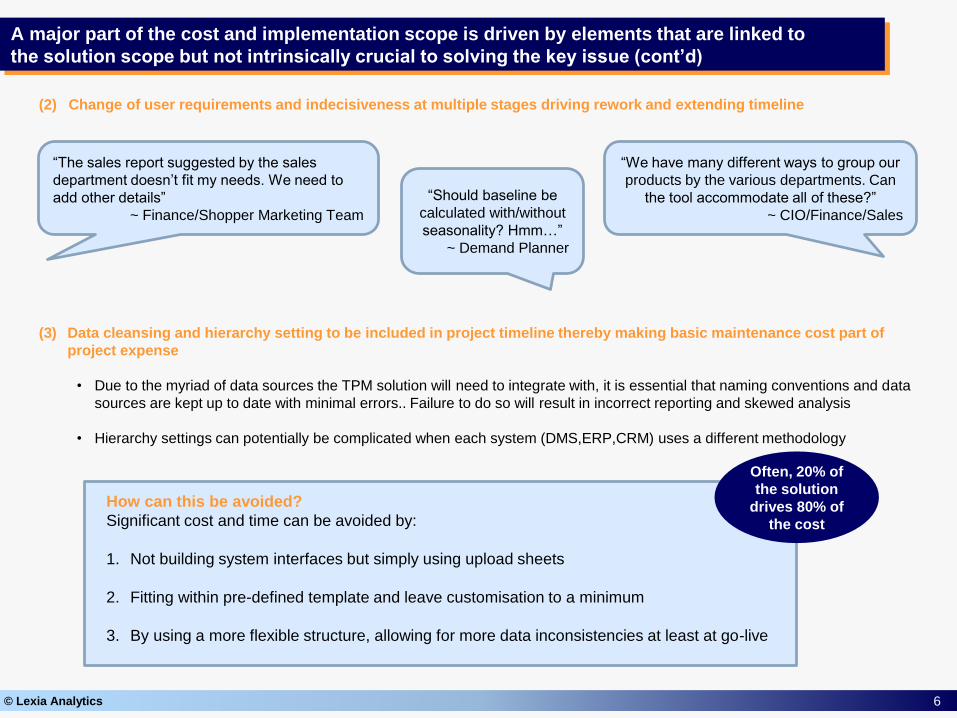
(2) Change of user requirements and indecisiveness at multiple stages driving rework and extending timeline
(3) Data cleansing and hierarchy setting to be included in project timeline thereby making basic maintenance cost part of
project expense
• Due to the myriad of data sources the TPM solution will need to integrate with, it is essential that naming conventions and data
sources are kept up to date with minimal errors.. Failure to do so will result in incorrect reporting and skewed analysis
• Hierarchy settings can potentially be complicated when each system (DMS,ERP,CRM) uses a different methodology
“The sales report suggested by the sales
department doesn’t fit my needs. We need to
add other details”
~ Finance/Shopper Marketing Team
“Should baseline be
calculated with/without
seasonality? Hmm…”
~ Demand Planner
“We have many different ways to group our
products by the various departments. Can
the tool accommodate all of these?”
~ CIO/Finance/Sales
Often, 20% of
the solution
drives 80% of
the cost
How can this be avoided?
Significant cost and time can be avoided by:
1. Not building system interfaces but simply using upload sheets
2. Fitting within pre-defined template and leave customisation to a minimum
3. By using a more flexible structure, allowing for more data inconsistencies at least at go-live
A major part of the cost and implementation scope is driven by elements that are linked to
the solution scope but not intrinsically crucial to solving the key issue (cont’d)

7© Lexia Analytics
A quick simple solution to trade spend clarity
Rapid Insights
8© Lexia Analytics
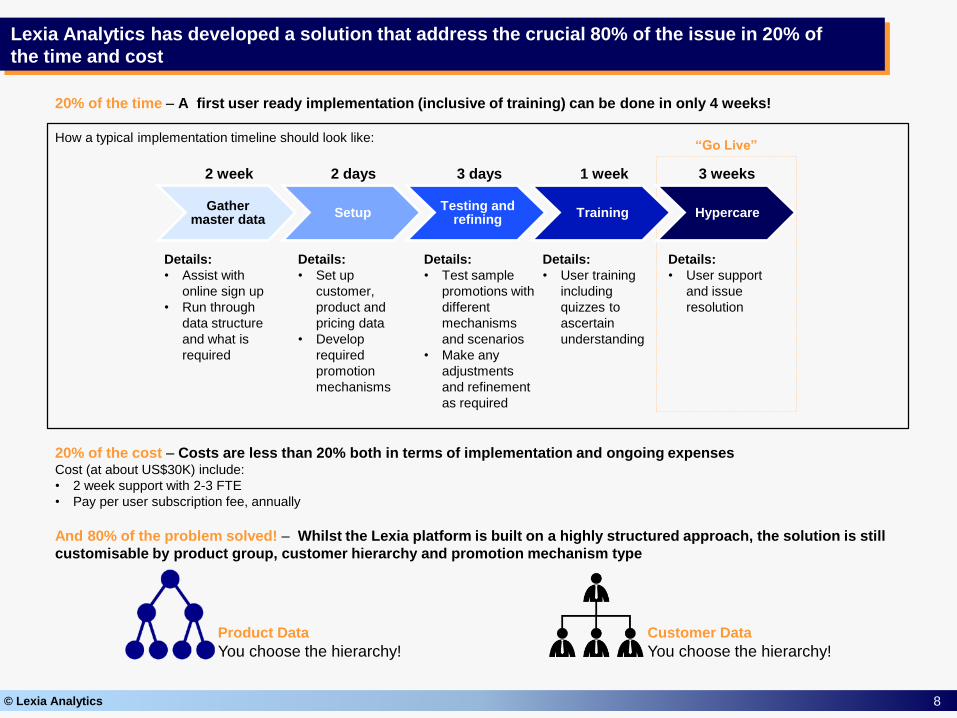
20% of the time – A first user ready implementation (inclusive of training) can be done in only 4 weeks!
How a typical implementation timeline should look like:
20% of the cost – Costs are less than 20% both in terms of implementation and ongoing expensesCost (at about US$30K) include:
• 2 week support with 2-3 FTE
• Pay per user subscription fee, annually
And 80% of the problem solved! – Whilst the Lexia platform is built on a highly structured approach, the solution is still
customisable by product group, customer hierarchy and promotion mechanism type
Lexia Analytics has developed a solution that address the crucial 80% of the issue in 20% of
the time and cost
Gather master data
SetupTesting and
refiningTraining Hypercare
2 week 2 days 3 days 1 week
Details:
• Assist with
online sign up
• Run through
data structure
and what is
required
Details:
• Set up
customer,
product and
pricing data
• Develop
required
promotion
mechanisms
Details:
• Test sample
promotions with
different
mechanisms
and scenarios
• Make any
adjustments
and refinement
as required
Details:
• User training
including
quizzes to
ascertain
understanding
3 weeks
Details:
• User support
and issue
resolution
“Go Live”
Customer Data
You choose the hierarchy!
Product Data
You choose the hierarchy!
9© Lexia Analytics
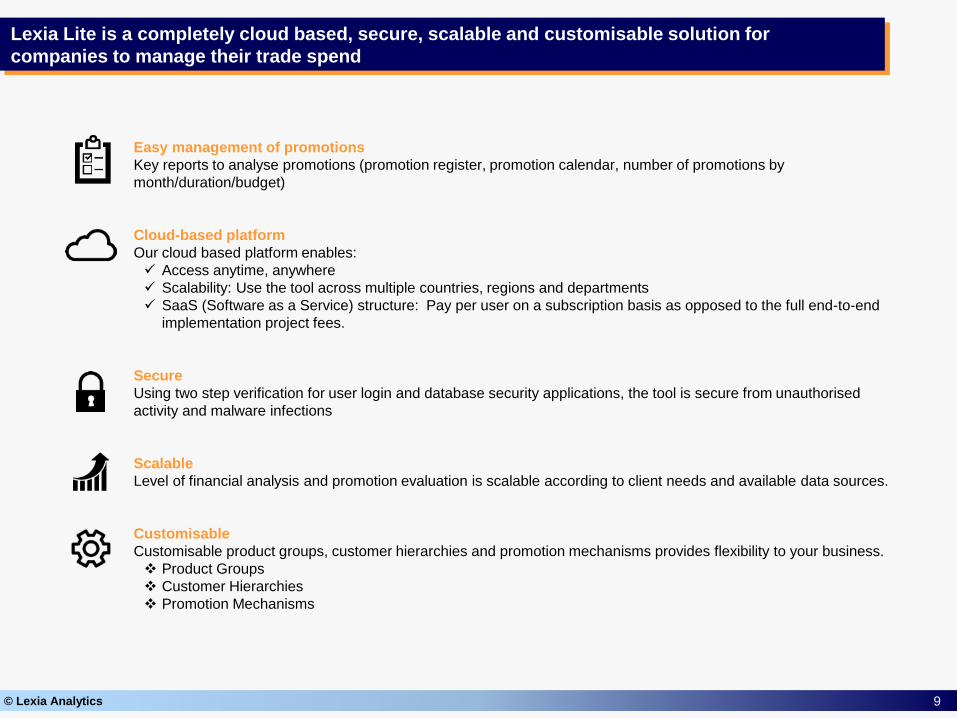
Lexia Lite is a completely cloud based, secure, scalable and customisable solution for
companies to manage their trade spend
Easy management of promotions
Key reports to analyse promotions (promotion register, promotion calendar, number of promotions by
month/duration/budget)
Cloud-based platform
Our cloud based platform enables:
Access anytime, anywhere
Scalability: Use the tool across multiple countries, regions and departments
SaaS (Software as a Service) structure: Pay per user on a subscription basis as opposed to the full end-to-end
implementation project fees.
Secure
Using two step verification for user login and database security applications, the tool is secure from unauthorised
activity and malware infections
Scalable
Level of financial analysis and promotion evaluation is scalable according to client needs and available data sources.
Customisable
Customisable product groups, customer hierarchies and promotion mechanisms provides flexibility to your business.
Product Groups
Customer Hierarchies
Promotion Mechanisms
10© Lexia Analytics
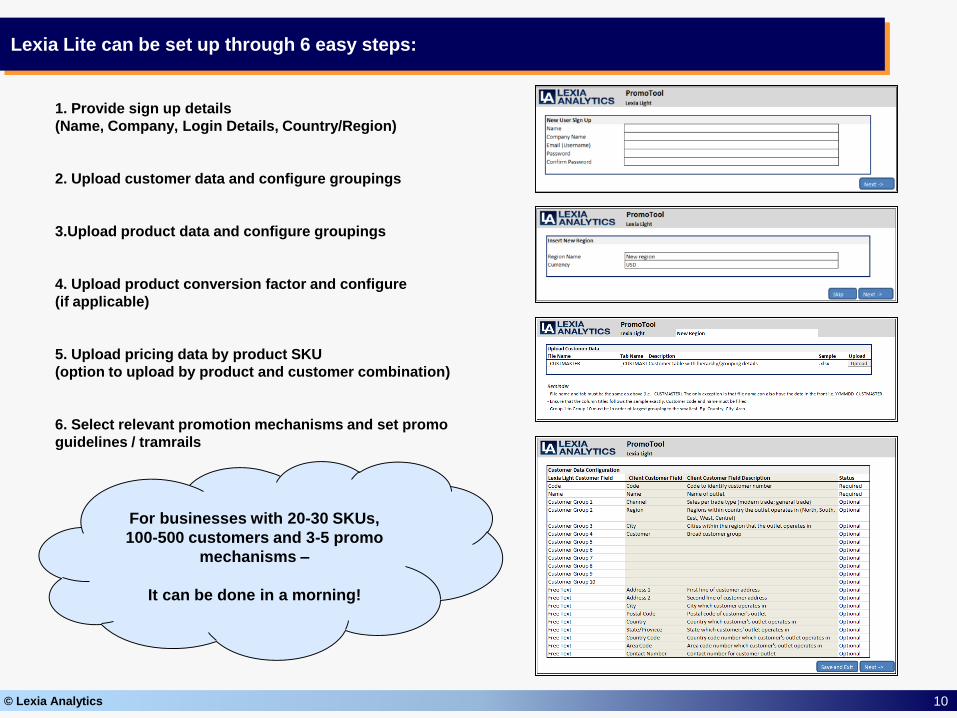
Lexia Lite can be set up through 6 easy steps:
1. Provide sign up details
(Name, Company, Login Details, Country/Region)
2. Upload customer data and configure groupings
3.Upload product data and configure groupings
4. Upload product conversion factor and configure
(if applicable)
5. Upload pricing data by product SKU
(option to upload by product and customer combination)
6. Select relevant promotion mechanisms and set promo
guidelines / tramrails
For businesses with 20-30 SKUs,
100-500 customers and 3-5 promo
mechanisms –
It can be done in a morning!
11© Lexia Analytics
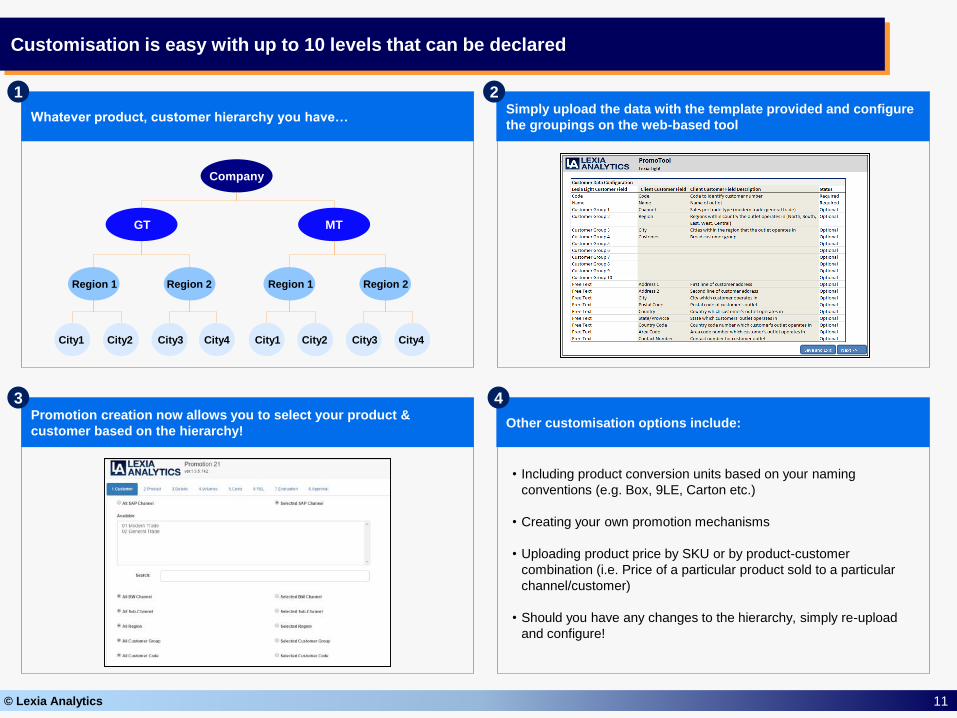
Promotion creation now allows you to select your product &
customer based on the hierarchy!
Whatever product, customer hierarchy you have… Whatever product, customer hierarchy you have…
Region 1
Customisation is easy with up to 10 levels that can be declared
1
GT
Company
MT
Region 1 Region 2
City1 City2 City3 City4 City1 City2 City3 City4
Region 2
Simply upload the data with the template provided and
configure the groupings on the web-based tool
Other customisation options include:
• Including product conversion units based on your naming
conventions (e.g. Box, 9LE, Carton etc.)
• Creating your own promotion mechanisms
• Uploading product price by SKU or by product-customer
combination (i.e. Price of a particular product sold to a particular
channel/customer)
• Should you have any changes to the hierarchy, simply re-upload
and configure!
Simply upload the data with the template provided and configure
the groupings on the web-based tool
2
Promotion creation now allows you to select your product &
customer based on the hierarchy!
3
Other customisation options include:
4
12© Lexia Analytics
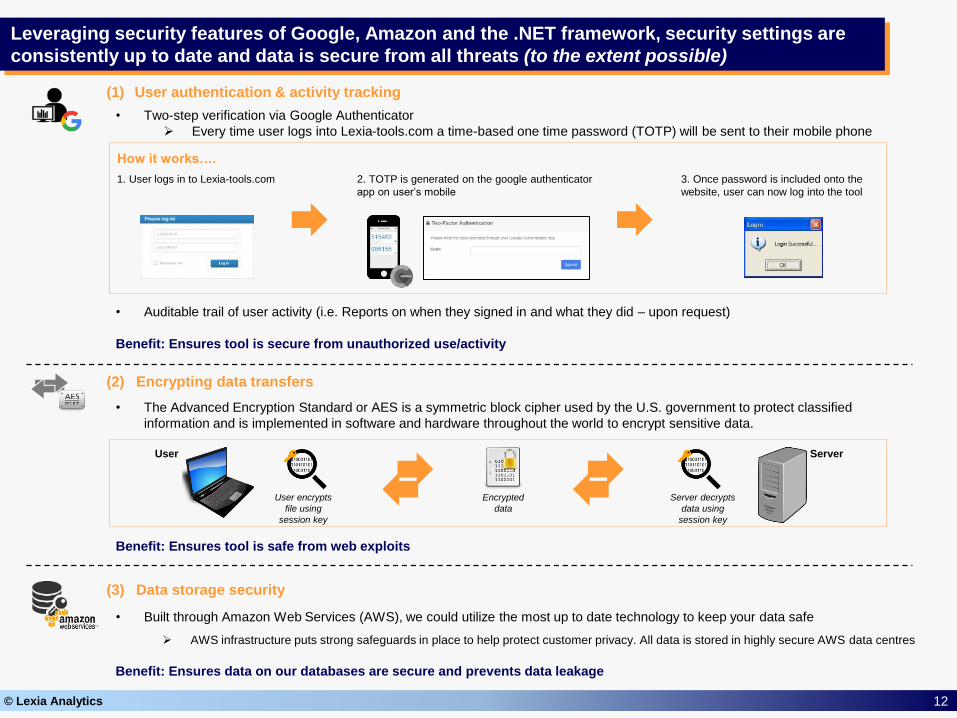
• The Advanced Encryption Standard or AES is a symmetric block cipher used by the U.S. government to protect classified
information and is implemented in software and hardware throughout the world to encrypt sensitive data.
Benefit: Ensures tool is safe from web exploits
Leveraging security features of Google, Amazon and the .NET framework, security settings are
consistently up to date and data is secure from all threats (to the extent possible)
(1) User authentication & activity tracking
(2) Encrypting data transfers
(3) Data storage security
• Auditable trail of user activity (i.e. Reports on when they signed in and what they did – upon request)
Benefit: Ensures tool is secure from unauthorized use/activity
1. User logs in to Lexia-tools.com 2. TOTP is generated on the google authenticator
app on user’s mobile
3. Once password is included onto the
website, user can now log into the tool
How it works….
• Two-step verification via Google Authenticator
Every time user logs into Lexia-tools.com a time-based one time password (TOTP) will be sent to their mobile phone
• Built through Amazon Web Services (AWS), we could utilize the most up to date technology to keep your data safe
AWS infrastructure puts strong safeguards in place to help protect customer privacy. All data is stored in highly secure AWS data centres
Benefit: Ensures data on our databases are secure and prevents data leakage
User
User encrypts
file using
session key
Encrypted
data
Server
Server decrypts
data using
session key
13© Lexia Analytics
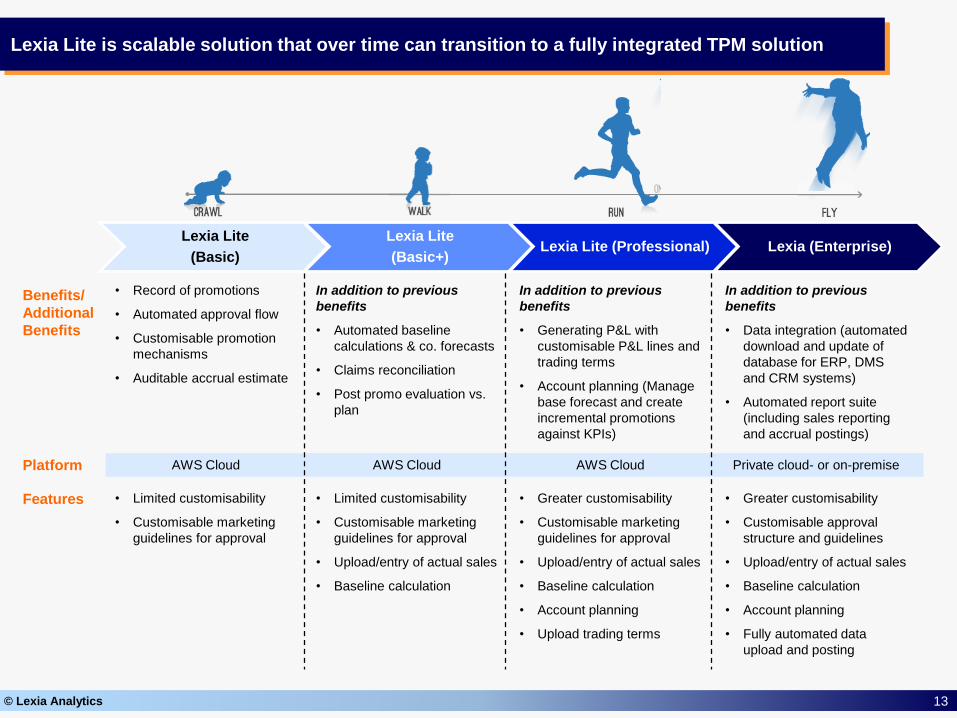
Lexia Lite is scalable solution that over time can transition to a fully integrated TPM solution
Lexia Lite
(Basic)
Lexia Lite
(Basic+)Lexia Lite (Professional) Lexia (Enterprise)
Features
Platform
Benefits/
Additional
Benefits
AWS Cloud AWS Cloud AWS Cloud Private cloud- or on-premise
• Limited customisability
• Customisable marketing
guidelines for approval
• Limited customisability
• Customisable marketing
guidelines for approval
• Upload/entry of actual sales
• Baseline calculation
• Greater customisability
• Customisable marketing
guidelines for approval
• Upload/entry of actual sales
• Baseline calculation
• Account planning
• Upload trading terms
• Greater customisability
• Customisable approval
structure and guidelines
• Upload/entry of actual sales
• Baseline calculation
• Account planning
• Fully automated data
upload and posting
• Record of promotions
• Automated approval flow
• Customisable promotion
mechanisms
• Auditable accrual estimate
In addition to previous
benefits
• Generating P&L with
customisable P&L lines and
trading terms
• Account planning (Manage
base forecast and create
incremental promotions
against KPIs)
In addition to previous
benefits
• Automated baseline
calculations & co. forecasts
• Claims reconciliation
• Post promo evaluation vs.
plan
In addition to previous
benefits
• Data integration (automated
download and update of
database for ERP, DMS
and CRM systems)
• Automated report suite
(including sales reporting
and accrual postings)
14© Lexia Analytics
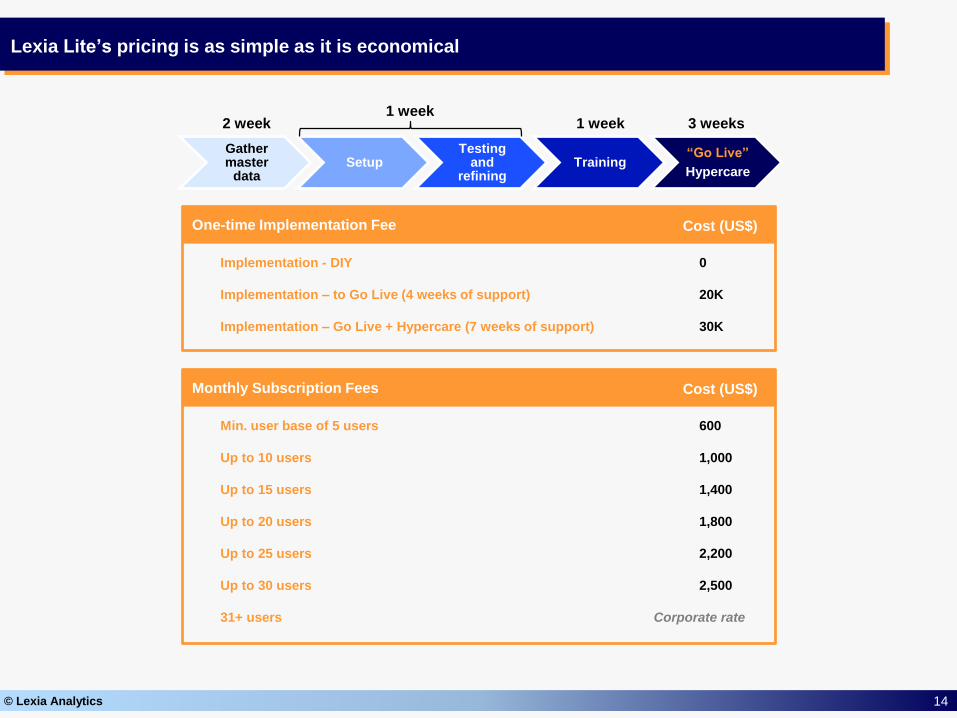
Gather master
dataSetup
Testing and
refiningTraining
“Go Live”
Hypercare
2 week 1 week 3 weeks1 week
Lexia Lite’s pricing is as simple as it is economical
One-time Implementation Fee Cost (US$)
Implementation - DIY 0
Implementation – to Go Live (4 weeks of support) 20K
Implementation – Go Live + Hypercare (7 weeks of support) 30K
Monthly Subscription Fees Cost (US$)
Min. user base of 5 users 600
Up to 10 users 1,000
Up to 15 users 1,400
Up to 20 users 1,800
Up to 25 users 2,200
Up to 30 users 2,500
31+ users Corporate rate
15© Lexia Analytics
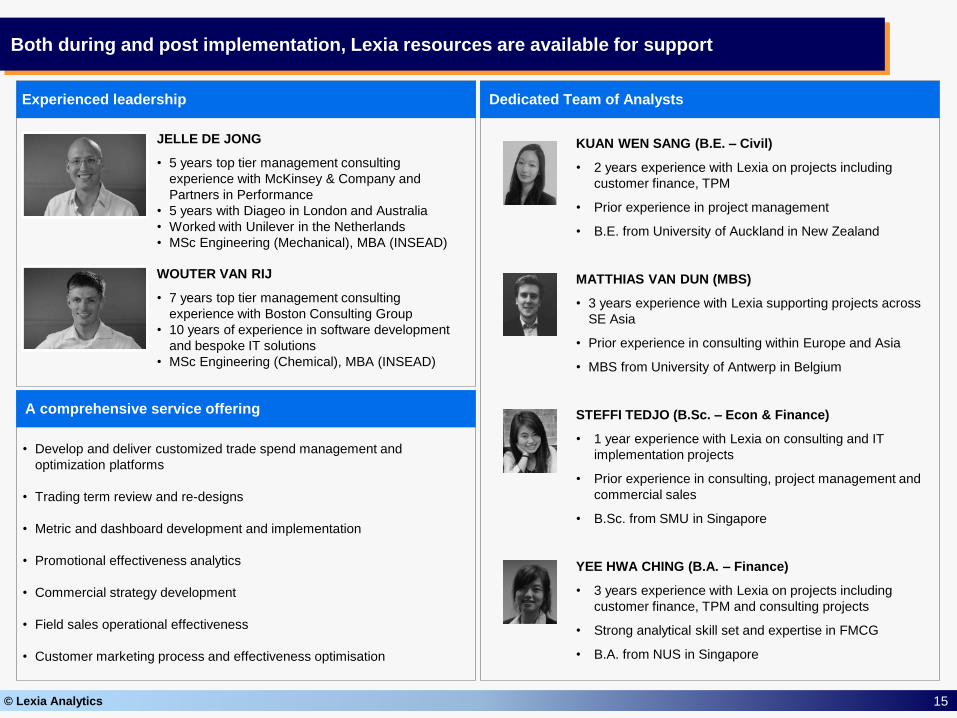
Both during and post implementation, Lexia resources are available for support
WOUTER VAN RIJ
• 7 years top tier management consulting
experience with Boston Consulting Group
• 10 years of experience in software development
and bespoke IT solutions
• MSc Engineering (Chemical), MBA (INSEAD)
JELLE DE JONG
• 5 years top tier management consulting
experience with McKinsey & Company and
Partners in Performance
• 5 years with Diageo in London and Australia
• Worked with Unilever in the Netherlands
• MSc Engineering (Mechanical), MBA (INSEAD)
Our leadershipExperienced leadership Dedicated Team of Analysts
KUAN WEN SANG (B.E. – Civil)
• 2 years experience with Lexia on projects including
customer finance, TPM
• Prior experience in project management
• B.E. from University of Auckland in New Zealand
MATTHIAS VAN DUN (MBS)
• 3 years experience with Lexia supporting projects across
SE Asia
• Prior experience in consulting within Europe and Asia
• MBS from University of Antwerp in Belgium
STEFFI TEDJO (B.Sc. – Econ & Finance)
• 1 year experience with Lexia on consulting and IT
implementation projects
• Prior experience in consulting, project management and
commercial sales
• B.Sc. from SMU in Singapore
YEE HWA CHING (B.A. – Finance)
• 3 years experience with Lexia on projects including
customer finance, TPM and consulting projects
• Strong analytical skill set and expertise in FMCG
• B.A. from NUS in Singapore
Our MissionA comprehensive service offering
• Develop and deliver customized trade spend management and
optimization platforms
• Trading term review and re-designs
• Metric and dashboard development and implementation
• Promotional effectiveness analytics
• Commercial strategy development
• Field sales operational effectiveness
• Customer marketing process and effectiveness optimisation

16© Lexia Analytics
A quick simple solution to trade spend clarity
Rapid Insights
Go online or reach out to us for a live demo!Lexia-tools.com


