LGM-Dairy: A Risk Management LGM-Dairy: A Risk Management Tool for Small and Large Dairy FarmsTool for Small and Large Dairy Farms
Brian W. GouldBrian W. GouldDepartment of Agricultural and Applied EconomicsDepartment of Agricultural and Applied Economics
Victor E. CabreraVictor E. CabreraDepartment of Dairy ScienceDepartment of Dairy Science
University of Wisconsin-MadisonUniversity of Wisconsin-MadisonUniversity of Wisconsin ExtensionUniversity of Wisconsin Extension
June, 2011
Price risk in the U.S. Dairy IndustryPrice risk in the U.S. Dairy Industry
What are the objectives of the use of LGM-What are the objectives of the use of LGM-Dairy as a risk management tool?Dairy as a risk management tool?
Overview of the “Black-Box” of LGM-DairyOverview of the “Black-Box” of LGM-Dairy
What are the future prospects of LGM-DairyWhat are the future prospects of LGM-Dairy
OverviewOverview of This Presentation of This Presentation
2
4.00
6.00
8.00
10.00
12.00
14.00
16.00
18.00
20.00
22.00
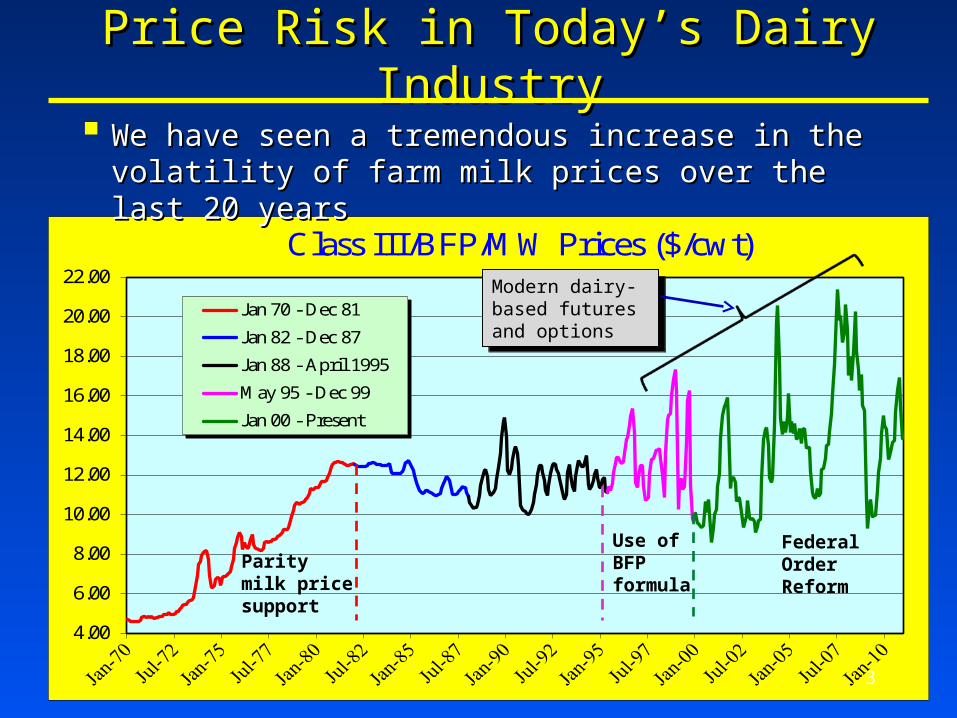
Class III/BFP/MW Prices ($/cwt)
Jan 70 - Dec 81
Jan 82 - Dec 87
Jan 88 - April 1995
May 95 - Dec 99
Jan 00 - Present
3
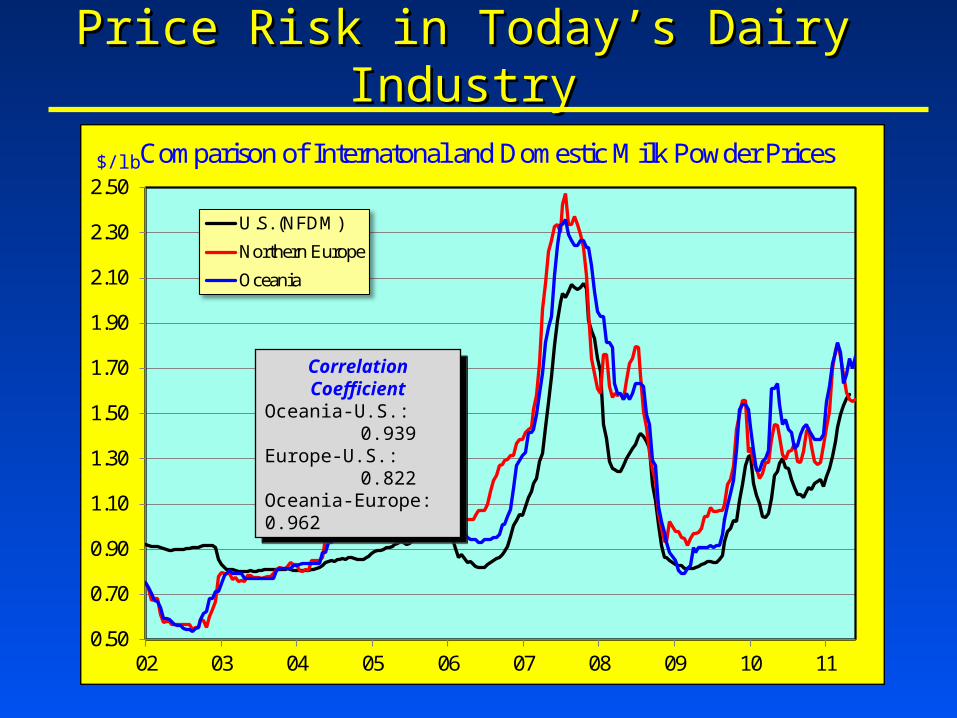
Price Risk in Today’s Dairy IndustryPrice Risk in Today’s Dairy Industry
We have seen a tremendous increase in the We have seen a tremendous increase in the volatility of farm milk prices over the last 20 yearsvolatility of farm milk prices over the last 20 years
Parity milk price support
Federal Order Reform
Use of BFP formula
Modern dairy-based futures and options
Modern dairy-based futures and options
4
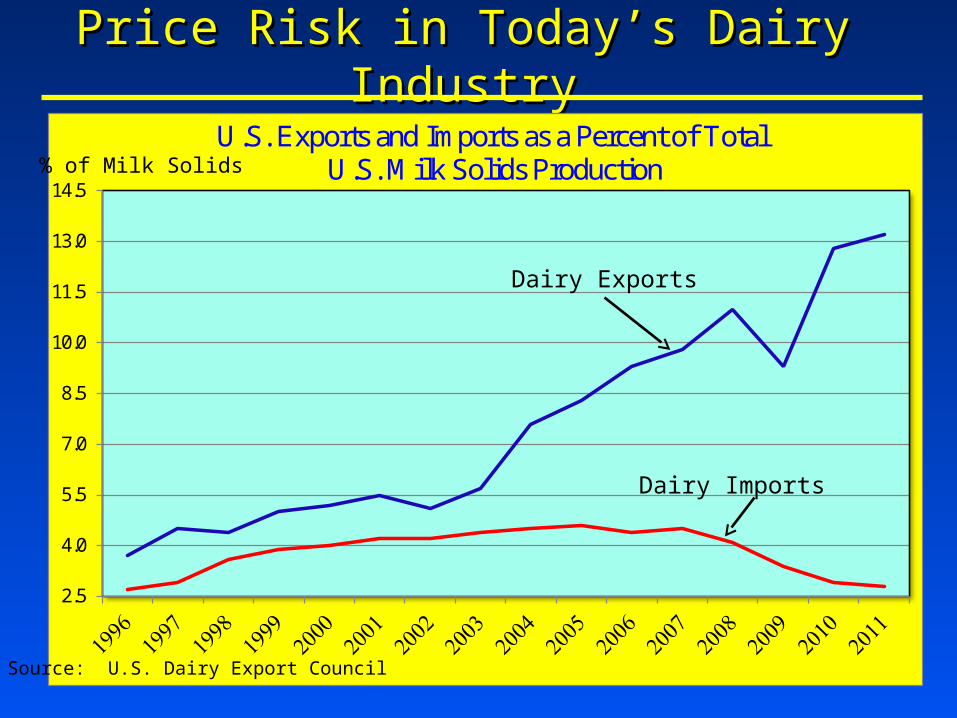
Price Risk in Today’s Dairy IndustryPrice Risk in Today’s Dairy Industry
2.5
4.0
5.5
7.0
8.5
10.0
11.5
13.0
14.5
U.S. Exports and Imports as a Percent of Total U.S. Milk Solids Production
Dairy Exports
Dairy Imports
% of Milk Solids
Source: U.S. Dairy Export Council
5
Price Risk in Today’s Dairy IndustryPrice Risk in Today’s Dairy Industry
0.50
0.70
0.90
1.10
1.30
1.50
1.70
1.90
2.10
2.30
2.50
02 03 04 05 06 07 08 09 10 11
U.S. (NFDM)
Northern Europe
Oceania
Comparison of Internatonal and Domestic Milk Powder Prices$/lb
Correlation CoefficientOceania-U.S.:
0.939Europe-U.S.:
0.822Oceania-Europe: 0.962
Correlation CoefficientOceania-U.S.:
0.939Europe-U.S.:
0.822Oceania-Europe: 0.962
0.50
0.75
1.00
1.25
1.50
1.75
2.00
2.25
2.50
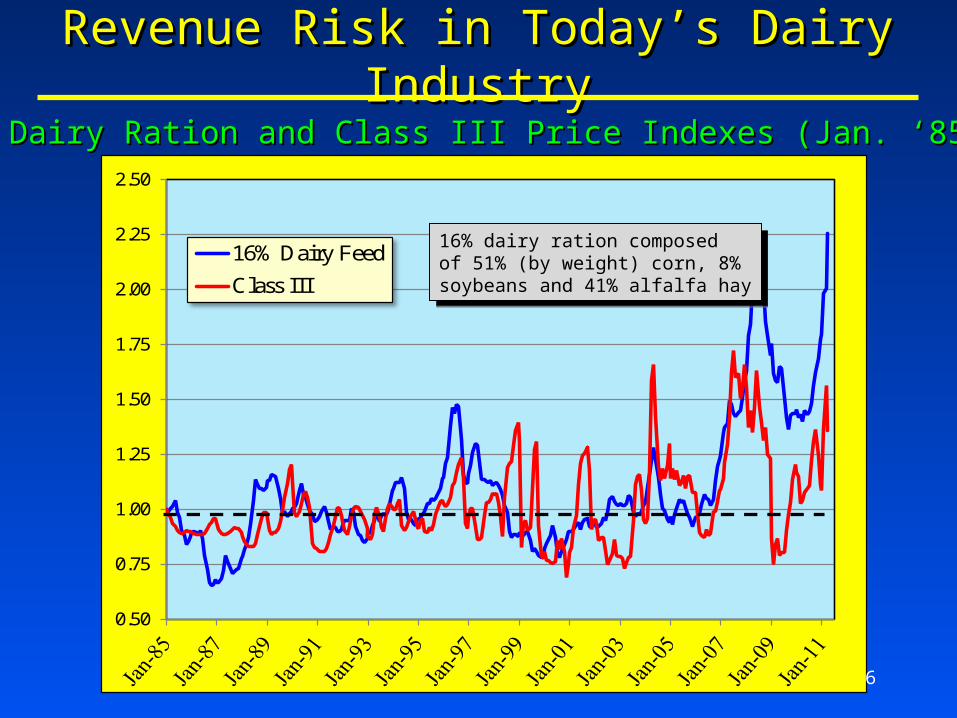
16% Dairy Feed
Class III
6
Revenue Risk in Today’s Dairy IndustryRevenue Risk in Today’s Dairy Industry
16% Dairy Ration and Class III Price Indexes (Jan. ‘85 = 1)16% Dairy Ration and Class III Price Indexes (Jan. ‘85 = 1)
16% dairy ration composedof 51% (by weight) corn, 8% soybeans and 41% alfalfa hay
16% dairy ration composedof 51% (by weight) corn, 8% soybeans and 41% alfalfa hay
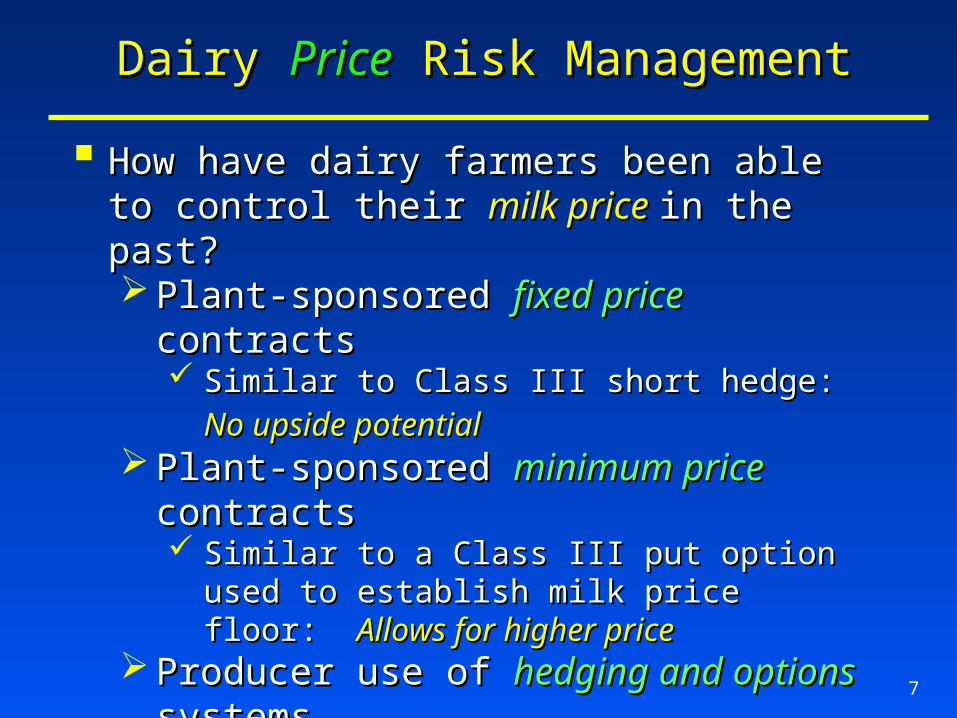
How have dairy farmers been able to control their How have dairy farmers been able to control their milk price milk price in the past?in the past? Plant-sponsored Plant-sponsored fixed price fixed price contractscontracts
Similar to Class III short hedge: Similar to Class III short hedge: No upside potentialNo upside potential
Plant-sponsored Plant-sponsored minimum price minimum price contractscontracts Similar to a Class III put option used to establish Similar to a Class III put option used to establish
milk price floor: milk price floor: Allows for higher priceAllows for higher price Producer use of Producer use of hedging and optionshedging and options systems systems
Outcomes vary across strategy: Outcomes vary across strategy: lock inlock in a Class III a Class III price, establish price, establish minimumminimum Class III prices, etc. Class III prices, etc.
Need to recognize contract lumpinessNeed to recognize contract lumpiness Possibility of margin calls with use of futuresPossibility of margin calls with use of futures
Dairy Dairy PricePrice Risk Management Risk Management
7
8
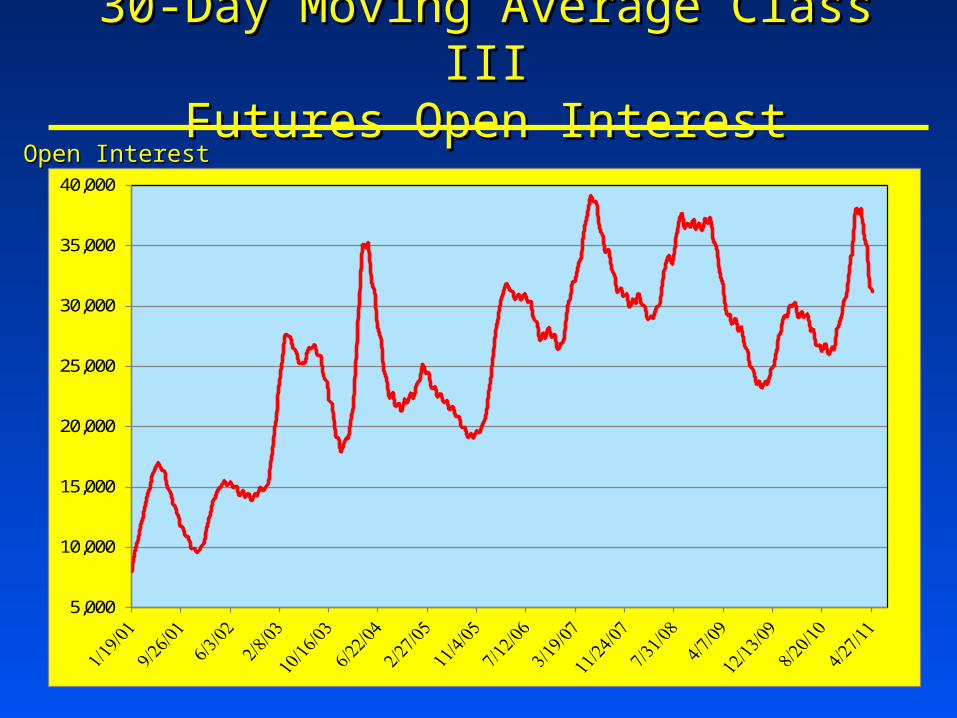
30-Day Moving Average Class III30-Day Moving Average Class IIIFutures Open InterestFutures Open Interest
5,000
10,000
15,000
20,000
25,000
30,000
35,000
40,000
Open InterestOpen Interest
9
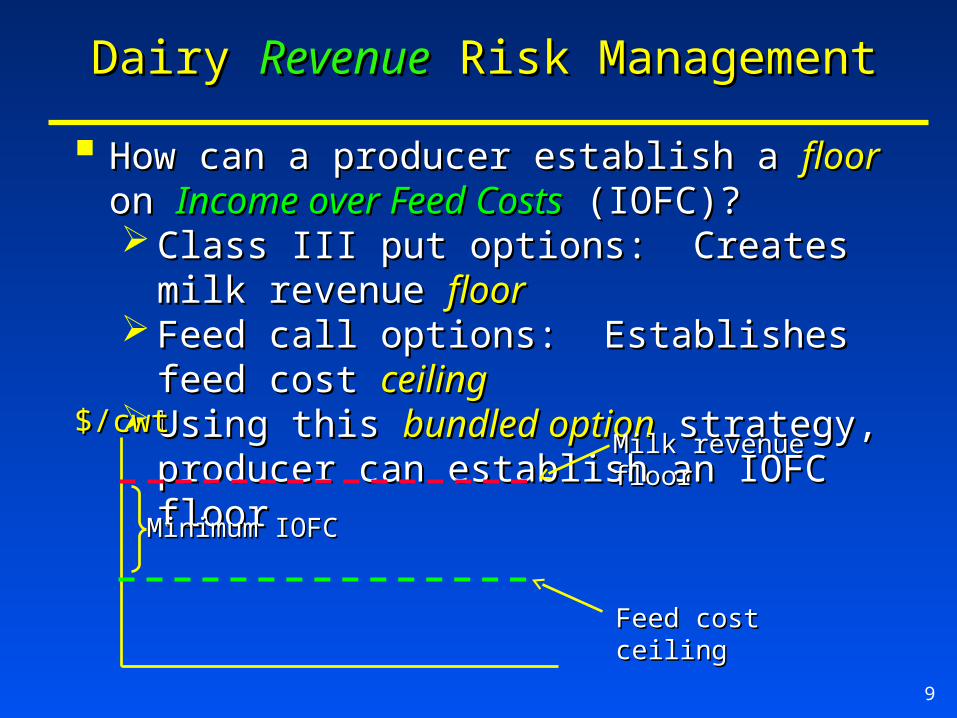
How can a producer establish a How can a producer establish a floorfloor on on Income over Income over Feed CostsFeed Costs (IOFC)? (IOFC)? Class III put options: Creates milk revenue Class III put options: Creates milk revenue floorfloor Feed call options: Establishes feed cost Feed call options: Establishes feed cost ceilingceiling Using this Using this bundled optionbundled option strategy, producer can strategy, producer can
establish an IOFC floorestablish an IOFC floor$/cwt$/cwt
Milk revenue floorMilk revenue floor
Feed cost ceilingFeed cost ceiling
Minimum IOFCMinimum IOFC
Dairy Dairy RevenueRevenue Risk Management Risk Management
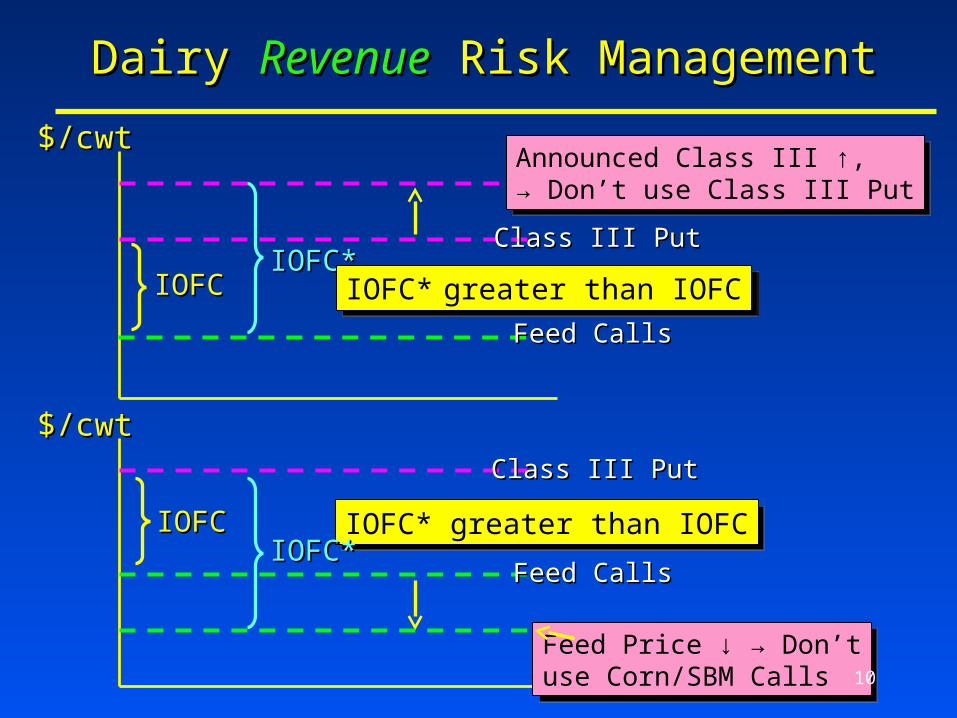
$/cwt$/cwt
IOFCIOFCIOFC*IOFC*
Class III PutClass III Put
Announced Class III ↑,→ Don’t use Class III Put
Announced Class III ↑,→ Don’t use Class III Put
$/cwt$/cwt
IOFCIOFC
Class III PutClass III Put
Feed CallsFeed Calls
Feed CallsFeed Calls
Feed Price ↓ → Don’tuse Corn/SBM Calls
Feed Price ↓ → Don’tuse Corn/SBM Calls
IOFC* greater than IOFCIOFC* greater than IOFC
IOFC* greater than IOFCIOFC* greater than IOFCIOFC*IOFC*
Dairy Dairy RevenueRevenue Risk Management Risk Management
10
11
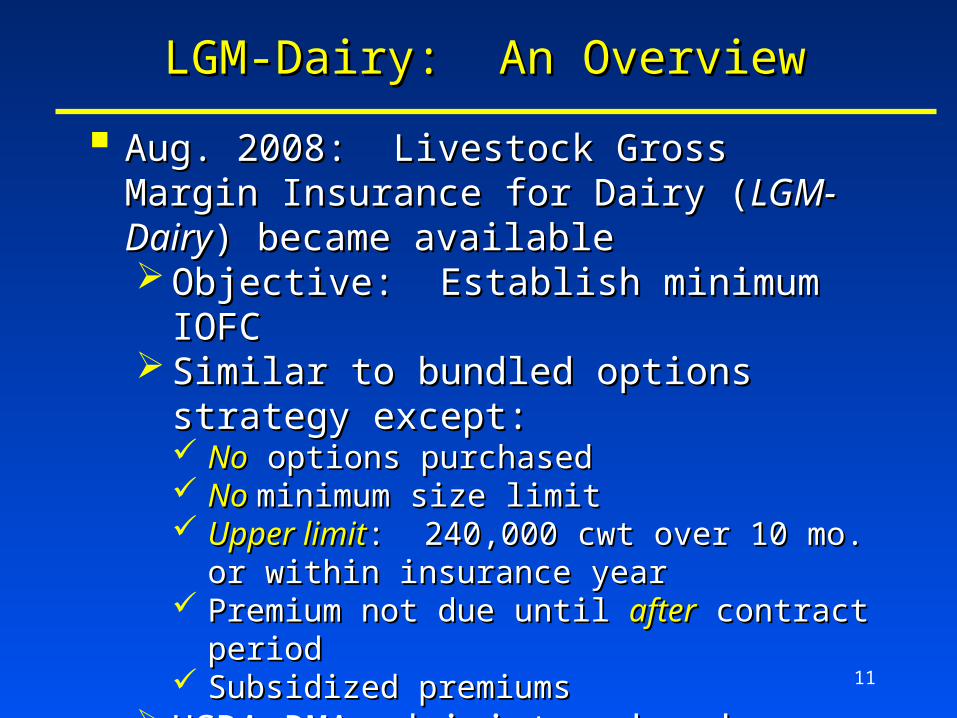
Aug. 2008: Livestock Gross Margin Insurance Aug. 2008: Livestock Gross Margin Insurance for Dairy (for Dairy (LGM-DairyLGM-Dairy) became available) became available Objective: Establish minimum IOFCObjective: Establish minimum IOFC Similar to bundled options strategy except:Similar to bundled options strategy except:
NoNo options purchased options purchased NoNo minimum size limitminimum size limit Upper limitUpper limit: 240,000 cwt over 10 mo. or within : 240,000 cwt over 10 mo. or within
insurance yearinsurance year Premium not due until Premium not due until afterafter contract period contract period Subsidized premiumsSubsidized premiums
USDA-RMA administered and purchased from USDA-RMA administered and purchased from firms selling Federal crop insurancefirms selling Federal crop insurance July 2010: Available in lower 48 statesJuly 2010: Available in lower 48 states
LGM-Dairy: An OverviewLGM-Dairy: An Overview
12
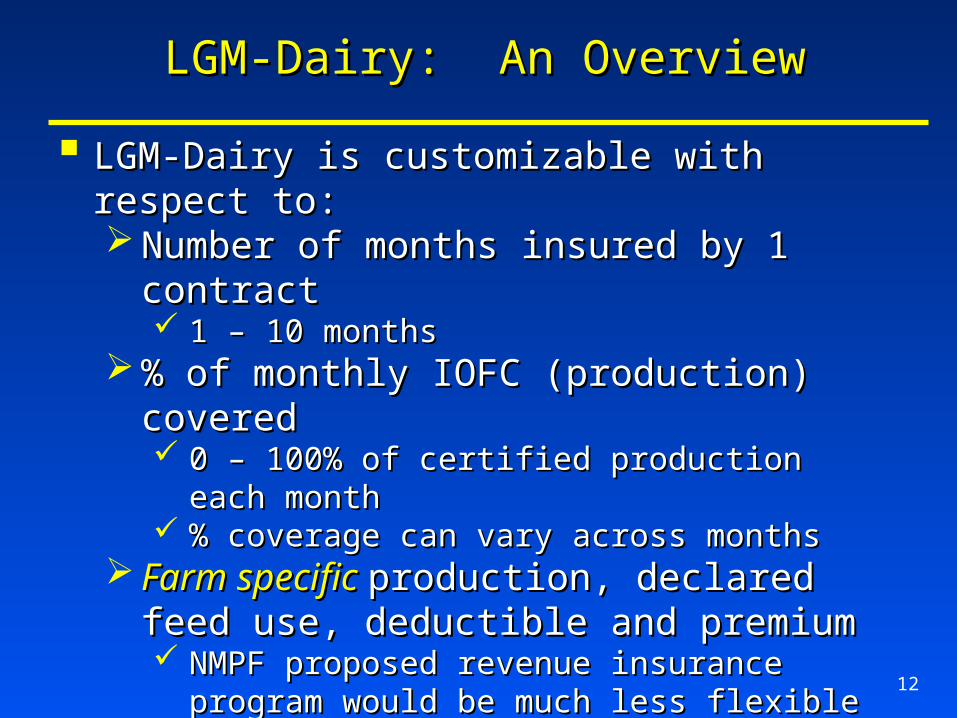
LGM-Dairy is customizable with respect to: LGM-Dairy is customizable with respect to: Number of months insured by 1 contractNumber of months insured by 1 contract
1 1 –– 10 months 10 months % of monthly IOFC (production) covered% of monthly IOFC (production) covered
0 – 100% of certified production each month0 – 100% of certified production each month % coverage can vary across months% coverage can vary across months
Farm specific Farm specific production, declared feed use, production, declared feed use, deductible and premiumdeductible and premium NMPF proposed revenue insurance program would NMPF proposed revenue insurance program would
be much less flexiblebe much less flexible
LGM-Dairy: An OverviewLGM-Dairy: An Overview
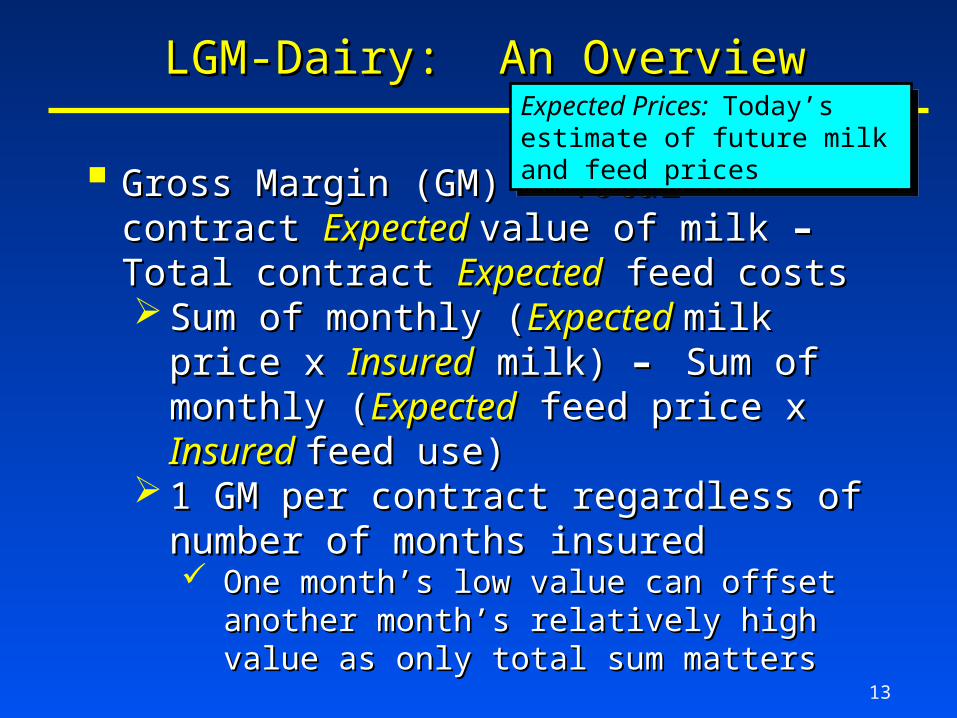
Gross Margin (GM) = Total contract Gross Margin (GM) = Total contract Expected Expected value of milk value of milk –– Total contract Total contract ExpectedExpected feed costs feed costs Sum of monthly (Sum of monthly (Expected Expected milk price x milk price x
InsuredInsured milk) milk) – – Sum of monthly (Sum of monthly (ExpectedExpected feed price x feed price x Insured Insured feed use) feed use)
1 GM per contract regardless of number of 1 GM per contract regardless of number of months insuredmonths insured One month’s low value can offset another month’s One month’s low value can offset another month’s
relatively high value as only total sum mattersrelatively high value as only total sum matters
Gross Margin Guarantee (GMG) = Gross Margin Guarantee (GMG) = GM GM –– Total Total DeductibleDeductible
LGM-Dairy: An OverviewLGM-Dairy: An Overview
13
Expected Prices: Today’s estimate of future milk and feed prices
Expected Prices: Today’s estimate of future milk and feed prices
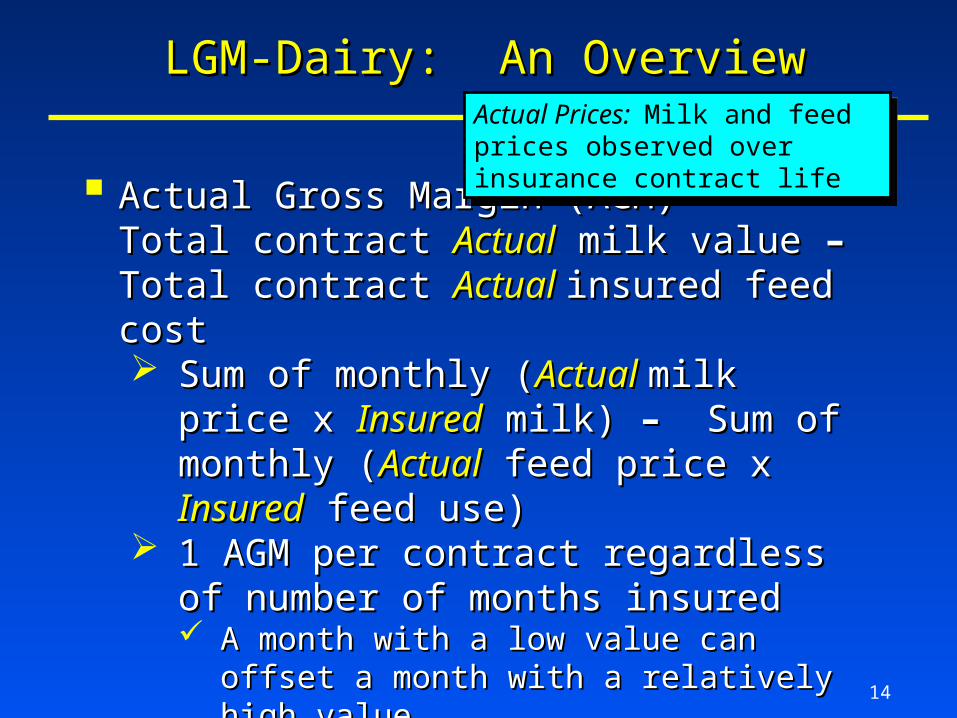
Actual Gross Margin (AGM) = Total contract Actual Gross Margin (AGM) = Total contract ActualActual milk value milk value – – Total contractTotal contract Actual Actual insuredinsured feed costfeed cost Sum of monthly Sum of monthly ((Actual Actual milk price x milk price x InsuredInsured
milk) milk) – – Sum of monthly Sum of monthly ((ActualActual feed price x feed price x InsuredInsured feed use) feed use)
1 AGM per contract regardless of number of 1 AGM per contract regardless of number of months insuredmonths insured A month with a low value can offset a month with A month with a low value can offset a month with
a relatively high valuea relatively high value
LGM-Dairy: An OverviewLGM-Dairy: An Overview
14
Actual Prices: Milk and feed prices observed over insurance contract life
Actual Prices: Milk and feed prices observed over insurance contract life
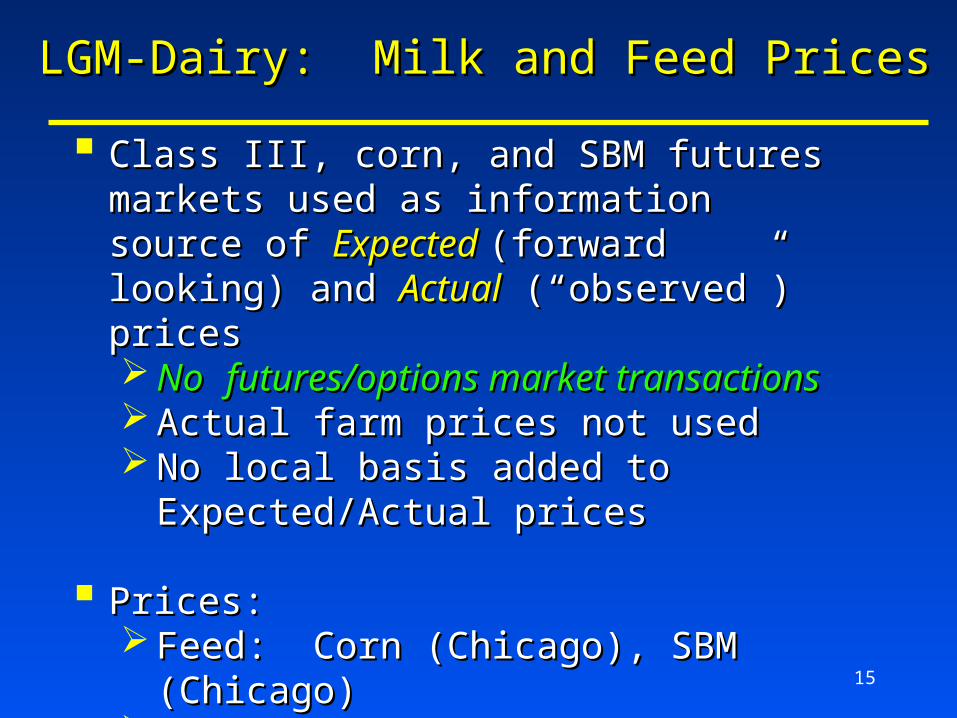
Class III, corn, and SBM futures markets used as Class III, corn, and SBM futures markets used as information source of information source of Expected Expected (forward (forward looking) and looking) and ActualActual (“observed”) prices (“observed”) prices NoNo futures/options market transactionsfutures/options market transactions Actual farm prices not usedActual farm prices not used No local basis added to Expected/Actual No local basis added to Expected/Actual
pricesprices
Prices:Prices: Feed: Corn (Chicago), SBM (Chicago)Feed: Corn (Chicago), SBM (Chicago) Milk: Class III (standard composition)Milk: Class III (standard composition)
3.5% Fat3.5% Fat Skim Portion: 3.1% Protein/5.9 Other SolidsSkim Portion: 3.1% Protein/5.9 Other Solids
LGM-Dairy: Milk and Feed PricesLGM-Dairy: Milk and Feed Prices
15
16
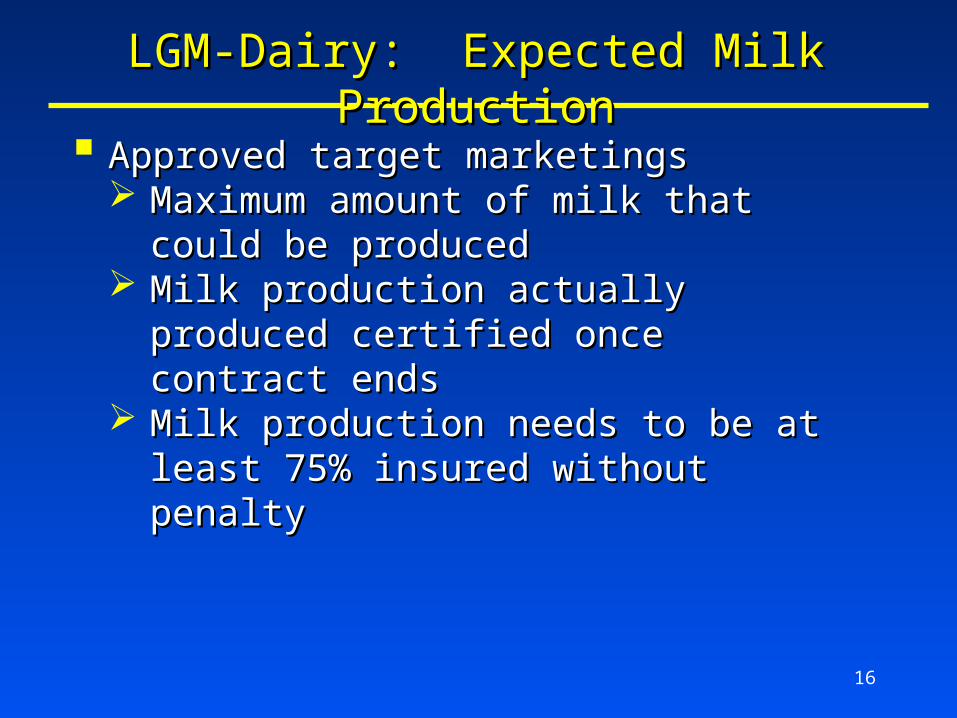
Approved target marketings Approved target marketings Maximum amount of milk that could be Maximum amount of milk that could be
producedproduced Milk production actually produced certified Milk production actually produced certified
once contract endsonce contract ends Milk production needs to be at least 75% Milk production needs to be at least 75%
insured without penaltyinsured without penalty
LGM-Dairy: Expected Milk ProductionLGM-Dairy: Expected Milk Production
17
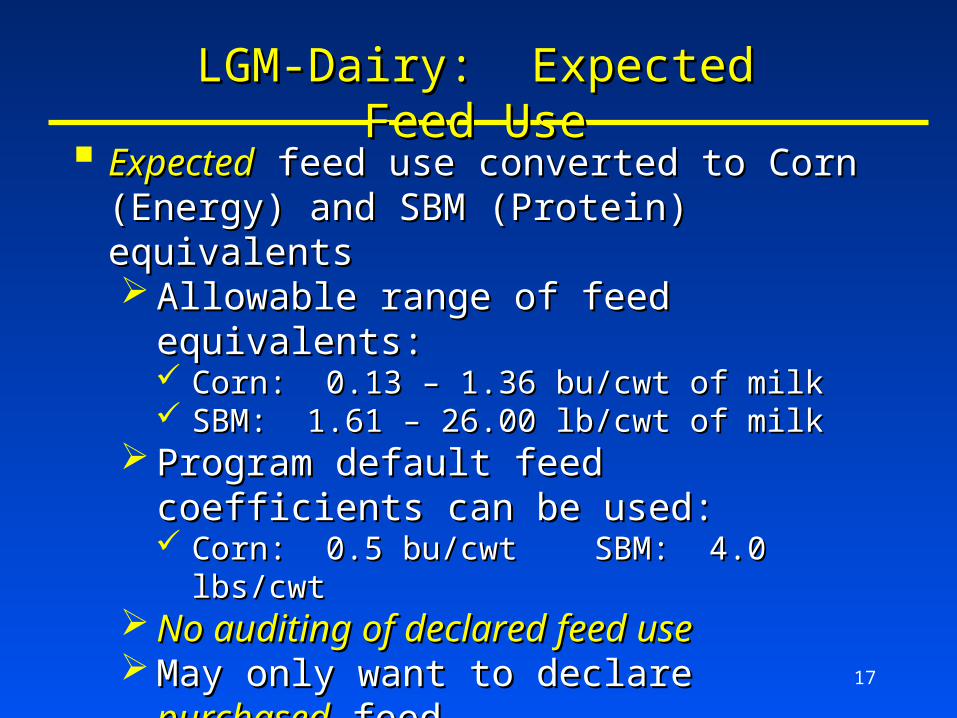
ExpectedExpected feed use converted to Corn (Energy) feed use converted to Corn (Energy) and SBM (Protein) equivalentsand SBM (Protein) equivalents Allowable range of feed equivalents:Allowable range of feed equivalents:
Corn: 0.13 – 1.36 bu/cwt of milkCorn: 0.13 – 1.36 bu/cwt of milk SBM: 1.61 – 26.00 lb/cwt of milkSBM: 1.61 – 26.00 lb/cwt of milk
Program default feed coefficients can be used:Program default feed coefficients can be used: Corn: 0.5 bu/cwt SBM: 4.0 lbs/cwtCorn: 0.5 bu/cwt SBM: 4.0 lbs/cwt
No auditing of declared feed useNo auditing of declared feed use May only want to declare May only want to declare purchasedpurchased feed feed Using minimum amounts → approximate Using minimum amounts → approximate
synthetic putsynthetic put
LGM-Dairy: Expected Feed UseLGM-Dairy: Expected Feed Use
18
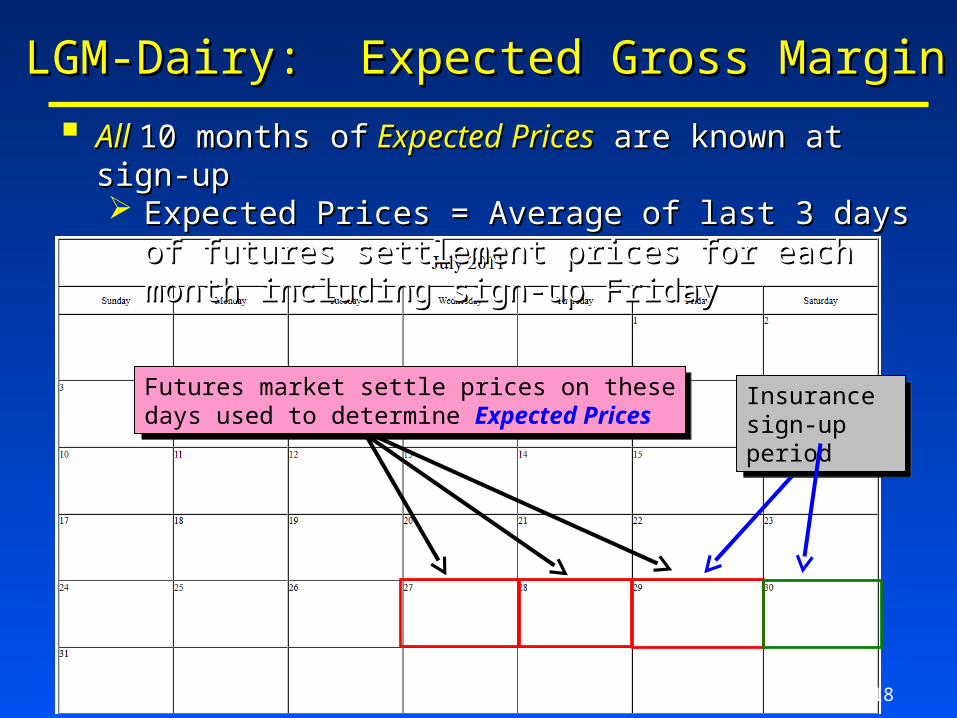
AllAll 10 months of10 months of Expected PricesExpected Prices are known at sign-up are known at sign-up Expected Prices = Average of last 3 days of futures Expected Prices = Average of last 3 days of futures
settlement prices for each month including sign-up Fridaysettlement prices for each month including sign-up Friday
LGM-Dairy: Expected Gross MarginLGM-Dairy: Expected Gross Margin
Futures market settle prices on thesedays used to determine Expected Prices
Futures market settle prices on thesedays used to determine Expected Prices Insurance sign-
up period
Insurance sign-up period
19
With known expected prices, minimum With known expected prices, minimum GMG GMG for for entireentire contractcontract determined at sign-up determined at sign-up Regardless of contract length: 1,2,…,9, or Regardless of contract length: 1,2,…,9, or
10 months10 months GMG calculated using program rulesGMG calculated using program rules
If GMG If GMG >> AGM → Indemnity paid AGM → Indemnity paid Payout amount = GMG Payout amount = GMG –– AGM AGM
Remember GMG & AGM evaluated for entire Remember GMG & AGM evaluated for entire contractcontract
LGM-Dairy: Indemnity DeterminationLGM-Dairy: Indemnity Determination
20
LGM-DairyLGM-Dairy available for purchase each month available for purchase each month 12 contracts offered each year12 contracts offered each year
Each contract covers Each contract covers up toup to 10 months 10 months Purchase period starts at end of last business Purchase period starts at end of last business
Friday of each monthFriday of each month July contract purchase period would have started July contract purchase period would have started
on July 29on July 29thth Purchase period ends at 8:00 PM CDT Purchase period ends at 8:00 PM CDT
SaturdaySaturday Points to the reason why planning is needed Points to the reason why planning is needed
well in advancewell in advance of contract purchase of contract purchase
LGM-Dairy: When Purchased?LGM-Dairy: When Purchased?
21
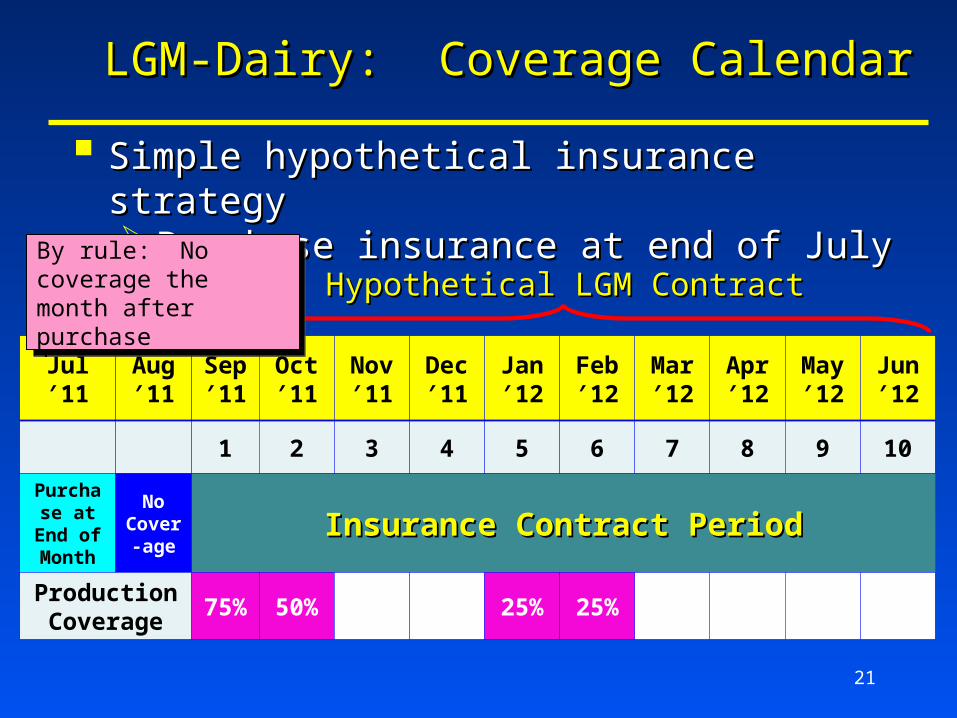
Simple hypothetical insurance strategySimple hypothetical insurance strategy Purchase insurance at end of JulyPurchase insurance at end of July
Jul′11
Aug ′11
Sep ′11
Oct ′11
Nov ′11
Dec ′11
Jan ′12
Feb ′12
Mar ′12
Apr ′12
May ′12
Jun ′12
1 2 3 4 5 6 7 8 9 10
Purchase at End of
Month
NoCover-
ageInsurance Contract PeriodInsurance Contract Period
Production Coverage
75% 50% 25% 25%
Hypothetical LGM ContractHypothetical LGM Contract
LGM-Dairy: Coverage CalendarLGM-Dairy: Coverage Calendar
By rule: No coverage the month after purchase
By rule: No coverage the month after purchase
22
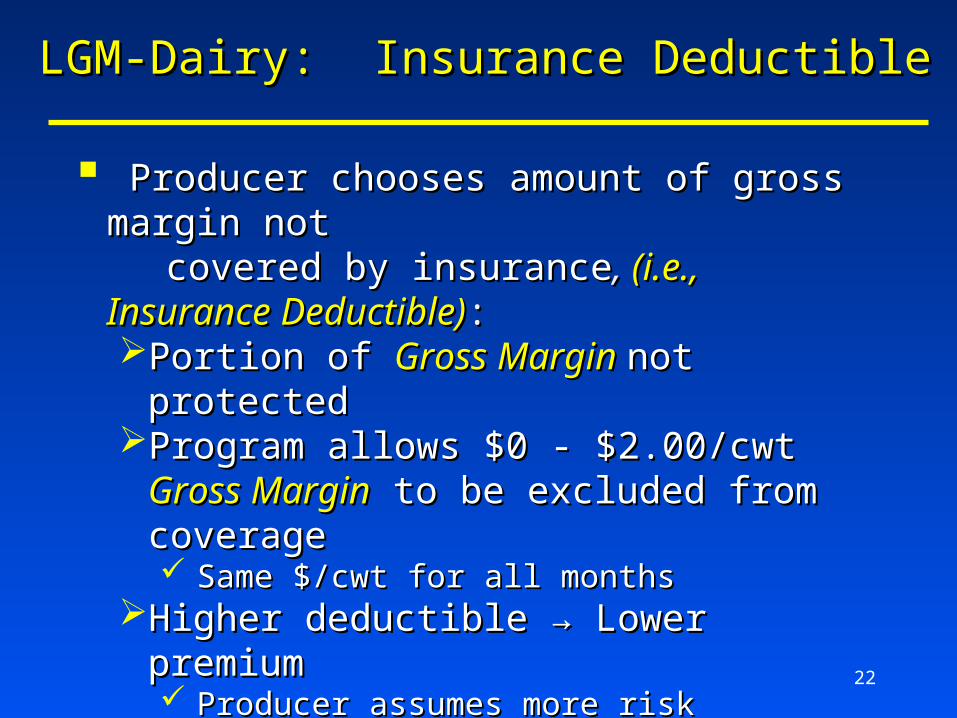
Producer chooses amount of gross margin notProducer chooses amount of gross margin not covered by insurancecovered by insurance,, (i.e., Insurance (i.e., Insurance
Deductible)Deductible):: Portion of Portion of Gross Margin Gross Margin not protectednot protectedProgram allows $0 - $2.00/cwt Program allows $0 - $2.00/cwt Gross MarginGross Margin
to be excluded from coverageto be excluded from coverage Same $/cwt for all monthsSame $/cwt for all months
Higher deductible → Lower premiumHigher deductible → Lower premium Producer assumes more riskProducer assumes more risk
Subsidy Subsidy increasesincreases with higher deductible with higher deductibleDouble impact on reducing premium Double impact on reducing premium
LGM-Dairy: Insurance DeductibleLGM-Dairy: Insurance Deductible
23
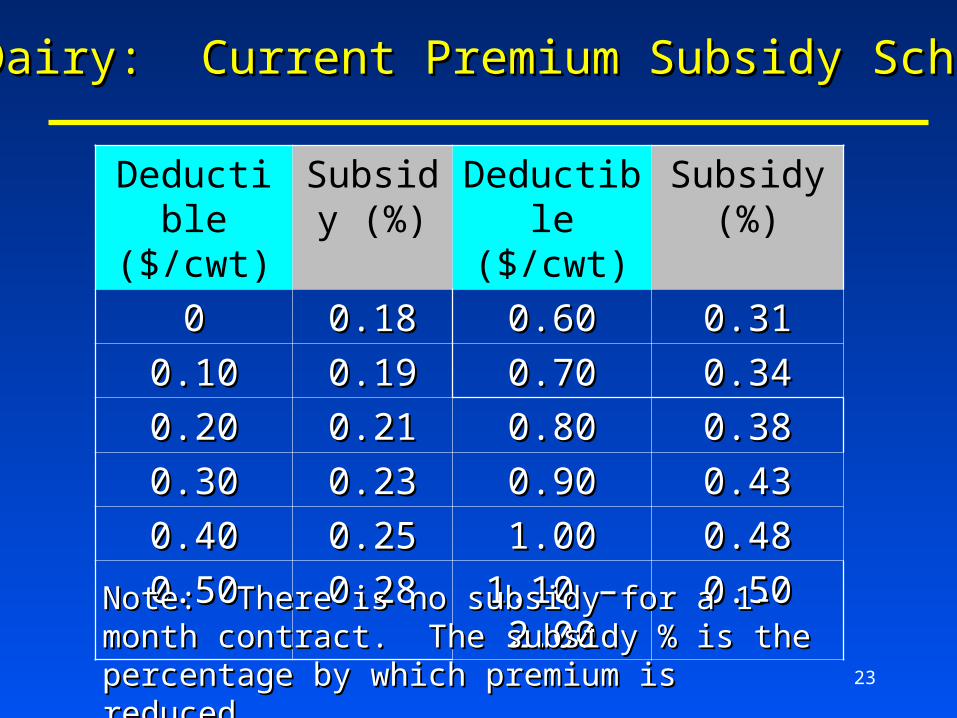
LGM-Dairy: Current Premium Subsidy ScheduleLGM-Dairy: Current Premium Subsidy Schedule
Deductible ($/cwt)
Subsidy (%)
Deductible ($/cwt)
Subsidy (%)
00 0.180.18 0.600.60 0.310.31
0.100.10 0.190.19 0.700.70 0.340.34
0.200.20 0.210.21 0.800.80 0.380.38
0.300.30 0.230.23 0.900.90 0.430.43
0.400.40 0.250.25 1.001.00 0.480.48
0.500.50 0.280.28 1.10 – 2.001.10 – 2.00 0.500.50
Note: There is no subsidy for a 1-month contract. The Note: There is no subsidy for a 1-month contract. The subsidy % is the percentage by which premium is subsidy % is the percentage by which premium is reduced.reduced.
24
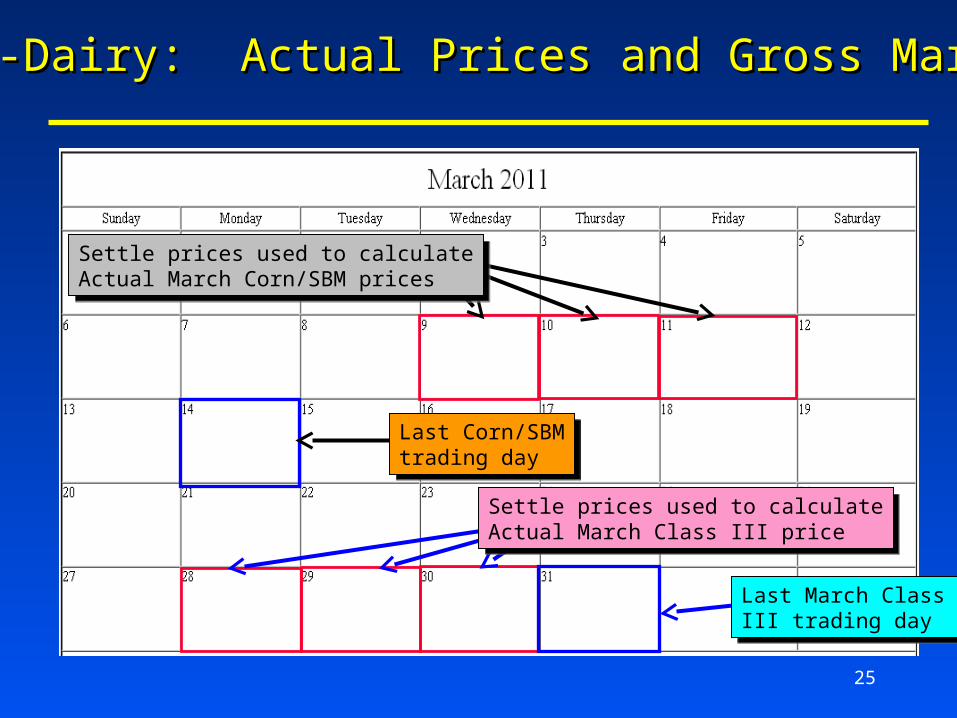
Actual prices determined as futures contracts Actual prices determined as futures contracts expire over insurance contract life expire over insurance contract life Actual price = Average futures contracts settle Actual price = Average futures contracts settle
prices from 1prices from 1stst, 2, 2ndnd, and 3, and 3rdrd days days priorprior to to futures contract futures contract last last trading daytrading day
LGM-Dairy: Actual Prices and Gross MarginLGM-Dairy: Actual Prices and Gross Margin
25
LGM-Dairy: Actual Prices and Gross MarginLGM-Dairy: Actual Prices and Gross Margin
Settle prices used to calculateActual March Class III price
Settle prices used to calculateActual March Class III price
Last Corn/SBMtrading day
Last Corn/SBMtrading day
Last March Class III trading day
Last March Class III trading day
Settle prices used to calculateActual March Corn/SBM prices
Settle prices used to calculateActual March Corn/SBM prices
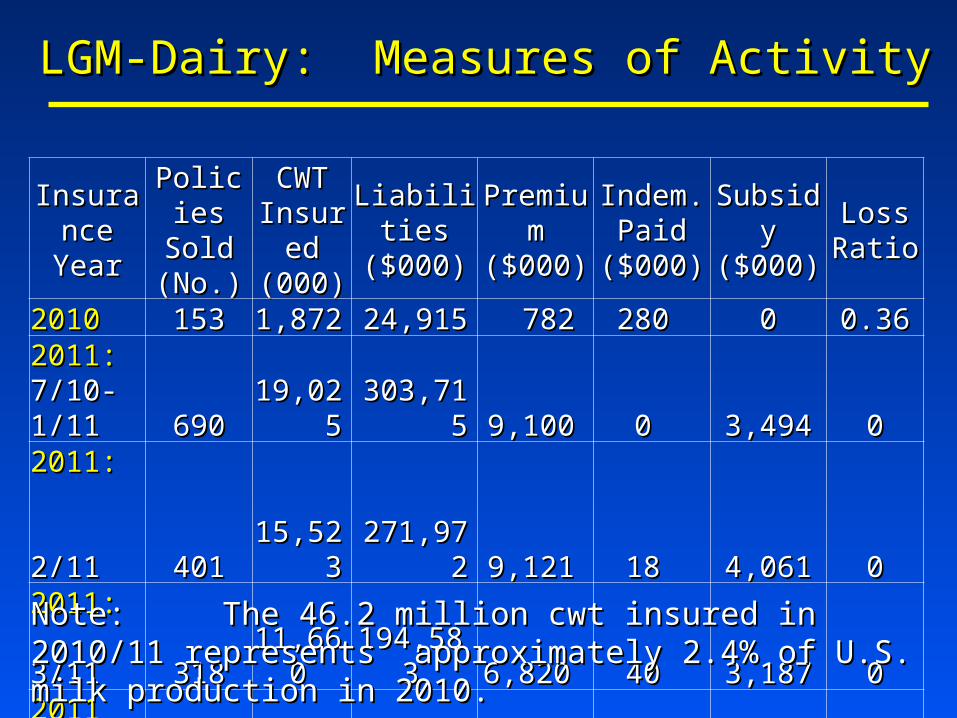
LGM-Dairy: Measures of ActivityLGM-Dairy: Measures of Activity
Insurance Insurance YearYear
Policies Policies Sold Sold (No.)(No.)
CWT CWT Insured Insured (000)(000)
Liabilities Liabilities ($000)($000)
Premium Premium ($000)($000)
Indem. Indem. Paid Paid
($000)($000)
Subsidy Subsidy ($000)($000)
Loss Loss RatioRatio
20102010 153153 1,8721,872 24,91524,915 782782 280280 00 0.360.362011: 2011: 7/10-1/117/10-1/11 690690 19,02519,025 303,715303,715 9,1009,100 00 3,4943,494 002011: 2011: 2/112/11 401401 15,52315,523 271,972271,972 9,1219,121 1818 4,0614,061 002011: 2011: 3/113/11 318318 11,66011,660 194,583194,583 6,8206,820 4040 3,1873,187 0020112011 TotalTotal 1,4091,409 46,20946,209 770,270770,270 25,04125,041 5858 10,74210,742 00
Note:Note: The 46.2 million cwt insured in 2010/11 represents The 46.2 million cwt insured in 2010/11 represents approximately 2.4% of U.S. milk production in 2010.approximately 2.4% of U.S. milk production in 2010.
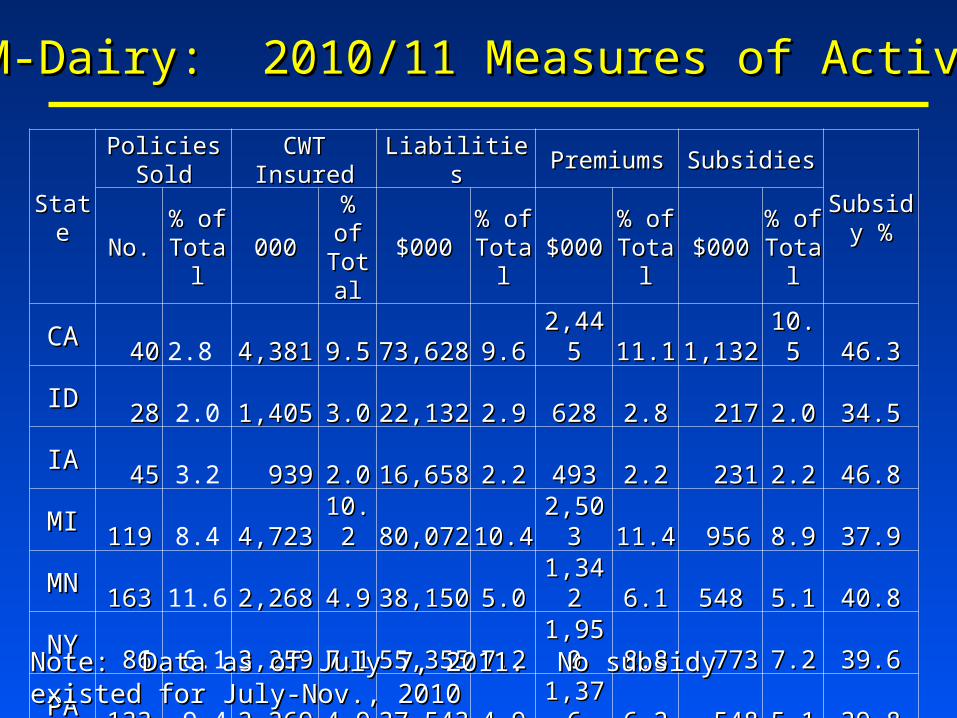
LGM-Dairy: 2010/11 Measures of ActivityLGM-Dairy: 2010/11 Measures of Activity
StateStatePolicies SoldPolicies Sold CWT InsuredCWT Insured LiabilitiesLiabilities PremiumsPremiums SubsidiesSubsidies
Subsidy Subsidy %%No.No.
% of % of TotalTotal
000000% of % of TotalTotal
$000$000% of % of TotalTotal
$000$000% of % of TotalTotal
$000$000% of % of TotalTotal
CACA 4040 2.8 4,3814,381 9.59.5 73,62873,628 9.69.6 2,4452,445 11.111.1 1,1321,132 10.510.5 46.346.3IDID 2828 2.0 1,4051,405 3.03.0 22,13222,132 2.92.9 628628 2.82.8 217217 2.02.0 34.534.5IAIA 4545 3.2 939939 2.02.0 16,65816,658 2.22.2 493493 2.22.2 231231 2.22.2 46.846.8MIMI 119119 8.4 4,7234,723 10.210.2 80,07280,072 10.410.4 2,5032,503 11.411.4 956956 8.98.9 37.937.9MNMN 163163 11.6 2,2682,268 4.94.9 38,15038,150 5.05.0 1,3421,342 6.16.1 548548 5.15.1 40.840.8NYNY 8686 6.1 3,2593,259 7.17.1 55,35555,355 7.27.2 1,9501,950 8.88.8 773773 7.27.2 39.639.6PAPA 133133 9.4 2,2692,269 4.94.9 37,54337,543 4.94.9 1,3761,376 6.26.2 548548 5.15.1 39.839.8VTVT 9494 6.7 4,7464,746 10.310.3 76,96576,965 10.010.0 2,1722,172 9.99.9 1,0661,066 9.99.9 49.149.1WAWA 4040 2.8 2,4272,427 5.35.3 39,41539,415 5.15.1 1,2161,216 5.55.5 560560 5.25.2 46.046.0WIWI 422 30.0 9,273 20.1 154,487 20.1 5,038 22.9 2,083 19.4 41.3
OtherOther 239239 17.0 10,47310,473 22.822.8 175,864175,864 22.822.8 2,8782,878 13.113.1 2,6292,629 24.524.5 44.744.7TotalTotal 1,4091,409 ----- 46,20946,209 ---------- 770,270770,270 ---------- 25,04125,041 ---------- 10,74310,743 ------------ 42.942.9
Note: Data as of July 7, 2011. No subsidy existed for July-Nov., 2010Note: Data as of July 7, 2011. No subsidy existed for July-Nov., 2010
28
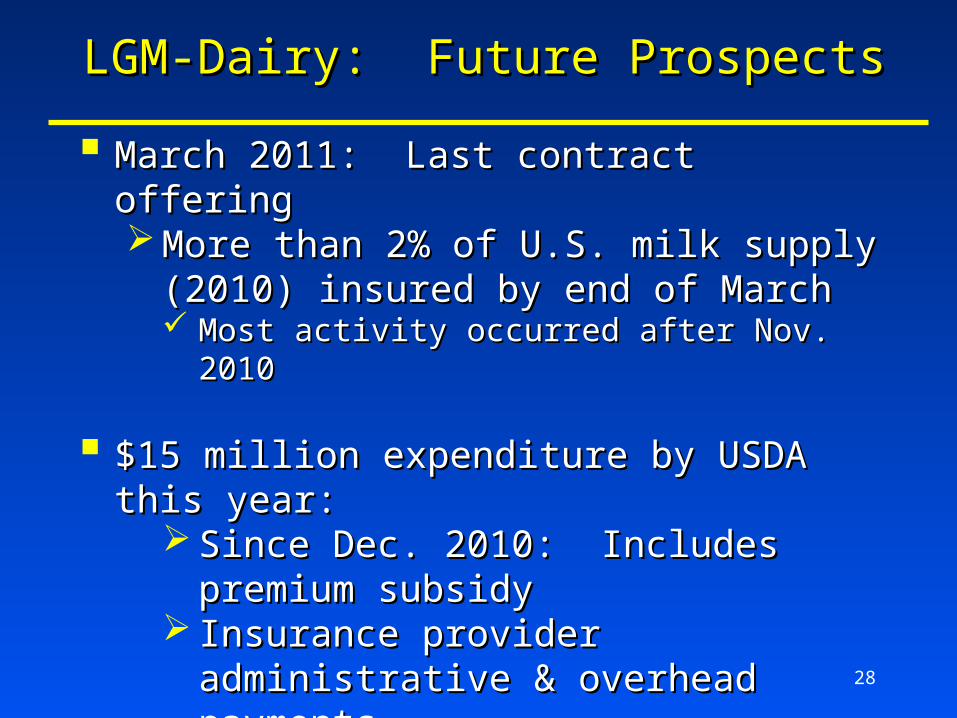
March 2011: Last contract offering March 2011: Last contract offering More than 2% of U.S. milk supply (2010) More than 2% of U.S. milk supply (2010)
insured by end of March insured by end of March Most activity occurred after Nov. 2010Most activity occurred after Nov. 2010
$15 million expenditure by USDA this year:$15 million expenditure by USDA this year: Since Dec. 2010: Includes premium subsidySince Dec. 2010: Includes premium subsidy Insurance provider administrative & Insurance provider administrative &
overhead paymentsoverhead payments
Insurance year runs from October – SeptemberInsurance year runs from October – September Next possible contract offering: Oct. 28Next possible contract offering: Oct. 28 thth
LGM-Dairy: Future ProspectsLGM-Dairy: Future Prospects
29
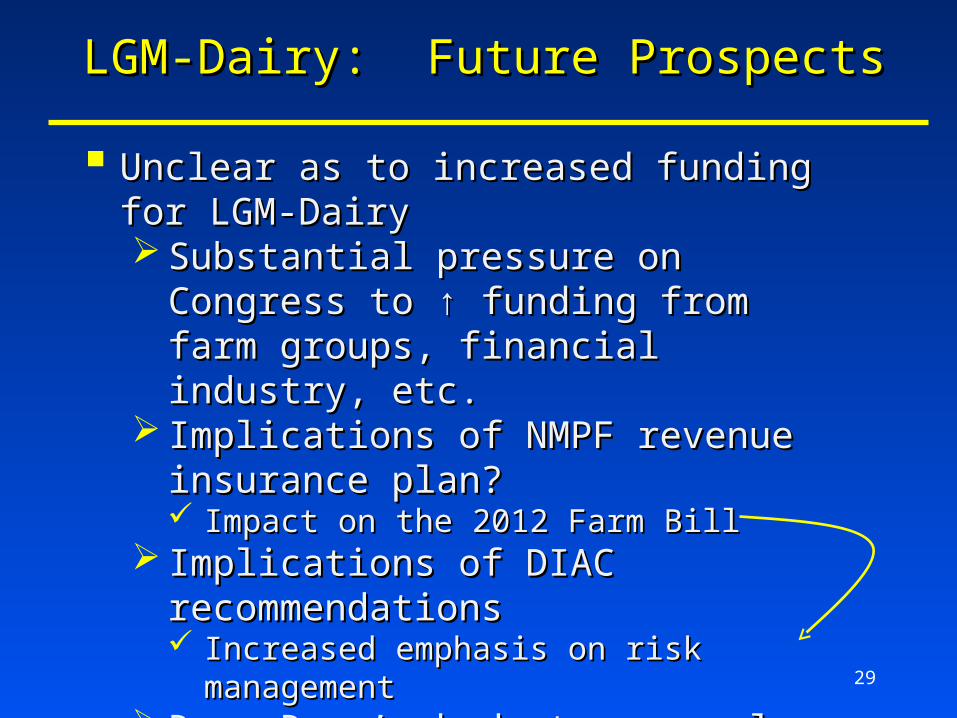
Unclear as to increased funding for LGM-DairyUnclear as to increased funding for LGM-Dairy Substantial pressure on Congress to ↑ Substantial pressure on Congress to ↑
funding from farm groups, financial funding from farm groups, financial industry, etc.industry, etc.
Implications of NMPF revenue insurance Implications of NMPF revenue insurance plan?plan? Impact on the 2012 Farm BillImpact on the 2012 Farm Bill
Implications of DIAC recommendationsImplications of DIAC recommendations Increased emphasis on risk managementIncreased emphasis on risk management
Rep. Ryan’s budget proposalRep. Ryan’s budget proposal Significant reduction in direct cash paymentsSignificant reduction in direct cash payments Increased reliance on individual producer risk Increased reliance on individual producer risk
managementmanagement
LGM-Dairy: Future ProspectsLGM-Dairy: Future Prospects
30
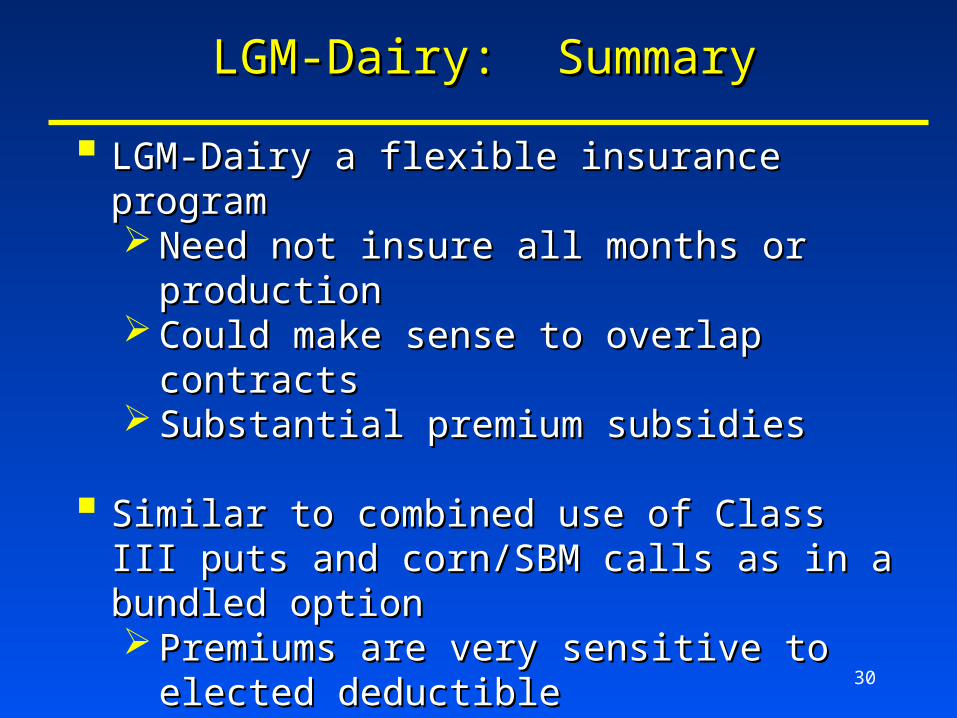
LGM-Dairy a flexible insurance programLGM-Dairy a flexible insurance program Need not insure all months or productionNeed not insure all months or production Could make sense to overlap contractsCould make sense to overlap contracts Substantial premium subsidiesSubstantial premium subsidies
Similar to combined use of Class III puts and Similar to combined use of Class III puts and corn/SBM calls as in a bundled optioncorn/SBM calls as in a bundled option Premiums are very sensitive to elected deductiblePremiums are very sensitive to elected deductible
LGM-Dairy Major DrawbacksLGM-Dairy Major Drawbacks Short sign-up window at the end of each monthShort sign-up window at the end of each month Need to wait until end of contract for indemnity Need to wait until end of contract for indemnity
After last actual price is determinedAfter last actual price is determined
LGM-Dairy: SummaryLGM-Dairy: Summary
31
Contact InformationContact Information
The Univ. of Wisconsin Dairy Marketing Website: The Univ. of Wisconsin Dairy Marketing Website: http://future.aae.wisc.eduhttp://future.aae.wisc.edu
Livestock Gross Margin Insurance: Livestock Gross Margin Insurance: http://future.aae.wisc.edu/lgm_dairy.htmlhttp://future.aae.wisc.edu/lgm_dairy.html
To join the LGM-Dairy Mailing List:To join the LGM-Dairy Mailing List:http://future.aae.wisc.edu/lgm_dairy.html#5http://future.aae.wisc.edu/lgm_dairy.html#5
Brian W. GouldBrian W. Gould Victor E. CabreraVictor E. Cabrera(608)263-3212(608)263-3212 (608)265-8506(608)[email protected]@wisc.edu [email protected]@wisc.edu


