
Chapter 6
Liberalisation of Trade in Services under ASEAN+1 FTAs:
A Mapping Exercise
Hikari Ishido
Chiba University, Japan
August 2015
This chapter should be cited as Ishido, H. (2015), ‘Liberalisation of Trade in Services under ASEAN+1 FTAs: A Mapping Exercise’, in Ing, L.Y. (ed.), East Asian Integration. ERIA Research Project Report 2014-6, Jakarta: ERIA, pp.157-194.

157
Chapter 6
Liberalisation of Trade in Services under ASEAN+1 FTAs: A Mapping Exercise
Hikari Ishido
Faculty of Law, Politics and Economics, Chiba University, Japan
This paper examines how Association of Southeast Asian Nations (ASEAN)–centred
free trade agreements (FTAs) or so-called ASEAN+1 FTAs are correlated amongst themselves
and thus have the potential to be merged into one single commitment towards the
establishment of a Regional Comprehensive Economic Partnership (RCEP). The ‘Coverage
Index’ defined in this paper highlights similarities and differences amongst the ASEAN+1
FTAs, i.e. the Eighth Package of Commitments under the ASEAN Framework Agreement on
Services (AFAS–8), the Second Package of Specific Commitments under the ASEAN–China
Free Trade Area (ACFTA–2), the ASEAN–Australia–New Zealand Free Trade Agreement
(AANZFTA), and the ASEAN–Korea Free Trade Agreement (AKFTA). We found that the degree
of liberalisation in terms of the Coverage Index is highest under AFAS–8, which could serve
as the focal point for convergence of the ASEAN+1 FTAs, which are positively correlated with
AFAS–8. Also, the ASEAN priority integration sectors are making progress (with the
exception of transport-related sectors). While the coverage index shows rather low levels of
commitment by the member countries, a feasible policy suggestion is to continue
prioritising the priority integration sectors including transport-related sectors for a
seamless ASEAN Economic Community as well as for a well-connected RCEP.
East Asian Integration
158
1. Introduction
This chapter attempts to show how Association of Southeast Asian Nations
(ASEAN)-centred free trade agreements (FTAs) (so-called ‘ASEAN+1 FTAs’1) are correlated
amongst themselves – in that many of the member countries cover each of the service
subsectors in their commitments – thus demonstrating the potential to merge them into
one single commitment. This attempt is expected to clarify what more could be done in the
actual policy arena towards the establishment of a Regional Comprehensive Economic
Partnership (RCEP).
The structure of this chapter is as follows. In the next section we define ‘Coverage
Index’ and comment on the similarities and differences between the four ASEAN+1 FTAs,
i.e. the ASEAN Framework Agreement on Services (AFAS), the ASEAN–China Free Trade
Area (ACFTA), the ASEAN–Australia–New Zealand Free Trade Agreement (AANZFTA), and
the ASEAN–Korea Free Trade Agreement (AKFTA).2 In Section 3 we conduct an extension
analysis with an exclusive focus on the ASEAN countries. We also make a comparison with
the General Agreement on Trade in Services (GATS) commitment. Section 4 provides some
policy suggestions and conclusions.
2. Overall Comparison of the ASEAN+1 FTAs using the ‘Coverage Index’ Convergence of
the ASEAN+1 FTAs
For the convergence of the ASEAN Framework Agreement on Services (AFAS),
ASEAN–China Free Trade Area (ACFTA), ASEAN–Australia–New Zealand Free Trade
Agreement (AANZFTA) and ASEAN–Korea Free Trade Agreement (AKFTA), an overall
comparison of service trade commitments would be needed. In this section, one such
comparison is made through introducing the ‘Coverage Index’ as defined below. While
commitments in the form of specific commitment tables submitted by FTA members are
different from their actual policy3, we expect that this kind of analysis will shed some new
1 In this paper, the ASEAN Framework Agreement on Services (AFAS) and the ASEAN–Australia–New
Zealand FTAs are included as part of the ASEAN+1 FTAs. 2 Under the ASEAN–Japan Comprehensive Economic Partnership Agreement (AJCEP), negotiations on
market access are ongoing as of this writing; as for the ASEAN–India Free Trade Area (AIFTA), negotiations
on trade in services are reportedly progressing, but relevant information is not yet publicly available. 3 The actual policy is usually different from and the degree of liberalisation can be higher than the policy indicated under free trade agreements: in the case of, e.g. ‘11.D. Space Transport’ – no restriction in actuality, it seems, because there is no domestic industry covering space transport – in terms of the level of liberalisation,

Chapter 6
159
light on the realisation in the near future of the Regional Comprehensive Economic
Partnership (RCEP) amongst the ASEAN members and their dialogue partners.
2.1. Definition of the ‘Coverage Index’
The ‘Coverage Index’ (introduced and discussed in, e.g. Adlung and Roy, 2005)
attempts to capture the extent to which the sectors are covered by the participating
countries. It is defined as ‘the share of commitments by FTA members in a certain sector ’:
when all the participating countries are committed (in each of their specific commitment
tables) to a certain service sector, the value of the Coverage Index takes its maximum value
of 1.0; when no participating countries are committed, the value is 0.0; when a
commitment is made by some (not all) the countries, the Coverage Index takes a value
between 0.0 and 1.0, depending on the number of countries with commitments. For
instance, when half of the FTA member countries are committed to a particular service
sector, the sector’s Coverage Index takes the value 0.5. Since there are three broad types
of commitments in specific commitment tables, i.e. ‘No limitation’ (symbolised as ‘N’),
‘Limited commitment4‘ (symbolised as ‘L’), and ‘Unbound’ (symbolised as ‘U’), the Coverage
Index can be calculated for each of these three commitments (or non-commitment for the
case of ‘U’).
The Coverage Index and the Hoekman Index 5 (Hoekman, 1995) are
complementary, in the sense that the former index measures the coverage by FTA member
countries of a particular service sector, while the latter index measures the depth of each
member country’s commitment in a particular service sector.6 We expect that with the
calculation of this Coverage Index, some convergence scenarios for the four existing
ASEAN+1 FTAs – AFAS (package 8, abbreviated in this chapter as AFAS–8), ACFTA (package
2, abbreviated as ACFTA–2), AANZFTA, and AKFTA – are made clear for concrete
implementation by the policy makers.
although the actual policy is always subject to restrictions at some point in the future. 4 Under this commitment pattern, there are some legal descriptions stipulating the restrictions in terms of market access or national treatment. 5 The method of Hoekman Index calculation assigns the value of 1.0 for the sectors with ‘None’ or no limitation, the value of 0.5 for those with ‘Limited’ or some legal restriction, and the value of 0 for those sectors with ‘Unbound’ or no promise of market openings. In this sense, the ‘depth’ of limitation in a particular sector is not captured. See Ishido (2011) for an application of Hoekman Index calculation to the commitment level under ASEAN+1 FTAs. 6 Ishido and Fukunaga (2012) conducted a detailed analysis of services chapters in the existing ASEAN+1 FTAs in terms of the Hoekman Index.
East Asian Integration
160
2.2. Results of the Coverage Index calculations
The results of Coverage Index calculations in terms of the ‘N-commitment’, ‘L-
commitment’, and ‘U-commitment’ are listed in the database constructed for this study at
the back of this chapter (note that these three types of indices add up to 1.0). Since the
most disaggregated information seems to be useful for actual negotiations on convergence,
we provide the full lists. It is rather difficult, however, to get an overall sense of the
similarities amongst the four ASEAN+1 FTAs.
Table 6.1 lists the Coverage Index calculation results at the 55-sector level. In the
calculation, simple averages of the values for the most detailed 154 sub-sectors under the
same 55-sector classification code are taken. 7 This table reveals the following
observations: (In the spirit of increasing the number of sectors with ‘N-commitment’ away
from ‘U-commitment’ and through ‘L-commitment’, the focus is first placed on ‘N-
commitment’ only).
AFAS–8 has an average Coverage Index value of 0.38 (the highest amongst the four
ASEAN+1 FTAs), with ‘01B Computer and Related Services’ taking the highest value (0.71).
ACFTA–2 has an average Coverage Index value of 0.20, with ‘09.B. Travel Agencies and Tour
Operators services’ taking the highest value (0.57). AANZFTA has an average Coverage Index
value of 0.25, with the sector ‘01.B. Computer and Related Services’ taking the highest
value (0.58). AKFTA has an average Coverage Index value of 0.19, with the sector ‘09.B.
Travel Agencies and Tour Operators services’ taking the highest Index value (0.56).
Concerning the ASEAN Economic Community ‘priority integration sectors’ of e-
ASEAN, air transport, healthcare, logistics, and tourism, AFAS–8 has relatively high
Coverage Index values: for Air Transport (11.C. Air Transport Services), the N-commitment
value is 0.13; for e-ASEAN (in terms of 01.B. Computer and Related Services) it is 0.71;
regarding Healthcare, ‘08.A. Hospital Services’ has a value of 0.56 and ‘08.B. Other Human
Health Services’ has a value of 0.41; for Tourism, ‘09.B. Travel Agencies and Tour Operators
services’ has a value of 0.63, and ‘09.C. Tourist Guides Services’ has a value of 0.30; for
Logistics, ‘04.B. Wholesale Trade Services’ has a N-commitment Coverage Index value of
0.48, ‘11.B. Internal Waterways Transport’ has an N-commitment Coverage Index value of
7 These sub-sectors are all defined under the World Trade Organization (WTO)’s General Agreement on Trade in Services (GATS), although the digits used for definition are different across sectors. For definitions of each of the service sub-sectors, see the WTO document ‘MTN.GNS/W/120’ (available online).
Chapter 6
161
0.26, ‘11.E. Rail Transport Services’ 0.32, ‘11.F. Road Transport Services’ 0.42, and ‘11.H.
Services Auxiliary to All Modes of Transport’ 0.39.8 The ASEAN priority integration sectors
are shadowed in the table. It seems, therefore, that the ASEAN priority integration sectors
have been making progress, in relative terms (with the exception of transport-related
sectors). That said, since the corresponding values under the other ASEAN+1 FTAs are lower
overall, more convergence efforts would be needed towards establishing an RCEP.
8 This is due to the absence of a detailed official definition of the priority integration sectors. Thus, in this chapter, we take the following sectors as the priority integration sectors: 01.B. Computer and Related Services, 02.C. Telecommunication Services, 04.B. Wholesale Trade Services, 08.A. Hospital Services, 09.B. Travel Agencies and Tour Operators services, 09.C. Tourist Guides Services, 11.A. Maritime Transport Services, 11.B. Internal Waterways Transport, 11.C. Air Transport Services, 11.E. Rail Transport Services, and 11.F. Road Transport Services.

East Asian Integration
162
Table 6.1: List of Coverage Index Calculations at the 55-sector Level
AFAS–8 ACFTA–2 AANZFTA AKFTA
Sector N-commitment
L-commitment
U-commitment
N-commitment
L-commitment
U-commitment
N-commitment
L-commitment
U-commitment
N-commitment
L-commitment
U-commitment
01.A. Professional Services 0.41 0.13 0.45 0.27 0.07 0.66 0.34 0.25 0.41 0.27 0.09 0.64
01.B. Computer and Related Services
0.71 0.15 0.15 0.44 0.07 0.49 0.58 0.28 0.14 0.43 0.04 0.53
01.C. Research and Development Services
0.43 0.07 0.50 0.18 0.03 0.80 0.14 0.26 0.60 0.21 0.02 0.78
01.D. Real Estate Services 0.14 0.00 0.86 0.13 0.01 0.86 0.14 0.27 0.59 0.06 0.00 0.94
01.E. Rental/Leasing Services without Operators
0.34 0.09 0.58 0.16 0.02 0.83 0.23 0.26 0.52 0.18 0.02 0.80
01.F. Other Business Services 0.41 0.06 0.54 0.22 0.03 0.75 0.24 0.26 0.51 0.24 0.02 0.74
02.A. Postal Services 0.11 0.11 0.78 0.03 0.06 0.91 0.00 0.25 0.75 0.03 0.06 0.91
02.B. Courier Services 0.61 0.11 0.28 0.32 0.02 0.66 0.24 0.24 0.52 0.24 0.10 0.66
02.C. Telecommunication Services 0.61 0.20 0.18 0.36 0.17 0.47 0.43 0.32 0.25 0.41 0.12 0.47
02.D. Audiovisual Services 0.28 0.06 0.66 0.13 0.02 0.85 0.11 0.27 0.62 0.13 0.02 0.85
02.E. Other 0.06 0.01 0.93 0.00 0.00 1.00 0.00 0.25 0.75 0.00 0.00 1.00
03.A. General Construction Work for Building
0.48 0.18 0.35 0.31 0.08 0.61 0.48 0.30 0.22 0.36 0.09 0.55
03.B. General Construction work for Civil Engineering
0.48 0.18 0.35 0.36 0.15 0.49 0.44 0.32 0.24 0.45 0.16 0.39
03.C. Installation and Assembly Work
0.48 0.18 0.35 0.34 0.10 0.56 0.42 0.30 0.28 0.38 0.10 0.52
03.D. Building Completion and Finishing Work
0.46 0.18 0.36 0.27 0.02 0.70 0.36 0.31 0.32 0.26 0.08 0.66
03.E. Other 0.46 0.18 0.36 0.26 0.09 0.65 0.40 0.30 0.30 0.30 0.09 0.61
04.A. Commission Agents' Services 0.59 0.08 0.34 0.32 0.05 0.64 0.33 0.25 0.42 0.28 0.00 0.72
04.B. Wholesale Trade Services 0.48 0.06 0.46 0.22 0.01 0.77 0.29 0.25 0.46 0.25 0.01 0.74
04.C. Retailing Services 0.38 0.05 0.58 0.19 0.01 0.80 0.22 0.25 0.53 0.19 0.03 0.77

Chapter 6
163
04.D. Franchising 0.49 0.03 0.49 0.27 0.00 0.73 0.19 0.25 0.56 0.27 0.00 0.73
04.E. Other 0.25 0.00 0.75 0.11 0.02 0.86 0.06 0.25 0.69 0.07 0.00 0.93
05.A. Primary Education Services 0.26 0.10 0.64 0.07 0.03 0.90 0.14 0.26 0.60 0.05 0.00 0.95
05.B. Secondary Education Services 0.34 0.15 0.51 0.09 0.03 0.88 0.35 0.27 0.38 0.16 0.03 0.81
05.C. Higher Education Services 0.36 0.10 0.54 0.20 0.06 0.74 0.34 0.29 0.36 0.20 0.05 0.75
05.D. Adult Education 0.54 0.10 0.36 0.24 0.03 0.73 0.24 0.28 0.48 0.27 0.02 0.70
05.E. Other Education Services 0.44 0.11 0.45 0.23 0.06 0.72 0.36 0.29 0.34 0.14 0.01 0.85
06.A. Sewage Services 0.50 0.14 0.36 0.25 0.03 0.72 0.36 0.25 0.39 0.26 0.03 0.70
06.B. Refuse Disposal Services 0.51 0.11 0.38 0.24 0.02 0.74 0.35 0.24 0.41 0.25 0.02 0.73
06.C. Sanitation and Similar Services
0.44 0.06 0.50 0.22 0.02 0.76 0.33 0.24 0.43 0.17 0.02 0.81
06.D. Other 0.55 0.09 0.36 0.26 0.02 0.72 0.32 0.24 0.44 0.28 0.02 0.69
07.A. All Insurance and Insurance-related Services
0.47 0.12 0.41 0.38 0.15 0.47 0.34 0.37 0.29 0.32 0.15 0.53
07.B. Banking and Other Financial Services
0.38 0.10 0.52 0.32 0.11 0.57 0.34 0.31 0.35 0.24 0.09 0.67
07.C. Other 0.05 0.05 0.90 0.02 0.00 0.98 0.03 0.26 0.71 0.03 0.01 0.95
08.A. Hospital Services 0.56 0.16 0.28 0.17 0.03 0.80 0.20 0.30 0.50 0.33 0.06 0.61
08.B. Other Human Health Services 0.41 0.11 0.48 0.15 0.03 0.82 0.14 0.26 0.60 0.09 0.00 0.91
08.C. Social Services 0.36 0.05 0.59 0.05 0.00 0.95 0.04 0.25 0.71 0.05 0.00 0.95
08.D. Other 0.25 0.04 0.71 0.11 0.00 0.89 0.00 0.25 0.75 0.00 0.00 1.00
09.A. Hotels and Restaurants 0.70 0.10 0.20 0.55 0.09 0.36 0.54 0.27 0.19 0.50 0.10 0.40
09.B. Travel Agencies and Tour Operators services
0.63 0.09 0.29 0.57 0.07 0.36 0.61 0.28 0.10 0.56 0.06 0.39
09.C. Tourist Guides Services 0.30 0.00 0.70 0.19 0.01 0.80 0.25 0.25 0.50 0.20 0.00 0.80
09.D. Other 0.48 0.09 0.44 0.09 0.02 0.89 0.05 0.24 0.71 0.11 0.02 0.86
10.A. Entertainment Services 0.54 0.05 0.41 0.28 0.02 0.69 0.18 0.26 0.56 0.24 0.01 0.75
10.B. News Agency Services 0.18 0.00 0.83 0.00 0.00 1.00 0.06 0.25 0.69 0.00 0.00 1.00
10.C. Libraries, archives, museums and other cultural services
0.29 0.04 0.68 0.07 0.00 0.93 0.06 0.25 0.69 0.07 0.00 0.93

East Asian Integration
164
10.D. Sporting and Other Recreational Services
0.35 0.04 0.61 0.24 0.03 0.73 0.18 0.26 0.56 0.14 0.03 0.83
10.E. Other 0.16 0.08 0.76 0.05 0.00 0.95 0.00 0.25 0.75 0.00 0.00 1.00
11.A. Maritime Transport Services 0.55 0.16 0.29 0.23 0.04 0.73 0.21 0.27 0.51 0.24 0.05 0.71
11.B. Internal Waterways Transport 0.26 0.08 0.66 0.04 0.01 0.95 0.01 0.25 0.74 0.01 0.00 0.99
11.C. Air Transport Services 0.13 0.01 0.87 0.16 0.03 0.82 0.09 0.25 0.66 0.18 0.02 0.80
11.D. Space Transport 0.06 0.01 0.93 0.00 0.00 1.00 0.00 0.25 0.75 0.00 0.00 1.00
11.E. Rail Transport Services 0.32 0.12 0.56 0.07 0.00 0.93 0.13 0.25 0.63 0.07 0.00 0.93
11.F. Road Transport Services 0.42 0.07 0.51 0.31 0.02 0.67 0.21 0.24 0.55 0.16 0.01 0.83
11.G. Pipeline Transport 0.14 0.09 0.78 0.05 0.02 0.93 0.17 0.27 0.56 0.07 0.02 0.91
11.H. Services Auxiliary to All Modes of Transport
0.39 0.09 0.52 0.24 0.05 0.71 0.22 0.25 0.53 0.20 0.04 0.75
11.I. Other Transport Services 0.00 0.00 1.00 0.00 0.00 1.00 0.00 0.25 0.75 0.05 0.00 0.95
Average 0.38 0.09 0.53 0.20 0.04 0.76 0.23 0.27 0.51 0.19 0.04 0.77
Source: Calculated from the database constructed (version updated on 3 October 2013).

Chapter 6
165
As the next consideration, what could be the similarity of overall coverage
patterns amongst the ASEAN+1 FTAs away from the U-Commitment? To get a better idea,
we combine ‘N-Commitment’ and ‘L-Commitment’: where the summation of the N-
Commitment and L-commitment values is higher than 0.5 (in other words, where the U-
commitment value takes a value lower than 0.5), the N-Commitment and L-Commitment
figures are highlighted in bold. As shown in the table, AFAS–8 is the most highly
committed, while in the case of AANZFTA, the commitment is a bit lower, but similar to
AFAS–8. ACFTA–2 and AKFTA are rather similarly committed9 at a lower level than under
AFAS–8 and AANZFTA. Indeed, there is a wedge between the groups of ‘AFAS–8 and
AANZFTA’ and ‘ACFTA–2 and AKFTA’, which should be addressed in future policy
negotiations on convergence.
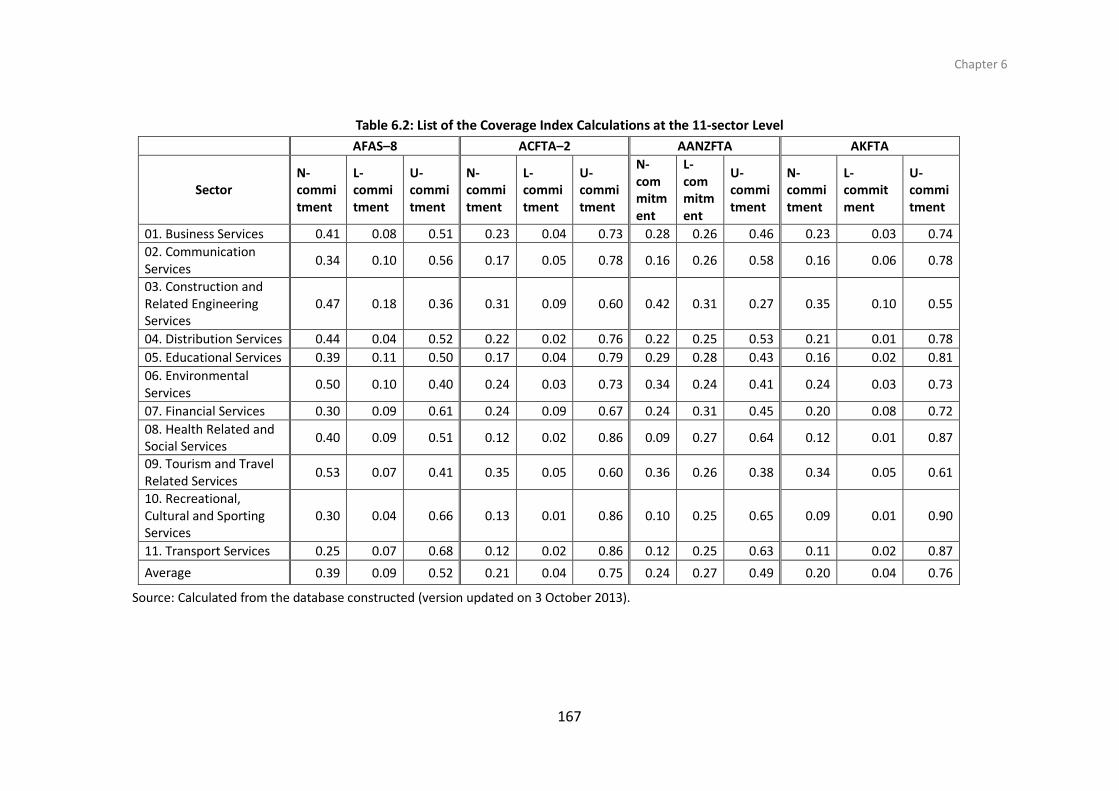
Table 6.2 lists the Coverage Index calculations at the most aggregated 11-sector
level: again, we use simple average for the values under the same 11-sector classification.
Figures 1–3 graphically compare the levels of the Coverage Index by each of the
commitment patterns (N, L, or U). This level of aggregation shows the following: (In the
spirit of increasing the number of sectors with ‘N-commitment’ away from ‘U-
commitment’ and through ‘L-commitment’, the focus is placed on ‘N-commitment’
only.)
As for AFAS–8, it has an average Coverage Index value of 0.39, with ‘09. Tourism
and Travel Related Services’ taking the largest Coverage Index value (0.53) for N-
commitment, whereas ‘11. Transport Services’ has the smallest Coverage Index value
(0.25). An important note is that the sector ‘11.Transport Services’ plays an important
part in ASEAN connectivity – enhanced policy efforts for greater liberalisation by those
ASEAN members who have not yet committed would be needed especially in this sector.
For ACFTA–2, it has an average Coverage Index value of 0.21, and ‘09. Tourism
and Travel Related Services’ has the largest Coverage Index value (0.35), while ‘08. Health
Related and Social Services’ and ‘11. Transport Services’ both have the lowest Coverage
9 This is probably because for some ASEAN members, China and Korea as their dialogue partners are seen to pose a common set of ‘concerns’ including the possibility of losing domestic market shares, thus a common set of commitment patterns under ACFTA and AKFTA.

East Asian Integration
166
Index value (0.12), for N-commitment.
AANZFTA has an average Coverage Index value of 0.24, with ‘03. Construction
and Related Engineering Services’ taking the highest value (0.42). The sector ‘08. Health
Related and Social Services’ has the lowest Coverage Index value (0.09). AKFTA has an
average Coverage Index value of 0.20, with ‘09. Tourism and Travel Related Services’
taking the highest sectoral value (0.34) and ‘10. Recreational, Cultural and Sporting
Services’ taking the lowest value (0.09). It should be noted that since this FTA has a
separate chapter on Mode 4, which covers almost all the subsectors, the index tends to
be overvalued.
An interesting observation is that ‘there are smaller variations in terms of
liberalisation level across sectors in AFASs10‘. This observation might suggest that AFAS–
8 is rather ‘harmonised’, which is encouraging in terms of boosting policy coordination
towards achieving an RCEP. A sectoral convergence scenario could therefore have AFAS
as the central ‘convergence point’.
10 This is a comment from Mr. Yoshifumi Fukunaga (Research Coordinator, ERIA).
Chapter 6
167
Table 6.2: List of the Coverage Index Calculations at the 11-sector Level
AFAS–8 ACFTA–2 AANZFTA AKFTA
Sector N-commitment
L-commitment
U-commitment
N-commitment
L-commitment
U-commitment
N-commitment
L-commitment
U-commitment
N-commitment
L-commitment
U-commitment
01. Business Services 0.41 0.08 0.51 0.23 0.04 0.73 0.28 0.26 0.46 0.23 0.03 0.74
02. Communication Services
0.34 0.10 0.56 0.17 0.05 0.78 0.16 0.26 0.58 0.16 0.06 0.78
03. Construction and Related Engineering Services
0.47 0.18 0.36 0.31 0.09 0.60 0.42 0.31 0.27 0.35 0.10 0.55
04. Distribution Services 0.44 0.04 0.52 0.22 0.02 0.76 0.22 0.25 0.53 0.21 0.01 0.78
05. Educational Services 0.39 0.11 0.50 0.17 0.04 0.79 0.29 0.28 0.43 0.16 0.02 0.81
06. Environmental Services
0.50 0.10 0.40 0.24 0.03 0.73 0.34 0.24 0.41 0.24 0.03 0.73
07. Financial Services 0.30 0.09 0.61 0.24 0.09 0.67 0.24 0.31 0.45 0.20 0.08 0.72
08. Health Related and Social Services
0.40 0.09 0.51 0.12 0.02 0.86 0.09 0.27 0.64 0.12 0.01 0.87
09. Tourism and Travel Related Services
0.53 0.07 0.41 0.35 0.05 0.60 0.36 0.26 0.38 0.34 0.05 0.61
10. Recreational, Cultural and Sporting Services
0.30 0.04 0.66 0.13 0.01 0.86 0.10 0.25 0.65 0.09 0.01 0.90
11. Transport Services 0.25 0.07 0.68 0.12 0.02 0.86 0.12 0.25 0.63 0.11 0.02 0.87
Average 0.39 0.09 0.52 0.21 0.04 0.75 0.24 0.27 0.49 0.20 0.04 0.76
Source: Calculated from the database constructed (version updated on 3 October 2013).

East Asian Integration
168
Figure 6.1: Comparison of N-commitment under the ASEAN+1 FTAs (11 sectors)
Source: Derived from Table 6.2.
Figure 6.2: Comparison of L-commitment under the ASEAN+1 FTAs (11 sectors)
Source: Made from Table 6.2.

Chapter 6
169
Figure 6.3: Comparison of U-commitment under the ASEAN+1 FTAs (11 sectors)
Source: Derived from Table 6.2.
A summary of the results is shown in Table 6.3. This table calculates
correlation coefficients of all pairs of ASEAN+1 FTAs, based on the database
constructed for this study (i.e. calculation is made at the most disaggregated 154-
sector level).
As shown in the table, AFAS–8 has rather strong correlations with ACFTA–2
and AKFTA, whereas its correlation with AANZFTA is not so strong. The highest level
of correlation (0.98) is observed between ACFTA–2 and AKFTA, indicating that both of
these FTAs are actually strongly correlated with each other. AANZFTA is somewhat
exceptional in the sense that it has a separate chapter on the movement of people
(corresponding to Mode 4 of service supply). When mode 4 is excluded from the
calculation of coefficients involving AANZFTA, the FTA (AANZFTA) is also rather
strongly correlated with the other three FTAs.
Overall, all the correlation coefficients are positive, indicating that industry-
level commitment patterns are more or less shared amongst all the ASEAN+1 FTAs.

East Asian Integration
170
Table 6.3: Correlation Coefficient of all Pairs of ASEAN+1 FTAs
AFAS–8 ACFTA–2 AANZFTA(1–4) AANZFTA(1–
3) AKFTA
AFAS–8 -
ACFTA–2 0.76 -
AANZFTA(1–4) 0.32 0.40 -
AANZFTA(1–3) 0.70 0.95 - -
AKFTA 0.76 0.98 0.41 0.96 - Notes: AANZFTA (1–4) means that all the four modes have been considered in the calculation for this
FTA; AANZFTA (1–3) means that modes 1–3 only have been considered; this is because AANZFTA is unique in that it has a separate chapter on mode 4, which might be a source of deflated correlation. The correlation coefficients involving AANZFTA (1–3) use data on modes 1–3 only (excluding data on mode 4).
Source: Calculated from the database constructed (version updated on 3 October 2013).
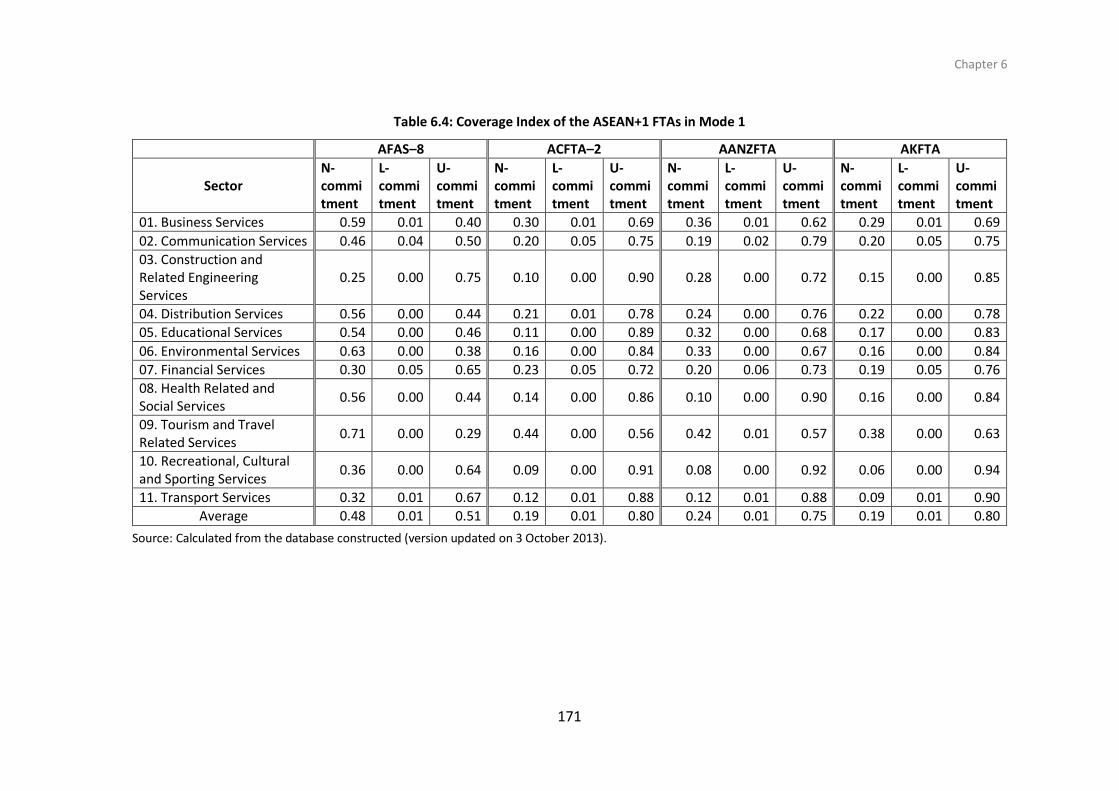
It would be useful to make an analysis of the Coverage Index by mode. For
ease of viewing, the 11-sector disaggregation results only are shown in Tables 6.4–
6.8, for Modes 1–4, respectively. In the following, the focus is on N-commitment only.
In Mode 1 (Table 4), AFAS–8 has an average Coverage Index value of 0.48, ACFTA–2
has 0.19, AANZFTA 0.24, and AKFTA 0.19. Thus, AFAS–8 has the highest average
commitment level amongst the four ASEAN+1 FTAs. In Mode 2 (Table 6.5), AFAS–8
has the highest average Index value, at 0.66, ACFTA–2 has 0.36, AANZFTA 0.40, and
AKFTA 0.36. In Mode 3 (Table 6.6), AFAS–8 has the highest Index value, at 0.39,
ACFTA–2 has an average value of 0.25, AANZFTA 0.29, and AKFTA 0.24. In Mode 4
(Table 6.7), AFAS–8 has the highest (albeit low in absolute terms) average value of
0.04, ACFTA–2 has 0.03, AANZFTA 0.02, and AKFTA 0.02. Also, AANZFTA has the
highest L-commitment value (since it has a separate service chapter in which almost
all sectors are committed).
Chapter 6
171
Table 6.4: Coverage Index of the ASEAN+1 FTAs in Mode 1
AFAS–8 ACFTA–2 AANZFTA AKFTA
Sector N-commitment
L-commitment
U-commitment
N-commitment
L-commitment
U-commitment
N-commitment
L-commitment
U-commitment
N-commitment
L-commitment
U-commitment
01. Business Services 0.59 0.01 0.40 0.30 0.01 0.69 0.36 0.01 0.62 0.29 0.01 0.69
02. Communication Services 0.46 0.04 0.50 0.20 0.05 0.75 0.19 0.02 0.79 0.20 0.05 0.75
03. Construction and Related Engineering Services
0.25 0.00 0.75 0.10 0.00 0.90 0.28 0.00 0.72 0.15 0.00 0.85
04. Distribution Services 0.56 0.00 0.44 0.21 0.01 0.78 0.24 0.00 0.76 0.22 0.00 0.78
05. Educational Services 0.54 0.00 0.46 0.11 0.00 0.89 0.32 0.00 0.68 0.17 0.00 0.83
06. Environmental Services 0.63 0.00 0.38 0.16 0.00 0.84 0.33 0.00 0.67 0.16 0.00 0.84
07. Financial Services 0.30 0.05 0.65 0.23 0.05 0.72 0.20 0.06 0.73 0.19 0.05 0.76
08. Health Related and Social Services
0.56 0.00 0.44 0.14 0.00 0.86 0.10 0.00 0.90 0.16 0.00 0.84
09. Tourism and Travel Related Services
0.71 0.00 0.29 0.44 0.00 0.56 0.42 0.01 0.57 0.38 0.00 0.63
10. Recreational, Cultural and Sporting Services
0.36 0.00 0.64 0.09 0.00 0.91 0.08 0.00 0.92 0.06 0.00 0.94
11. Transport Services 0.32 0.01 0.67 0.12 0.01 0.88 0.12 0.01 0.88 0.09 0.01 0.90
Average 0.48 0.01 0.51 0.19 0.01 0.80 0.24 0.01 0.75 0.19 0.01 0.80
Source: Calculated from the database constructed (version updated on 3 October 2013).

East Asian Integration
172
Table 6.5: Coverage Index of the ASEAN+1 FTAs in Mode 2
AFAS–8 ACFTA–2 AANZFTA AKFTA
Sector N-commitment
L-commitment
U-commitment
N-commitment
L-commitment
U-commitment
N-commitment
L-commitment
U-commitment
N-commitment
L-commitment
U-commitment
01. Business Services 0.64 0.00 0.36 0.35 0.00 0.65 0.40 0.01 0.59 0.35 0.00 0.65
02. Communication Services 0.54 0.00 0.46 0.28 0.00 0.72 0.24 0.00 0.76 0.28 0.00 0.72
03. Construction and Related Engineering Services
1.00 0.00 0.00 0.67 0.00 0.33 0.83 0.00 0.17 0.80 0.00 0.20
04. Distribution Services 0.70 0.00 0.30 0.36 0.00 0.64 0.32 0.00 0.68 0.33 0.00 0.67
05. Educational Services 0.71 0.00 0.29 0.36 0.00 0.64 0.54 0.00 0.46 0.35 0.00 0.65
06. Environmental Services 0.80 0.00 0.20 0.41 0.00 0.59 0.52 0.00 0.48 0.39 0.00 0.61
07. Financial Services 0.52 0.04 0.44 0.42 0.04 0.54 0.41 0.04 0.55 0.34 0.04 0.62
08. Health Related and Social Services
0.69 0.00 0.31 0.20 0.00 0.80 0.17 0.00 0.83 0.20 0.00 0.80
09. Tourism and Travel Related Services
0.78 0.00 0.23 0.50 0.00 0.50 0.56 0.00 0.44 0.55 0.00 0.45
10. Recreational, Cultural and Sporting Services
0.52 0.00 0.48 0.24 0.00 0.76 0.17 0.00 0.83 0.16 0.00 0.84
11. Transport Services 0.41 0.00 0.59 0.20 0.00 0.80 0.19 0.00 0.81 0.18 0.00 0.81
Average 0.66 0.00 0.33 0.36 0.00 0.63 0.40 0.00 0.60 0.36 0.00 0.64
Source: Calculated from the database constructed (version updated on 3 October 2013).

Chapter 6
173
Table 6.6: Coverage Index of the ASEAN+1 FTAs in Mode 3
AFAS–8 ACFTA–2 AANZFTA AKFTA
Sector N-commitment
L-commitment
U-commitment
N-commitment
L-commitment
U-commitment
N-commitment
L-commitment
U-commitment
N-commitment
L-commitment
U-commitment
01. Business Services 0.38 0.18 0.45 0.26 0.10 0.65 0.32 0.07 0.60 0.27 0.06 0.66
02. Communication Services 0.30 0.19 0.51 0.17 0.10 0.72 0.18 0.06 0.77 0.16 0.11 0.73
03. Construction and Related Engineering Services
0.60 0.30 0.10 0.44 0.24 0.33 0.53 0.26 0.21 0.43 0.28 0.29
04. Distribution Services 0.47 0.14 0.39 0.31 0.05 0.64 0.32 0.00 0.68 0.31 0.03 0.66
05. Educational Services 0.30 0.27 0.43 0.19 0.09 0.72 0.29 0.12 0.59 0.13 0.08 0.79
06. Environmental Services 0.53 0.25 0.23 0.35 0.06 0.59 0.48 0.01 0.51 0.38 0.06 0.57
07. Financial Services 0.33 0.17 0.50 0.28 0.19 0.54 0.29 0.20 0.52 0.25 0.20 0.56
08. Health Related and Social Services
0.34 0.28 0.39 0.14 0.07 0.80 0.10 0.06 0.83 0.10 0.06 0.84
09. Tourism and Travel Related Services
0.49 0.20 0.31 0.36 0.14 0.50 0.42 0.09 0.49 0.36 0.13 0.51
10. Recreational, Cultural and Sporting Services
0.31 0.09 0.60 0.17 0.04 0.79 0.13 0.03 0.85 0.12 0.03 0.85
11. Transport Services 0.23 0.16 0.61 0.13 0.05 0.82 0.14 0.03 0.83 0.12 0.03 0.84
Average 0.39 0.20 0.41 0.25 0.10 0.64 0.29 0.08 0.63 0.24 0.10 0.66
Source: Calculated from the database constructed (version updated on 3 October 2013).

East Asian Integration
174
Table 6.7: Coverage Index of the ASEAN+1 FTAs in Mode 4
AFAS–8 ACFTA–2 AANZFTA AKFTA
Sector N-commitment
L-commitment
U-commitment
N-commitment
L-commitment
U-commitment
N-commitment
L-commitment
U-commitment
N-commitment
L-commitment
U-commitment
01. Business Services 0.03 0.14 0.84 0.02 0.04 0.94 0.02 0.95 0.03 0.01 0.04 0.95
02. Communication Services 0.04 0.17 0.79 0.02 0.06 0.92 0.02 0.98 0.00 0.00 0.08 0.92
03. Construction and Related Engineering Services
0.03 0.40 0.57 0.03 0.12 0.85 0.03 0.98 0.00 0.03 0.14 0.84
04. Distribution Services 0.01 0.03 0.96 0.01 0.01 0.98 0.00 1.00 0.00 0.00 0.01 0.99
05. Educational Services 0.00 0.18 0.82 0.00 0.08 0.92 0.00 1.00 0.00 0.00 0.01 0.99
06. Environmental Services 0.05 0.15 0.80 0.05 0.05 0.91 0.04 0.96 0.00 0.05 0.05 0.91
07. Financial Services 0.05 0.09 0.86 0.04 0.06 0.90 0.05 0.95 0.00 0.01 0.05 0.94
08. Health Related and Social Services
0.00 0.09 0.91 0.00 0.00 1.00 0.00 1.00 0.00 0.00 0.00 1.00
09. Tourism and Travel Related Services
0.13 0.08 0.80 0.09 0.06 0.85 0.06 0.94 0.00 0.09 0.06 0.85
10. Recreational, Cultural and Sporting Services
0.02 0.07 0.91 0.01 0.01 0.98 0.01 0.99 0.00 0.01 0.01 0.98
11. Transport Services 0.05 0.11 0.84 0.03 0.02 0.94 0.02 0.98 0.00 0.04 0.02 0.94
Average 0.04 0.14 0.83 0.03 0.05 0.93 0.02 0.98 0.00 0.02 0.04 0.94
Source: Calculated from the database constructed (version updated on 3 October 2013).
Chapter 6
175
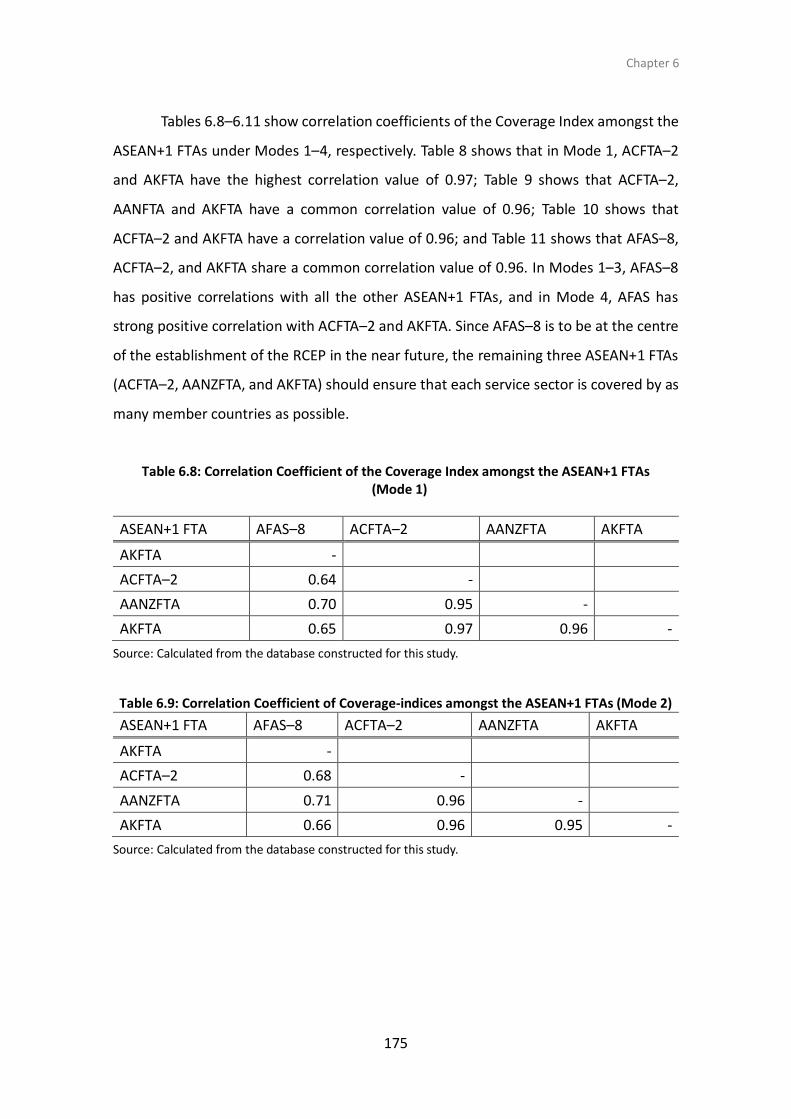
Tables 6.8–6.11 show correlation coefficients of the Coverage Index amongst the
ASEAN+1 FTAs under Modes 1–4, respectively. Table 8 shows that in Mode 1, ACFTA–2
and AKFTA have the highest correlation value of 0.97; Table 9 shows that ACFTA–2,
AANFTA and AKFTA have a common correlation value of 0.96; Table 10 shows that
ACFTA–2 and AKFTA have a correlation value of 0.96; and Table 11 shows that AFAS–8,
ACFTA–2, and AKFTA share a common correlation value of 0.96. In Modes 1–3, AFAS–8
has positive correlations with all the other ASEAN+1 FTAs, and in Mode 4, AFAS has
strong positive correlation with ACFTA–2 and AKFTA. Since AFAS–8 is to be at the centre
of the establishment of the RCEP in the near future, the remaining three ASEAN+1 FTAs
(ACFTA–2, AANZFTA, and AKFTA) should ensure that each service sector is covered by as
many member countries as possible.
Table 6.8: Correlation Coefficient of the Coverage Index amongst the ASEAN+1 FTAs (Mode 1)
ASEAN+1 FTA AFAS–8 ACFTA–2 AANZFTA AKFTA
AKFTA -
ACFTA–2 0.64 -
AANZFTA 0.70 0.95 -
AKFTA 0.65 0.97 0.96 -
Source: Calculated from the database constructed for this study.
Table 6.9: Correlation Coefficient of Coverage-indices amongst the ASEAN+1 FTAs (Mode 2)
ASEAN+1 FTA AFAS–8 ACFTA–2 AANZFTA AKFTA
AKFTA -
ACFTA–2 0.68 -
AANZFTA 0.71 0.96 -
AKFTA 0.66 0.96 0.95 -
Source: Calculated from the database constructed for this study.

East Asian Integration
176
Table 6.10: Correlation Coefficient of Coverage-indices amongst the ASEAN+1 FTAs (Mode 3)
ASEAN+1 FTA AFAS–8 ACFTA–2 AANZFTA AKFTA
AKFTA -
ACFTA–2 0.67 -
AANZFTA 0.70 0.94 -
AKFTA 0.66 0.96 0.95 -
Source: Calculated from The database constructed for this study.
Table 6.11: Correlation Coefficient of Coverage-indices amongst the ASEAN+1 FTAs (Mode 4)
ASEAN+1 FTA AFAS–8 ACFTA–2 AANZFTA AKFTA
AKFTA -
ACFTA–2 0.96 -
AANZFTA -0.35 -0.46 -
AKFTA 0.96 1.00 -0.46 -
Source: Calculated from The database constructed for this study.
3. An Extension Analysis: Focus on the ASEAN Countries Only
In this section we conduct the same analysis as in the previous section, but with
an exclusive focus on the ASEAN countries. Thus, Table 6.12 Lists the Coverage Index
calculations at the 55-sector level, focusing only on the ASEAN countries, to the exclusion
of China under ACFTA, Australia, and New Zealand under AANZFTA, and Korea under
AKFTA. Likewise, Table 13 lists the Coverage Index calculations at the 11- sector level,
focusing only on the ASEAN countries. As shown in Table 13, AFAS–8 has the highest
Coverage Index for N (0.39), followed by AANZFTA (0.23), ACFTA–2 (0.22), and AKFTA
(0.20). As for individual sectors, ‘09. Tourism and Travel Related Services’ has the highest
N-commitment (0.53), signifying that more than half of the ASEAN members have
confirmed full liberalisation. On the other hand, both ‘10. Recreational, Cultural and
Sporting Services’ and ‘11. Transport Services’ under AANZFTA and AKFTA have the
lowest N-commitment value (0.09). Figures 6.4, 6.5, and 6.6 graphically show the
commitments under each of the four FTAs.
The N-Commitment and L-Commitment figures combined are highlighted in bold.
As discussed for Table 6.1 (which includes non-ASEAN members’ commitments), there is

Chapter 6
177
a similarity between AFAS–8 and AANZFTA; also, the commitment patterns are similar
between ACFTA–2 and AKFTA. As in the case of Table 1, the pair of ‘AFAS–8 and AANZFTA’
is more highly committed than the pair of ‘ACFTA–2 and AKFTA’. The average figures
imply that, overall, the ASEAN countries are most widely committed under AFAS–8. Also,
the ASEAN priority integrated sectors (defined for this chapter as those shaded grey in
the table) are rather well covered by the ASEAN members, judging from the overall
correspondence of the bold figures and the shaded sectors (with the exception of
transport-related sectors towards the bottom of the table).

East Asian Integration
178
Table 6.12: List of the Coverage Index Calculations at the 55-sector Level (focus on the ASEAN countries only)
AFAS–8 ACFTA–2 AANZFTA AKFTA
Sector N-commitment
L-commitment
U-commitment
N-commitment
L-commitment
U-commitment
N-commitment
L-commitment
U-commitment
N-commitment
L-commitment
U-commitment
01.A. Professional Services 0.41 0.13 0.45 0.26 0.06 0.68 0.29 0.26 0.45 0.25 0.09 0.66
01.B. Computer and Related Services
0.71 0.15 0.15 0.44 0.07 0.49 0.56 0.29 0.16 0.40 0.05 0.56
01.C. Research and Development Services
0.43 0.07 0.50 0.17 0.03 0.80 0.14 0.26 0.60 0.16 0.02 0.82
01.D. Real Estate Services 0.14 0.00 0.86 0.08 0.00 0.93 0.04 0.25 0.71 0.04 0.00 0.96
01.E. Rental/Leasing Services without Operators
0.34 0.09 0.58 0.17 0.02 0.81 0.15 0.26 0.59 0.14 0.01 0.85
01.F. Other Business Services 0.41 0.06 0.54 0.21 0.02 0.77 0.19 0.26 0.55 0.20 0.02 0.78
02.A. Postal Services 0.11 0.11 0.78 0.04 0.06 0.90 0.00 0.25 0.75 0.04 0.06 0.90
02.B. Courier Services 0.61 0.11 0.28 0.29 0.01 0.70 0.29 0.24 0.48 0.24 0.06 0.70
02.C. Telecommunication Services 0.61 0.20 0.18 0.35 0.16 0.49 0.38 0.32 0.30 0.38 0.13 0.49
02.D. Audiovisual Services 0.28 0.06 0.66 0.13 0.02 0.85 0.10 0.26 0.64 0.11 0.02 0.86
02.E. Other 0.06 0.01 0.93 0.00 0.00 1.00 0.00 0.25 0.75 0.00 0.00 1.00
03.A. General Construction Work for Building
0.48 0.18 0.35 0.30 0.08 0.63 0.45 0.31 0.24 0.35 0.10 0.55
03.B. General Construction work for Civil Engineering
0.48 0.18 0.35 0.36 0.15 0.49 0.40 0.34 0.26 0.46 0.16 0.38
03.C. Installation and Assembly Work
0.48 0.18 0.35 0.34 0.10 0.56 0.38 0.31 0.31 0.38 0.10 0.53
03.D. Building Completion and Finishing Work
0.46 0.18 0.36 0.26 0.01 0.73 0.31 0.33 0.36 0.29 0.09 0.63
03.E. Other 0.46 0.18 0.36 0.25 0.09 0.66 0.35 0.31 0.34 0.29 0.09 0.63

Chapter 6
179
04.A. Commission Agents' Services
0.59 0.08 0.34 0.31 0.04 0.65 0.25 0.25 0.50 0.25 0.00 0.75
04.B. Wholesale Trade Services 0.48 0.06 0.46 0.20 0.00 0.80 0.20 0.25 0.55 0.24 0.00 0.76
04.C. Retailing Services 0.38 0.05 0.58 0.18 0.00 0.83 0.13 0.25 0.63 0.16 0.03 0.81
04.D. Franchising 0.49 0.03 0.49 0.23 0.00 0.78 0.15 0.25 0.60 0.23 0.00 0.78
04.E. Other 0.25 0.00 0.75 0.08 0.00 0.93 0.08 0.25 0.68 0.08 0.00 0.93
05.A. Primary Education Services 0.26 0.10 0.64 0.05 0.01 0.94 0.09 0.26 0.65 0.05 0.00 0.95
05.B. Secondary Education Services
0.34 0.15 0.51 0.08 0.01 0.91 0.28 0.28 0.45 0.18 0.04 0.79
05.C. Higher Education Services 0.36 0.10 0.54 0.20 0.04 0.76 0.28 0.30 0.43 0.20 0.04 0.76
05.D. Adult Education 0.54 0.10 0.36 0.24 0.01 0.75 0.29 0.29 0.43 0.28 0.01 0.71
05.E. Other Education Services 0.44 0.11 0.45 0.23 0.04 0.74 0.30 0.30 0.40 0.15 0.01 0.84
06.A. Sewage Services 0.50 0.14 0.36 0.23 0.03 0.75 0.29 0.25 0.46 0.23 0.04 0.74
06.B. Refuse Disposal Services 0.51 0.11 0.38 0.21 0.01 0.78 0.28 0.24 0.49 0.21 0.03 0.76
06.C. Sanitation and Similar Services
0.44 0.06 0.50 0.19 0.01 0.80 0.25 0.24 0.51 0.19 0.03 0.79
06.D. Other 0.55 0.09 0.36 0.24 0.01 0.75 0.24 0.24 0.53 0.24 0.03 0.74
07.A. All Insurance and Insurance-related Services
0.47 0.12 0.41 0.38 0.14 0.48 0.33 0.37 0.30 0.33 0.15 0.53
07.B. Banking and Other Financial Services
0.38 0.10 0.52 0.32 0.10 0.57 0.32 0.32 0.36 0.25 0.10 0.66
07.C. Other 0.05 0.05 0.90 0.03 0.00 0.98 0.04 0.26 0.70 0.04 0.01 0.95
08.A. Hospital Services 0.56 0.16 0.28 0.19 0.04 0.78 0.24 0.31 0.45 0.36 0.06 0.58
08.B. Other Human Health Services
0.41 0.11 0.48 0.16 0.04 0.80 0.11 0.26 0.63 0.10 0.00 0.90
08.C. Social Services 0.36 0.05 0.59 0.05 0.00 0.95 0.05 0.25 0.70 0.05 0.00 0.95

East Asian Integration
180
08.D. Other 0.25 0.04 0.71 0.13 0.00 0.88 0.00 0.25 0.75 0.00 0.00 1.00
09.A. Hotels and Restaurants 0.70 0.10 0.20 0.54 0.09 0.38 0.53 0.28 0.20 0.50 0.11 0.39
09.B. Travel Agencies and Tour Operators services
0.63 0.09 0.29 0.56 0.06 0.38 0.60 0.28 0.13 0.54 0.06 0.40
09.C. Tourist Guides Services 0.30 0.00 0.70 0.21 0.01 0.78 0.15 0.25 0.60 0.15 0.00 0.85
09.D. Other 0.48 0.09 0.44 0.10 0.03 0.88 0.06 0.24 0.70 0.13 0.03 0.85
10.A. Entertainment Services 0.54 0.05 0.41 0.25 0.01 0.74 0.21 0.26 0.53 0.23 0.01 0.76
10.B. News Agency Services 0.18 0.00 0.83 0.00 0.00 1.00 0.00 0.25 0.75 0.00 0.00 1.00
10.C. Libraries, archives, museums and other cultural services
0.29 0.04 0.68 0.08 0.00 0.93 0.08 0.25 0.68 0.08 0.00 0.93
10.D. Sporting and Other Recreational Services
0.35 0.04 0.61 0.19 0.04 0.78 0.14 0.26 0.60 0.15 0.04 0.81
10.E. Other 0.16 0.08 0.76 0.05 0.00 0.95 0.00 0.25 0.75 0.00 0.00 1.00
11.A. Maritime Transport Services 0.55 0.16 0.29 0.23 0.04 0.73 0.21 0.27 0.52 0.22 0.05 0.73
11.B. Internal Waterways Transport
0.26 0.08 0.66 0.04 0.01 0.96 0.01 0.25 0.73 0.01 0.00 0.99
11.C. Air Transport Services 0.13 0.01 0.87 0.17 0.03 0.81 0.09 0.26 0.66 0.14 0.02 0.84
11.D. Space Transport 0.06 0.01 0.93 0.00 0.00 1.00 0.00 0.25 0.75 0.00 0.00 1.00
11.E. Rail Transport Services 0.32 0.12 0.56 0.06 0.00 0.94 0.07 0.24 0.69 0.07 0.00 0.93
11.F. Road Transport Services 0.42 0.07 0.51 0.32 0.01 0.67 0.17 0.24 0.59 0.17 0.01 0.82
11.G. Pipeline Transport 0.14 0.09 0.78 0.05 0.03 0.93 0.05 0.28 0.68 0.05 0.03 0.93
11.H. Services Auxiliary to All Modes of Transport
0.39 0.09 0.52 0.17 0.04 0.80 0.17 0.25 0.58 0.13 0.04 0.83
11.I. Other Transport Services 0.00 0.00 1.00 0.00 0.00 1.00 0.00 0.25 0.75 0.00 0.00 1.00
Average 0.38 0.09 0.53 0.26 0.06 0.68 0.29 0.26 0.45 0.25 0.09 0.66
Source: Calculated from the database constructed (version updated on 3 October 2013).

Chapter 6
181
Table 6.13: List of the Coverage Index calculations at the 11 sector level (focus on the ASEAN countries only)
AFAS–8 ACFTA–2 AANZFTA AKFTA
Sector N-commitment
L-commitment
U-commitment
N-commitment
L-commitment
U-commitment
N-commitment
L-commitment
U-commitment
N-commitment
L-commitment
U-commitment
01. Business Services 0.41 0.08 0.51 0.22 0.03 0.75 0.23 0.26 0.51 0.20 0.03 0.77
02. Communication Services 0.34 0.10 0.56 0.16 0.05 0.79 0.15 0.26 0.58 0.15 0.06 0.79
03. Construction and Related Engineering Services
0.47 0.18 0.36 0.30 0.09 0.61 0.38 0.32 0.30 0.35 0.11 0.54
04. Distribution Services 0.44 0.04 0.52 0.20 0.01 0.80 0.16 0.25 0.59 0.19 0.01 0.81
05. Educational Services 0.39 0.11 0.50 0.16 0.02 0.82 0.25 0.29 0.47 0.17 0.02 0.81
06. Environmental Services 0.50 0.10 0.40 0.22 0.02 0.77 0.26 0.24 0.50 0.22 0.03 0.76
07. Financial Services 0.30 0.09 0.61 0.24 0.08 0.68 0.23 0.32 0.45 0.20 0.09 0.71
08. Health Related and Social Services
0.40 0.09 0.51 0.13 0.02 0.85 0.10 0.27 0.63 0.13 0.02 0.86
09. Tourism and Travel Related Services
0.53 0.07 0.41 0.35 0.05 0.60 0.33 0.26 0.41 0.33 0.05 0.62
10. Recreational, Cultural and Sporting Services
0.30 0.04 0.66 0.11 0.01 0.88 0.09 0.26 0.66 0.09 0.01 0.90
11. Transport Services 0.25 0.07 0.68 0.12 0.02 0.87 0.09 0.25 0.66 0.09 0.02 0.90
Average 0.39 0.09 0.52 0.22 0.03 0.75 0.23 0.26 0.51 0.20 0.03 0.77
Source: Calculated from the database constructed (version updated on 3 October 2013).

East Asian Integration
182
And Table 6.12 lists a more detailed breakdown of sectors: ‘01.B. Computer and Related
Services’ under AFAS–8 has the highest N-commitment index value (0.71), whereas ‘02.A.
Postal Services’ and ‘10.B. News Agency Services’ both have low N-commitment values
under all of the four FTAs.
Figure 6.4: Comparison of N-commitment under the ASEAN+1 FTAs (11 sectors, focus on the ASEAN countries only)
Source: Derived from Table 6.13.
Figure 6.5. Comparison of L-commitment under the ASEAN+1 FTAs (11 sectors, focus on the ASEAN countries only)
Source: Derived from Table 6.13.

Chapter 6
183
Figure 6.6: Comparison of U-commitment under the ASEAN+1 FTAs (11 sectors, focus on the ASEAN countries only)
Source: Derived from Table 13.
Table 6.14 compares the four FTAs in terms of correlation coefficients, and Tables
15–18 show the Coverage Index by mode. As shown in Table 6.14, AANZFTA (1–3), i.e.
Modes 1–3 only being considered, are rather closely correlated with both ACFTA–2 and
AKFTA, whereas AANZFTA (1–4), i.e. Modes 1–4, all being considered, are not so closely
correlated mainly because AANZFTA has a separate chapter on the movement of natural
persons.
Table 6.14: Correlation Coefficient Between all the Pairs of the ASEAN+1 FTAs
AFAS–8 ACFTA–2 AANZFTA(1–4) AANZFTA(1–3) AKFTA
AFAS–8 -
ACFTA–2 0.67 -
AANZFTA(1–4) 0.31 0.43 -
AANZFTA(1–3) 0.66 0.95 - -
AKFTA 0.73 0.98 0.45 0.97 - Notes: AANZFTA (1–4) means that all the four modes have been considered in the calculation for this
FTA; AANZFTA (1–3) means that modes 1–3 only have been considered; this is because AANZFTA is unique in that it has a separate chapter on mode 4, which might be a source of deflated correlation. The correlation coefficients involving AANZFTA (1–3) use data on modes 1–3 only (excluding data on mode 4).
Source: Calculated from the database constructed (version updated on 3 October 2013).

East Asian Integration
184
Table 6.15 (the Coverage Index in Mode 1) shows that in Mode 1, AFAS–8 has the
highest N-commitment value (0.48), whereas AFCTA–2 has the lowest N-commitment
value (0.16). Table 16 (the Coverage Index in Mode 2) shows that AFAS–8 has the highest
N-commitment value of 0.66, whereas ACFTA–2 has the lowest N-commitment value
(0.32). Table 17 (the Coverage Index in Mode 3) shows that AFAS–8 has the highest N-
commitment value (0.39) (which is lower than the highest values under Mode 1 and
Mode 2), whereas ACFTA and AKFTA both have the lowest N-commitment value (0.24).
Table 18 (the Coverage Index in Mode 4) shows that AFAS–8 has the highest (albeit by a
small margin) N-commitment value (0.04), whereas the other three FTAs have the same
N-commitment value (0.03). As it stands, all of the FTAs exhibit the lowest commitment
amongst the four Modes, indicating that Mode 4 (movement of natural persons) remains
the least open.

Chapter 6
185
Table 6.15: Coverage Index of the ASEAN+1 FTAs in Mode 1
AFAS–8 ACFTA–2 AANZFTA AKFTA
Sector N-commitment
L-commitment
U-commitment
N-commitment
L-commitment
U-commitment
N-commitment
L-commitment
U-commitment
N-commitment
L-commitment
U-commitment
01. Business Services 0.59 0.01 0.40 0.23 0.01 0.76 0.31 0.01 0.68 0.27 0.02 0.72
02. Communication Services 0.46 0.04 0.50 0.28 0.05 0.67 0.35 0.04 0.61 0.37 0.05 0.58
03. Construction and Related Engineering Services
0.25 0.00 0.75 0.02 0.00 0.98 0.24 0.00 0.76 0.16 0.00 0.84
04. Distribution Services 0.56 0.00 0.44 0.14 0.00 0.86 0.16 0.00 0.84 0.19 0.00 0.81
05. Educational Services 0.54 0.00 0.46 0.10 0.00 0.90 0.24 0.00 0.76 0.19 0.00 0.81
06. Environmental Services 0.63 0.00 0.38 0.13 0.00 0.88 0.20 0.00 0.80 0.13 0.00 0.88
07. Financial Services 0.30 0.05 0.65 0.26 0.07 0.66 0.29 0.08 0.63 0.26 0.08 0.67
08. Health Related and Social Services
0.56 0.00 0.44 0.10 0.00 0.90 0.13 0.00 0.88 0.18 0.00 0.83
09. Tourism and Travel Related Services
0.71 0.00 0.29 0.31 0.00 0.69 0.39 0.00 0.61 0.36 0.00 0.64
10. Recreational, Cultural and Sporting Services
0.36 0.00 0.64 0.06 0.00 0.94 0.06 0.00 0.94 0.07 0.00 0.93
11. Transport Services 0.32 0.01 0.67 0.08 0.01 0.91 0.10 0.01 0.90 0.11 0.01 0.89
Average 0.48 0.01 0.51 0.16 0.01 0.83 0.22 0.01 0.76 0.21 0.01 0.78
Source: Calculated from the database constructed (version updated on 3 October 2013).

East Asian Integration
186
Table 6.16: Coverage Index of the ASEAN+1 FTAs in Mode 2
AFAS–8 ACFTA–2 AANZFTA AKFTA
Sector N-commitment
L-commitment
U-commitment
N-commitment
L-commitment
U-commitment
N-commitment
L-commitment
U-commitment
N-commitment
L-commitment
U-commitment
01. Business Services 0.64 0.00 0.36 0.29 0.01 0.70 0.37 0.00 0.62 0.33 0.00 0.66
02. Communication Services 0.54 0.00 0.46 0.35 0.00 0.65 0.44 0.00 0.56 0.45 0.01 0.54
03. Construction and Related Engineering Services
1.00 0.00 0.00 0.46 0.00 0.54 0.80 0.00 0.20 0.80 0.00 0.20
04. Distribution Services 0.70 0.00 0.30 0.28 0.00 0.72 0.24 0.00 0.76 0.29 0.00 0.71
05. Educational Services 0.71 0.00 0.29 0.28 0.00 0.72 0.51 0.00 0.49 0.35 0.00 0.65
06. Environmental Services 0.80 0.00 0.20 0.35 0.00 0.65 0.43 0.00 0.58 0.35 0.00 0.65
07. Financial Services 0.52 0.04 0.44 0.51 0.04 0.45 0.54 0.04 0.42 0.47 0.05 0.48
08. Health Related and Social Services
0.69 0.00 0.31 0.15 0.00 0.85 0.18 0.00 0.83 0.23 0.00 0.78
09. Tourism and Travel Related Services
0.78 0.00 0.23 0.48 0.00 0.53 0.53 0.00 0.48 0.53 0.00 0.48
10. Recreational, Cultural and Sporting Services
0.52 0.00 0.48 0.18 0.00 0.82 0.16 0.00 0.84 0.16 0.00 0.84
11. Transport Services 0.41 0.00 0.59 0.17 0.00 0.83 0.18 0.00 0.82 0.19 0.00 0.81
Average 0.66 0.00 0.33 0.32 0.00 0.68 0.40 0.00 0.60 0.38 0.01 0.62
Source: Calculated from the database constructed (version updated on 3 October 2013).

Chapter 6
187
Table 6.17: Coverage Index of the ASEAN+1 FTAs in Mode 3
AFAS–8 ACFTA–2 AANZFTA AKFTA
Sector N-commitment
L-commitment
U-commitment
N-commitment
L-commitment
U-commitment
N-commitment
L-commitment
U-commitment
N-commitment
L-commitment
U-commitment
01. Business Services 0.38 0.18 0.45 0.25 0.06 0.69 0.26 0.09 0.64 0.25 0.07 0.68
02. Communication Services 0.30 0.19 0.51 0.21 0.14 0.65 0.28 0.16 0.55 0.28 0.18 0.55
03. Construction and Related Engineering Services
0.60 0.30 0.10 0.33 0.13 0.54 0.44 0.31 0.25 0.42 0.28 0.30
04. Distribution Services 0.47 0.14 0.39 0.28 0.00 0.72 0.24 0.00 0.76 0.28 0.01 0.71
05. Educational Services 0.30 0.27 0.43 0.19 0.04 0.77 0.23 0.14 0.63 0.14 0.07 0.79
06. Environmental Services 0.53 0.25 0.23 0.34 0.01 0.65 0.38 0.01 0.61 0.34 0.06 0.60
07. Financial Services 0.33 0.17 0.50 0.30 0.22 0.48 0.32 0.25 0.43 0.27 0.22 0.51
08. Health Related and Social Services
0.34 0.28 0.39 0.10 0.05 0.85 0.10 0.08 0.83 0.11 0.06 0.83
09. Tourism and Travel Related Services
0.49 0.20 0.31 0.36 0.10 0.54 0.35 0.11 0.54 0.33 0.14 0.54
10. Recreational, Cultural and Sporting Services
0.31 0.09 0.60 0.14 0.03 0.83 0.11 0.03 0.86 0.12 0.03 0.85
11. Transport Services 0.23 0.16 0.61 0.11 0.03 0.86 0.12 0.04 0.84 0.11 0.04 0.85
Average 0.39 0.20 0.41 0.24 0.07 0.69 0.26 0.11 0.63 0.24 0.11 0.65
Source: Calculated from the database constructed (version updated on 3 October 2013).

East Asian Integration
188
Table 6.18: Coverage Index of the ASEAN+1 FTAs in Mode 4
AFAS–8 ACFTA–2 AANZFTA AKFTA
Sector N-commitment
L-commitment
U-commitment
N-commitment
L-commitment
U-commitment
N-commitment
L-commitment
U-commitment
N-commitment
L-commitment
U-commitment
01. Business Services 0.03 0.14 0.84 0.02 0.03 0.95 0.02 0.94 0.04 0.02 0.06 0.92
02. Communication Services 0.04 0.17 0.79 0.01 0.08 0.91 0.01 0.99 0.00 0.01 0.13 0.86
03. Construction and Related Engineering Services
0.03 0.40 0.57 0.03 0.11 0.86 0.03 0.97 0.00 0.03 0.15 0.82
04. Distribution Services 0.01 0.03 0.96 0.00 0.00 1.00 0.00 1.00 0.00 0.00 0.01 0.99
05. Educational Services 0.00 0.18 0.82 0.00 0.03 0.97 0.00 1.00 0.00 0.00 0.01 0.99
06. Environmental Services 0.05 0.15 0.80 0.05 0.05 0.90 0.05 0.95 0.00 0.05 0.05 0.90
07. Financial Services 0.05 0.09 0.86 0.06 0.07 0.88 0.06 0.94 0.00 0.01 0.07 0.91
08. Health Related and Social Services
0.00 0.09 0.91 0.00 0.00 1.00 0.00 1.00 0.00 0.00 0.00 1.00
09. Tourism and Travel Related Services
0.13 0.08 0.80 0.10 0.05 0.85 0.08 0.93 0.00 0.10 0.06 0.84
10. Recreational, Cultural and Sporting Services
0.02 0.07 0.91 0.01 0.01 0.98 0.01 0.99 0.00 0.01 0.01 0.98
11. Transport Services 0.05 0.11 0.84 0.03 0.03 0.94 0.03 0.97 0.00 0.06 0.03 0.91
Average 0.04 0.14 0.83 0.03 0.04 0.93 0.03 0.97 0.00 0.03 0.05 0.92
Source: Calculated from the database constructed (version updated on 3 October 2013).

Chapter 6
189
Tables 6.19–6.22 list correlation coefficients of the Coverage index amongst the
four FTAs by mode. As shown, AFAS–8 is somewhat distinct from the other three FTAs
in all the Modes. A special mention should be made of the fact that in Mode 4, AANZFTA
is distinct from the other three FTAs (negative correlation coefficients are observed
between AANZFTA and any one of the three other FTAs); this is due to the fact that
AANZFTA alone has a separate chapter on the movement of natural persons.
Table 6.19: Correlation Coefficient of the Coverage Index amongst the ASEAN+1 FTAs
(Mode 1, ASEAN countries only)
ASEAN+1 FTA AFAS–8 ACFTA–2 AANZFTA AKFTA
AKFTA -
ACFTA–2 0.55 -
AANZFTA 0.66 0.97 -
AKFTA 0.62 0.98 0.98 -
Source: Calculated from the database constructed for this study.
Table 6.20: Correlation Coefficient of Coverage-indices amongst the ASEAN+1 FTAs (Mode 2, ASEAN countries only)
ASEAN+1 FTA AFAS–8 ACFTA–2 AANZFTA AKFTA
AKFTA -
ACFTA–2 0.52 -
AANZFTA 0.66 0.94 -
AKFTA 0.63 0.96 0.97 -
Source: Calculated from the database constructed for this study.
Table 6.21: Correlation Coefficient of Coverage-indices amongst the ASEAN+1 FTAs
(Mode 3, ASEAN countries only)
ASEAN+1 FTA AFAS–8 ACFTA–2 AANZFTA AKFTA
AKFTA -
ACFTA–2 0.58 -
AANZFTA 0.67 0.95 -
AKFTA 0.63 0.97 0.97 -
Source: Calculated from The database constructed for this study.

East Asian Integration
190
Table 6.22: Correlation Coefficient of Coverage-indices amongst the ASEAN+1 FTAs (Mode 4, ASEAN countries only)
ASEAN+1 FTA AFAS–8 ACFTA–2 AANZFTA AKFTA
AKFTA -
ACFTA–2 0.95 -
AANZFTA -0.35 -0.48 -
AKFTA 0.96 0.99 -0.46 -
Source: Calculated from The database constructed for this study.
Just to provide a rough estimate, the GATS-based Commitment Index was
calculated by incorporating the nine ASEAN countries with GATS commitment tables, i.e.
Brunei, Cambodia, Indonesia, Lao PDR, Malaysia, Myanmar, Philippines, Singapore,
Thailand, and Viet Nam. Table 23 shows the results at the 11-sector level. As the average
value of the Coverage Index for the N-commitment 0.03 indicates, the ASEAN members’
commitment under the GATS is significantly lower than their commitments under any of
the ASEAN+1 FTAs.
Table 6.23: GATS-based Coverage Index (excluding Lao PDR)
N-commitment
L-commitment
U-commitment
01. Business Services 0.03 0.18 0.79
02. Communication Services 0.07 0.21 0.71
03. Construction and Related Engineering Services
0.05 0.22 0.73
04. Distribution Services 0.00 0.12 0.88
05. Educational Services 0.00 0.11 0.89
06. Environmental Services 0.01 0.20 0.78
07. Financial Services 0.11 0.24 0.65
08. Health Related and Social Services 0.01 0.06 0.93
09. Tourism and Travel Related Services 0.05 0.28 0.67
10. Recreational, Cultural and Sporting Services
0.01 0.07 0.92
11. Transport Services 0.01 0.08 0.90
Average 0.03 0.16 0.81 Source: Calculated from The database constructed for this study.

Chapter 6
191
4. Policy Suggestions and Conclusions
This chapter addresses the issue of converging the existing ASEAN+1 FTAs. The
Coverage Index used in this chapter shows to what extent the FTA members are
committed to particular services sectors: in an ideal scenario, the Index should converge
to 1.0, and this is an important consideration since the RCEP should aim for the simplest
structure of ‘N-commitments in all the service sectors by all the partner countries’.
The ‘convergence point’ of ‘all the RCEP members committed to all the sectors’
(the above-mentioned scenario of the coverage index being 1.0 for all the service
sectors), however, would be infeasible in reality. This study revealed that while AFAS–8
is rather distinct, the other three FTAs – ACFTA, AANZFTA, and AKFTA – are very similarly
correlated (except for the fact that the Mode 4 commitment under AANZFTA is unique
due to its separate chapter on the movement of natural persons). Therefore, AFAS–8
could evolve into AFAS–9, which serves as a realistic ‘convergence point’ for all the RCEP
members.11
We also found that amongst the four ASEAN+1 FTAs studies, AFAS is the most
deeply committed agreement. This is promising in the sense that ASEAN is at the centre
of policy efforts towards streamlining the ASEAN+1 FTAs. In the services sector, World
Trade Organization (WTO)-mediated liberalisation efforts (as reported by, e.g. Gootiiz
and Mattoo, 2009) were not making progress at the time of writing.
Overall, enhancement of the coverage-widening efforts in each of the ASEAN+1
FTAs would be needed to realise the RCEP in the near future. More specifically, it is
imperative to: (1) harmonise the N-based as well as L-based commitments amongst the
ten ASEAN members under the current three ASEAN+1 FTAS, i.e. amongst ACFTA,
AANZFTA, and AKFTA; then (2) attempt to enhance the level of liberalisation (an
‘ASEAN+1 template commitment on services’, so to speak); thereby finally, (3) harmonise
the N-based and L-based commitments between the ‘ASEAN+1 template commitment
11 At the time of writing it seemed AFAS-9 may be skipped as a result of the time constraint of achieving the ASEAN Economic Community in 2015. That said, AFAS has been making progress under its unique modality of package-based gradual liberalisation. Separate calculations show that the N-commitment value (on average) has been evolving as follows: 0.22 (AFAS-5), 0.34 (AFAS-7), and 0.39 (AFAS-8); the L-commitment value (on average): 0.07 (AFAS-5), 0.08 (AFAS-7), and 0.09 (AFAS-8); the U-commitment value (on average): 0.72 (AFAS-5), 0.58 (AFAS-7), and 0.52 (AFAS-8). Clearly, the N-commitment value has been on an increasing trend, which is promising.
East Asian Integration
192
on services’ and AFAS–8, to realise a first version of an RCEP agreement on services.
While the coverage index shows rather low levels of commitment by the member
countries, a first step and more tractable policy suggestion is to continue prioritising the
priority integration sectors, i.e. ‘01.B. Computer and Related Services’, ‘02.C.
Telecommunication Services’, ‘04.B. Wholesale Trade Services’, ‘08.A. Hospital Services’,
‘09.B. Travel Agencies and Tour Operators services’, ‘09.C. Tourist Guides Services’, ‘11.A.
Maritime Transport Services’, ‘11.B. Internal Waterways Transport’, ‘11.C. Air Transport
Services’, ‘11.E. Rail Transport Services’, and ‘11.F. Road Transport Services, to achieve a
seamless ASEAN Economic Community as well as a well-connected RCEP.
Under the ASEAN–Japan Comprehensive Economic Partnership Agreement
(AJCEP), negotiations on market access are ongoing at the time of writing. As for the
ASEAN–India Free Trade Area (AIFTA), negotiations on trade in services are reportedly
progressing, but relevant information is not yet publicly available. That said, including
both India and Japan in the sequencing of service trade convergence is indispensable to
realise an RCEP. India and Japan are committed to bilateral agreements, e.g. India with
Singapore, and Japan with several ASEAN members including Indonesia, Malaysia,
Philippines, Singapore, Thailand, and Viet Nam. Commitment to these bilateral
agreements is stronger than to the ASEAN+1 FTAs considered in this study. We expect,
therefore, that both India and Japan will be committed to a future common template for
trade in services under the proposed RCEP.12
12 Since the Coverage Index is calculated assuming the existence of multiple partner countries, measuring Japan’s and India’s degrees of commitment is not feasible. In terms of the Hoekman Index, just for reference, separate calculations show that under the Japan–Indonesia Economic Partnership agreement, Japan’s average value is 0.68 and Indonesia’s is 0.14. Judging from this and also from the fact that Australia’s average Hoekman Index value is 0.52 under AANZFTA (as indicated in Ishido and Fukunaga, 2012), Japan’s commitment level is high. This suggests that Japan is likely to be actively committed to a future RCEP agreement. As for India, it has a bilateral FTA with Korea (i.e. the India–Korea FTA); under the bilateral FTA, India’s Hoekman Index value is 0.29 and that for Korea is 0.32. This suggests that India’s potential level of commitment under a future RCEP would be more or less comparable to that for Korea, which is rather actively committed.

Chapter 6
193
References:
Adlung, R. and M. Roy (2005), ‘Turning Hills into Mountains? Current Commitments under the General Agreement on Trade in Services and Prospects for Change’, Journal of World Trade, 39(6), pp.1161–1194.
Gootiiz, B. and A. Mattoo (2009), ‘Services in Doha: What's on the Table?’, Policy Research Working Paper WPS4903. (http://documents.worldbank.org/curated/en/2009/04/10455617/services-doha-whats-table) (accessed 28 July 2015).
Hoekman, B. (1995), ‘Assessing the General Agreement on Trade in Services’, World Bank Discussion Paper No. 307, Washington, DC: The World Bank.
Ishido, H. (2011), ‘Liberalization of Trade in Services under ASEAN+n: A Mapping Exercise’, ERIA Discussion Paper 2011–02, Jakarta: ERIA. (http://www.eria.org/publications/discussion_papers/liberalization-of-trade-in-services-under-aseann-a-mapping-exercise.html) (accessed 2 October 2014).
Ishido, H. and Y. Fukunaga (2012), ‘Liberalization of Trade in Services: Toward a Harmonized ASEAN++ FTA’, ERIA Policy Brief No. 2012–02, Jakarta: ERIA.

East Asian Integration
194


