
LIBS: Laser Induced Breakdown Spectroscopy
LIBS is an analytical method by which one can determine (qualitatively and quantitatively) the elemental composition of solid, liquid or gas samples.
LIBS focused laser pulses vaporize, atomize and excite the sample plasma emission collect, disperse and analyze light atomic spectral lines determine the
elemental composition
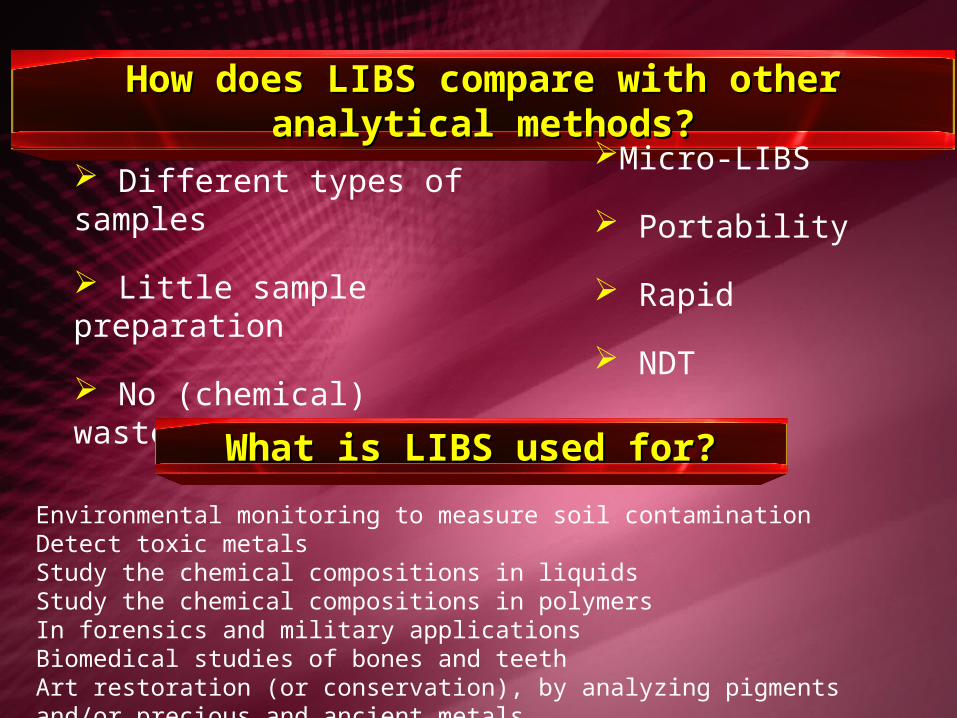
How does LIBS compare with other analytical methods?How does LIBS compare with other analytical methods?
Different types of samples
Little sample preparation
No (chemical) waste
Micro-LIBS
Portability
Rapid
NDT
What is LIBS used for?What is LIBS used for?
Environmental monitoring to measure soil contaminationDetect toxic metals Study the chemical compositions in liquidsStudy the chemical compositions in polymers In forensics and military applicationsBiomedical studies of bones and teethArt restoration (or conservation), by analyzing pigments and/or precious and ancient metals
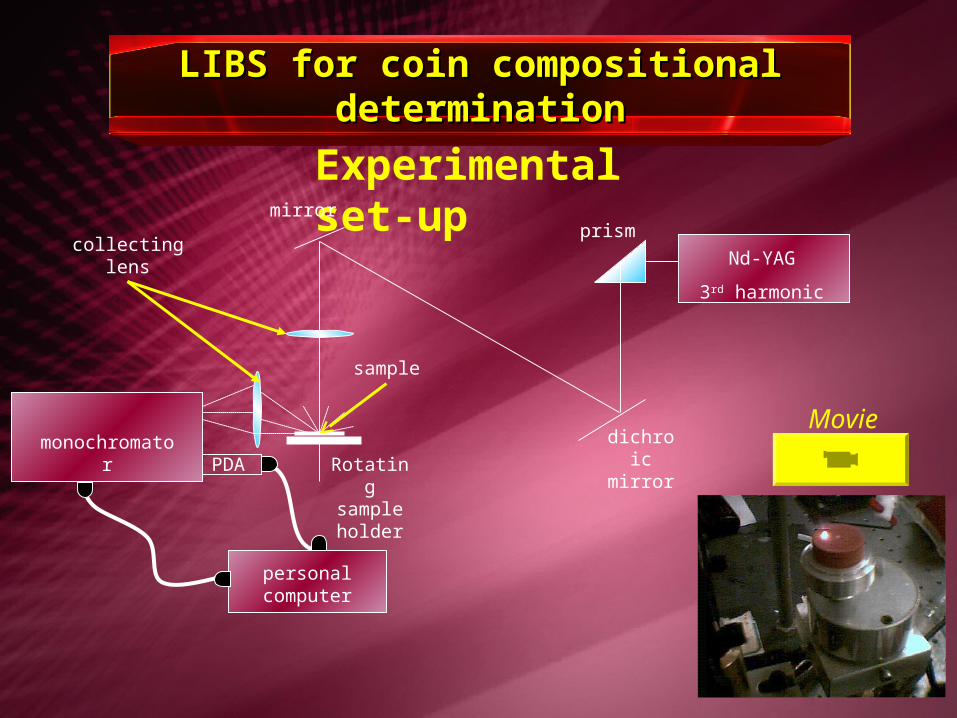
LIBS for coin compositional determinationLIBS for coin compositional determination
Experimental set-up
Nd-YAG
3rd harmonic
prism
dichroic mirror
personal computer
monochromator
mirror
collecting lens
Rotating sample holder
sample
PDA
Movie
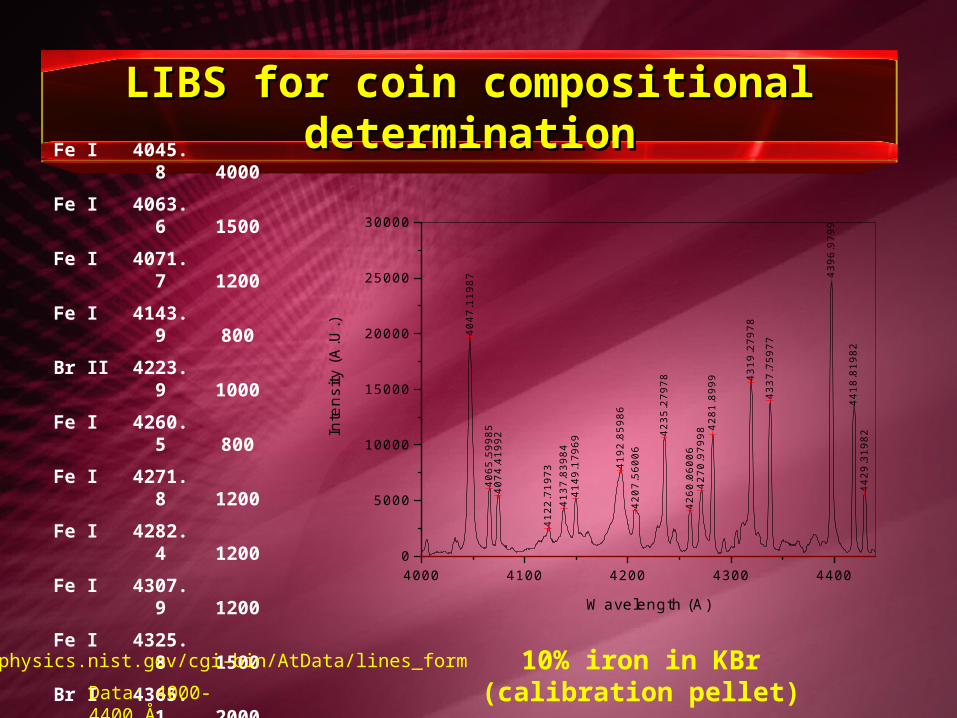
LIBS for coin compositional determinationLIBS for coin compositional determination
4000 4100 4200 4300 44000
5000
10000
15000
20000
25000
30000
4047
.119
87
4065
.599
8540
74.4
1992
4122
.719
7341
37.8
3984
4149
.179
69
4192
.859
8642
07.5
6006
4235
.279
78
4260
.060
0642
70.9
7998
4281
.899
9 4319
.279
78
4337
.759
77
4396
.979
98
4418
.819
8244
29.3
1982In
tens
ity (
A.U
.)
Wavelength (A)
10% iron in KBr (calibration pellet)
Fe I 4045.8 4000
Fe I 4063.6 1500
Fe I 4071.7 1200
Fe I 4143.9 800
Br II 4223.9 1000
Fe I 4260.5 800
Fe I 4271.8 1200
Fe I 4282.4 1200
Fe I 4307.9 1200
Fe I 4325.8 1500
Br I 4365.1 2000
Br II 4365.6 1000
Fe I 4375.9 800
Fe I 4383.5 3000
Fe I 4404.8 1200
Br I 4425.1 1500
http://physics.nist.gov/cgi-bin/AtData/lines_form
Data: 4000-4400 Å
0
5000
10000
15000
20000
25000
4000 4050 4100 4150 4200 4250
Wavelength (A)
Inte
nsity
(A
.U.)
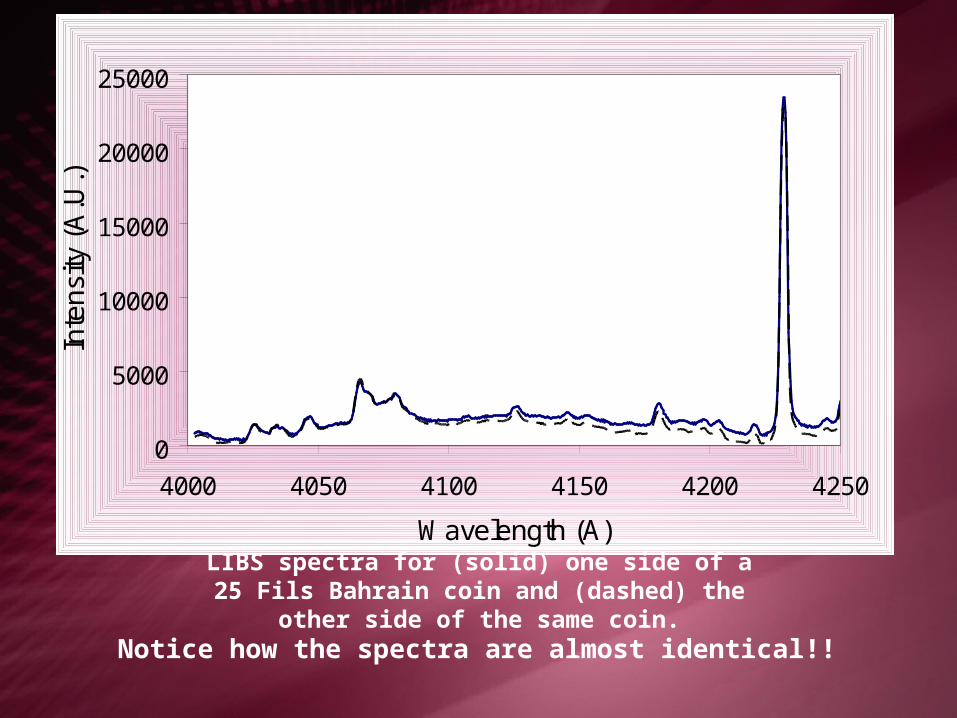
LIBS spectra for (solid) one side of a 25 Fils Bahrain coin and (dashed) the other side of the same coin.
Notice how the spectra are almost identical!!

0
5000
10000
15000
20000
25000
30000
35000
40000
4000 4100 4200 4300 4400
Wavelength (A)
Inte
ns
ity
(A
.U.)
LIBS spectra for (solid) a 10-Hallalah Saudi coin, (dashed) 20 cent Euro coin and (dotted) a game token, in the 4000-4425 Å region.
There are similarities between the three spectra; for example, all have Fe peaks (e.g., @ 4228 Å.
The game token has more iron and nickel than the other (real) currencies.
The game token does not contain copper (e.g. @ 4180, 4275 & 4377 Å). The real currencies do contain copper!!
The Euro coin does not have the 4201 & 4401Å Ni peaks.

Photographs of the four coins used in the experiments (a) before and (b) after 30 seconds of laser irradiation. The coins show no apparent destruction due to LIBS.
(a) (b)

Return to main presentation


LIBS for coin compositional determinationLIBS for coin compositional determination
Experimental Results
1. PDA Calibration
2. Apply LIBS to coins
a. Check repeatability
b. Look for coin signatures
c. Reliability (same results in different regions!!)
d. NDT
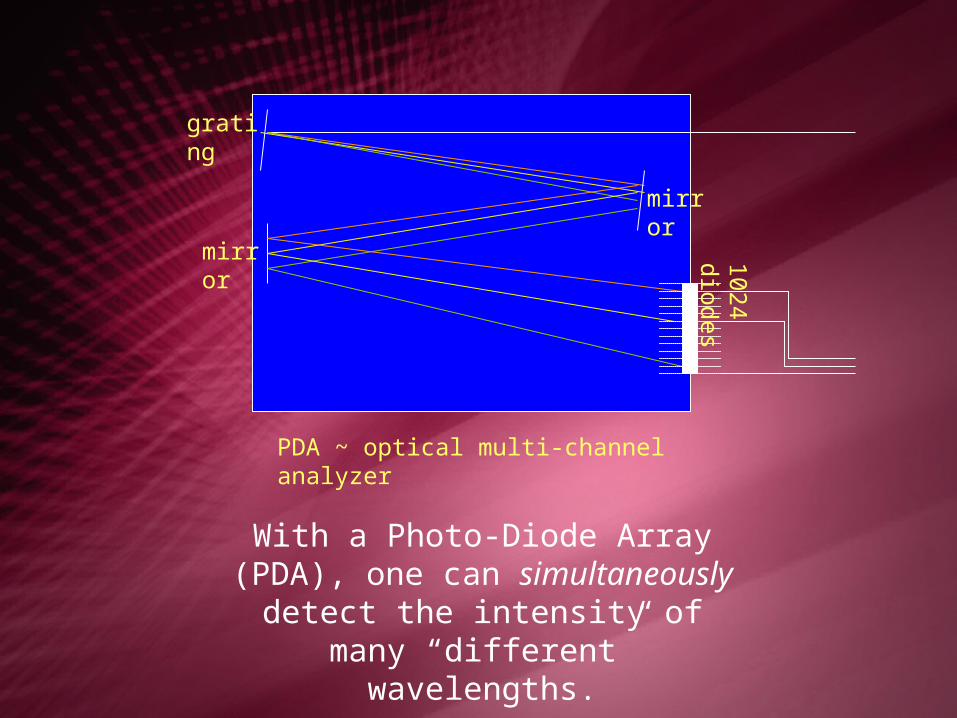
grating
mirror
mirror 1024 diodes
PDA ~ optical multi-channel analyzer
With a Photo-Diode Array (PDA), one can simultaneously detect the intensity
of many “different” wavelengths.


Is LIBS absolutely NDT?
LIBS as NDT?
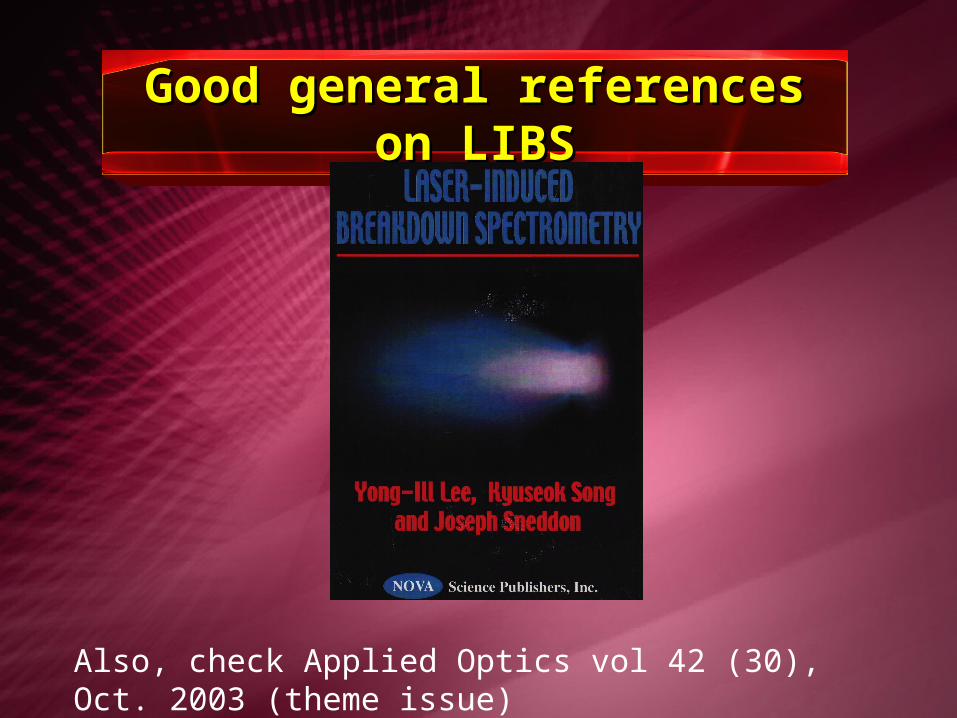
Good general references on LIBSGood general references on LIBS
Also, check Applied Optics vol 42 (30), Oct. 2003 (theme issue)

LIBS for coin compositional determinationLIBS for coin compositional determination
Conclusions LIBS spectra are repeatable.
LIBS gives consistent/ reliable results in different regions.
Coins have iron.
Game token has no copper.
20 cent Euro coin is nickel-free.
We can distinguish between “different” currencies using LIBS.
The spectra of the Saudi 10-Hallalah and the Bahrain 25 Fils are very similar.
At the macroscopic level, LIBS procedure can be NDT.
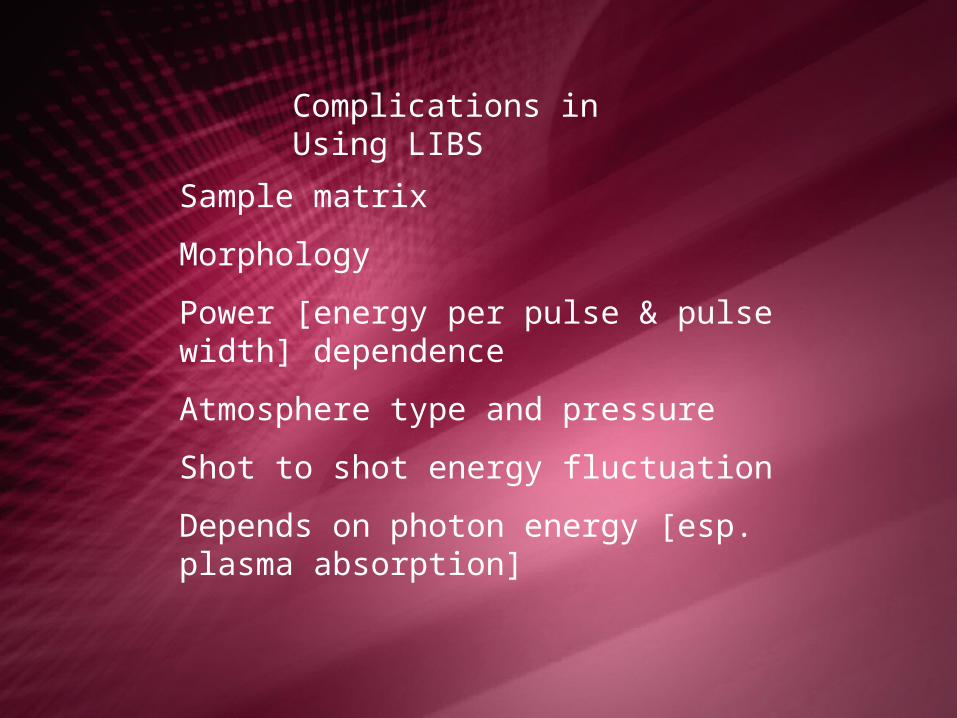
Sample matrix
Morphology
Power [energy per pulse & pulse width] dependence
Atmosphere type and pressure
Shot to shot energy fluctuation
Depends on photon energy [esp. plasma absorption]
Complications in Using LIBS


