
ORIGINAL ARTICLE
The article was published by ACG Publications www.acgpubs.org/RNP © July-August EISSN:1307-6167
DOI: http://doi.org/10.25135/rnp.40.17.10.171
Rec. Nat. Prod. 12:4 (2018) 367-379
Phytochemical and Biological Evaluation of Ultrasound-Assisted Spray
Dried Lonicera etrusca for Potential Management of Diabetes
Karim M. Raafat 1,*
and Wael Samy 2
1Department of Pharmaceutical Sciences, Faculty of Pharmacy, Beirut Arab University,
115020 Beirut, Lebanon 2Department of Industrial Pharmacy, Faculty of Pharmacy, Alexandria University,
21521 Alexandria, Egypt
(Received October 19, 2017; Revised November 26, 2017; Accepted December 10, 2017)
Abstract: Honeysuckle or Lonicera etrusca is one of the important medicinal-plants that is traditionally-used as a
potential antioxidant. The aim of this work was to make a phytochemical-evaluation of Lonicera etrusca
ultrasound-assisted spray-dried extract versus conventional-method utilizing RP-HPLC aided-method in the
potential management of diabetes. Ultrasound-assisted spray-drying (US-SD) is a new productive-technique
aiming at increasing the efficiency and extract-yield in addition to short time of exposure to elevated temperature
thus improving product stability. A bio-guided study utilizing RP-HPLC, 1H and
13C NMR methods indicated that
the most active antidiabetic-compound was isochlorogenic acid (ICA). Diabetes measurement utilizing
glucometers and HbA1c methods was applied. Serum-insulin levels and serum-catalase (CAT) was also
monitored. The US-SD preserved time by 4 folds and with higher yield (ca. 20%) than the conventional method.
The US-SD also had higher quality in US-SD honeysuckle (HS-sd) constituents than the conventional method as
supported by RP-HPLC analysis. Rotary evaporated honeysuckle (HS-r) major peaks identified were; chlorogenic
acid (38.6%), caffeic acid (5.8%), isochlorogenic acid (36.1%), luteolin-7-O-glucoside (3.3%), and quercetin
(3.0%). HS-sd major peaks identified were; chlorogenic acid (40.5%), caffeic acid (6.4%), isochlorogenic acid
(43.3%), luteolin-7-O-glucoside (3.5%), and quercetin (3.2%). HS-sd had significant (p˂0.05, n=7/group)
antidiabetic-activity more than HS-r. HS-sd had more-significant dose-dependent increase in serum-insulin, CAT-
levels and body-weights more prominent than HS-r. Compared to conventional-methods, US-SD has shown to be
time-conserving, efficient, and active-ingredients preserving method. The antidiabetic-potentials of HS-sd and
ICA were probably mediated via the significant insulin-secretagogue effect and the attenuation glucose-provoked
oxidative-stress.
Keywords: Lonicera etrusca; isochlorogenic acid; ultrasound-assisted spray drying; RP-HPLC; diabetes.
© 2018 ACG Publications. All rights reserved.
1. Introduction
Medicinal plants contain different phytochemicals which play an essential role in prevention of
many disorders by boosting up various organ functions of the human body, reducing the oxidative stress
and enhancing vital tissues regeneration [1]. One of the important medicinal plants is Honeysuckle.
Honeysuckle or Lonicera etrusca [Caprifoliaceae] (L. etrusca) is a Mediterranean climbing shrub
* Corresponding author: E-Mail: [email protected]

Raafat and Samy, Rec. Nat. Prod. (2018) 12:4 367-379
368
famous for its colorful flowers. The blooming period starts in May and finishes in June. It is
traditionally used in Asia as antioxidant, diuretic and anti-fatigue [2, 3].
One of the autoimmune disorders that might be managed by medicinal plants and its isolated
phytochemicals is diabetes (DM). DM is a major health disorder and is a leading reason of death
worldwide. DM is marked by the increased oxidative stress and very low insulin secretion due to
degeneration of the pancreatic beta-cells [4].
For manufacturing purposes, spray drying is one of the most convenient methods for drying
natural medicine, having several pros over other conventional drying methods. Spray drying might help
in solving many problems that decrease natural medicine efficacy like stability and quality of active
constituents [5].
To date, there are few reports about L. etrusca and its phytochemical active ingredients.
Moreover, L. etrusca has not been reported before to manage DM. Nevertheless, its promising
antioxidant potentials have motivated the trials on management of DM. Thus, the aim of the current
work is to phytochemically investigate the ultrasound-assisted spray dried L. etrusca, its potential
antidiabetic activity, the possible active constituents and the underling mechanism of action.
2. Materials and Methods
2.1. Plant Material
Lonicera etrusca flowers was collected in May 2014 from Beirut, Lebanon (Latitude: 33.90131
North and Longitude: 35.48034 East) and was authenticated by a reference-sample, and a sample was
kept in the faculty herbarium utilizing a voucher sample number (P14-48).
2.2. Ultrasound-assisted Spray Drying versus Conventional Rotary-evaporation
The fresh L. etrusca flowers were divided into 2 equal halves. The first half was vortexed
conventionally with Stuart vortex (China) with double distilled water for 12h and the aqueous extract
dried under vacuum utilizing Buchi rotavapor (Germany) at 40° C till complete dryness producing the
Honeysuckle rotavapor extract (HS-r). The second half was sonicated for 3h with double distilled water
in Altrasonic ultrasonic atomizer (China) with a working frequency of 40 kHz and a cylindrical flange
vibrating symmetrically, to avoid fluid gliding. The atomized aqueous extract was then fed into Lab-
Plant Mini-Spray dryer SD-06AG (Lab-Plant, UK). Where, the inlet-temperature was adjusted at 165 °C
and the feed rate was adjusted keeping the outlet-temperature at 75–80 °C [6]. The spray dried extract
(HS-sd) was collected and kept in a desiccator till further testing.
2.3. L. etrusca Extracts and RP-HPLC Standardization
HS-r and HS-sd were standardized separately utilizing an RP-HPLC method. The HPLC system
utilized was assembled of an Agilent-Technologies HPLC model (1200 series) supplied with
quaternary-pump module, thermostatted column-compartment, vacuum degasser, and UV-detector
system. Data acquisition was carried out by Agilent ChemStation-software. RP-analysis was carried out
with an Agilent C-18 column (4.6 mm× 250 mm, 5 μm particle size) at 40 °C. The mobile phase
consisted of isocratic MeOH/Phosphate buffer pH=2.1 (43:57). Both phases were degassed using Grant
sonication-bath for 25 min. The injection-volume was 50 μL and the flow-rate was kept at 1.0 ml/min.
The standardization of HS-r or HS-sd was carried out at 254 nm [7].
2.4. Bio-guided Fractionation, Isolation and NMR Identification of Active Constituent
The bio-guided fractionation was performed using RP-silica gel packed in a glass-column
(50mm × 400mm). The volume of HS-sd was adjusted according to the volume of column packing and
was left to equilibrate. The column was eluted with one bed volume (BV) of double-distilled water,
followed 5BV EtOH (30%) and finally 2BV EtOH (100%). During the whole fractionation process
aliquots was collected every 2 min, concentrated and monitored utilizing TLC and RP-HPLC. Similar
Phytochemistry of Lonicera etrusca
369
aliquots was combined, concentrated and tested for acute hypoglycemic potentials. The most active
aliquot was identified utilizing Bruker 1H and
13C NMR (300 MHz) (Germany). For NMR analysis, 100
μL of the active aliquot was mixed three times with 100 μL 100% D2O (0.9%, w/v). Then ca. 150 μL of
the supernatant was transferred into NMR (3 mm) tubes.
2.5. Animals and Diabetes Induction
2.5.1. Ethics Statement
The use and care of the experimental protocol and animals was in compliance with the
Guidelines for the Use and Care of Experimental Animals of BAU University, and was approved by
BAU Institutional Review Board.
2.5.2. Diabetes Induction
Male mice, weighing 22–28 g, were obtained from the faculty animal-house (Lebanon). Mice
were housed in a room which is temperature-controlled (20 ± 2 °C; 12 h light/dark cycle) with free
access to food and water. After acclimatization for a week, DM was induced with three intraperitoneal
injection of alloxan each other day at a total dose of 180 mg/kg. After three days, blood glucose levels
(BGL) were monitored and the mice with a BGL more than 200 mg/dL was classified as diabetic [8].
2.5.3. Experimental Design and Measurement of Blood Glucose Levels, Body Weights and
Catalase Levels
The experimental design was summarized in table 1. All treatments were given orally via oral
gavages. Blood was collected by tail-vein puncture and BGL was measured acutely and subchronically
by Sigma glucometers (Germany) and for longer times by Analyticon HbA1c micro-columns
(Germany). Acutely, the BGL was measured pre-treatment and 0.5, 2 and 6 h post-treatment.
Subchronically, the BGL was monitored at pre-treatment (day 0) and days 1, 3, 5 and 8 post-treatment.
For longer times, the HbA1c was measured at day 0, and at day 28 post-treatment.
2.5.4. Serum Insulin Levels
The serum insulin levels were monitored for longer time at day 0, and at day 28 post HS-r (10,
25 and 50 mg/kg), HS-sd (10, 25 and 50 mg/kg), and ICA (5, 10 and 20 mg/kg) treatment using an RP-
HPLC method reported-before [9]. Briefly, HPLC system (Agilent, Japan) equipped by RP-C18 column
(Merck, Germany), and the mobile-phase consisted of TFA (0.1%) in HPLC double-distilled water
(solvent-A) and ACN (solvent-B) and the column temperature was adjusted to 40°C at 1 ml/min flow-
rate. At 214 nm, the gradient-elution conditions utilized were 0–5 min 70% A, 5–15 min 60% A [10].
2.5.5. Body Weight and Catalase Levels
During the subchronic monitoring of BGL, animals body weight (BW) and serum catalase
levels (CAT) were recorded. The body weights and CAT levels were measured at pre-treatment (day 0)
and days 1, 3, 5 and 8 post-treatment in grams and kU/I, respectively [11].
2.6. Statistical Analysis
All results were measured as mean ± S.E.M. The mean differences were compared by ANOVA.
The Scheffe and Duncan methods were utilized to carry out post hoc analysis utilizing “OriginPro”
statistics-program. The p-value ≤ 0.05 was appointed as statistically-significant result.

Raafat and Samy, Rec. Nat. Prod. (2018) 12:4 367-379
370
Table 1. Protocol of experimental design
Groups n Tested
Substance(s) Description
I 7 Control Normal mice: Vehicle [sterile cold saline (0.9%)], IP
II 7 Diabetic Control Diabetic mice: Vehicle, IP
III 7 GB Diabetic mice: GB 5 mg/kg, IP
IV 7 HS-r Diabetic mice: HS-r 10 mg/kg, IP
V 7 HS-r Diabetic mice: HS-r 25 mg/kg, IP
VI 7 HS-r Diabetic mice: HS-r 50 mg/kg, IP
VII 7 HS-sd Diabetic mice: HS-sd 10 mg/kg, IP
VIII 7 HS-sd Diabetic mice: HS-sd 25 mg/kg, IP
IX 7 HS-sd Diabetic mice: HS-sd 50 mg/kg, IP
X 7 ICA Diabetic mice: ICA 5 mg/kg, IP
XI 7 ICA Diabetic mice: ICA 10 mg/kg, IP
XII 7 ICA Diabetic mice: ICA 20 mg/kg, IP
Acute (0, 0.5, 2 and 6 hrs) and subchronic (1,3,5,8 days) effect of rotary evaporated Honeysuckle
aqueous extract (HS-r), ultrasound-assisted spray dried Honeysuckle aqueous extract (HS-sd) and
isolated isochlorogenic acid (ICA) from HS-sd on blood glucose, body weights and CAT serum
levels.
3. Results and Discussion
3.1. L. etrusca Extract RP-HPLC Standardization
The rotary evaporated extract (HS-r) and the spray dried one (HS-sd) were standardized by
means of RP-HPLC analysis and the use of steeping of standard calibration curves method. HS-r major
peaks identified were (I) Chlorogenic acid (38.6%), (II) Caffeic acid (5.8%), (III) Isochlorogenic acid
(36.1%), (IV) luteolin-7-O-glucoside (3.3%), and (V) quercetin (3.0%). On the other hand, HS-sd r
major peaks identified were (I) Chlorogenic acid (40.5%), (II) Caffeic acid (6.4%), (III) Isochlorogenic
acid (43.3%), (IV) luteolin-7-O-glucoside (3.5%), and (V) quercetin (3.2%) (Figure 1).
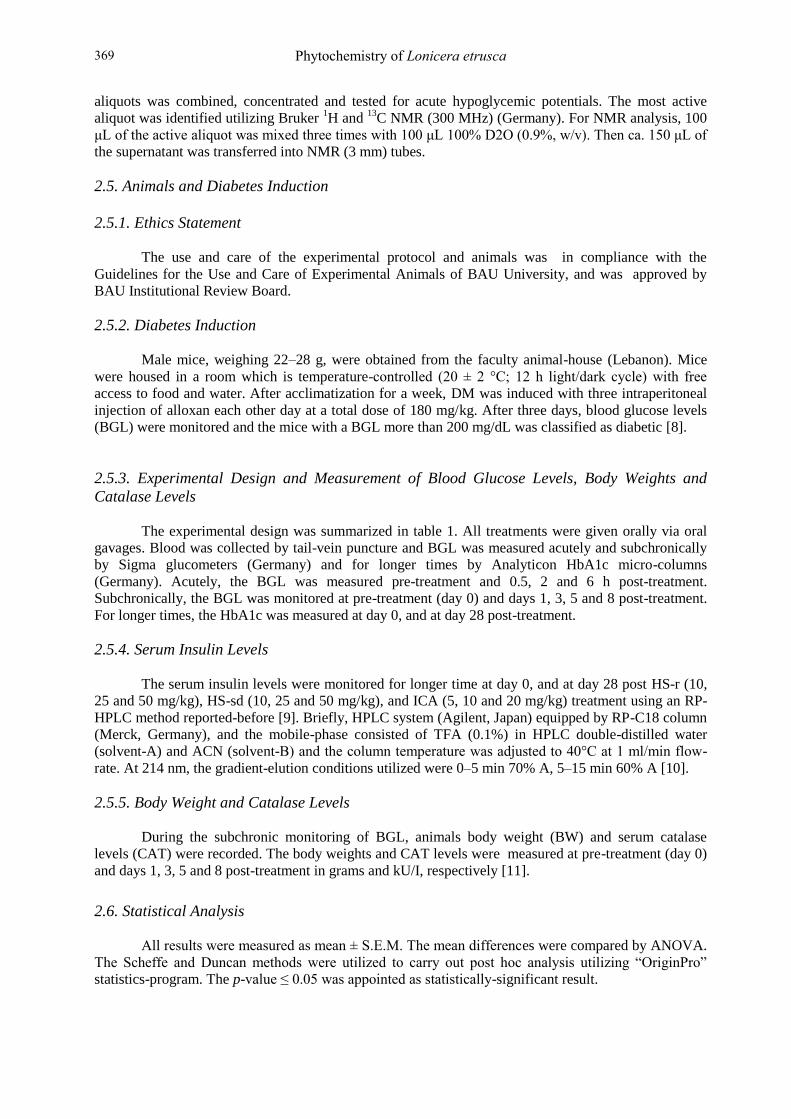
3.2. Bio-guided Separation, Isolation and 1H and
13C NMR Data of Active Constituent
The most active fraction isolated by RP-column chromatography from HS-sd was identified by
1H and
13C NMR to be isochlorogenic acid (ICA) (Table 2 and Figure 2). Various doses of HS-r (10, 25
and 50 mg/kg), HS-sd (10, 25 and 50 mg/kg), and ICA (5, 10 and 20 mg/kg) were used in the
antidiabetic studies. The choice of various doses was according to the percentage of ICA in HS, and
dose-adjustment method via an acute pilot study prior to beginning of the experimentation.
3.3. Ultrasound-assisted Spray Drying versus Conventional Rotary-evaporation
Rotary evaporation is one of the most common drying procedures conventionally used. In the
current work, the conventional rotary evaporation drying method yield was compared to the ultrasound-
assisted spray drying method. The main drawback of the rotary evaporation is the longer drying time
and the lower yield when compared to the ultrasound-assisted spray drying method. The conditions of
the various methods and their corresponding results were summed up in Table 3. Concerning the drying
time, spray drying was found to be faster by 4 folds than that of conventional rotator evaporation
method (Table 3).
In terms of yield, the comparatively marked results were obtained by spray drying, which has
given higher yield by ca. 20.0%, when compared to the rotary evaporation method (Table 3). The
ultrasound-assisted spray drying method has shown to save considerable time and to have superior yield
over the rotary evaporation method.

Phytochemistry of Lonicera etrusca
371
3.4. Measurement of Blood Glucose and HbA1c Levels
Acutely, various doses of HS-r (10, 25 and 50 mg/kg) have decreased the BGL at 6h post-
treatment by 27.3, 29.0 and 30.7%, respectively, in correlation with vehicle treated diabetic animal
group (DIA CTRL) (Figure 3A). Moreover, the same doses of the spray dried HS-sd (10, 25 and 50
mg/kg) have potentially decreased the BGL after 6h post-treatment by 42.7, 44.8 and 50.0%,
respectively, in correlation with DIA CTRL (Figure 3B). The strongest effect was obtained with the
most active compound isolated from HS-sd, ICA (5, 10 and 20 mg/kg) showing 6h post-treatment BGL
reduction of 41.3, 45.7 and 52.7% (Figure 3C), respectively.
Subchronic activity of the prepared extracts were tested in correlation with vehicle treated diabetic
animal group (DIA CTRL) where various doses of HS-r (10, 25 and 50 mg/kg) have decreased the BGL
at 8 days post-treatment by 40.8, 42.0 and 43.5%, respectively (Figure 4A). Moreover, the same doses
of the spray dried HS-sd (10, 25 and 50 mg/kg) have potentially decreased the BGL after 8 days post-
treatment by 50.6, 53.0 and 55.1%, respectively, (Figure 4B). In case of the most active compound
isolated from HS-sd, ICA (5, 10 and 20 mg/kg) the BGL after 8 days post-treatment was reduced by
43.2, 47.1 and 50.7%; respectively (Figure 4C).
Figure 1. HPLC chromatograms for Lonicera etrusca: (A) HS-r major peaks identified were (I)
Chlorogenic acid (38.6%), (II) Caffeic acid (5.8%), (III) Isochlorogenic acid (36.1%), (IV) luteolin-7-O-
glucoside (3.3%), and (V) quercetin (3.0%). (B) HS-sd r major peaks identified were (I) Chlorogenic
acid (40.5%), (II) Caffeic acid (6.4%), (III) Isochlorogenic acid (43.3%), (IV) luteolin-7-O-glucoside
(3.5%), and (V) quercetin (3.2%). The mobile phase utilized was MeOH/Phosphate buffer pH=2.1
(43:57) at 254nm and temperature 40°C.
For longer periods, various doses of HS-r, HS-sd and the isolated ICA have shown significant
decrease in HbA1c levels, 28 days post-administration, in correlation with vehicle treated diabetic mice
(VEH) (Figure 5). The spray dried HS-sd had shown the most significant dose-dependent normalization
of HbA1c levels. As HS-sd (10, 25 and 50 mg/kg) have normalized the HbA1c level (VEH= 8.80 ±
0.10%) to 7.40 ± 0.10, 7.20 ± 0.09 and 7.00 ± 0.09 %, respectively, after 28 days post-treatment. While
those of HS-r (10, 25 and 50 mg/kg) have decreased the HbA1c level to 7.90 ± 0.10, 7.70 ± 0.14 and
7.50 ± 0.02 %. Comparatively, the lowest decrease of control (n=7/group). CTRL = normal non-diabetic
control. * means significant (p ˂ 0.05) compared to vehicle treated diabetic control (DIA-CTRL).
HbA1c levels have shown 28 days post-treatment by the isolated ICA which decreased the
HbA1c levels to 8.00 ± 0.09, 7.80 ± 0.08 and 7.60 ± 0.10 %, respectively (Figure 5).
A B
Raafat and Samy, Rec. Nat. Prod. (2018) 12:4 367-379
372
1
2
3
4
5
6
O
O
10
11
O
12
O
14
15
O
O
O
O
O
H
H
H
H
H
H
H
H
H
HH
H
HH
H
H
H
H
78
9
13
Figure 2. Structure of Isochlorogenic acid (ICA) isolated from Lonicera etrusca aqueous extract.
Table 2. 1H and
13C NMR spectroscopic data (300 MHz) for isochlorogenic acid (ICA) isolated from
ultrasound-assisted spray dried Lonicera etrusca aqueous extract.
Position δH, multi. (J in Hz) δC
1 4.09, t (8.20) 146.6
2 __ 146.4
3 7.28, dd (1.94, 0.46) 117.6
4 __ 127.2
5 7.69, dd (8.45, 1.94) 123.1
6 6.77, dd (8.45, 0.46) 116.2
7 7.74, d (15.69) 146.7
8 6.50, d (15.69) 115.9
9 __ 168.0
10 5.04, q (14.48, 2.79) 106.6
11α 2.12, dd (14.48, 2.79) 38.4
11ß 2.32, dd (14.25, 2.79)
12 __ 71.9
13 α 1.98, dd (14.25, 10.26) 38.2
13 ß 2.30, dd (14.48, 2.79)
14 3.38, dt (10.26, 2.79) 70.4
15 3.22, t (2.79) 73.5
Table 3. Comparison of the efficacy of rotary evaporated HS-r and the ultrasound-assisted spray
dried HS-sd yields of Lonicera etrusca extract.
Method Initial weight
(g)
Solvent
volume
(L)
Extraction
time
(hr)
Drying
time
(hr)
Rate of
drying
(L/hr)
Yield
(g/L)
HS-r 1000 5 12 10 0.5 88.0
HS-sd 1000 5 3 2.5 2 110.0

Phytochemistry of Lonicera etrusca
373
A
0 0.5 2 6
80
100
120
140
160
180
200
220
240
260
*
*
*
*
HS-r 50 mg/kg
BG
L (
mg
/dL
)
Time (Hours)
*
*
**
DIA CTRL
CTRL GB
HS-r 25 mg/kg
HS-r 10 mg/kg
B
0 0.5 2 6
80
100
120
140
160
180
200
220
240
260
*
*
**
HS-sd 50 mg/kg
BG
L (
mg
/dL
)
Time (Hours)
*
*
*
*
DIA CTRL
CTRL GB
HS-sd 25 mg/kg
HS-sd 10 mg/kg
C
0 0.5 2 6
80
100
120
140
160
180
200
220
240
260
*
*
*
*
ICA 20 mg/kg
BG
L (
mg
/dL
)
Time (Hours)
***
*
DIA CTRL
CTRL GB
ICA 10 mg/kg
ICA 5 mg/kg
Figure 3. Acute hypoglycemic effect of (A) Rotary evaporated Honeysuckle aqueous extract (HS-r); (B)
ultrasound-assisted spray dried Honeysuckle aqueous extract (HS-sd); and (C) the isolated
isochlorogenic acid (ICA) from HS-sd on BGL of experimental diabetic mice utilizing glibenclamide
(GB) as positive control (n=7/group). CTRL = normal non-diabetic control. * means significant (p ˂
0.05) compared to vehicle treated diabetic control (DIA-CTRL).

Raafat and Samy, Rec. Nat. Prod. (2018) 12:4 367-379
374
3.5. Serum Insulin Levels
To facilitate identifying of the tested extracts or isolated active compound mechanism of
hypoglycemia, the serum insulin levels were monitored prior to and 28 days post treatment. The serum
insulin levels of the spray dried HS-sd has shown the highest dose dependant increase in serum insulin
levels. Where various doses of HS-sd (10, 25 and 50 mg/kg) have shown ca. 5.0, 7.1 and 8.8 folds
increase in serum insulin levels, respectively, 28 days post treatment, in correlation with vehicle treated
diabetic mice (VEH) (Figure 6). While those of HS-r (10, 25 and 50 mg/kg) have shown ca. 3.0, 4.4 and
5.8 folds increase in serum insulin levels, respectively, 28 days post treatment, in correlation with VEH
(Figure 6). In comparison with VEH, HS-r and HS-sd, the lowest increase in serum insulin levels have
shown by the isolated ICA which increased the serum insulin levels by 3.4, 4.1 and 5.3 folds,
respectively (Figure 6).
0 2 4 6 860
80
100
120
140
160
180
200
220
240
260
HS 50 mg/kg
**
**
DIA Control
Control HS-r 10 mg/kg
BG
L (
mg/d
L)
Time (Days)
HS-r 25 mg/kg
**
*
GB
*
0 2 4 6 860
80
100
120
140
160
180
200
220
240
260
HS-sd 50 mg/kg
**
**
DIA Control
Control HS-sd 10 mg/kg
BG
L (
mg
/dL
)
Time (Days)
HS-sd 25 mg/kg
**
*
GB
*
0 2 4 6 860
80
100
120
140
160
180
200
220
240
260
ICA 20 mg/kg
DIA Control
Control ICA 5 mg/kg
BG
L (
mg
/dL
)
Time (Days)
ICA 10 mg/kg
**
*
**
*
*
GB
*
Figure 4. Subchronic hypoglycemic effect of the ((A) Rotary evaporated Honeysuckle aqueous extract (HS-
r); (B) ultrasound-assisted spray dried Honeysuckle aqueous extract (HS-sd); and (C) the isolated
isochlorogenic acid (ICA) from HS-sd on BGL of experimental diabetic mice utilizing glibenclamide (GB)
as positive control (n=7/group). CTRL = normal non-diabetic control. * means significant (p ˂ 0.05)
compared to vehicle treated diabetic control (DIA-CTRL).
3.6. Body Weight Level as an Indicator of Management of DM
The marked elevation in body weight (BW) levels is an indication of normalization of BGL
[12]. Therefore, the average BW levels each of the treated animal groups were monitored subchronically
for 8 days versus vehicle treated animals (VEH) (Figure 7).
A B
C

Phytochemistry of Lonicera etrusca
375
Subchronically, various doses of HS-r (10, 25 and 50 mg/kg) have increased the average BW at
8 days post-treatment by 45.4, 48.8 and 56.3%, respectively, in correlation with VEH (Figure 7).
Moreover, the same doses of the spray dried HS-sd (10, 25 and 50 mg/kg) have potentially increased the
BW after 8 days post-treatment by 54.2, 62.5 and 65.4%, respectively, in correlation with VEH (Figure
7). Furthermore, in correlation with VEH, various doses of ICA (5, 10 and 20 mg/kg) have increased the
BW after 8 days post-treatment by 22.5, 30.4 and 44.6% (Figure 7). Interestingly, the results of HS-r,
HS-sd and ICA were more prominent than that of the positive control, glibenclamide (GB) 5 mg/kg
(Figure 7).
NORMVEH
GB 5 mg/k
g
HS-r 10 m
g/kg
HS-r 25 m
g/kg
HS-r 50 m
g/kg
HS-sd 10 m
g/kg
HS-sd 25 m
g/kg
HS-sd 50 m
g/kg
ICA 5 m
g/kg
ICA 10 m
g/kg
ICA 20 m
g/kg
NORMVEH
GB 5 mg/k
g
HS-r 10 m
g/kg
HS-r 25 m
g/kg
HS-r 50 m
g/kg
HS-sd 10 m
g/kg
HS-sd 25 m
g/kg
HS-sd 50 m
g/kg
ICA 5 m
g/kg
ICA 10 m
g/kg
ICA 20 m
g/kg
4
5
6
7
8
9
10
*
**
*
Hb
A1c
(%)
Predose 28 days post-dose
** *
**
*
Figure 5. Effects of the rotary evaporated Honeysuckle aqueous extract (HS-r), ultrasound-assisted
spray dried Honeysuckle aqueous extract (HS-sd) and isolated isochlorogenic acid (ICA) from HS-sd
on HbA1c at pre-dose and 8 weeks post-dose utilizing glibenclamide (GB) as positive control
(n=7/group). Values represent the mean ± SD. (NORM) normal non-diabetic untreated mice. *p < 0.05
vs. diabetic vehicle control (VEH).
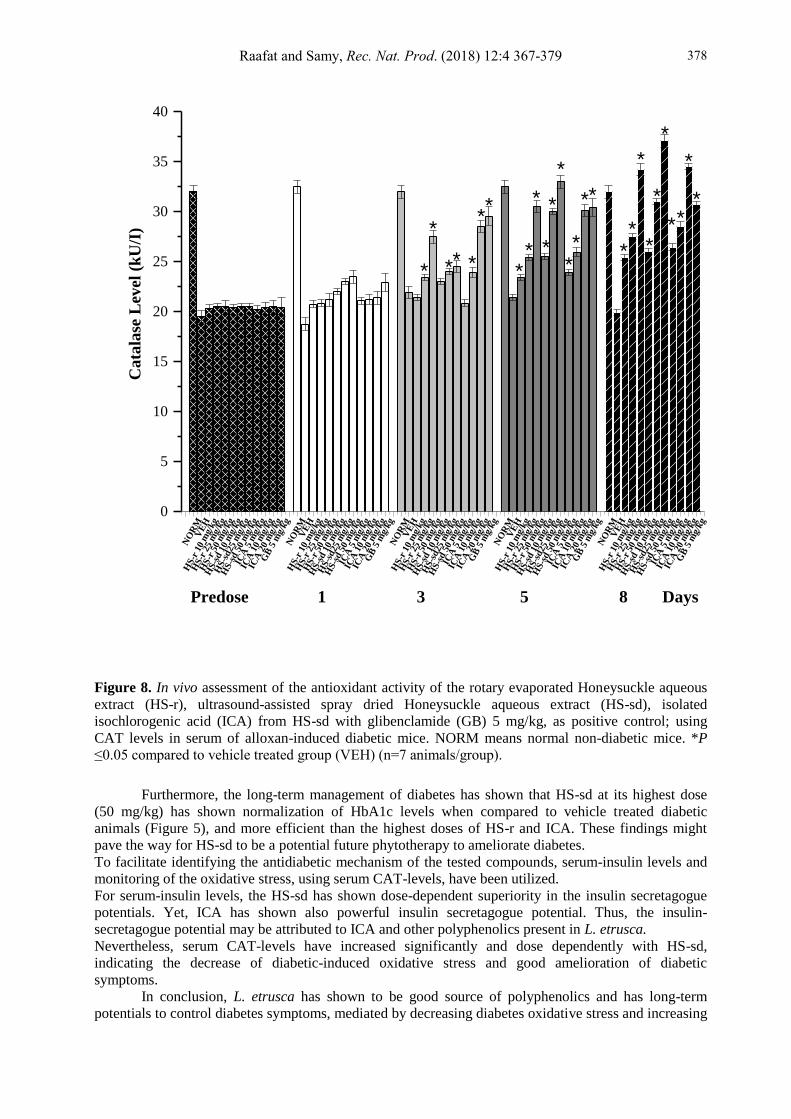
3.7. L. etrusca extracts and DM Oxidative Stress
The DM is marked by a significant increase of oxidative stress as indicated by the decrease in
the innate antioxidant enzyme, catalase (CAT), and the re-elevation of CAT levels is an indication of
good management of DM [13]. In this study, serum CAT levels decreased in the VEH group from 32.10
± 0.14 kU/L (normal non-diabetic; NORM) to 19.50 ± 0.10 kU/L (VEH), indicating of high oxidative
stress in DM mice, before initiation of treatment (predose) (Figure 8).
Subchronically, various doses of HS-r (10, 25 and 50 mg/kg) have increased the CAT levels 8
days post-treatment by 28.1, 37.7 and 71.9%, respectively, in correlation with VEH (Figure 8).
Moreover, the comparable doses of the spray dried HS-sd (10, 25 and 50 mg/kg) have potentially
increased the CAT levels after 8 days post-treatment by 31.1, 55.8 and 85.9%, respectively, in
correlation with VEH (Figure 8). Furthermore, in correlation with VEH, various doses of ICA (5, 10 and
20 mg/kg) have increased the CAT levels after 8 days post-treatment by 33.2, 43.2 and 72.9% (Figure

Raafat and Samy, Rec. Nat. Prod. (2018) 12:4 367-379
376
7). The results of HS-r, HS-sd and ICA highest doses were more prominent than that of the positive
control, glibenclamide (GB) 5 mg/kg (Figure 8).
Thus, polyphenolic compounds have diverse phytotherapeutic activities and have been
evidenced to be effective in the amelioration of serious disorders such as hypertension and diabetes [14].
RP-HPLC standardization of L. etrusca has shown it as a very rich source of polyphenolics. Moreover, a
bio-guided fractionation and isolation study was applied in this study and the most active ingredient
isolated from L. etrusca was found to be the polyphenolic, isochlorogenic acid (ICA).
NORMVEH
GB 5 mg/k
g
HS-r 10 m
g/kg
HS-r 25 m
g/kg
HS-r 50 m
g/kg
HS-sd 10 m
g/kg
HS-sd 25 m
g/kg
HS-sd 50 m
g/kg
ICA 5 m
g/kg
ICA 10 m
g/kg
ICA 20 m
g/kg
NORMVEH
GB 5 mg/k
g
HS-r 10 m
g/kg
HS-r 25 m
g/kg
HS-r 50 m
g/kg
HS-sd 10 m
g/kg
HS-sd 25 m
g/kg
HS-sd 50 m
g/kg
ICA 5 m
g/kg
ICA 10 m
g/kg
ICA 20 m
g/kg
0.0
0.5
1.0
1.5
2.0
2.5
3.0
*
*
*
Ser
um
In
suli
n (
g/L
)
Predose 28 days post-dose
*
*
*
*
*
*
Figure 6. Effects the rotary evaporated Honeysuckle aqueous extract (HS-r), spray dried
Honeysuckle aqueous extract (HS-sd) and isolated isochlorogenic acid (ICA) from HS-sd on serum
insulin at pre-dose and 8 weeks post-dose utilizing metformin (MTF) as positive control (n=7/group).
Values represent the mean ± SD. (NORM) normal non-diabetic untreated mice. *p < 0.05 vs. diabetic
vehicle control (VEH).
Currently, the conventionally dried honeysuckle (HS-r) has shown some antidiabetic potential.
Nevertheless, in order to increase the hypoglycemic properties, ultrasound-assisted spray drying method
was applied to aqueous honeysuckle extract (HS-sd). When compared to conventionally dried HS-r, the
ultrasound-assisted spray dried HS-sd form has shown a significant improvement of processing time,
yield, quality of constituents, and acute, subchronic and long-term antidiabetic activity.
In processing time, HS-sd has shown 4 fold decreases in drying time when compared to HS-r
(Table 3), preserving time and might influence the quality of the constituents [15].
Furthermore, by comparing the yield after drying, HS-sd had ca. 20% increase in yield when
correlated to HS-r (Table 3), which improves the quantity of the extract being processed and have an
economical benefit in increasing the processing yield [16].

Phytochemistry of Lonicera etrusca
377
NO
RM
VE
H
HS-r
10
mg/
kg
HS-r
25
mg/
kg
HS-r
50
mg/
kg
HS-s
d 1
0 m
g/kg
HS-s
d25
mg/
kg
HS-s
d 5
0 m
g/kg
ICA
5 m
g/kg
ICA
10
mg/
kg
ICA
20
mg/
kg
GB
5 m
g/kg
NO
RM
VE
H
HS-r
10
mg/
kg
HS-r
25
mg/
kg
HS-r
50
mg/
kg
HS-s
d 1
0 m
g/kg
HS-s
d25
mg/
kg
HS-s
d 5
0 m
g/kg
ICA
5 m
g/kg
ICA
10
mg/
kg
ICA
20
mg/
kg
GB
5 m
g/kg
NO
RM
VE
H
HS-r
10
mg/
kg
HS-r
25
mg/
kg
HS-r
50
mg/
kg
HS-s
d 1
0 m
g/kg
HS-s
d25
mg/
kg
HS-s
d 5
0 m
g/kg
ICA
5 m
g/kg
ICA
10
mg/
kg
ICA
20
mg/
kg
GB
5 m
g/kg
NO
RM
VE
H
HS-r
10
mg/
kg
HS-r
25
mg/
kg
HS-r
50
mg/
kg
HS-s
d 1
0 m
g/kg
HS-s
d25
mg/
kg
HS-s
d 5
0 m
g/kg
ICA
5 m
g/kg
ICA
10
mg/
kg
ICA
20
mg/
kg
GB
5 m
g/kg
NO
RM
VE
H
HS-r
10
mg/
kg
HS-r
25
mg/
kg
HS-r
50
mg/
kg
HS-s
d 1
0 m
g/kg
HS-s
d25
mg/
kg
HS-s
d 5
0 m
g/kg
ICA
5 m
g/kg
ICA
10
mg/
kg
ICA
20
mg/
kg
GB
5 m
g/kg
0
5
10
15
20
25
30
35
40
*
Av
era
ge
Bo
dy
Wei
gh
t (g
)
Predose 1 3 5 8 Days
**
*
***
***
*
*
**
***
***
*
**
*
***
**
*
*
**
*
***
***
Figure 7. The effect the rotary evaporated Honeysuckle aqueous extract (HS-r), ultrasound-assisted
spray dried Honeysuckle aqueous extract (HS-sd), isolated isochlorogenic acid (ICA) from HS-sd and
glibenclamide (GB) 5 mg/kg, as positive control, on body weights in alloxan-induced diabetic mice.
NORM means normal non-diabetic mice. *P ≤0.05 compared to vehicle treated group (VEH) (n=7
animals/group).
For the quality of the constituents, RP-HPLC standardization has found that there is a
significant improvement in the most active constituent responsible for the antidiabetic activity, ICA.
Where, HS-sd has ca. 19.9% increase in ICA percentage when compared to HS-r (Figure 1), which
might have strong influence on HS-sd efficacy and activity.
In order to investigate the antidiabetic properties of the tested compounds, an acute (6h),
subchronic (8 days) and long-term (28 days) studies were assembled. In the acute studies, various doses
of HS-r, HS-sd and ICA were utilized. The HS-sd has shown dose-dependent superiority in the
antidiabetic activity over ICA and HS-r, giving the ultrasound-assisted spray drying an advantage in
improving the L. etrusca antidiabetic efficacy.
For the subchronic experiments, HS-sd highest dose (50 mg/kg) has shown normalization of
BGL and improving body weight when compared to vehicle treated diabetic animals (Figure 4B and 7).
It was also more efficient than the highest doses of ICA and HS-r, indicating potential improvements in
diabetes symptoms.
Raafat and Samy, Rec. Nat. Prod. (2018) 12:4 367-379
378
NO
RM
VE
H
HS-r
10
mg/
kg
HS-r
25
mg/
kg
HS-r
50
mg/
kg
HS-s
d 1
0 m
g/kg
HS-s
d25
mg/
kg
HS-s
d 5
0 m
g/kg
ICA
5 m
g/kg
ICA
10
mg/
kg
ICA
20
mg/
kg
GB
5 m
g/kg
NO
RM
VE
H
HS-r
10
mg/
kg
HS-r
25
mg/
kg
HS-r
50
mg/
kg
HS-s
d 1
0 m
g/kg
HS-s
d25
mg/
kg
HS-s
d 5
0 m
g/kg
ICA
5 m
g/kg
ICA
10
mg/
kg
ICA
20
mg/
kg
GB
5 m
g/kg
NO
RM
VE
H
HS-r
10
mg/
kg
HS-r
25
mg/
kg
HS-r
50
mg/
kg
HS-s
d 1
0 m
g/kg
HS-s
d25
mg/
kg
HS-s
d 5
0 m
g/kg
ICA
5 m
g/kg
ICA
10
mg/
kg
ICA
20
mg/
kg
GB
5 m
g/kg
NO
RM
VE
H
HS-r
10
mg/
kg
HS-r
25
mg/
kg
HS-r
50
mg/
kg
HS-s
d 1
0 m
g/kg
HS-s
d25
mg/
kg
HS-s
d 5
0 m
g/kg
ICA
5 m
g/kg
ICA
10
mg/
kg
ICA
20
mg/
kg
GB
5 m
g/kg
NO
RM
VE
H
HS-r
10
mg/
kg
HS-r
25
mg/
kg
HS-r
50
mg/
kg
HS-s
d 1
0 m
g/kg
HS-s
d25
mg/
kg
HS-s
d 5
0 m
g/kg
ICA
5 m
g/kg
ICA
10
mg/
kg
ICA
20
mg/
kg
GB
5 m
g/kg
0
5
10
15
20
25
30
35
40
Ca
tala
se L
evel
(k
U/I
)
Predose 1 3 5 8 Days
**
**
**
* ** * *
*
*
*
*
**
*
**
**
*
*
*
*
*
Figure 8. In vivo assessment of the antioxidant activity of the rotary evaporated Honeysuckle aqueous
extract (HS-r), ultrasound-assisted spray dried Honeysuckle aqueous extract (HS-sd), isolated
isochlorogenic acid (ICA) from HS-sd with glibenclamide (GB) 5 mg/kg, as positive control; using
CAT levels in serum of alloxan-induced diabetic mice. NORM means normal non-diabetic mice. *P
≤0.05 compared to vehicle treated group (VEH) (n=7 animals/group).
Furthermore, the long-term management of diabetes has shown that HS-sd at its highest dose
(50 mg/kg) has shown normalization of HbA1c levels when compared to vehicle treated diabetic
animals (Figure 5), and more efficient than the highest doses of HS-r and ICA. These findings might
pave the way for HS-sd to be a potential future phytotherapy to ameliorate diabetes.
To facilitate identifying the antidiabetic mechanism of the tested compounds, serum-insulin levels and
monitoring of the oxidative stress, using serum CAT-levels, have been utilized.
For serum-insulin levels, the HS-sd has shown dose-dependent superiority in the insulin secretagogue
potentials. Yet, ICA has shown also powerful insulin secretagogue potential. Thus, the insulin-
secretagogue potential may be attributed to ICA and other polyphenolics present in L. etrusca.
Nevertheless, serum CAT-levels have increased significantly and dose dependently with HS-sd,
indicating the decrease of diabetic-induced oxidative stress and good amelioration of diabetic
symptoms.
In conclusion, L. etrusca has shown to be good source of polyphenolics and has long-term
potentials to control diabetes symptoms, mediated by decreasing diabetes oxidative stress and increasing

Phytochemistry of Lonicera etrusca
379
insulin secretagogue potentials and its efficacy might be improved by ultrasound-assisted spray drying.
The ultrasound-assisted spray drying of L. etrusca has shown improvement of processing time, yield,
quality of constituents, and acute, subchronic and long-term antidiabetic activity over the conventional
method. Thus, it is recommended to take ultrasound-assisted spray dried L. etrusca antidiabetic
potentials into consideration when clinically developing novel antidiabetic dietary supplements in the
future.
ORCID
Karim M. Raafat: 0000-0001-5907-6956
Wael Samy: 0000-0001-6082-8705
References
[1] W. Aidi Wannes and B. Marzouk (2016). Research progress of Tunisian medicinal plants used for acute
diabetes, J. Ac. Dis. 5, 357-363.
[2] B. Güler, E. Manav and E. Uğurlu (2015). Medicinal plants used by traditional healers in Bozüyük
(Bilecik–Turkey), J. Ethnopharmcol. 173, 39-47.
[3] S. Güneş, A. Savran, M.Y. Paksoy, M. Koşar and U. Çakılcıoğlu (2017). Ethnopharmacological survey of
medicinal plants in Karaisalı and its surrounding (Adana-Turkey), J. Herb. Med. 8, 68-75.
[4] W. Wojnar, I. Kaczmarczyk-Sedlak and M. Zych (2017). Diosmin ameliorates the effects of oxidative
stress in lenses of streptozotocin-induced type 1 diabetic rats, Pharmacol. Rep. 69, 995-1000.
[5] L. Gallo, M.V. Ramírez-Rigo, J. Piña and V. Bucalá (2015). A comparative study of spray-dried
medicinal plant aqueous extracts. Drying performance and product quality, Chem. Eng. Res. and Des.
104, 681-694.
[6] A.O. Elzoghby, W.M. Samy and N.A. Elgindy (2013). Novel spray-dried genipin-crosslinked casein
nanoparticles for prolonged release of alfuzosin hydrochloride, Pharm. Res. 30, 512-22.
[7] W. Guo, L. Wang, Y. Gao, B. Zhao, D. Wang, W. Duan and Z. Yu (2015). Isolation of isochlorogenic
acid isomers in flower buds of Lonicera japonica by high-speed counter-current chromatography and
preparative high performance liquid chromatography, J.Chrom. B 981, 27-32.
[8] P.V.A. Babu, D. Liu and E.R. Gilbert (2013). Recent advances in understanding the anti-diabetic actions
of dietary flavonoids, J. Nut. Biochem. 24, 1777-1789.
[9] B. Sarmento, A. Ribeiro, F. Veiga and D. Ferreira (2006). Development and validation of a rapid
reversed-phase HPLC method for the determination of insulin from nanoparticulate systems, Biomed.
Chrom. 20, 898-903.
[10] K. Raafat, N. El-Darra, F.A. Saleh, H.N. Rajha, R.G. Maroun and N. Louka (2017). Infrared-assisted
extraction and HPLC-analysis of Prunus armeniaca L. pomace and detoxified-kernel and their
antidiabetic effects, Phytochem. Anal. 1-12. doi: 10.1002/pca.2723.
[11] W.G. Yasmineh, T.P. Kaur, B.R. Blazar and A. Theologides (1995). Serum catalase as marker of graft-
vs-host disease in allogeneic bone marrow transplant recipients: Pilot study, Clin. Chem. 41, 1574-80.
[12] T. Bakirel, U. Bakirel, O.U. Keles, S.G. Ulgen and H. Yardibi (2008). In vivo assessment of antidiabetic
and antioxidant activities of rosemary (Rosmarinus officinalis) in alloxan-diabetic rabbits, J.
Ethnopharmacol. 116, 64-73.
[13] A. Elosta, T. Ghous and N. Ahmed (2012). Natural products as anti-glycation agents: Possible therapeutic
potential for diabetic complications, Curr. Diab. Rev. 8, 92-108.
[14] I.C. Arts and P.C. Hollman (2005). Polyphenols and disease risk in epidemiologic studies, Am. J. Clin.
Nutr. 81, 317S-325S.
[15] I. Tontul and A. Topuz (2017). Spray-drying of fruit and vegetable juices: Effect of drying conditions on
the product yield and physical properties, Tren. Food Sci. & Tech. 63, 91-102.
[16] D. Shofinita, S. Feng and T.A.G. Langrish (2015). Comparing yields from the extraction of different
citrus peels and spray drying of the extracts, Adv. Powd. Tech. 26, 1633-1638.
© 2018 ACG Publications


