
1
Luck Bias and Skill Performance of Individual Mutual Funds*
MARTIN ROHLEDER and MARCO WILKENS
University of Augsburg
Abstract. This is the first study measuring luck bias and skill performance of individual
funds. We show that luck and bad luck balance within the cross-section, such that market
level performance is virtually unbiased. Many individual funds, however, suffer greatly from
luck bias resulting in significant rank changes. In performance persistence tests, we show that
skill is persistent and that our luck-bias-corrected skill alpha discriminates more effectively
between future outperformers and underperformers than standard alpha does. Further, skill-
High-minus-Low portfolios consistently outperform standard-High-minus-Low portfolios by up
to 0.9 % p. a. Thereby we deliver economically valuable contributions to the discussion on
luck versus skill.
JEL Classification: G11, G12
Keywords: Mutual fund performance, luck bias, reverse survivorship bias, survivorship bias,
luck versus skill, performance persistence.
______________
* We are grateful for helpful comments and suggestions by Dominik Schulte, Ludwig von la Hausse, … We are
responsible for any remaining errors. Corresponding author: [email protected].

2
1. Introduction
A recent strand of research struggles with the question if there is significant investment skill
among mutual fund managers, which part of the measured performance is effectively based on
managers' skill and which part is due to mere luck. Unfortunately, there is no easy answer to
this question because the level of skill of individual funds is unobservable. Hence, the related
literature is majorly depending on bootstrap or simulation approaches and on assumptions
about the distribution of skill within the cross-section of mutual funds. Among this research
there is consensus that, due to the zero-sum game nature of the capital market, the average
skill level is zero which in turn leads to zero market level alpha before costs (e.g., Kosowski et
al, 2006; Fama and French, 2010). However, none of the existing studies provide reliable
estimates of the magnitude of skill performance or of the bias in mutual fund performance
induced by luck, especially not on an individual fund level.
Closing this gap, this is the first study estimating luck bias and skill performance of
individual funds in the U.S. domestic equity fund market. Specifically, we develop different
sets of fund-specific dummy variables to disentangle luck and skill in the estimated residuals
of standard performance measures. The first set of dummy variables is based directly on the
recently established concept of reverse survivorship bias by Linnainamaa (2013) which covers
a particular part of luck bias: bad luck resulting in disappearance. The dummies therefore
represent the last two years of a fund's existence due to the fact that there exists a
correlation between model residuals and disappearance making disappearance itself an
omitted variable disguising skill. In addition, this design also covers any actions by the fund
family occurring immediately before a fund's disappearance that disguise the investment
ability of the manager. In this context, anecdotal evidence suggests that fund families shift
bad assets into or strip good assets from disappearing funds, respectively, to enhance the
performance of their remaining funds. In the following, we refer to such actions as \Monkey
Business".
The second set of dummy variables is based on outlier identification methods analogue
to Chan and Lakonishok (1992) and Martin and Simin (2003) who both estimate robust
CAPM betas in the U.S. stock market. This way, these dummies cover lucky and unlucky
events experienced by a fund independent of survival and disappearance which has not been
considered before in the existing research on luck and skill in mutual fund performance.
Overall, both sets of dummies are based on readily available information such that our
methodology is easy to implement by academics and by investors alike. Thereby, we deliver
valuable contributions to the discussion on luck versus skill in general and to the concept of
reverse survivorship bias in particular.

3
Our results indicate that about 10 % of non-survivors indeed disappear due to bad
luck biasing market level performance downwards by up to 0.29 % p. a. However, this is a
distinctly lower estimate for reverse survivorship bias than reported by Linnainmaa (2013).
Furthermore, correcting realized performance for luck and bad luck independent of
disappearance uncovers a significant upward bias in realized performance by up to
0.25 % p. a. This overestimation of market level performance emerges because there is no
mechanism punishing good luck in a similar fashion as disappearance punishes bad luck.
Seemingly, funds on average experience more lucky events than unlucky events while they
survive. Using both corrections combined in a full luck-bias-correction model, the effects
eventually offset each other. Our final market level estimates of luck bias are therefore very
close to zero and economically irrelevant which \reverses" the reverse survivorship bias
established by Linnainmaa (2013).
On an individual fund level, however, our analysis shows that performance can be
severely biased and that fund rankings change considerably after correcting for individual
luck bias. This is documented by rank correlations below 70 % between uncorrected alphas
and our skill alphas. Moreover, our analysis of the distribution of alpha in the cross-section
shows that estimated alpha underestimates the width of the distribution as skill alpha has
fatter tails. Consequentially, there are more skilled but also more truly unskilled funds in the
market than suggested by standard measures. Our results regarding the distributions of
estimated alphas and skill alphas thereby closely correspond to the existing research on luck
versus skill. Our results rationalize and confirm most of their findings, thereby further
contributing to this strand of literature.
To analyze whether skill is persistent and to confirm that our results are not mere
statistical artifacts, we test for the predictive power of our luck-bias-corrected skill
performance measures using performance persistence analysis. The results on these tests show
that rank correlations between ranking and holding periods are consistently higher when
using skill alpha in the ranking period. Furthermore, we show that investing in a skill alpha
based High-minus-Low portfolio yields a premium that is up to 0.9 % p.a. higher than that of
a standard alpha based High-minus-Low portfolio. These results are robust for different
combinations of ranking and holding period lengths. This proves that our measures of skill
alpha discriminate more effectively between future outperformers and future underperformers.
Overall, our study thereby adds significant economic value for academics and for investors.
The rest of the paper is organized as follows. Section 2 motivates our study by
providing the theoretical background, summarizing the related literature and describing in
more detail the contribution of this paper. Section 3 describes our approach to correcting
individual estimated performance for luck bias and formulates five distinct research

4
hypotheses. Section 4 introduces the dataset and describes the methodology used in our
empirical analysis. Section 5 reports results as well as interpretations thereof. Section 6
concludes.
2. Motivation and Literature Overview
Research in the field of mutual fund performance has been determined to measure investment
ability for purposes of manager gratuity and to find sustainable superior performance for
future investment. In the process, many biases in performance measurement have been
identified and eliminated by the use of less biased data and more sophisticated methods.
However, performance measurement still struggles with the question which part of the
measured performance is effectively based on the managers' skill and which part is only due
to luck. To motivate our own study on luck versus skill, in this section we first give a
theoretical background and definition of the luck bias in measured performance. Then we
summarize the existing literature on the topic of luck and skill as well as on the related topic
of reverse survivorship bias. Last, we describe to what extent our approach deviates from that
literature and how we contribute to the research on luck and skill in general and on reverse
survivorship bias in particular.
Theoretically, each individual fund j has a specific unknown level of skill represented
by its skill alpha ®j
skill which is assumed to be constant over time. In addition, fund j
experiences in each period t a specific and also unknown true shock "jt with limTj → ∞
E("jt) = 0.
Abnormal return in each period rjt
a can thus formally be represented by:
rjt
a = ®j
skill + "jt. (1)
In limited time, however, a fund's performance might be biased by an overweight of positive
shocks, interpreted as luck, or an overweight of negative shocks, interpreted as bad luck, such
that E("jt) ≠ 0. With ®j
skill and "jt unknown in limited time, the best estimator for skill alpha
is \realized" or \estimated" alpha ®j which is calculated from the returns observed up to the
actual date. Realized performance is therefore not necessarily constant over time and certainly
subject to investors' learning (Linnainmaa, 2013). Fitting a regression like the CAPM to return
observations yields estimated shocks "jt with E("jt) = 0 by construction. Abnormal return rjt
a can
thus alternatively be represented as in Equation 2 where ERjt is the return of fund j in excess of
the risk free rate and ERMt is the market excess return.
rjt
a = ERjt { ¯j ERMt = ®j + "jt (2)

5
Combining both representations in Equation 3 reveals that realized alpha equals skill alpha in
all cases where E("jt) = 0.
®j = t = 1
Tj (rjt
a { "jt)
Tj =
t = 1Tj (®j + "jt)
Tj = ®j
skill + E("jt)
(3)
This is per se true in unlimited time or if positive and negative true shocks "jt coincidentally
balance over limited time. In most cases, however, realized performance will be biased by
E("jt) ≠ 0. Ultimately, luck bias or luck alpha ®j
luck can be represented as:
®j
luck = ®j
skill { ®j = {E("jt). (4)
In practical research, on the other hand, the identification of luck and skill is a great
challenge. One popular approach is analyzing performance persistence to discover repeat
outperformers among mutual funds (e.g. Grinblatt and Titman, 1992; Hendricks et al., 1993;
Brown and Goetzmann, 1995; Elton et al., 1996; Carhart, 1997). In summary, evidence
against performance persistence outweighs. Specifically, most studies find outperformance to
persist at best on the short run. Underperformance, on the other hand, seems to be persistent
over longer horizons. This is consistent with a majority of fund managers possessing no skill,
and only very few managers showing levels of skill that allow them to repeatedly outperform.
However, there is also criticism regarding the adequacy of performance persistence analyses.
The methodology is based on short-term performance measures and results may largely be
based on noise (Fama and French, 2010). Furthermore, the possibility that luck may also
persist (Kosowski et al., 2006) is not recognized but could (partly) explain short-term
persistence in mutual fund performance.
Therefore, several recent studies follow another approach which is based on
assumptions about the nature of true alpha. In a pioneering work for the U.S. equity fund
market, Kosowski et al. (2006) use a bootstrap methodology to identify those alphas created
by skill in the cross-section of realized alphas. Assuming true alpha to be zero, they generate
a distribution of alphas that is based exclusively on sampling variation and compare it to the
distribution of realized alphas. The authors find far more positive and significant alphas than
could be expected from luck alone and conclude that there exists a minority of fund managers
with significant investment skill. Moreover, the authors use the bootstrap to uncover which of
the positive realized alphas are due to luck and which are due to skill. They do not, however,
provide estimates for the magnitude of skill performance. Also, the bootstrap allows inferences
only on alphas in the tails of the cross-section, but not at its center.
Using the Kosowski et al. (2006) methodology, Cuthbertson et al. (2008) report
basically identical results for the UK equity fund market. Layfield and Stevenson (2011)

6
apply the same method to U.S. REITs finding only one manager with significant skill among
a vast majority of unskilled ones. Barras et al. (2010) additionally apply the false discovery
rate by Storey (2002) to estimate fractions of unskilled funds, zero-alpha funds, and skilled
funds in the U.S. equity fund market. They find that, over a long horizon, the majority of
funds (75.4 %) show zero alpha while the proportion of skilled funds is insignificant (0.6 %).
A considerable fraction of managers (24 %) have inferior skill. Sastry (2011) uses a
hierarchical Bayesian model and a mixture-of-normals alpha-distribution to distinguish skill
from luck in the U.S. fund market. He finds that the resulting estimates for alpha exhibit
strong predictability across the entire population of funds, not only in the tails. Also, the
distribution of alpha is fat tailed and the standard deviation of true alpha is underestimated
by the realized performance. Finally, Fama and French (2010) use a differently designed
bootstrap methodology to distinguish between luck and skill in the cross-section of U.S.
equity funds. They show that only very few managers possess enough skill to enhance
expected returns. However, all of these papers also do not provide direct estimates of luck
bias or skill performance on an individual fund level.
Based on the Fama and French (2010) methodology, Linnainmaa (2013) introduces
the concept of reverse survivorship bias which covers a specific part of luck bias: bad luck
resulting in disappearance. Following the argumentation of the paper, reverse survivorship
bias arises if otherwise skilled funds disappear due to bad luck and thus their estimated
alphas do not get a chance to recover towards their true alphas. Consequentially, market level
management skill is understated by the use of survivor-bias-free data. More specifically,
Linnainmaa defines reverse survivorship bias as the difference between estimated alpha and
true alpha. His approach to measuring reverse survivorship bias in the mean is based on a
comparison of two market level aggregations: fund-by-fund (FbF) and fund-of-funds (FoF).
FbF estimates individual alphas over time and averages them cross-sectionally. FoF
calculates monthly average returns and estimates alpha from the resulting time series.
Linnainmaa states that \both methods should yield consistent estimates of the average
alpha", such that any difference is due to the time series of non-survivors being \sometimes
cut short due to more negative than positive errors". In conclusion, the difference between
FoF and FbF performance equals reverse survivorship bias. Linnainmaa reports that the
cross-section of U.S. equity funds is significantly biased by approximately 0.49 % to 0.62 %
p. a. together with a considerable change in the shape of the alpha-distribution. Compared to
recent estimates of annualized survivorship bias of up to 1.5 % p. a. (e.g., Carhart, 2002;
Rohleder et al., 2011), this is also economically relevant. Linnainmaa, too, does not present
measures of reverse survivorship bias and skill performance of individual funds.
We deliver a valuable contribution to this strand of research by being the first to
disentangle luck and skill on an individual fund level to obtain estimates of luck bias and skill

7
performance for every fund. More specifically, our approach corrects performance measures
using information derived from the estimated shocks "jt about the true shocks "jt. Using
accordingly designed fund-specific dummy variables we are able to show that there is
significant luck bias on an individual fund level. Moreover, we find empirical evidence for
Monkey Business by fund families during the time approaching disappearance. As a result,
our estimated skill alpha ®j
skill is a superior measure of the true skill alpha ®j
skill compared to
standard alpha. To show the economic value of our contribution we extensively test for
performance persistence showing that our skill alpha is a better predictor of future performance
than standard alpha. Moreover, our approach is based on readily available data and easy to
implement such that it is of interest for academics and for investors. Furthermore, our
methodology allows measuring each fund's level of skill on a continuous scale between {∞ and
+∞ which is a significant advancement over recent studies using binomial (skill, no skill) or
trinomial scales (positive skill, zero-skill, negative skill), respectively. A detailed description of
this methodology is given in Chapter 3.
Using our findings on the skill performance of individual funds, we also contribute to
the topic of reverse survivorship bias by delivering a realistic estimate of the magnitude of
reverse survivorship bias. Moreover, we correct for erroneous calculations in Linnainmaa
(2013) as, in contrast to the author's assumption, FoF and FbF market level aggregation
yield consistent estimates only if all funds have the same number of observations and cover
the same time period. By definition, survivor-bias-free data as used in both his and our
studies satisfy neither condition. The difference between FoF alpha and FbF alpha then arises
from the relative overweight of short-living funds in the FbF approach. This means that
unlucky disappearances are present in both FbF and FoF such that both suffer from the bias.
Even more importantly, the time series of many funds are short due to reasons besides bad
luck. In this context Rohleder et al. (2011) show that non-survivors consistently
underperform survivors during their last four years. Thus, the difference is majorly due to
inferior skill and therefore does not represent reverse survivorship bias.
Finally, we also contribute to market level performance measurement in general by
using a new \meta-bootstrap" that allows consistent significance levels for FoF and FbF
alphas. Specifically, the method corrects for the fact that FoF generally overestimates
diversification between the funds and FbF underestimates inter-fund-dependencies. More
importantly, the meta-bootstrap thereby allows realistic significance levels for estimates of
market level alpha biases like survivorship bias, reverse survivorship bias and luck bias. A
detailed description of the meta-bootstrap is given in Chapter 4.

8
3. Measuring Skill Performance and Research Hypotheses
In this section we first define \skill" and \luck". We then develop and describe in detail our
approach to correcting the estimated performance of individual funds for luck bias. This part
further divides into two separate corrections using different sources of information and
borrowing from different strands of literature. In the process of describing our methodology,
we formulate five distinct research hypotheses for our empirical analysis.
We define skill and luck as follows: On the one hand, a manager's skill creates
sustainable performance by using long-term strategies and developing repeatable investment
ideas. On the other hand, the dictionary definition of luck reads \events that are beyond
control and seem subject to chance".1 In the mutual fund context, such events can be
established by exceptionally high or exceptionally low returns that occur rarely, do not match
the general long-term strategy or character of the fund, cannot be predicted and therefore
cannot be replicated on purpose. In addition, we also consider actions or influences disguising
the true skill of the manager as (bad) luck. Such influences are, for example, fund families
doing \Monkey Business" with designated graveyard funds. Anecdotal evidence suggests that
they might engage in asset stripping, shift bad assets from other family funds into the
disappearing fund or, more generally, deviate from the stated long-term investment objective
because \no one really cares anymore".
Regarding individual fund performance, our baseline performance measure is the
standard Carhart (1997) 4-factor model as it is the widest spread model to date and risk
factors are readily available over long horizons to everyone, including investors, from Kenneth
French's online data library. In the following, we refer to the uncorrected Carhart alpha as
the realized alpha ®j of the fund. It is represented by
ERjt = ®j + ¯1j ERMt + ¯2j SMBt + ¯3j HMLt + ¯4j MOMt + "jt (5)
where SMBt is the return on a zero-investment portfolio capturing the size effect, HMLt is
the return on a zero-investment portfolio capturing the value effect (Fama and French, 1993),
and MOMt is the return on a zero-investment portfolio capturing the momentum effect (e.g.,
Jegadeesh and Titman, 1993).
Our approach to correcting realized performance for luck bias is based on adding
dummy variables to the baseline model. In general, our luck-correction-model can thus be
represented by Equation 6a where Dj is the matrix of fund-specific dummy variables and @j is
the corresponding vector of coefficients.
1 http://www.collinsdictionary.com, 13.09.2012.

9
ERjt = ®j
skill + ¯1j ERMt + ¯2j SMBt + ¯3j HMLt + ¯4j MOMt + @j Dj + "jt (6a)
The fund's abnormal return can therefore be represented as in Equation 6b. Consequentially,
after the luck bias correction, E(®j
luck + "jt) is a more realistic estimator for E("jt) ≠ 0 such
that, ultimately, ®j
skill is a better estimator for the true skill performance ®j
skill.
rjt
a = ®j
skill + @j Dj + "jt = ®j
skill + ®j
luck + "jt (6b)
Our first specific luck-correction is based on the concept of reverse survivorship bias.
According to Linnainmaa (2013) it is caused by \the correlation between the performance-
evaluation regression's error term and survival" which arises \due to more negative than
positive errors". Disappearance can thus be regarded as an omitted variable. Therefore,
estimated performance is systematically biased by a temporary downward level shift, a
negative luck alpha, caused by bad luck during the time approaching disappearance. To
correct for this temporary level shift, we construct fund-specific dummy variables that equal 1
when the fund approaches disappearance and 0 while it survives. This methodology closely
relates to Grundy and Martin (2001) who estimate stock alphas for different timeframes
within a stock's time series using chronologically disjoint dummy variables instead of a global
constant. In contrast to Grundy and Martin, however, we do use a global constant capturing
the fund-specific ®j
skill plus an additional timeframe-specific constant ®j
luck captured by the
dummies and representing the correlation between the fund's error terms and disappearance,
hence the reverse survivorship bias.
To constitute the timeframe \approaching disappearance" we refer to results from
previous studies analyzing the determinants of fund disappearance. For U.S. equity funds,
Rohleder et al. (2011) show that non-survivors significantly underperform in the last four
years before they disappear, implying that underperformance of non-survivors is systematic in
general. However, the highest underperformance on average occurs in the second to last year
(Tj{2yr). Moreover, the probit analysis in Rohleder et al. (2011) shows, that the impact of
returns on disappearance is economically significant during the last two years. These results
are consistent with comparable studies by Brown and Goetzmann (1995) and Zhao (2005) as
well as with results for U.K. equity funds by Blake and Timmermann (1998). We interpret
these results such that it takes approximately one year (Tj{1yr) to execute the dissolving of
the fund after the decision thereto is made based on severe underperformance in year Tj{2yr.
Consequentially, we use two dummies: Decision which is 1 in each month of year Tj{2yr, and
Execution which is 1 in each month of year Tj{1yr. Negative and significant dummy-deltas
thus imply that underperformance is (at least partly) due to bad luck or Monkey Business
while positive or insignificant dummy-deltas suggest that underperformance is due to inferior

10
skill. In the following, we refer to the first luck-correction-model represented by Equation 7 as
\D&E".
ERjt = ®j
skill + ¯1j ERMt + ¯2j SMBt + ¯3j HMLt + ¯4j MOMt
+ @1j Decisionjt + @2j Executionjt + "jt
(7)
Research Hypothesis 1: When exclusively using the D&E correction, we will find
more individual funds with negative than positive deltas as well as negative market
level deltas. As a consequence, the market level skill performance of U.S. equity fund
managers will be higher than their realized performance, implying a positive luck bias {
or in this case: reverse survivorship bias.
However, thus far the dummies only capture luck in the errors of disappeared funds because
there are no timeframes approaching disappearance for survivors. This is unsatisfying because
the skill performance of non-survivors does not yield the possibility of identifying superior
future investments and is therefore only of academic interest. To add economic value for
investors, our second correction considers luck independent of disappearance. We therefore
follow approaches used by Chan and Lakonishok (1992) as well as Martin and Simin (2003)
to estimating robust CAPM-betas in the U.S. stock market by identifying outliers in stock
returns. Closely matching the dictionary definition of luck, outliers are defined as
observations that are numerically distant from the rest of the data (Barnett and Lewis, 1994).
They occur very rarely, seemingly by chance and are thus not systematic. Moreover, following
Cook (1977) an outlier is an observation which is highly influential to the outcome of a linear
regression. Consequentially, outliers disguise the true sustainable long-term character of the
data, in our case the investment skill of the fund.
In contrast to Martin and Simin (2003), however, we apply outlier identification only
to the baseline model errors instead of excess returns in order to identify the influences that
are in addition to the long-term character of the fund which is represented by its model
returns. Moreover, we do not reject (remove data points) or winsorize identified outliers (alter
data by cutting the errors down to a certain value). Instead, we use the mean shifting outlier
model-approach from Cook and Weisberg (1982) which involves the creation of dummies,
thereby maintaining the information about luck included in the outliers. More specifically, we
apply Cook's Distance (Cook, 1977) to the error terms of the baseline model. Cook's Distance
measures the effect of eliminating each observation separately from the data to identify those
with the highest influence, or leverage, on the regression outcome. With the outliers identified
by this method, we construct two new dummy variables. The first dummy equals 1 in all
cases of positive outliers and is therefore titled Luck. The second dummy equals 1 in all case

11
of negative outliers and is therefore titled BadLuck. By construction, Luck delta is always
positive and BadLuck delta is always negative. Thus, if Luck delta is higher than the
absolute of BadLuck delta, this can be interpreted as the respective fund experiencing more
lucky true shocks than unlucky true shocks during the sample period, and vice versa. In the
following, we refer to our second luck-correction-model represented in Equation 8 as \L&B".
ERjt = ®j
skill + ¯1j ERMt + ¯2j SMBt + ¯3j HMLt + ¯4j MOMt
+ @3j Luckjt + @4j BadLuckjt + "jt. (8)
Our expectations regarding L&B correction results are also based on Linnainmaa (2013) but
this time we argue against it. Because lucky survival of otherwise inferior funds is not
punished in a similar fashion as bad luck is sometimes punished by disappearance, there
should be slightly more lucky true shocks in the errors of survivors. Consequentially, the
performance of survivors should be systematically overstated by luck bias.
Research Hypothesis 2: When exclusively using the L&B correction, we will find
more lucky events per fund than unlucky events. On market level, there will be a higher
Luck delta. As a result, market level skill performance will be lower than realized
performance. Ultimately, we will find a negative luck bias contradicting Linnainmaa's
reverse survivorship bias.
In our final correction model, we use both pairs of dummies to consider both sources of
information: correlations between error terms and disappearance as well as outliers over the
whole survival period. The dummies are not mutually exclusive, meaning that L&B outliers
can also occur during the D&E periods. This could decrease the significance of the deltas in
these particular cases. However, the model should be very effective in using the available
information to disentangle the performance created by a manager's skill from luck. In the
following, we refer to the luck-correction-model represented in Equation 9 as the \full model".
ERjt = ®j
skill + ¯1j ERMt + ¯2j SMBt + ¯3j HMLt + ¯4j MOMt
+ @1j Decisionjt + @2j Executionjt + @3j Luckjt + @4j BadLuckjt + "jt. (9)
Research Hypothesis 3: When using the full model, we will see that both
corrections (partly) offset each other such that the resulting market level performance is
between the results of D&E and L&B. We will further find the resulting luck bias to be
very small and economically irrelevant.
Thus far, the stated research hypotheses only refer to market level skill performance and luck
bias while the great strength of our paper compared to the existing literature is the possibility
of estimating skill performance on individual fund level. Unfortunately, it is unpractical to
discuss individual performance of nearly 4,000 funds in one paper. We therefore compare fund

12
rankings based on different performance estimates to analyze if individual funds suffer
significantly from luck bias. Moreover, the related literature regularly analyzes distributions of
different performance estimates in the cross-section of funds to gain ideas on the proportion of
skilled funds compared to unskilled funds. We also conduct such an analysis to compare our
findings to those in the related literature.
Research Hypothesis 4: There is significant impact of luck bias on the performance
estimates of individual funds. Specifically, we will find significant changes in fund
rankings and in the shape of the alpha distribution when correcting estimated alpha for
luck bias.
In summary, we expect our corrected measure of skill performance to capture the long-term
sustainable character of funds better than standard performance measures. If this is true and
not just a statistical artifact, skill performance should be a better predictor of future
performance than realized performance. Moreover, we expect significant rank changes when
using our correction models. Therefore, we analyze performance persistence based on skill
performance and compare it to measures of performance persistence based on standard
performance to add economic value to our findings.
Research Hypothesis 5: We will find a higher degree of performance persistence
when using skill alpha to rank the funds during the ranking period. Specifically, there
will be higher rank correlations between ranking and holding periods and,
consequentially, higher returns to investment strategies based on skill performance.
4. Data and Methodology
In Part A. of this section, we describe our dataset, which data sources we use, our data
selection procedure, and how we treat certain data problems. We also present summary
statistics on our final dataset. In Part B. we describe the methodology used in our empirical
analysis. The part divides into descriptions of our approaches to analyzing Monkey Business,
of measuring market level performance including the meta-bootstrap, and of our approach to
analyzing performance persistence.
A. DATA
We use market excess returns, the Fama and French (1993) equity risk factors, the
momentum factor, and returns on the one-month U.S. Treasury bill from the Kenneth R.
French data library. We obtain mutual fund data from the CRSP survivor-bias-free mutual
fund database. Our dataset covers the time period from 01/1993 through 03/2013. We limit

13
our dataset to actively managed funds consistently classified as U.S. non-sector domestic
equity funds by CRSP objective codes. We eliminate funds with missing return values as well
as those without any size or expense ratio data. For funds with fragmentary TNA, we apply a
missing values approach based on Rohleder et al. (2011) which is further described in the
Appendix. Different share classes of a fund are combined on portfolio level using CRSP
portfolio numbers and manually matched fund names.2 As we estimate performance measures
for individual funds and due to our special methodology it is of crucial importance that our
regression estimates are reasonably reliable. Therefore, we exclude all funds with less than 48
months of returns. This introduces some survivorship bias to the sample. Our results
therefore underestimate survivorship bias to some extent. Our final sample contains a total of
3,802 funds of which 2,213 are end-of-sample survivors and the remaining 1,589 funds are
non-survivors.
[Insert Table I and Figure 1 here.]
Table I shows summary statistics for the survivor-bias-free dataset with 484,492 monthly
observations and for the survivor-biased sub-sample with 314,189 monthly observations. The
industry size at the end of our sample period equals almost 3.4 trillion USD. Figure 1 shows
the development of the survivor-bias-free sample in terms of industry size and the number of
funds over the sample period. Survivors are generally larger than non-survivors. Within the
groups, however, the median size is distinctly lower than the mean such that the industry
consists of a large number of small and medium funds and a small number of exceptionally
large funds. Regarding returns, survivors show higher returns in general, which is not very
surprising (e.g., Carhart et al., 2002). Also, value-weighted returns are lower than equal-
weighted returns suggesting that smaller funds have lower returns on average (e.g., Rohleder
et al., 2011). Expense ratios are slightly lower for survivors and with value-weighting. The
equal-weighted fund age in our dataset is just above 100 months. Value-weighted, however,
the average fund age is around 200 months which suggests that large funds also survive over
longer periods than smaller funds (e.g., Rohleder et al., 2011).
B. METHODOLOGY
B.1. Monkey Business
In the following, we describe our method of testing our idea of fund families doing monkey
business with designated graveyard funds. Specifically, we test for all 1,589 non-survivors in
2 Share class returns and expense ratios are value-weighted within the fund. Fund size is the aggregate of all
share classes. The investment objective is determined by the largest share class. Fund age is determined by the
oldest share class.

14
our sample whether the Carhart factor betas differ significantly between the periods
approaching disappearance compared to their baseline-betas. Therefore, we extend Equation 7
by interaction terms between the Carhart factors and the D&E dummies. A similar approach
is used in Grundy and Martin (2001) to construct beta-momentum portfolios. Equation 10
can thus be used to estimate baseline betas ¯j
Base plus additional timeframe-specific
disappearance betas ¯j
Deci and ¯j
Exec. If the timeframe-specific betas are significant, this can be
interpreted as funds differing from their stated long-term objective when approaching
disappearance which is an indication of monkey business.
ERjt = ®j
+ @1j Decisionjt + @2j Executionjt
+ ¯1j
Base ERMt + ¯1j
Deci Decisionjt×ERMt + ¯1j
Exec Executionjt×ERMt
+ ¯2j
Base SMBt + ¯2j
Deci Decisionjt×SMBt + ¯2j
Exec Executionjt×SMBt
+ ¯3j
Base HMLt + ¯3j
Deci Decisionjt×HMLt + ¯3j
Exec Executionjt×HMLt
+ ¯4j
Base MOMt + ¯4j
Deci Decisionjt×MOMt + ¯4j
Exec Executionjt×MOMt + "jt
(10)
B.2. Market Level Performance
On the market level, we present results for fund-by-fund aggregation and fund-of-funds
aggregation because both have advantages and disadvantages with respect to different aspects
of our empirical analysis. On the one hand, statistics on dummy deltas are best documented
by FbF as these occur exclusively on the individual fund level. On the other hand, FoF is the
generally more accurate measure of market level performance as it weights funds correctly
regarding their time series lengths. Furthermore, with FoF it is possible to value-weight fund
returns by the correct beginning of month size without inducing forward-looking bias.
However, it is not a straight-forward exercise to calculate luck-corrected FoF measures
because the dummy variables are specific to individual funds which makes it impossible to
apply Equations 7, 8, and 9 directly to FoF time series. Therefore, we first estimate corrected
models for individual funds in order to generate corrected returns ER ^
jt
corr for each fund as
represented in Equation 11. These corrected returns can then be aggregated in the respective
FoF portfolios such that skill performance can be estimated using the standard Carhart
model.
ER ^
jt
corr = ERjt { @j Dj
= ®j
skill + ¯1j ERMt + ¯2j SMBt + ¯3j HMLt + ¯4j MOMt + "jt
(11)
15
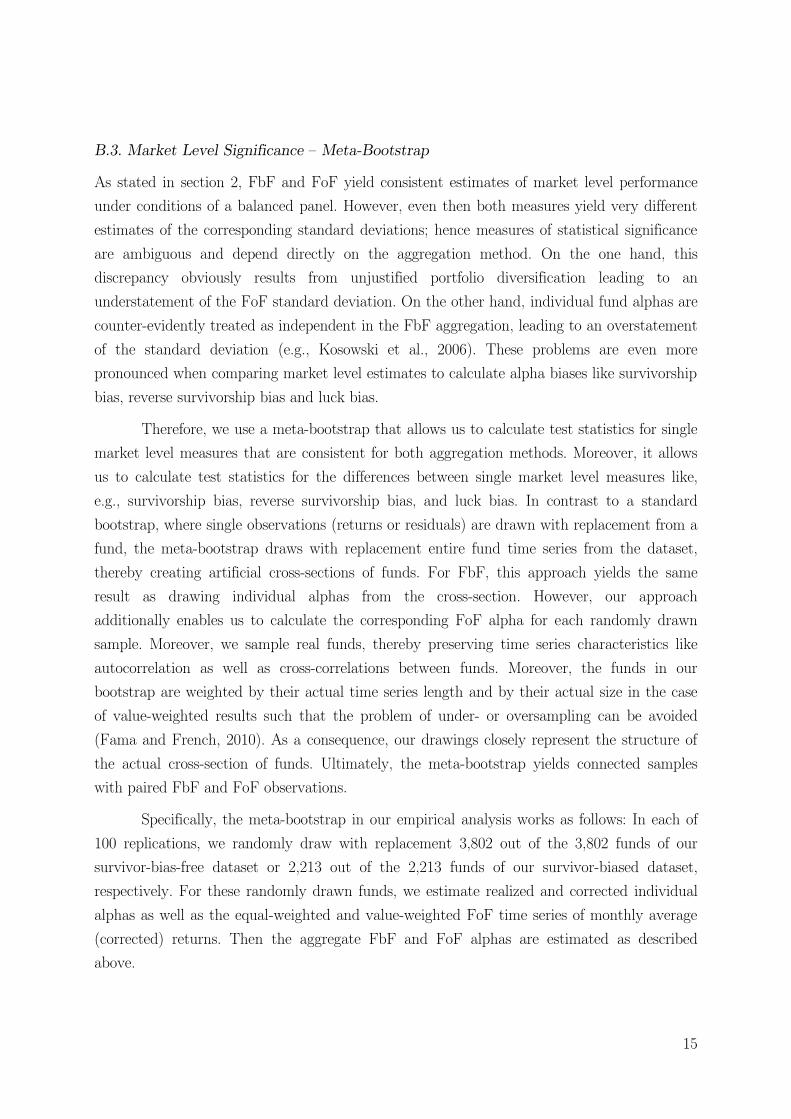
B.3. Market Level Significance { Meta-Bootstrap
As stated in section 2, FbF and FoF yield consistent estimates of market level performance
under conditions of a balanced panel. However, even then both measures yield very different
estimates of the corresponding standard deviations; hence measures of statistical significance
are ambiguous and depend directly on the aggregation method. On the one hand, this
discrepancy obviously results from unjustified portfolio diversification leading to an
understatement of the FoF standard deviation. On the other hand, individual fund alphas are
counter-evidently treated as independent in the FbF aggregation, leading to an overstatement
of the standard deviation (e.g., Kosowski et al., 2006). These problems are even more
pronounced when comparing market level estimates to calculate alpha biases like survivorship
bias, reverse survivorship bias and luck bias.
Therefore, we use a meta-bootstrap that allows us to calculate test statistics for single
market level measures that are consistent for both aggregation methods. Moreover, it allows
us to calculate test statistics for the differences between single market level measures like,
e.g., survivorship bias, reverse survivorship bias, and luck bias. In contrast to a standard
bootstrap, where single observations (returns or residuals) are drawn with replacement from a
fund, the meta-bootstrap draws with replacement entire fund time series from the dataset,
thereby creating artificial cross-sections of funds. For FbF, this approach yields the same
result as drawing individual alphas from the cross-section. However, our approach
additionally enables us to calculate the corresponding FoF alpha for each randomly drawn
sample. Moreover, we sample real funds, thereby preserving time series characteristics like
autocorrelation as well as cross-correlations between funds. Moreover, the funds in our
bootstrap are weighted by their actual time series length and by their actual size in the case
of value-weighted results such that the problem of under- or oversampling can be avoided
(Fama and French, 2010). As a consequence, our drawings closely represent the structure of
the actual cross-section of funds. Ultimately, the meta-bootstrap yields connected samples
with paired FbF and FoF observations.
Specifically, the meta-bootstrap in our empirical analysis works as follows: In each of
100 replications, we randomly draw with replacement 3,802 out of the 3,802 funds of our
survivor-bias-free dataset or 2,213 out of the 2,213 funds of our survivor-biased dataset,
respectively. For these randomly drawn funds, we estimate realized and corrected individual
alphas as well as the equal-weighted and value-weighted FoF time series of monthly average
(corrected) returns. Then the aggregate FbF and FoF alphas are estimated as described
above.

16
To draw inferences on the significance of single market level measures, we calculate t-
statistics from mean meta-bootstrapped alpha (®{ b) divided by the corresponding standard
deviation of bootstrapped alphas (s®b).
tb = ®{ b
s®b (12)
T-statistics for estimates of survivorship bias are calculated based on the test for differences
between the means of two unconnected samples, hence as the difference between the means of
survivor-biased and survivor-bias-free alphas divided by the square root of added variances.
tb = ®{ SB
b – ®{ SBfree
b
s®SB
b 2 + s®SBfree
b 2 (13)
T-statistics for estimates of reverse survivorship bias and luck bias are calculated based on
the test for differences in the means of two connected samples, hence from mean and
standard deviation of the differences between paired skill and realized alphas. In either case,
two-sided p-values (pb) are calculated as the corresponding quantiles of Student's t-
distribution with 100 degrees of freedom.
tb = ®j
b,skill – ®j
b |||||
s(®j b,skill – ®j
b) (14)
B.4. Performance Persistence
As our measures of skill performance aim at identifying the sustainable character of a fund,
we are interested in the long-term persistence of our measures despite the general assumption
that performance persists at best on the short run (e.g., Brown and Goetzmann, 1995;
Carhart, 1997). To test this, we estimate Spearman's rho (½) and Kendall's tau (¿) rank
correlations between different ranking periods and the following holding periods. Then we
compare rank correlations based on skill alpha to rank correlations based on realized alpha to
test whether skill alpha discriminates better between future out- and underperformers. For
this test, we exclusively use the L&B-correction to calculate skill alpha because D&E
dummies, by nature, do not cover the ranking period of such a test and require knowledge of
future information. More specifically, we calculate L&B and realized alphas for growing long-
term ranking periods starting in January of 1993 and ending in March of each year from 2003
through 2009, respectively. Then we calculate the respective L&B and realized holding period
alphas over the following 48 months and compare the respective ranks. We chose these sub-
period definitions to ensure maximum use of our sample period. Moreover, separating ranking

17
and holding periods between March and April reduces truncation by end-of-calendar-year
window dressing. L&B dummies are calculated specifically for each sub-period to avoid
forward-looking bias. We require funds to have at least 48 monthly observations during either
period to ensure that estimation results are reasonably reliable and represent the long-term
character of the fund. Further, to test whether these results are of economic value we
separately calculate realized alphas of equal-weighed \High" (best 20 %) and \Low" portfolios
(worst 20 %) for all 48-month holding periods.
We are aware of the fact that the requirement of 48 months survival during the
holding periods potentially induces look-ahead survivorship bias to our performance
persistence tests due to the use of future knowledge (e.g., ter Horst et al., 2001). However,
both realized and L&B alpha suffer equally from the bias such that performance persistence
in general might be overstated but the difference between realized and L&B rankings remains
unbiased. However, to test for robustness of our results, we calculate correlations based on
realized alphas for holding periods of 12 months, thereby substantially reducing look-ahead
bias at the expense of noisier holding period alphas. Accordingly, we extend the ranking
periods until March 2012 for this part of the test. In a further step, we eliminate look-ahead
bias completely by showing realized performance of High and Low portfolios over 48-month
holding periods dropping the requirement of survival. In addition, we also calculate
cumulative alphas and time series alphas of yearly rebalanced High and Low portfolios to add
further robustness to our results and to gain further insight into the short-term persistence of
our skill alpha.
5. Empirical Results
This section reports results from our empirical analysis. It is organized based on the order of
the research hypotheses we formulate in section 2. Therefore, we first present results on
Monkey Business and market level performance, survivorship bias and luck bias. Then we
present results on individual fund level. Finally, we present the results regarding performance
persistence.
A. MARKET LEVEL PERFORMANCE AND LUCK BIAS
A.1. Monkey Business
Before testing our Research Hypothesis 1 that there exists a positive reverse survivorship
bias, we test for evidence of Monkey Business. In that context, Table II reports average factor
loadings and the number of funds with significant interaction-betas calculated by Equation

18
10. The results clearly show that during the time approaching disappearance, factor betas
differ significantly for a considerable number of funds. This is especially the case for HML
where baseline beta is slightly positive suggesting a tendency to investing in value stocks.
Interaction-betas, on the other hand, are distinctly negative for a large number of funds such
that total betas are also negative, which is more consistent with a growth strategy. The
results in the last column show, that the majority of funds with significant changes in factor
loadings are also the ones with significant corrections regarding realized alpha. Overall, we
therefore consider our assumption confirmed that some fund families do Monkey Business
with designated graveyard funds.
[Insert Table II here.]
A.2. Reverse Survivorship Bias { D&E Correction
After confirming that Monkey Business plays a role in disguising skill when approaching
disappearance we now test whether our Research Hypothesis 1 holds that some funds
disappear due to bad luck biasing market level estimated performance downwards. In that
context, Panel a. of Table III reports estimates of market level net-of-fee performance. As a
first finding, all equal-weighted survivor-bias-free performance measures are negative and
statistically significant which is in line with the general perception that active fund
management on average does not add value for investors. Survivor-biased performance is also
negative but statistically insignificant, also in line with general perception. Value-weighted
results are negative but generally closer to zero and therefore also insignificant. For further
insight, realized performance serves as a reference point to which corrected skill performance
measures can be compared. The D&E results clearly indicate higher skill alpha compared to
realized alpha. Moreover, we observe more individual funds with a positive and significant
alpha and fewer funds with a negative and significant alpha when correcting for bad luck.
The FbF standard deviation of corrected alphas (≈ 1 % p.a.) is higher than that of realized
alphas (0.86 % p.a.) which is in accordance with findings by Sastry (2011) who reports that
realized performance underestimates standard deviation. Linnainmaa finds a standard
deviation of true alpha that is even higher than ours (2.1 % p.a.). Fama and French (2010)
report an annual standard deviation of true alpha in the range from 1.25 % to 1.5 %. Panel b.
of Table III reports gross-of-fee performance. The relations between the alphas are basically
the same.
[Insert Table III here.]
Further, the FbF results show that D&E dummy deltas are negative on average. We also
obtain more negative and significant than positive and significant individual dummy deltas.

19
The frequencies of negative and significant deltas are roughly 10 % with 157 (Execution) and
164 (Decision) out of 1,589 disappeared funds. We interpret these 10 % such that we are not
catching a systematic effect and that these funds are the ones disappearing because they were
unlucky. Figure 2 visualizes this finding by showing how our survivor-bias-free sample divides
into survivors and different non-survivor groups over time. Non-survivors in general are
displayed as the cumulative number of funds disappearing prior to a respective date.
Unskilled non-survivors are defined by having positive or insignificant D&E dummy deltas.
Unlucky non-survivors are those with negative and significant D&E dummy deltas and are
displayed as the difference between the dotted and dashed lines in the right graph. The figure
shows that the number of unlucky non-survivors is only a small fraction of the total non-
survivors, suggesting that reverse survivorship bias is small.
[Insert Figure 2 here.]
Table IV shows estimates of the different alpha biases corresponding to the performance
measures presented in Table III. Specifically, we present estimates of survivorship bias as a
reference for reverse survivorship bias. The results show that equal-weighted survivorship bias
is significant with approx. 0.7 % p.a. As expected, this is lower than recent estimates of up to
1.5 % p.a. due to our selection criteria (e.g. Carhart et al, 2002; Rohleder et al., 2011). Value-
weighted survivorship bias is about half as high with 0.33 % p.a. which is expected because
non-survivors are relatively smaller than survivors. Moreover, value-weighted results also
account for the fact that money outflows from underperforming funds might show up as
inflows to outperforming funds.
[Insert Table IV here.]
Our estimate of reverse survivorship bias (D&E luck bias) is positive and significant as
predicted. However, the annualized reverse survivorship bias with 0.2884 % p.a. (FbF) is less
than half in magnitude compared to the 0.62 % p.a. estimated by Linnainmaa (2013). Value-
weighted, FoF reverse survivorship bias is in fact very small with less than 4 basis points p.a.
such that it is economically irrelevant. These findings on the one hand confirm our Research
Hypothesis 1 by showing a positive and significant reverse survivorship. On the other hand,
they prove that Linnainamaa overestimates its economic significance. Also, it supports our
previous findings that only a small fraction of up to 10 % disappears due to bad luck such
that reverse survivorship bias is in general very small.
A.2. Luck Bias Independent of Disappearance { L&B Correction
Pursuing Research Hypothesis 2, we discuss in this sub-section the results for performance
corrected for lucky and unlucky events unrelated to disappearance. Specifically, we
20
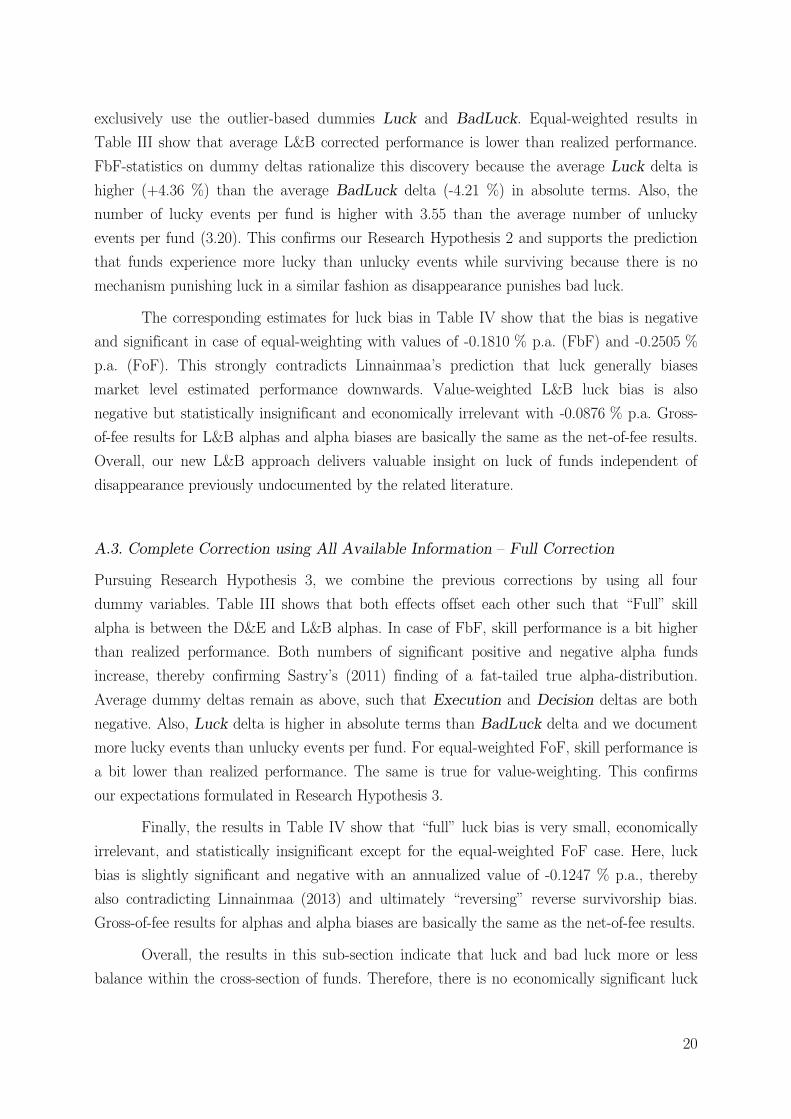
exclusively use the outlier-based dummies Luck and BadLuck. Equal-weighted results in
Table III show that average L&B corrected performance is lower than realized performance.
FbF-statistics on dummy deltas rationalize this discovery because the average Luck delta is
higher (+4.36 %) than the average BadLuck delta (-4.21 %) in absolute terms. Also, the
number of lucky events per fund is higher with 3.55 than the average number of unlucky
events per fund (3.20). This confirms our Research Hypothesis 2 and supports the prediction
that funds experience more lucky than unlucky events while surviving because there is no
mechanism punishing luck in a similar fashion as disappearance punishes bad luck.
The corresponding estimates for luck bias in Table IV show that the bias is negative
and significant in case of equal-weighting with values of -0.1810 % p.a. (FbF) and -0.2505 %
p.a. (FoF). This strongly contradicts Linnainmaa's prediction that luck generally biases
market level estimated performance downwards. Value-weighted L&B luck bias is also
negative but statistically insignificant and economically irrelevant with -0.0876 % p.a. Gross-
of-fee results for L&B alphas and alpha biases are basically the same as the net-of-fee results.
Overall, our new L&B approach delivers valuable insight on luck of funds independent of
disappearance previously undocumented by the related literature.
A.3. Complete Correction using All Available Information { Full Correction
Pursuing Research Hypothesis 3, we combine the previous corrections by using all four
dummy variables. Table III shows that both effects offset each other such that \Full" skill
alpha is between the D&E and L&B alphas. In case of FbF, skill performance is a bit higher
than realized performance. Both numbers of significant positive and negative alpha funds
increase, thereby confirming Sastry's (2011) finding of a fat-tailed true alpha-distribution.
Average dummy deltas remain as above, such that Execution and Decision deltas are both
negative. Also, Luck delta is higher in absolute terms than BadLuck delta and we document
more lucky events than unlucky events per fund. For equal-weighted FoF, skill performance is
a bit lower than realized performance. The same is true for value-weighting. This confirms
our expectations formulated in Research Hypothesis 3.
Finally, the results in Table IV show that \full" luck bias is very small, economically
irrelevant, and statistically insignificant except for the equal-weighted FoF case. Here, luck
bias is slightly significant and negative with an annualized value of -0.1247 % p.a., thereby
also contradicting Linnainmaa (2013) and ultimately \reversing" reverse survivorship bias.
Gross-of-fee results for alphas and alpha biases are basically the same as the net-of-fee results.
Overall, the results in this sub-section indicate that luck and bad luck more or less
balance within the cross-section of funds. Therefore, there is no economically significant luck

21
bias in market level realized performance measures such that the standard Carhart model is a
good estimator for market level skill performance.
B. INDIVIDUAL FUND PERFORMANCE
B.1. Rank Correlations between Realized and Skill Performance
Besides the fact that average market level performance is not biased by luck, the results in
the previous section indicate that individual funds might indeed be significantly biased by
luck because dummy deltas are significant for considerable numbers of funds and the
frequencies of significant alphas increase. Being the key strength of our paper compared to
the related literature, our luck bias corrections allow us to analyze the actual skill
performance of individual funds. As it is unpractical to present results for 3,802 individual
funds, our Research Hypothesis 4 states that fund rankings change significantly when using
skill performance measures. Therefore, Table V reports correlation coefficients between
individual realized and corrected performance estimates. Specifically, it shows standard
correlations as well as Spearman's rho (½) and Kendall's tau (¿) rank correlations. The later
not only considers that ranks are different but also the distance between the ranks, thereby
giving higher weight to larger rank changes. In general, the results show that both corrections
significantly change the ranks of individual funds. Moreover, the correction by D&E causes
higher rank changes (¿) supporting our finding that some funds disappear due to bad luck.
Overall, these rank changes confirm our hypothesis that individual performance is
significantly affected by luck. Results on net and gross returns are basically the same.
[Insert Table V here.]
B.2. Distribution of Individual Alphas
Another way of testing Research Hypothesis 4 regarding the impact of luck bias on the
performance of individual funds is to compare distributions of different alpha estimates in the
cross-section of funds. This also resembles the existing literature on luck and skill, where the
distribution of realized alpha in the cross-section of funds is regularly compared to
hypothetical true-alpha distributions based on different assumptions, bootstraps and
simulations (e.g., Kosowski et al., 2006; Fama and French, 2010; Sastry, 2011). Specifically,
we compare fractions of funds performing above and below certain levels of annualized alpha
measured by our different realized and skill models. In Table VI, \All" counts all funds
regardless of the significance of alpha while \**" counts only funds where alpha is statistically
significant based on a Newey and West (1987) HAC-consistent p-value of at least 5 %. Panel
a. shows results for net-of-fee returns. The numbers on all alphas indicate that the majority of

22
funds (63-69 %) show negative performance, irrespective of the measure. However, there are
also at least 30 % of funds with a positive alpha.
[Insert Table VI here.]
Looking at the significant-only alphas shows that the fractions of funds above certain levels
reduce dramatically such that only 1.95 % of all funds significantly exceed a realized alpha of
1 % p.a. Correcting alpha with D&E leads to an upward shift which is in accordance with
Linnainmaa's prediction of funds disappearing due to bad luck. Moreover, it leads to a wider
alpha-distribution which is also visible in Table III where D&E alpha shows a larger standard
deviation. The L&B correction leads to a downward shift combined with slight narrowing of
the alpha distribution due to the elimination of outliers in the errors (see also the standard
deviation Table III). Looking at the full model reveals that the level of the distribution is
comparable to the realized alpha distribution but with slightly fatter tails. This is in
accordance with Kosowski et al. (2006), Fama and French (2010), and Sastry (2011) who
report that the true alpha distribution is wider and has fatter tails than the distribution of
estimated alpha. Moreover, we find a considerable fraction of 17 % of funds with a significant
and negative performance and a very large fraction of 79 % with zero skill. These numbers
closely correspond to respective fractions of 24 % and 75 % reportet by Barras et al. (2010).
However we also find that 4.10 % of funds deliver a positive and significant alpha above 1 %
p.a. which is in line with findings of Kosowski et al. (2006).
Panel b. of Table VI reports gross-of-fee performance fractions. Generally, the results
are the same as above but, as expected, with an upward shift of the distribution. The
distributions are now more or less centered on zero with a slightly higher weight above.
Bearing in mind that our sample slightly suffers from survivorship bias due to the 48 months
survival criterion this further confirms that the mutual fund market as a whole is a zero sum
game before costs. Overall, the tests in this section confirm our Research Hypothesis 4 that
luck bias significantly affects individual performance measures. Moreover, using our new
approach to correcting individual fund performance for luck bias, we deliver a valuable
contribution to the related literature by confirming many of their findings which were based
on hypothetical assumptions about the nature of true alpha.
C. PERFORMANCE PERSISTENCE
In the previous sections of our empirical study, we document that while luck and bad luck
balance within the cross-section of mutual funds, individual fund performance is significantly
suffering from luck bias. This leads to changes in fund rankings and in the distribution of
alpha. To verify the economic implications of our findings, in this sub-section we extensively

23
test whether the predictive power of our corrected skill performance measures is higher than
that of standard performance measures. Specifically, our Research Hypothesis 5 states that
measures of performance persistence based on skill performance should be higher than those
based on realized performance if our corrected measures better approximate the long-term
investment skill of individual managers. To test our hypothesis we conduct performance
persistence analyses using L&B skill performance in comparison to analogous analyses using
standard realized performance.
Panel a. of Table VII shows rank correlations between growing long-term ranking
periods and long-term 48-month holding periods. As a first finding, all correlations are
positive, many even significant. The results for net-of-fee performance further indicate that
rank correlations based on skill alphas are higher than those based on realized alphas in the
majority of sub-periods. Overall, we consider these results prove that our L&B corrected skill
alpha is better in measuring sustainable long-term manager skill as it is a better predictor of
future performance than the standard realized alpha. In case of gross-of-fee performance,
correlations are slightly lower and for few sub-periods correlations are higher for realized
ranking alphas. This could be due to persistent differences in fees which will show in net-
returns but not in gross-returns. However, investors observe net-returns rather than gross-
returns. As both are only slightly different, we focus on net-of-fee results in the following.
[Insert Table VII. here.]
Now, to test if these results are also economically relevant, Panel b. of Table VII reports
realized 48-month holding period performance of equal-weighted \High" and \Low" portfolios
for the ranking and holding periods in Panel a. Net return results clearly indicate that High
portfolios always outperform Low portfolios creating a positive High-Low return. Moreover,
L&B-High portfolios always outperform realized-High portfolios while L&B-Low portfolios
always underperform realized-Low portfolios. The premium to a zero-investment L&B-High-
minus-Low portfolio is therefore up to 0.6 % p.a. higher than the premium to a realized High-
minus-Low portfolio. This means that L&B skill alpha more effectively discriminates between
future outperformers and future underperformance. Our approach thus adds significant
economic value.
To check for any impact of look-ahead bias, Panel c. of Table VII shows correlations
based on realized alphas for much shorter 12-month holding periods, thereby accepting noisier
holding period alphas. Net-of-fee results show that rank correlations are still positive and
comparable in magnitude to the results in Panel a. in 9 out of 10 sub-periods. Moreover, L&B
ranking alphas show higher rank correlations than realized ranking alphas in 8 out of 10 sub-
periods. This means that our general persistence results are not systematically overstated by
24
look-ahead bias. Furthermore, it means that our L&B correction is better in predicting short-
term as well as long-term performance compared to the standard model.
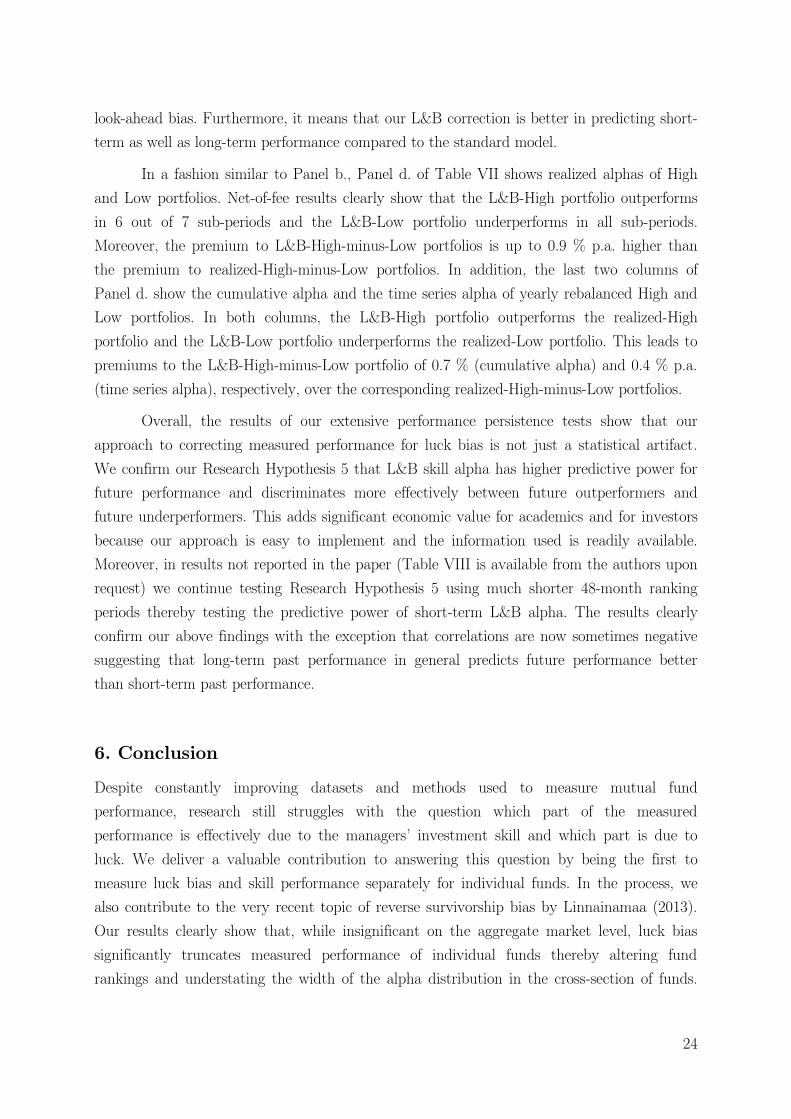
In a fashion similar to Panel b., Panel d. of Table VII shows realized alphas of High
and Low portfolios. Net-of-fee results clearly show that the L&B-High portfolio outperforms
in 6 out of 7 sub-periods and the L&B-Low portfolio underperforms in all sub-periods.
Moreover, the premium to L&B-High-minus-Low portfolios is up to 0.9 % p.a. higher than
the premium to realized-High-minus-Low portfolios. In addition, the last two columns of
Panel d. show the cumulative alpha and the time series alpha of yearly rebalanced High and
Low portfolios. In both columns, the L&B-High portfolio outperforms the realized-High
portfolio and the L&B-Low portfolio underperforms the realized-Low portfolio. This leads to
premiums to the L&B-High-minus-Low portfolio of 0.7 % (cumulative alpha) and 0.4 % p.a.
(time series alpha), respectively, over the corresponding realized-High-minus-Low portfolios.
Overall, the results of our extensive performance persistence tests show that our
approach to correcting measured performance for luck bias is not just a statistical artifact.
We confirm our Research Hypothesis 5 that L&B skill alpha has higher predictive power for
future performance and discriminates more effectively between future outperformers and
future underperformers. This adds significant economic value for academics and for investors
because our approach is easy to implement and the information used is readily available.
Moreover, in results not reported in the paper (Table VIII is available from the authors upon
request) we continue testing Research Hypothesis 5 using much shorter 48-month ranking
periods thereby testing the predictive power of short-term L&B alpha. The results clearly
confirm our above findings with the exception that correlations are now sometimes negative
suggesting that long-term past performance in general predicts future performance better
than short-term past performance.
6. Conclusion
Despite constantly improving datasets and methods used to measure mutual fund
performance, research still struggles with the question which part of the measured
performance is effectively due to the managers' investment skill and which part is due to
luck. We deliver a valuable contribution to answering this question by being the first to
measure luck bias and skill performance separately for individual funds. In the process, we
also contribute to the very recent topic of reverse survivorship bias by Linnainamaa (2013).
Our results clearly show that, while insignificant on the aggregate market level, luck bias
significantly truncates measured performance of individual funds thereby altering fund
rankings and understating the width of the alpha distribution in the cross-section of funds.

25
Using performance persistence tests, we prove that our luck bias corrected skill performance
measures are not just statistical artifacts. Our skill alpha shows consistently higher predictive
power than standard estimated alpha creating premiums to skill alpha based High-minus-Low
portfolios that are up to 0.9 % p.a. higher than those to standard alpha based High-minus-
Low portfolios. As our methodology is easy to implement and based on readily available data,
our findings add significant economic value for academics and for investors.

26
References
Barnett, V. and Lewis, T. (1994) Outliers in Statistical Data. John Wiley & Sons., 3rd edition.
Barras, L., Scaillet, O., and Wermers, R. (2010) False Discoveries in Mutual Fund
Performance: Measuring Luck in Estimated Alphas. Journal of Finance 65, 179-216.
Blake, D. and Timmermann, A. (1998) Mutual Fund Performance: Evidence from the UK.
European Finance Review 2, 57-77.
Brown, S. J. and Goetzmann, W. N. (1995) Performance Persistence. Journal of Finance
50, 679-698.
Carhart, M. M. (1997) On Persistence in Mutual Fund Performance. Journal of Finance 52,
57-82.
Carhart, M. M., Carpenter, J. N., Lynch, A. W., and Musto, D. K. (2002) Mutual fund
survivorship. Review of Financial Studies 15, 1439-1463.
Chan, L. K. C. and Lakonishok, J. (1992) Robust Measurement of Beta Risk. Journal of
Financial and Quantitative Analysis 27, 265-282.
Collins English Dictionary Online (2012), http://www.collinsdictionary.com, 13.09.2012.
Cook, R. D. (1977) Detection of Influential Observations in Linear Regressions.
Technometrics 19, 15-18.
Cook, R. D. and Weisberg, S. (1982) Residuals and Influences in Regressions. New York,
Chapman and Hall.
Cuthbertson, K., Nitzsche, D., and O’Sullivan, N. (2008) UK mutual fund performance: Skill
or Luck? Journal of Empirical Finance 15, 613-634.
Elton, E. J., Gruber, M. J., and Blake, C. R. (1996) The persistence of risk-adjusted mutual
fund performance. Journal of Business 69, 133-157.
Fama, E. F., and French, K. R. (1993) Common risk factors in the returns on stocks and
bonds. Journal of Financial Economics 33, 3-56.
Fama, E. F., and French, K. R. (2010) Luck versus Skill in the Cross-Section of Mutual Fund
Returns. Journal of Finance 65, 1915-1947.
Grinblatt, M. and Titman, S. (1992) The Persistence of Mutual Fund Performance. Journal
of Finance 47, 1977-1984.
Grundy, B. D. and Martin, J. S. (2001) Unterstanding the Nature of the Risk and the Source
of the Rewards to Momentum Investing. Review of Financial Studies 14, 29-78.

27
Hendricks, D., Patel, J., and Zeckhauser, R. (1993) Hot Hands in Mutual Funds: Short-Run
Persistence of Relative Performance, 1979-1988. Journal of Finance 48, 93-130.
Jegadeesh, N. and Titman, S. (1993) Returns to Buying Winners and Selling Losers:
Implications for Stock Market Efficiency. Journal of Finance 58, 65-91.
Kacperczyk, M., Sialm, C., and Zheng, L. (2008) Unobserved Actions of Mutual Funds.
Review of Financial Studies 21, 2379-2416.
Kosowski, R., Timmermann, A., Wermers, R., and White, H. (2006) Can individual Fund
“Stars” Really Pick Stocks? New Evidence from a Bootstrap Analysis. Journal of Finance
61, 2551-2595.
Layfield, L. and Stevenson, S. (2011) Separating Skill from Luck in REIT Mutual Funds.
Working Paper, University of Reading.
Linnainmaa, J. T. (2013) Reverse Survivorship Bias. Journal of Finance 68, 789-813.
Martin, R. D. and Simin, T. T. (2003) Outlier-Restistant Estimates of Beta. Financial
Analysts Journal, September/October, 56-69.
Newey, W. K. and West, K. D. (1988) A simple, positive semi-definite, heteroskedasticity and
autocorrelation consistent covariance matrix. Econometrica 55, 703-708.
Rohleder, M., Scholz, H., and Wilkens, M. (2011) Survivorship Bias and Mutual Fund
Performance: Relevance, Significance, and Methodical Differences. Review of Finance 15,
441-473.
Sastry, R. (2011) The Cross-Section of Investing Skill. Working Paper, Columbia Business
School.
Storey, J. D. (2002) A direct approach to false discovery rates. Journal of the Royal
Statistical Society B 64, 479-498.
ter Horst, J. R., Nijman, T. E, and Verbeek, M. (2001) Eliminating look-ahead Bias in
evaluating persisence in mutual fund performance. Journal of Empirical Finance 8, 345-373.
Zhao, X. (2005) Exit Decisions in the U.S. Mutual Fund Industry. Journal of Business 78,
1365-1401.

28
Appendix { Missing Values Approach
In our empirical analysis, we use monthly fund size to value-weigh i) fund returns within FoF
portfolios, and ii) share class returns and expense ratios within respective funds. For these
purposes, it is imperative that monthly TNA are complete for all funds. However, we find
that for the majority of share classes in the CRSP database there are some monthly TNA
missing. We fill these missing values applying the following approach to all share classes in
our dataset before these are aggregated on fund level: TNA missing in the middle of the time
series are linearly interpolated, assuming steady growth between observed adjacent values.
TNA missing directly after fund birth are interpolated linearly between zero and the first
observed value, assuming steady growth after starting with very small TNA. Analogously, we
interpolate linearly between the last observed value and zero in cases where TNA are missing
directly before disappearance. If TNA are missing at the end of the dataset in 03/2013, it is
impossible to determine whether these funds disappear consecutively or not. In such cases, we
therefore extrapolate the last observed TNA over all missing months, assuming zero growth.
Table A shows that less than 7 % of total observations are missing, most of which in
the beginning of the time series. This is undoubtedly due to poor data availability during the
earlier years of the database. Also, the table shows that a majority of 97 % have at most 24
consecutive values filled at the end of the observed time series. This is especially important as
this coincides with our Decision and Execution variables in case of non-survivors.
Table A.
Summary Statistics
This table shows numbers of missing observations as well as the percentage of share classes with ≤ 12, ≤ 24,
and ≤ 36 consecutive values filled, respectively, in our total sample of US domestic equity fund data in the
period from 01/1993 through 03/2013.
Observations
Share classes (%)
Absolute Percent ≤ 12 filled ≤ 24 filled ≤ 36 filled
Total 1,532,647
18,026
Missing total 101,560 6.63 79 84 86
In the beginning 83,317 5.44 57 63 67
In the middle 11,415 0.74 97 98 99
In the end 6,828 0.45 85 97 98

29
Figures and Tables Figure 1
Industry Development
This figure shows the development of the survivor-bias-free sample of US equity funds in the period from
01/1993 through 03/2013. The left graph shows industry size in Mio. USD. The right graph shows number of
funds. To be counted, funds have to survive at least 48 months within the sample period.
Figure 2
Survivors, Unskilled and Unlucky Non-Survivors
This figure shows how the survivor-bias-free sample of US equity funds divides into survivors and different
non-survivor groups over time in the period from 01/1993 through 03/2013. Non-survivors in general are the
cumulative number of funds disappeared prior to a respective date. Unskilled non-survivors are those with
positive or insignificant D&E dummy deltas based on Newey and West (1987) HAC-consistent p-Values
≤ 5 %. Unlucky Non-Survivors are the differential between Total Non-Survivors and Unskilled Non-Survivors
and are those funds with negative and significant dummy deltas. Total funds are the cumulative number of
all non-survivors plus the actual number of survivors (differential between the solid and the dashed lines).
0
1000000
2000000
3000000
4000000
Indust
ry S
ize
(Mio
USD
)
1997m1 2001m1 2005m2 2009m21993m1 2013m3Date
500
1000
1500
2000
2500
3000
Num
ber
of Funds
1997m1 2001m1 2005m2 2009m21993m1 2013m3Date
0
1000
2000
3000
4000
Num
ber
of Funds
1997m1 2001m1 2005m2 2009m21993m1 2013m3Date
Non-Survivors Total Funds
0
1000
2000
3000
4000
Num
ber
of Funds
1997m1 2001m1 2005m2 2009m21993m1 2013m3Date
Unskilled Non-Survivors Total Funds
Total Non-Survivors

30
Table I.
Summary Statistics
This table shows summary statistics on actively managed US domestic equity mutual funds with at least 48
monthly observations in the period from 01/1993 through 03/2013. Statistics for fund size are calculated from
pooled TNA observations. Numbers for all other fund characteristics are calculated from respective equal-
weighted and value-weighted fund-of-fund time series. Value-weighed numbers are based on beginning of month
TNA. \Survivor-biased" is the sub-sample of funds existing in 03/2013 (end-of-sample).
Survivor-bias-free Survivor-biased
Number of Funds 3,802 2,213
Observations 484,492 314,189
Industry Size in 03/2013 (million USD) 3,397,520 3,397,520
Mean Size (in million USD) 861.5 1,174.3
Median 140.1 205.1
Standard deviation 3,732.7 4,560.3
Equal Value Equal Value
Mean Net Excess Return (% p.m.) 0.5536 0.4892 0.6193 0.5188
Median 1.2008 1.0538 1.3063 1.0702
Standard deviation 4.6483 4.7115 4.5938 4.6872
Mean Gross Excess Return (% p.m.) 0.6505 0.5512 0.7119 0.5777
Median 1.2735 1.1175 1.3959 1.1159
Standard deviation 4.6292 4.6515 4.5709 4.6275
Mean Expense Ratio (% p.m.) 0.1003 0.0743 0.0957 0.0713
Median 0.1028 0.0801 0.0972 0.0752
Standard deviation 0.0075 0.0121 0.0053 0.0106
Mean Age (full months) 101 193 106 200
Median 95 191 101 199
Standard deviation 21 12 18 9
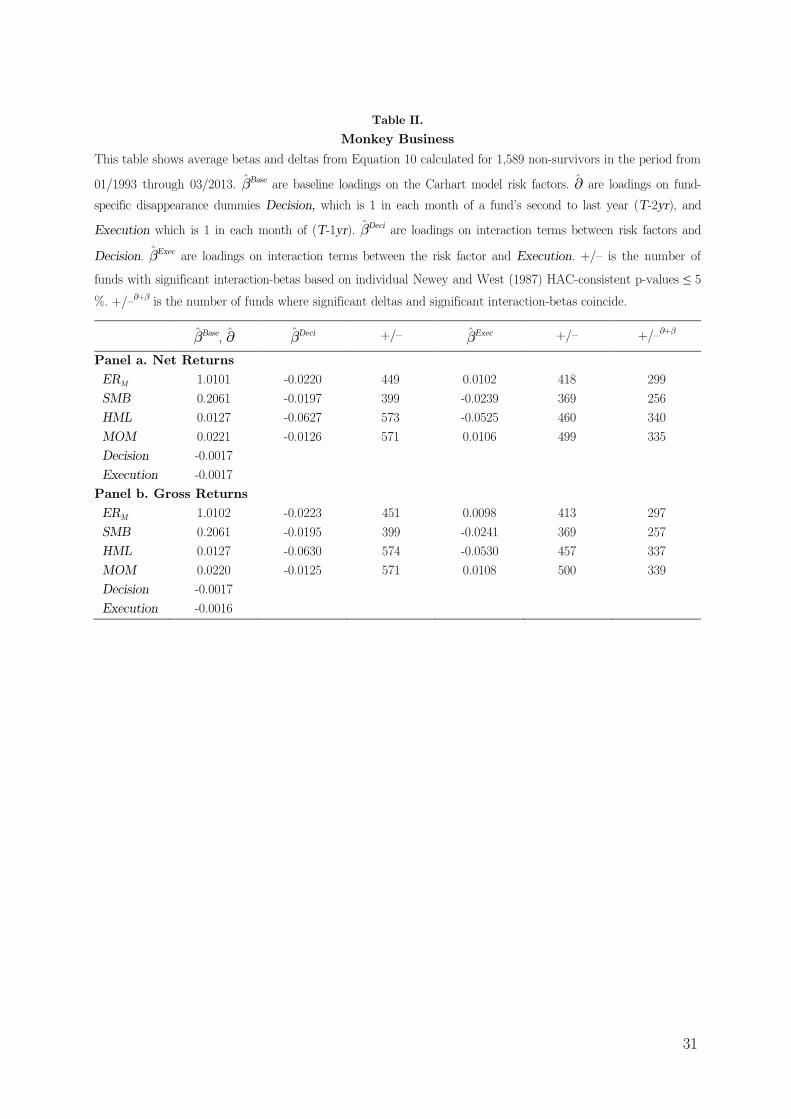
31
Table II.
Monkey Business
This table shows average betas and deltas from Equation 10 calculated for 1,589 non-survivors in the period from
01/1993 through 03/2013. ¯Base are baseline loadings on the Carhart model risk factors. @ are loadings on fund-
specific disappearance dummies Decision, which is 1 in each month of a fund's second to last year (T-2yr), and
Execution which is 1 in each month of (T-1yr). ¯Deci are loadings on interaction terms between risk factors and
Decision. ¯Exec are loadings on interaction terms between the risk factor and Execution. +/{ is the number of
funds with significant interaction-betas based on individual Newey and West (1987) HAC-consistent p-values ≤ 5
%. +/{@+¯
is the number of funds where significant deltas and significant interaction-betas coincide.
¯Base, @ ¯Deci +/{ ¯Exec +/{ +/{
@+¯
Panel a. Net Returns
ERM 1.0101 -0.0220 449 0.0102 418 299
SMB 0.2061 -0.0197 399 -0.0239 369 256
HML 0.0127 -0.0627 573 -0.0525 460 340
MOM 0.0221 -0.0126 571 0.0106 499 335
Decision -0.0017
Execution -0.0017
Panel b. Gross Returns
ERM 1.0102 -0.0223 451 0.0098 413 297
SMB 0.2061 -0.0195 399 -0.0241 369 257
HML 0.0127 -0.0630 574 -0.0530 457 337
MOM 0.0220 -0.0125 571 0.0108 500 339
Decision -0.0017
Execution -0.0016
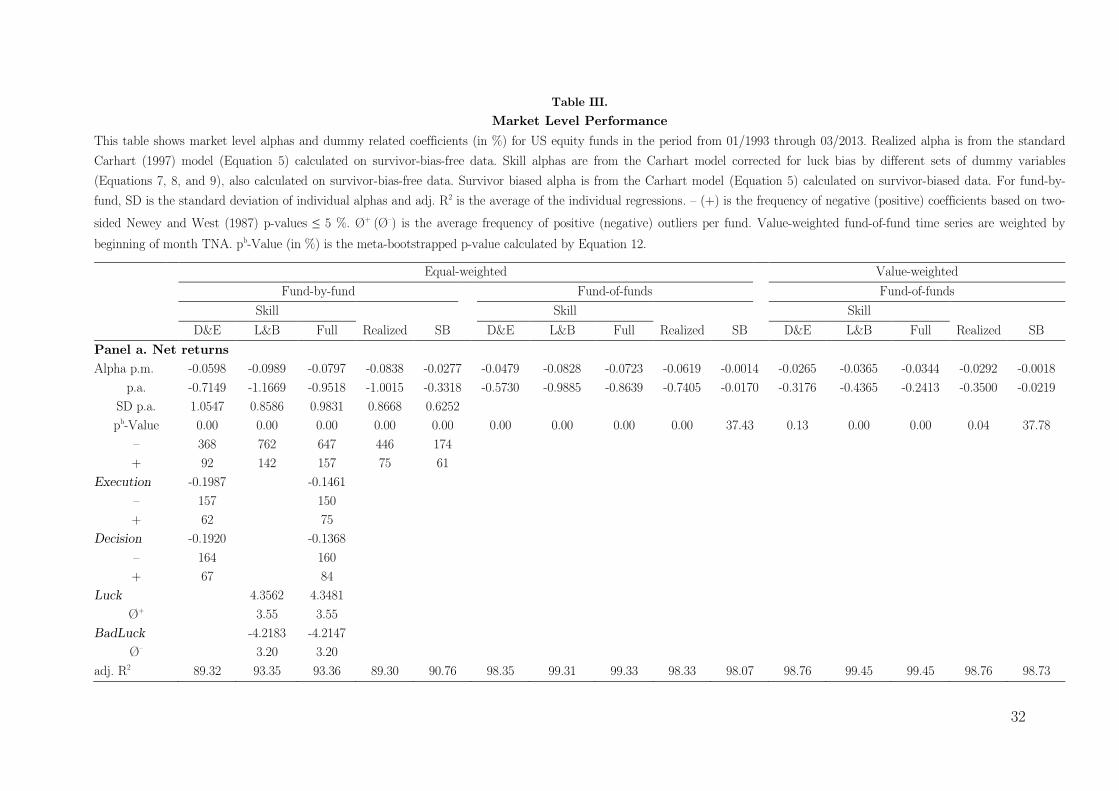
32
Table III.
Market Level Performance
This table shows market level alphas and dummy related coefficients (in %) for US equity funds in the period from 01/1993 through 03/2013. Realized alpha is from the standard
Carhart (1997) model (Equation 5) calculated on survivor-bias-free data. Skill alphas are from the Carhart model corrected for luck bias by different sets of dummy variables
(Equations 7, 8, and 9), also calculated on survivor-bias-free data. Survivor biased alpha is from the Carhart model (Equation 5) calculated on survivor-biased data. For fund-by-
fund, SD is the standard deviation of individual alphas and adj. R2 is the average of the individual regressions. { (+) is the frequency of negative (positive) coefficients based on two-
sided Newey and West (1987) p-values ≤ 5 %. Â+ (Â{) is the average frequency of positive (negative) outliers per fund. Value-weighted fund-of-fund time series are weighted by
beginning of month TNA. pb-Value (in %) is the meta-bootstrapped p-value calculated by Equation 12.
Equal-weighted Value-weighted
Fund-by-fund Fund-of-funds Fund-of-funds
Skill Skill Skill
D&E L&B Full Realized SB D&E L&B Full Realized SB D&E L&B Full Realized SB
Panel a. Net returns
Alpha p.m. -0.0598 -0.0989 -0.0797 -0.0838 -0.0277 -0.0479 -0.0828 -0.0723 -0.0619 -0.0014 -0.0265 -0.0365 -0.0344 -0.0292 -0.0018
p.a. -0.7149 -1.1669 -0.9518 -1.0015 -0.3318 -0.5730 -0.9885 -0.8639 -0.7405 -0.0170 -0.3176 -0.4365 -0.2413 -0.3500 -0.0219
SD p.a. 1.0547 0.8586 0.9831 0.8668 0.6252
pb-Value 0.00 0.00 0.00 0.00 0.00 0.00 0.00 0.00 0.00 37.43 0.13 0.00 0.00 0.04 37.78
{ 368 762 647 446 174
+ 92 142 157 75 61
Execution -0.1987 -0.1461
{ 157 150
+ 62 75
Decision -0.1920 -0.1368
{ 164 160
+ 67 84
Luck 4.3562 4.3481
Â+ 3.55 3.55
BadLuck -4.2183 -4.2147
Â{ 3.20 3.20
adj. R2 89.32 93.35 93.36 89.30 90.76 98.35 99.31 99.33 98.33 98.07 98.76 99.45 99.45 98.76 98.73

33
Table III. cont'd.
Equal-weighted Value-weighted
Fund-by-fund Fund-of-funds Fund-of-funds
Skill Skill Skill
D&E L&B Full Realized SB D&E L&B Full Realized SB D&E L&B Full Realized SB
Panel b. Gross returns
Alpha p.m. 0.0335 -0.0044 0.0134 0.0096 0.0534 0.0498 0.0150 0.0253 0.0359 0.0916 0.0475 0.0376 0.0396 0.0448 0.0692
p.a. 0.4030 -0.0526 0.1615 0.1154 0.6428 0.5988 0.1796 0.3035 0.4312 1.1046 0.5711 0.4518 0.4764 0.5384 0.8332
SD p.a. 1.0601 0.8387 0.9756 0.8602 0.6598
pb-Value 0.00 20.48 0.89 4.45 0.00 0.00 0.06 0.00 0.00 0.00 0.00 0.00 0.00 0.00 0.00
– 279 283 229 165 66
+ 154 375 399 239 198
Execution -0.1964 -0.1433
– 156 155
+ 66 74
Decision -0.1905 -0.1355
– 166 158
+ 66 86
Luck 4.3434 4.3355
Â+ 3.55 3.55
BadLuck -4.2099 -4.2063
– 3.20 3.20
adj. R2 89.35 93.34 93.36 89.32 90.76 98.35 99.32 99.33 98.33 98.06 98.76 99.45 99.45 98.76 98.73

34
Table IV.
Survivorship Bias, Luck Bias, and Reverse Survivorship Bias
This table shows alpha biases (in %) for US equity funds in the period from 01/1993 through 12/2013. Survivorship
bias is the difference between survivor-biased and realized alphas. Luck bias is the difference between skill alphas
and realized alphas. D&E luck bias equals Linnainmaa's (2013) definition of reverse survivorship bias. pb-Value is
the meta-bootstrapped p-value (in %) calculated by Equations 13 (SB) and 14 (LB, RSB).
Luck bias (Reverse survivorship bias)
Survivorship bias Equal Value
Equal Value Fund-by-fund Fund-of-funds Fund-of-funds
FbF FoF FoF D&E L&B Full D&E L&B Full D&E L&B Full
Panel a. Net returns
Bias p.m. 0.0561 0.0605 0.0274 0.0240 -0.0151 0.0041 0.0140 -0.0209 -0.0104 0.0027 -0.0073 -0.0052
p.a. 0.6753 0.7284 0.3293 0.2884 -0.1810 0.0492 0.1681 -0.2505 -0.1247 0.0324 -0.0876 -0.0624
pb-Value 0.00 0.00 2.55 0.00 0.00 12.41 0.00 0.00 0.00 0.00 13.99 24.03
Panel b. Gross returns
Bias p.m. 0.0438 0.0557 0.0244 0.0237 -0.0140 0.0038 0.0139 -0.0209 -0.0106 0.0027 0.0668 -0.0052
p.a. 0.5269 0.6705 0.2932 0.2851 -0.1679 0.0456 0.1669 -0.2505 -0.1271 0.0324 0.8046 -0.0624
pb-Value 0.00 0.00 4.42 0.00 0.00 15.65 0.00 0.00 0.00 0.00 14.31 24.48
Table V.
Correlations between Realized and Skill Alphas
This table shows standard correlations, Spearman's rho (½) and Kendall's tau (¿) rank correlations between
realized and skill alphas for US equity funds in the period from 01/1993 through 03/2013. The last column
shows the product of the correlations from D&E and L&B. All numbers are denoted in %.
D&E L&B Full D&E * L&B
Panel a. Net returns
Standard 89.04 88.72 83.46 78.99
Spearman's rho (½) 86.97 90.68 82.14 78.86
Kendall's tau (¿) 70.57 81.99 65.44 57.86
Panel b. Gross returns
Standard 89.12 88.80 83.16 79.14
Spearman's rho (½) 90.93 86.74 81.79 78.87
Kendall's tau (¿) 82.00 70.23 65.05 57.59

35
Table VI.
Distributions of Alphas
This table shows fractions of funds (in %) with an annualized alpha above and below specific levels for US
equity funds in the period from 01/1993 through 03/2013. In the columns headed \All", all funds are counted.
In the columns headed \**", funds are counted conditional on performing significantly different from zero based
on two-sided Newey and West (1987) HAC-consistent p-values ≤ 5 %.
Skill performance
Realized D&E L&B Full model
All ** All ** All ** All **
Panel a. Net Returns
Above +5 % 1.58 0.79 2.95 1.24 1.21 0.79 2.00 1.10
Above +2 % 10.02 1.92 12.73 2.39 9.34 3.47 11.23 3.92
Above +1 % 18.52 1.95 21.23 2.39 16.75 3.71 19.28 4.10
Above 0 % 32.85 1.97 36.80 2.42 30.98 3.73 34.03 4.13
Insign. ±0 % 86.30 87.90 76.22 78.85
Below 0 % 67.15 11.73 63.20 9.68 69.02 20.04 65.97 17.02
Below –1 % 46.98 11.44 43.92 9.44 47.95 19.28 45.71 16.39
Below –2 % 29.14 10.52 26.83 8.50 31.35 17.18 29.30 14.39
Below –5 % 6.60 4.00 6.44 3.39 7.52 5.79 6.73 4.73
Panel b. Gross Returns
Above +5 % 3.55 2.08 5.34 2.63 2.81 2.29 3.92 2.87
Above +2 % 19.83 5.84 23.01 6.79 18.04 8.81 20.52 9.42
Above +1 % 32.72 6.21 36.88 7.21 31.38 9.71 34.25 10.36
Above 0 % 53.42 6.29 56.08 7.34 51.68 9.86 54.00 10.49
Insign. ±0 % 89.37 88.61 82.69 83.48
Below 0 % 46.58 4.34 43.92 4.05 48.32 7.44 46.00 6.02
Below –1 % 28.41 4.31 26.59 4.02 30.17 7.34 28.17 5.92
Below –2 % 16.44 3.87 15.04 3.55 17.62 6.68 16.25 5.37
Below –5 % 3.89 1.76 3.55 1.84 4.05 2.50 4.13 2.31

36
Table VII.
Performance Persistence { Long-term Ranking Periods
Panel a. of this table shows Spearman's rho (½) and Kendall's tau (¿) rank correlations (in %) between ranking and holding period alphas. All ranking periods start in January of
1993 and end in March of each year from 2003 through 2009. Holding periods always cover the following 48 months. Only funds with at least 48 observations in either sub-period
are considered. Rankings during both sub-periods are based on realized and L&B skill alphas. Luck and BadLuck are sub-period-specific. Panel b. shows holding period realized
performance of equal-weighted \High" (best 20 %) and \Low" portfolios (worst 20 %) based on Panel a. period definitions. Panel c. shows Spearman's rho (½) and Kendall's tau
(¿) rank correlations (in %) for holdings periods of 12 months. Ranking periods end in March of each year from 2003 through 2012. Panel d. shows results without the requirement
of survival during the holding period. The last two columns show cumulative alpha and time series alpha yearly rebalanced portfolios based on Panel c. period definitions. ***, **,
* indicate significance at the 1 %, 5 %, and 10% level, respectively. In Panels b. and d., significance is based on Newey and West (1987) HAC-consistent p-values.
Ranking period 01/1993 - 03/2003 01/1993 - 03/2004 01/1993 - 03/2005 01/1993 - 03/2006 01/1993 - 03/2007 01/1993 - 03/2008 01/1993 - 03/2009
Holding period 04/2003 - 03/2007 04/2004 - 03/2008 04/2005 - 03/2009 04/2006 - 03/2010 04/2007 - 03/2011 04/2008 - 03/2012 04/2009 - 03/2013
Rho (½) Tau (¿) Rho (½) Tau (¿) Rho (½) Tau (¿) Rho (½) Tau (¿) Rho (½) Tau (¿) Rho (½) Tau (¿) Rho (½) Tau (¿)
Panel a. Rank Correlations { 48 Months Holding Period
Net returns
Ranking based on L&B skill alpha
L&B holding 7.48*** 5.28*** 4.54 3.12* 10.47*** 7.24*** 13.58*** 9.28*** 16.09*** 11.14*** 17.10*** 11.88*** 14.03*** 9.59***
Realized holding 7.34** 5.18*** 4.37 2.99 9.78*** 6.71*** 10.55*** 7.25*** 12.94*** 9.00*** 14.97*** 10.31*** 13.39*** 9.10***
Ranking based on realized alpha
L&B holding 5.58* 3.96** 2.78 1.86 10.01*** 6.91*** 14.10*** 9.66*** 14.15*** 9.92*** 12.75*** 9.00*** 9.65*** 6.67***
Realized holding 5.44* 3.87** 2.47 1.62 8.42*** 5.82*** 9.93*** 6.80*** 10.39*** 7.35*** 10.53*** 7.36*** 8.65*** 5.88***
Gross returns
Ranking based on L&B skill alpha
L&B holding 5.15* 3.53* 3.49 2.12 9.84*** 6.71*** 13.43*** 9.18*** 16.00*** 11.00*** 14.50*** 10.08*** 11.01*** 7.49***
Realized holding 5.08* 3.46* 3.33 1.99 9.28*** 6.32*** 10.72*** 7.31*** 12.67*** 8.64*** 11.00*** 7.64*** 10.51*** 7.11***
Ranking based on realized alpha
L&B holding 4.58 3.12 2.63 1.64 10.72*** 7.32*** 14.79*** 10.11*** 14.34*** 10.02*** 11.08*** 7.83*** 7.40*** 5.11***
Realized holding 4.52 3.09 2.33 1.38 9.23*** 6.35*** 10.89*** 7.42*** 10.40*** 7.29*** 8.21*** 5.82*** 6.46** 4.34**

37
Table VII. cont'd.
Ranking period 01/1993-03/2003 01/1993-03/2004 01/1993-03/2005 01/1993-03/2006 01/1993-03/2007 01/1993-03/2008 01/1993-03/2009
Holding period 04/2003-03/2007 04/2004-03/2008 04/2005-03/2009 04/2006-03/2010 04/2007-03/2011 04/2008-03/2012 04/2009-03/2013
Panel b. Realized Holding Performance
Net returns
Ranking based on L&B skill alpha
High -0.0431 -0.0072 0.0102 0.0292 -0.0110 -0.1455 -0.0494
Low -0.1029 -0.0351 -0.0512 -0.0458 -0.0852 -0.2209** -0.1406**
High-Low 0.0598 0.0279 0.0614* 0.0750* 0.0741* 0.0754* 0.0912**
High-Low p.a. 0.7200 0.3351 0.7395* 0.9033* 0.8934* 0.9083* 1.0999**
Ranking based on realized alpha
High -0.0638 -0.0048 0.0011 0.0203 -0.0248 -0.1610 -0.0802
Low -0.0998 -0.0317 -0.0478 -0.0374 -0.0698 -0.1937** -0.1192**
High-Low 0.0359 0.0269 0.0489* 0.0576 0.0450 0.0326 0.0390
High-Low p.a. 0.4317 0.3237 0.5883* 0.6940 0.5410 0.3924 0.4692
Gross returns
Ranking based on L&B skill alpha
High 0.0570 0.0973* 0.1041 0.1230 0.0816 -0.0502 0.0389
Low 0.0185 0.0699 0.0439 0.0613 0.0127 -0.1055 -0.0254
High-Low 0.0386 0.0274 0.0602* 0.0617 0.0689 0.0553 0.0643
High-Low p.a. 0.4638 0.3292 0.7244* 0.7427 0.8298 0.6659 0.7738
Ranking based on realized alpha
High 0.0438 0.1076* 0.1078 0.1192 0.0795 -0.0637 0.0153
Low 0.0196 0.0753 0.0451 0.0517 0.0228 -0.0833 -0.0169
High-Low 0.0243 0.0324 0.0627* 0.0675* 0.0658 0.0195 0.0322
High-Low p.a. 0.2916 0.3890 0.7550* 0.8135* 0.6832 0.2346 0.3872
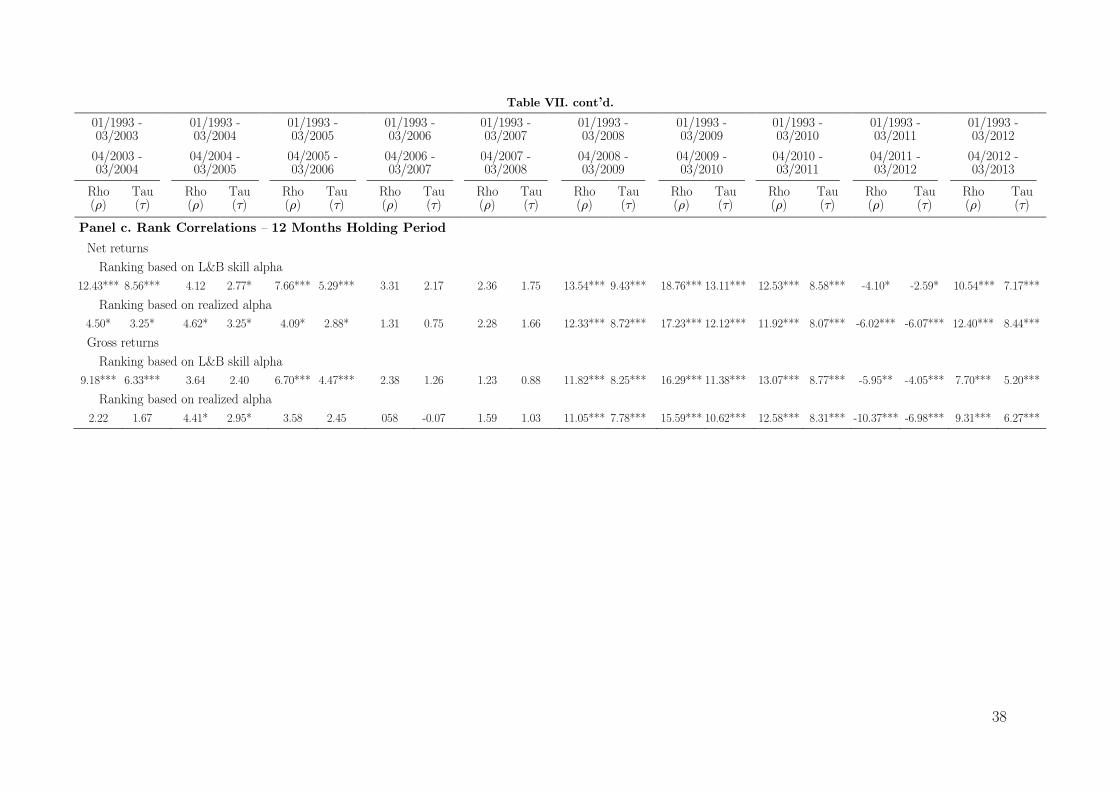
38
Table VII. cont'd.
01/1993 - 03/2003
01/1993 - 03/2004
01/1993 - 03/2005
01/1993 - 03/2006
01/1993 - 03/2007
01/1993 - 03/2008
01/1993 - 03/2009
01/1993 - 03/2010
01/1993 - 03/2011
01/1993 - 03/2012
04/2003 - 03/2004
04/2004 - 03/2005
04/2005 - 03/2006
04/2006 - 03/2007
04/2007 - 03/2008
04/2008 - 03/2009
04/2009 - 03/2010
04/2010 - 03/2011
04/2011 - 03/2012
04/2012 - 03/2013
Rho (½)
Tau (¿)
Rho (½)
Tau (¿)
Rho (½)
Tau (¿)
Rho (½)
Tau (¿)
Rho (½)
Tau (¿)
Rho (½)
Tau (¿)
Rho (½)
Tau (¿)
Rho (½)
Tau (¿)
Rho (½)
Tau (¿)
Rho (½)
Tau (¿)
Panel c. Rank Correlations { 12 Months Holding Period
Net returns
Ranking based on L&B skill alpha
12.43*** 8.56*** 4.12 2.77* 7.66*** 5.29*** 3.31 2.17 2.36 1.75 13.54*** 9.43*** 18.76*** 13.11*** 12.53*** 8.58*** -4.10* -2.59* 10.54*** 7.17***
Ranking based on realized alpha
4.50* 3.25* 4.62* 3.25* 4.09* 2.88* 1.31 0.75 2.28 1.66 12.33*** 8.72*** 17.23*** 12.12*** 11.92*** 8.07*** -6.02*** -6.07*** 12.40*** 8.44***
Gross returns
Ranking based on L&B skill alpha
9.18*** 6.33*** 3.64 2.40 6.70*** 4.47*** 2.38 1.26 1.23 0.88 11.82*** 8.25*** 16.29*** 11.38*** 13.07*** 8.77*** -5.95** -4.05*** 7.70*** 5.20***
Ranking based on realized alpha
2.22 1.67 4.41* 2.95* 3.58 2.45 058 -0.07 1.59 1.03 11.05*** 7.78*** 15.59*** 10.62*** 12.58*** 8.31*** -10.37*** -6.98*** 9.31*** 6.27***

39
Table VII. cont'd.
Ranking period 01/1993-03/2003 01/1993-03/2004 01/1993-03/2005 01/1993-03/2006 01/1993-03/2007 01/1993-03/2008 01/1993-03/2009 Yearly rebalanced cumulative
alpha
Yearly rebalanced time series
alpha Holding period 04/2003-03/2007 04/2004-03/2008 04/2005-03/2009 04/2006-03/2010 04/2007-03/2011 04/2008-03/2012 04/2009-03/2013
Panel d. Realized Holding Performance { No Look-ahead Bias
Net returns
Ranking based on L&B skill alpha
High -0.0601 -0.0373 -0.0158 0.0180 -0.0283 -0.1474 -0.0687 -0.6908 -0.0257
Low -0.1491 -0.0909 -0.1122 -0.1054 -0.1513 -0.2940*** -0.1879** -2.5422 -0.1801***
High-Low 0.0889* 0.0537 0.0964** 0.1235*** 0.1230*** 0.1466*** 0.1191** 1.8514 0.1545***
High-Low p.a. 1.0726* 0.6458 1.1627** 1.4915*** 1.4864*** 1.7733*** 1.4391** 1.8694***
Ranking based on realized alpha
High -0.0758 -0.0356 -0.0223 0.0020 -0.0352 -0.1694 -0.0891 -0.9254 -0.0379
Low -0.1349 -0.0735 -0.0936 -0.0705 -0.1201 -0.2400*** -0.1411** -2.0658 -0.1609***
High-Low 0.0591 0.0379 0.0713** 0.0725** 0.0848** 0.0706 0.0519 1.1404 0.1230***
High-Low p.a. 0.7118 0.4557 0.8586** 0.8736** 1.0227** 0.8510 0.6251 1.4865***
Gross returns
Ranking based on L&B skill alpha
High 0.0396 0.0790 0.0847 0.1040 0.0764 -0.0667 0.0261 0.2285 0.0747
Low -0.0147 0.0501 0.0126 0.0246 -0.0177 -0.1634* -0.0475 -0.9771 -0.0537
High-Low 0.0544 0.0289 0.0721** 0.0794* 0.0941** 0.0967* 0.0737 1.2056 0.1284***
High-Low p.a. 0.6546 0.3473 0.8688** 0.9569* 1.1355** 1.1670* 0.8875 1.5514***
Ranking based on realized alpha
High 0.0388 0.0708 0.0882 0.1106 0.0601 -0.0789 0.0054 0.0576 0.0663
Low -0.0077 0.0470 0.0251 0.0411 -0.0155 -0.1147 -0.0300 -0.7171 -0.0408
High-Low 0.0465 0.0237 0.0632* 0.0695* 0.0756* 0.0358 0.0354 0.7746 0.1071***
High-Low p.a. 0.5597 0.2851 0.7605* 0.8373* 0.9112 0.4301 0.4260 1.2928***


