
Goldman Sachs January 11, 2012
Miami, FL
M. Kevin McEvoyPresident & CEOPresident & CEO
Oceaneering International, Inc.
Safe Harbor StatementSafe Harbor Statement
Statements we make in this presentation that express a belief, expectation, or intention are forward looking. Forward-looking statements are generally accompanied by words such as “estimate,” “project,” “predict,” “believe,” “expect,” “anticipate,” “plan,” “forecast,” “budget,” “goal,” or p , p , p , , g , g ,other words that convey the uncertainly of future events or outcomes. These forward-looking statements are based on our current information and expectations that involve a number of risks, uncertainties, and assumptions. Among the factors that could cause the actual results to differ materially from those indicated in the forward-looking statements are: industry conditions prices of crude oil and natural gas ourindustry conditions, prices of crude oil and natural gas, our ability to obtain and the timing of new projects, and changes in competitive factors. Should one or more of these risks or uncertainties materialize, or should the assumptions underlying the forward-looking statements prove incorrect, actual outcomes could vary materially from those indicated.
For additional information regarding these and other factors, see our periodic filings with the Securities and Exchange Commission, including our most recent Reports on Forms 10-K and 10-Q.

WHY OII?
• Leveraged to Deepwater and Subsea Completions• Leveraged to Deepwater and Subsea Completions
– Secular Growth
L di M k t P iti
– Secular Growth
L di M k t P iti• Leading Market Positions
– ROVs and Specialty Subsea Products
• Leading Market Positions
– ROVs and Specialty Subsea Products
• Excellent Earnings, Liquidity and Cash Flow• Excellent Earnings, Liquidity and Cash Flow

Leveraged to Deepwater
• Projects Take Years to Develop• Projects Take Years to Develop
• Largely Oil Reservoirs• Largely Oil Reservoirs
– With High Production Flow Rates– With High Production Flow Rates
• Well Capitalized Customer Base• Well Capitalized Customer Base
• Investment Based on Long-Term Commodity Price• Investment Based on Long-Term Commodity Price

Long-Term Deepwater OutlookInvest Where the Oil IsInvest Where the Oil Is
• Western IOCs Have Little Choice– Restricted Access to World-Class Onshore Reserves
• Exploration Success Bodes Well for the Future
• Drilling Intensity is Rising
Source: Wood Mackenzie and Deutsche Bank
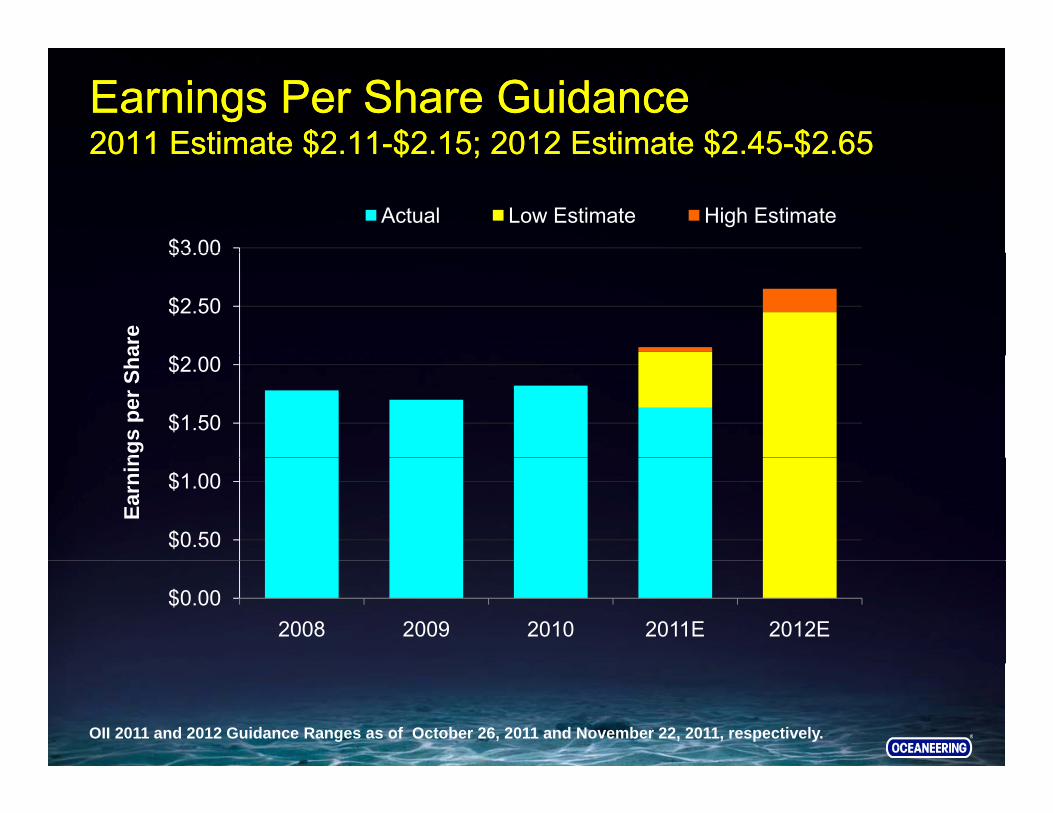
Earnings Per Share Guidance2011 Estimate $2 11-$2 15; 2012 Estimate $2 45-$2 65Earnings Per Share Guidance2011 Estimate $2 11-$2 15; 2012 Estimate $2 45-$2 65
$3.00Actual Low Estimate High Estimate
2011 Estimate $2.11 $2.15; 2012 Estimate $2.45 $2.652011 Estimate $2.11 $2.15; 2012 Estimate $2.45 $2.65
$
$2.50
$3.00
are
$1.50
$2.00
ngs
per S
ha
$0.50
$1.00
Earn
in
$0.002008 2009 2010 2011E 2012E
OII 2011 and 2012 Guidance Ranges as of October 26, 2011 and November 22, 2011, respectively.

Combined EPS – OSX CompaniesExcluding OIICombined EPS – OSX CompaniesExcluding OII
$75Actual Consensus Estimate
Excluding OIIExcluding OII
$60
$75
are
$30
$45
ngs
per S
ha
$15
$30
Earn
in
$02008 2009 2010 2011E 2012E
Based on First Call Actuals and Mean Estimates as of December 30, 2011

Relative EPS PerformanceTo Recent 2008 OSX PeakRelative EPS PerformanceTo Recent 2008 OSX PeakTo Recent 2008 OSX PeakTo Recent 2008 OSX Peak
60%
OII OSX w/o OII
40%
60%
0%
20%
-40%
-20%
-60%2008 2009 2010 2011E 2012E
Based on First Call Actuals and Mean Estimates as of December 30, 2011

2012 EPS Guidance The Big Picture2012 EPS Guidance The Big PictureThe Big PictureThe Big Picture
SEGMENT OPERATING INCOMESEGMENT OPERATING INCOMESEGMENT OPERATING INCOME
ROV > 2011
SEGMENT OPERATING INCOME
ROV > 2011
Subsea Products > 2011Subsea Products > 2011
Subsea Projects > 2011
Inspection > 2011
Subsea Projects > 2011
Inspection > 2011
Advanced Tech > 2011Advanced Tech > 2011

Field Support Vessel Services ContractBP Angola – Blocks 18 and 31
• Project Management & EngineeringTh Y f F b 1 2012
• Project Management & EngineeringTh Y f F b 1 2012
BP Angola Blocks 18 and 31
– Three Years from February 1, 2012
• Two Chartered Vessels
– Three Years from February 1, 2012
• Two Chartered Vessels– Ocean Intervention III– Bourbon Oceanteam 101– Ocean Intervention III– Bourbon Oceanteam 101
• BP Options– Two, 1-Year Periods
• BP Options– Two, 1-Year PeriodsTwo, 1 Year Periods– Third Vessel
Two, 1 Year Periods– Third Vessel
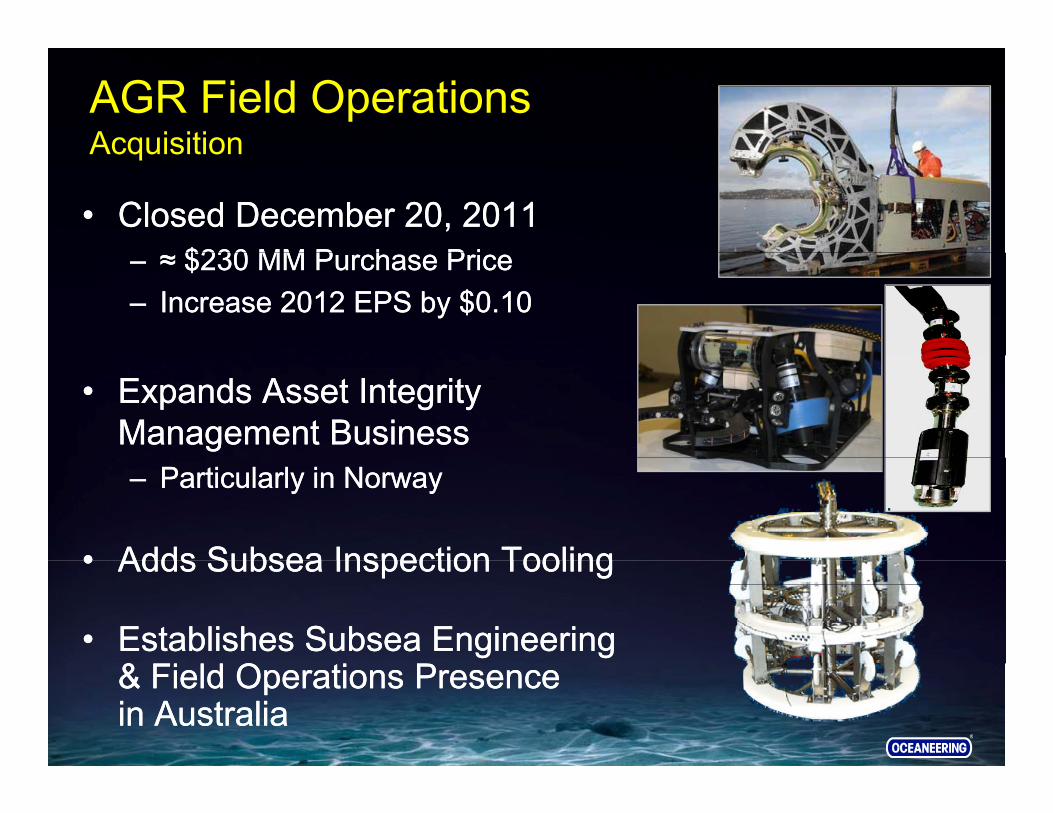
AGR Field Operations Acquisition
• Closed December 20, 2011$230 MM P h P i
• Closed December 20, 2011$230 MM P h P i
Acquisition
– ≈ $230 MM Purchase Price– Increase 2012 EPS by $0.10– ≈ $230 MM Purchase Price– Increase 2012 EPS by $0.10
• Expands Asset Integrity Management Business
• Expands Asset Integrity Management Business– Particularly in Norway
• Adds Subsea Inspection Tooling
– Particularly in Norway
• Adds Subsea Inspection Tooling• Adds Subsea Inspection Tooling
• Establishes Subsea Engineering & O
• Adds Subsea Inspection Tooling
• Establishes Subsea Engineering & O& Field Operations Presence in Australia& Field Operations Presence in Australia

Excellent Liquidity & Cash Flow
• September 30, 2011• September 30, 2011– $166 MM Cash
– $300 MM Revolving Credit Available
– $166 MM Cash
– $300 MM Revolving Credit Available
• At Least $480 MM of EBITDA Expected in 2011• At Least $480 MM of EBITDA Expected in 2011
• At Least $550 MM of EBITDA Expected in 2012• At Least $550 MM of EBITDA Expected in 2012
• Ample Resources to Invest in Growth• Ample Resources to Invest in Growth
EBITDA Reconciliation to Net Income is in Supplemental Financial Information Slides

Plans For Cash
• Investments• Investments
– Organic Growth
– Acquisitions
– Organic Growth
– AcquisitionsAcquisitionsAcquisitions
• Regular Quarterly Dividend• Regular Quarterly Dividend
• Share Repurchases• Share Repurchases

Acquisition Targets
• Within Our Market Niches• Within Our Market Niches
– Expand Subsea Products– Expand Subsea Products
• International Focus• International Focus
• Reasonably Priced• Reasonably Priced
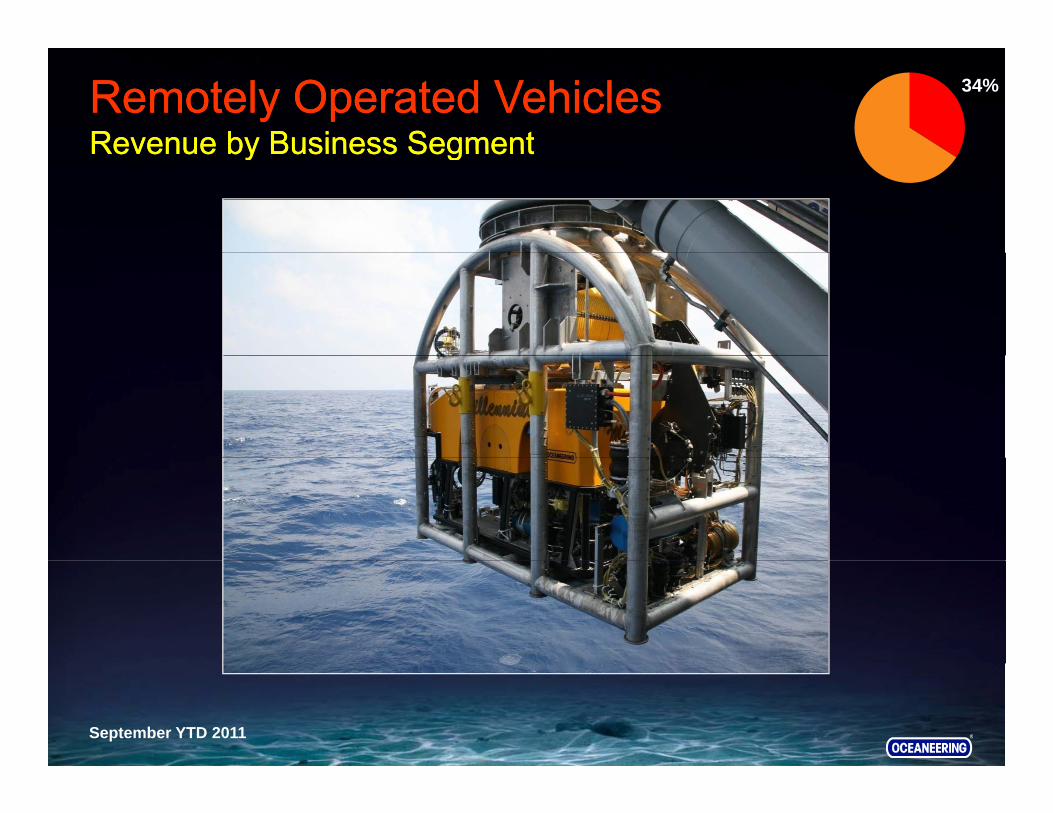
Remotely Operated VehiclesRevenue by Business SegmentRemotely Operated VehiclesRevenue by Business Segment
34%
Revenue by Business SegmentRevenue by Business Segment
September YTD 2011
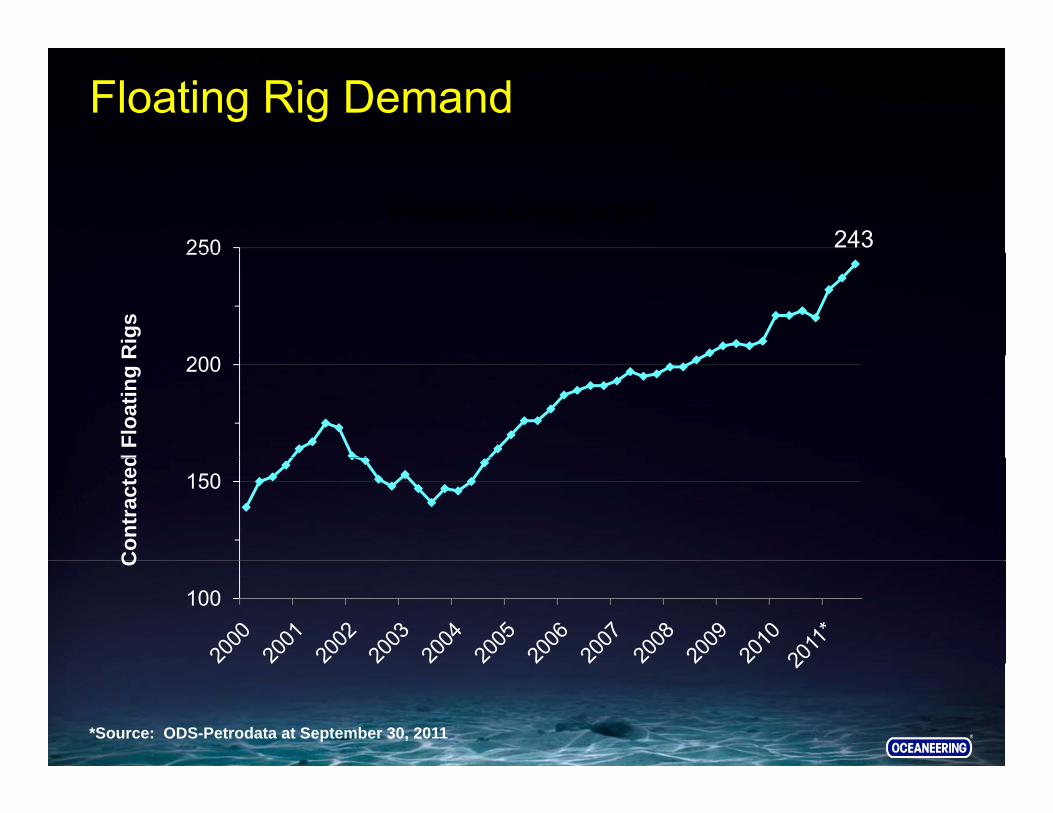
Floating Rig Demand
243250Floaters Contracted
250
Rig
s
200
d Fl
oatin
g R
150
Con
trac
ted
100
C
*Source: ODS-Petrodata at September 30, 2011
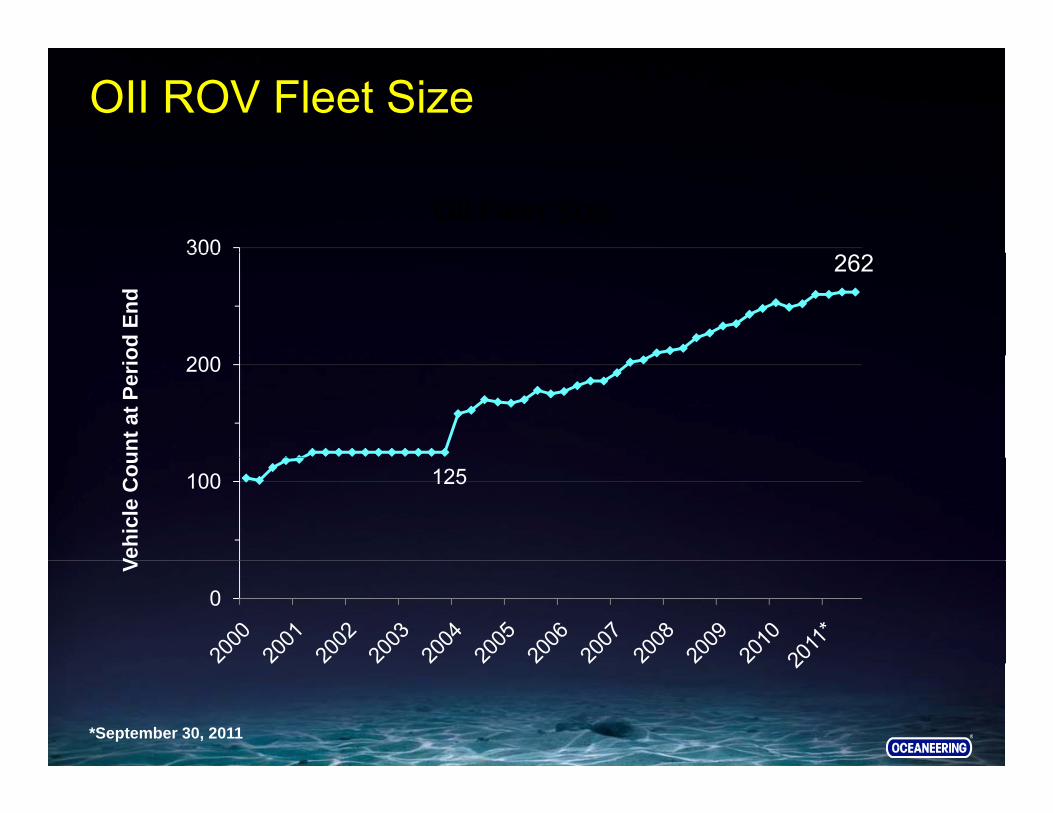
OII ROV Fleet Size
300OII Fleet Size
262300
od E
nd
200
unt a
t Per
io
125100
Vehi
cle
Cou
0
V
*September 30, 2011

Floating Rig Fleet Expansion
• 74 On Order at September 30, 2011• 74 On Order at September 30, 2011
• 37 Contracted• 37 Contracted– Average length >8 years– Average length >8 years
• 27 Expected to be Placed In Service in 2011– 20 In Service YTD
• 27 Expected to be Placed In Service in 2011– 20 In Service YTD
• 24 Expected to be Placed In Service in 2012• 24 Expected to be Placed In Service in 201224 Expected to be Placed In Service in 201224 Expected to be Placed In Service in 2012
Source: OII Estimates Based On ODS-Petrodata Data: September 30, 2011

ROV Operating LeverageROV Operating Leverage
100%$11,000Revenue / Day on Hire Fleet Utilization
80%
100%
$9,000
$11,000
40%
60%
$5 000
$7,000
20%
40%
$3,000
$5,000
0%$1,000
September YTD 2011

2012 ROV Overview
• Increase in Days On Hire• Increase in Days On Hire
– Higher Fleet Utilization– Higher Fleet Utilization
– Expect to Add 15 to 20 New Systems
– Expect to Add 15 to 20 New Systems

Operating Income – ROV2011 Estimate > 2010; 2012 Estimate > 2011Operating Income – ROV2011 Estimate > 2010; 2012 Estimate > 2011
$250in millions Actual Estimate
2011 Estimate 2010; 2012 Estimate 2011 2011 Estimate 2010; 2012 Estimate 2011
$200
$250
$100
$150
$50
$100
$02007 2008 2009 2010 2011E 2012E
OII 2011 and 2012 Guidance Ranges as of October 26, 2011

Worldwide Subsea CompletionsThis Decade Expected to Grow ≈ 50%Worldwide Subsea CompletionsThis Decade Expected to Grow ≈ 50%
6000Completed Estimated
This Decade Expected to Grow 50% This Decade Expected to Grow 50%
5000
6000
ompl
etio
ns
4611
3000
4000
Subs
ea C
o
1000
2000
Num
ber o
f
090s 00s 10s
N
Source: Quest Offshore Resources – August 2011

Subsea Tree OrdersForecasted at Historically High LevelsSubsea Tree OrdersForecasted at Historically High LevelsForecasted at Historically High LevelsForecasted at Historically High Levels
1,000 58% Growth*
750
1,000
ers
500Tree
Ord
250
0'06 '07 '08 '09 '10 '11F '12F '13F '14F '15F
* 2011-2015 vs 2006-2010
Source: Quest Offshore Resources – Mean Case Forecast, December 2011

Subsea ProductsRevenue by Business SegmentSubsea ProductsRevenue by Business Segment
35%
Revenue by Business SegmentRevenue by Business Segment
ROV Tooling
Field Development Umbilicals
ROV Tooling & Work Packages
e d e e op e tHardware
September YTD 2011
Subsea ProductsSubsea Products
• Required for Every Subsea Completion• Required for Every Subsea Completion
• Subsea Hardware– Umbilicals
• Subsea Hardware– Umbilicals– Tooling– Field Development
IWOCS
– Tooling– Field Development
IWOCS– IWOCS– Connectors & Valves – BOP Control Systems
– IWOCS– Connectors & Valves – BOP Control SystemsBOP Control Systems
• Highly Engineered
BOP Control Systems
• Highly Engineered
• Worldwide Coverage• Worldwide Coverage
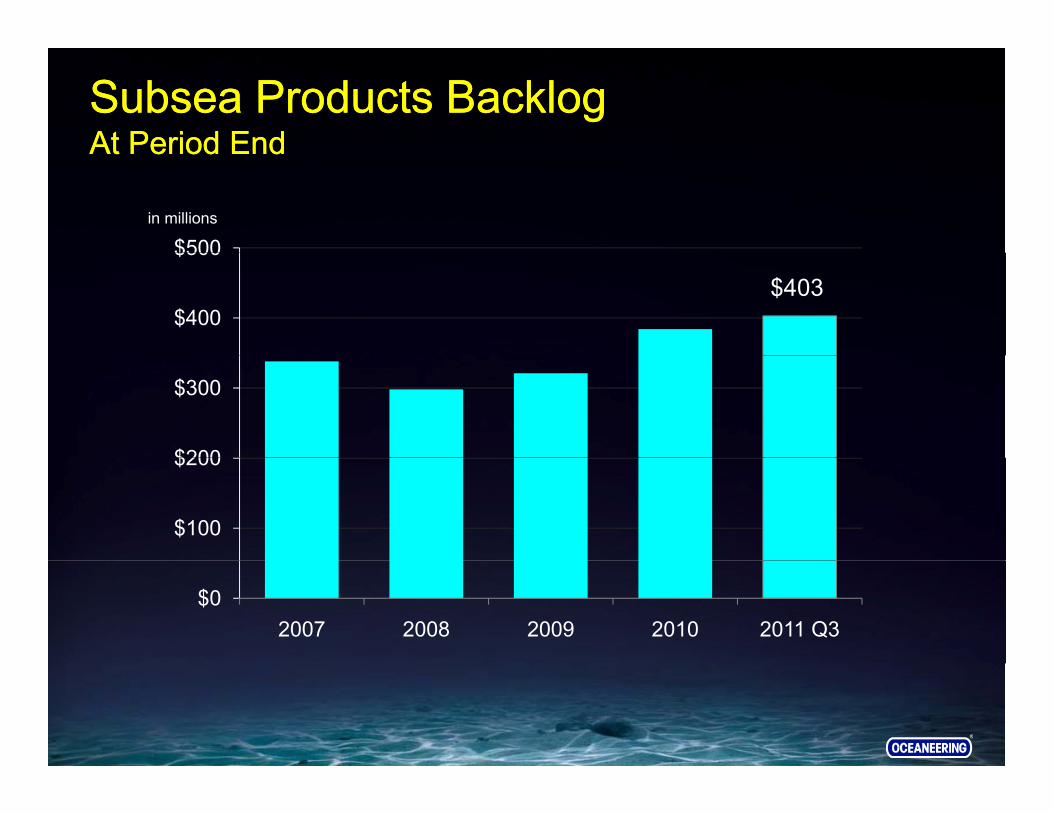
Subsea Products BacklogAt Period EndSubsea Products BacklogAt Period End
$500in millions
At Period EndAt Period End
$403$400
$500
$200
$300
$100
$200
$02007 2008 2009 2010 2011 Q3
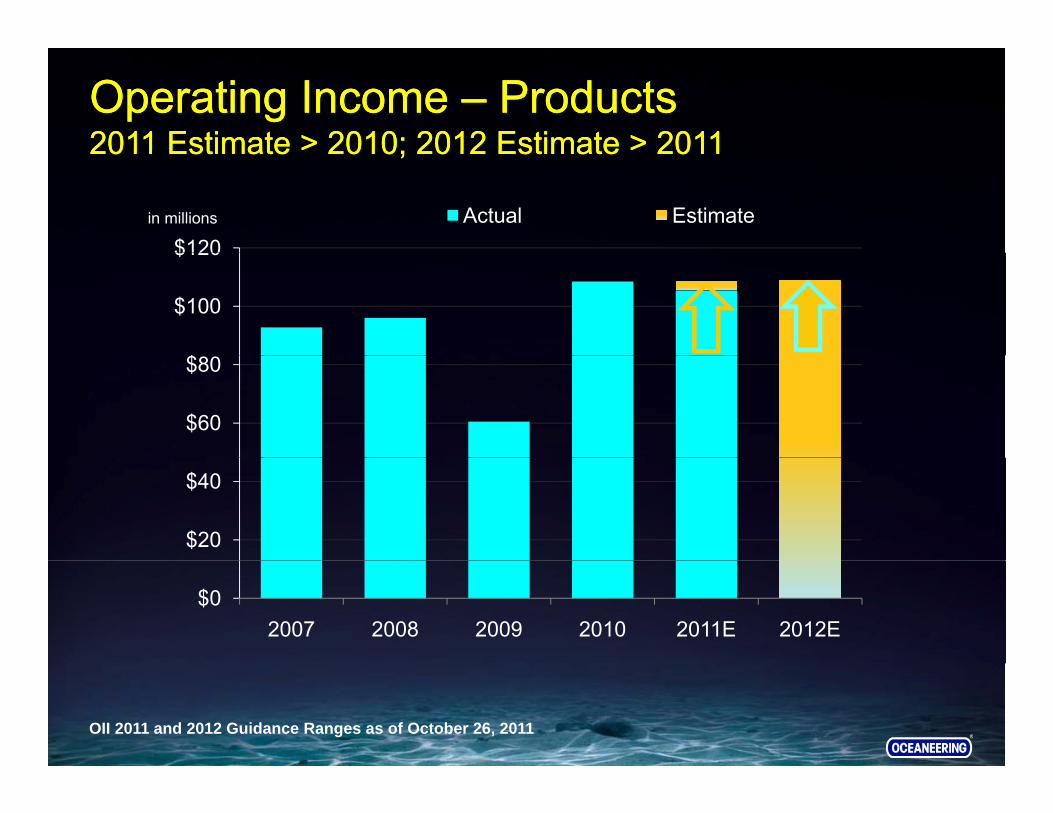
Operating Income – Products2011 Estimate > 2010; 2012 Estimate > 2011Operating Income – Products2011 Estimate > 2010; 2012 Estimate > 2011
$120in millions Actual Estimate
2011 Estimate 2010; 2012 Estimate 20112011 Estimate 2010; 2012 Estimate 2011
$
$100
$120
$60
$80
$20
$40
$02007 2008 2009 2010 2011E 2012E
OII 2011 and 2012 Guidance Ranges as of October 26, 2011
OII Summary
• Diversified OFS Company• Diversified OFS Company
• Leveraged to Deepwater and Subsea Completions• Leveraged to Deepwater and Subsea Completions
• Leading Market Positions in Technical Niches• Leading Market Positions in Technical NichesLeading Market Positions in Technical Niches
• Excellent Earnings Liquidity and Cash Flow
Leading Market Positions in Technical Niches
• Excellent Earnings Liquidity and Cash Flow• Excellent Earnings, Liquidity and Cash Flow• Excellent Earnings, Liquidity and Cash Flow

®®
Supplemental Financial Information
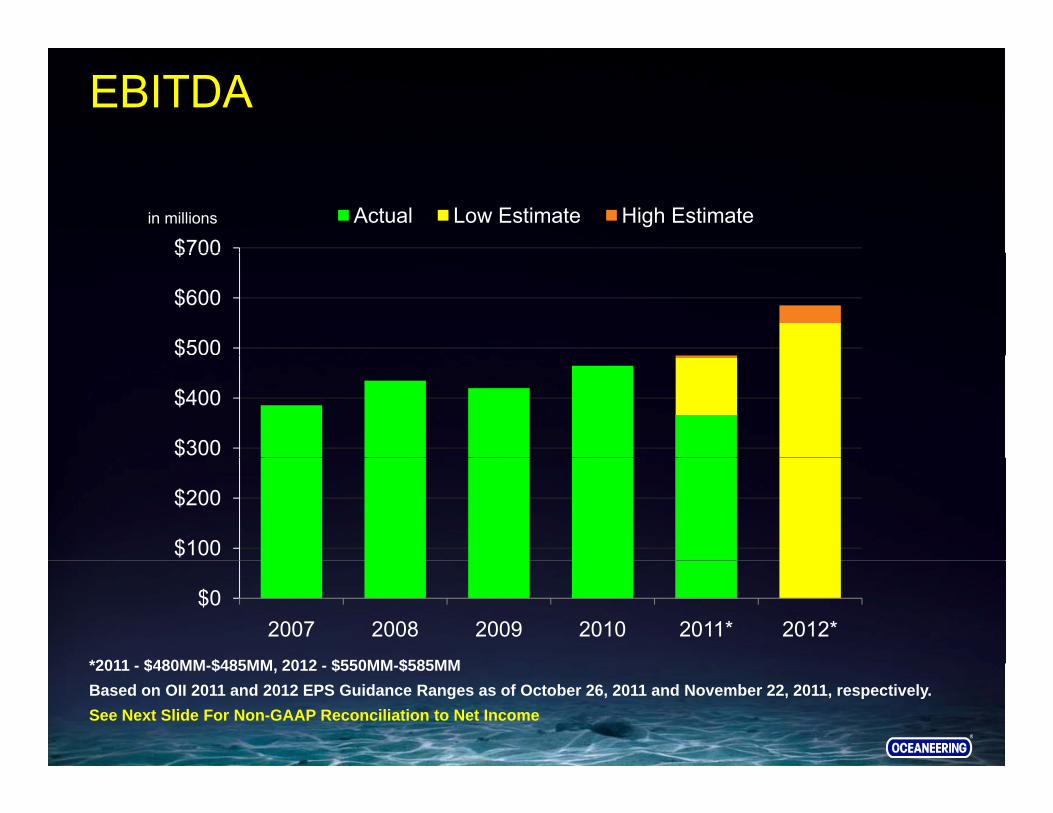
EBITDA
$700in millions Actual Low Estimate High Estimate
$500
$600
$700
$300
$400
$
$100
$200
*2011 $480MM $485MM 2012 $550MM $585MM
$02007 2008 2009 2010 2011* 2012*
*2011 - $480MM-$485MM, 2012 - $550MM-$585MMBased on OII 2011 and 2012 EPS Guidance Ranges as of October 26, 2011 and November 22, 2011, respectively.See Next Slide For Non-GAAP Reconciliation to Net Income
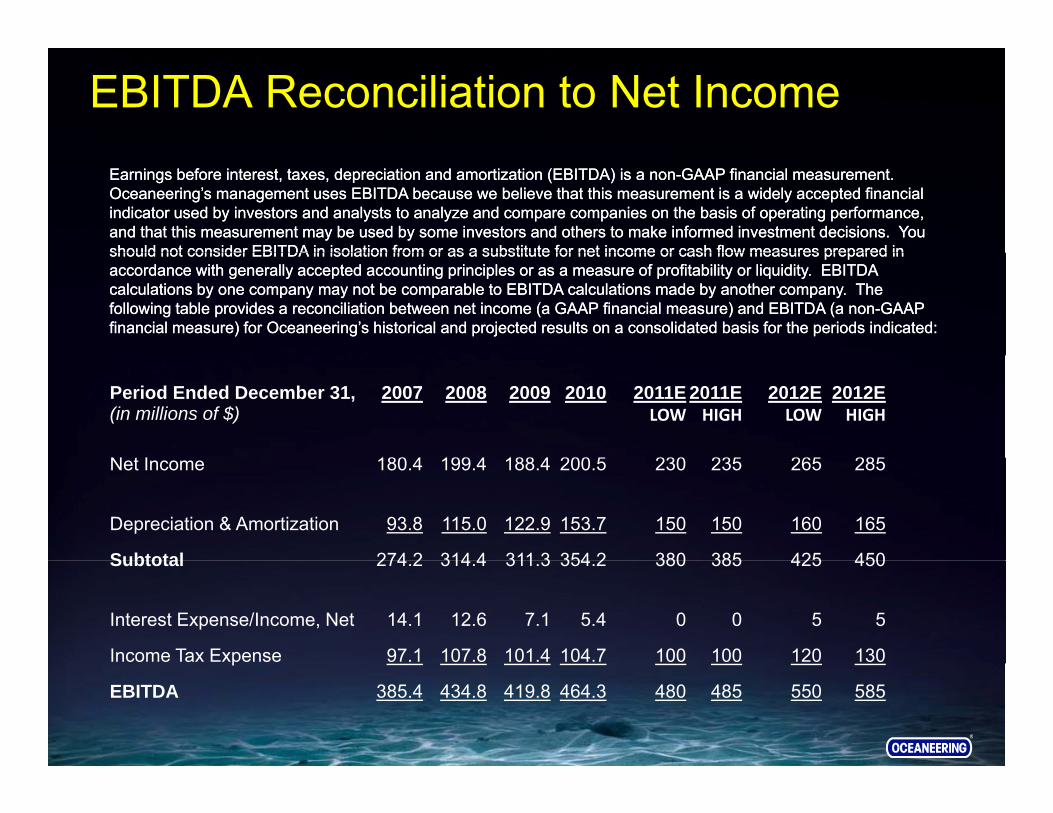
EBITDA Reconciliation to Net IncomeEarnings before interest, taxes, depreciation and amortization (EBITDA) is a non-GAAP financial measurement. Oceaneering’s management uses EBITDA because we believe that this measurement is a widely accepted financial indicator used by investors and analysts to analyze and compare companies on the basis of operating performance, and that this measurement may be used by some investors and others to make informed investment decisions. You should not consider EBITDA in isolation from or as a substitute for net income or cash flow measures prepared in
Earnings before interest, taxes, depreciation and amortization (EBITDA) is a non-GAAP financial measurement. Oceaneering’s management uses EBITDA because we believe that this measurement is a widely accepted financial indicator used by investors and analysts to analyze and compare companies on the basis of operating performance, and that this measurement may be used by some investors and others to make informed investment decisions. You should not consider EBITDA in isolation from or as a substitute for net income or cash flow measures prepared inshould not consider EBITDA in isolation from or as a substitute for net income or cash flow measures prepared in accordance with generally accepted accounting principles or as a measure of profitability or liquidity. EBITDA calculations by one company may not be comparable to EBITDA calculations made by another company. The following table provides a reconciliation between net income (a GAAP financial measure) and EBITDA (a non-GAAP financial measure) for Oceaneering’s historical and projected results on a consolidated basis for the periods indicated:
should not consider EBITDA in isolation from or as a substitute for net income or cash flow measures prepared in accordance with generally accepted accounting principles or as a measure of profitability or liquidity. EBITDA calculations by one company may not be comparable to EBITDA calculations made by another company. The following table provides a reconciliation between net income (a GAAP financial measure) and EBITDA (a non-GAAP financial measure) for Oceaneering’s historical and projected results on a consolidated basis for the periods indicated:
Period Ended December 31, 2007 2008 2009 2010 2011E 2011E 2012E 2012E(in millions of $) LOW HIGH LOW HIGH
N t I 180 4 199 4 188 4 200 5 230 235 265 285Net Income 180.4 199.4 188.4 200.5 230 235 265 285
Depreciation & Amortization 93.8 115.0 122.9 153.7 150 150 160 165
Subtotal 274 2 314 4 311 3 354 2 380 385 425 450Subtotal 274.2 314.4 311.3 354.2 380 385 425 450
Interest Expense/Income, Net 14.1 12.6 7.1 5.4 0 0 5 5
Income Tax Expense 97.1 107.8 101.4 104.7 100 100 120 130p
EBITDA 385.4 434.8 419.8 464.3 480 485 550 585

OII Balance Sheet(in millions)
D 31 D 31 D 31 D 31 S t 30
( )
Dec 31, 2007
Dec 31, 2008
Dec 31, 2009
Dec 31, 2010
Sept 30, 2011
E it $915 $968 $1 224 $1 390 $1 517Equity $915 $968 $1,224 $1,390 $1,517
Debt 200 229 120 0 0
Cash 27 11 162 245 166
Debt/Cap 18% 19% 9% 0% 0%
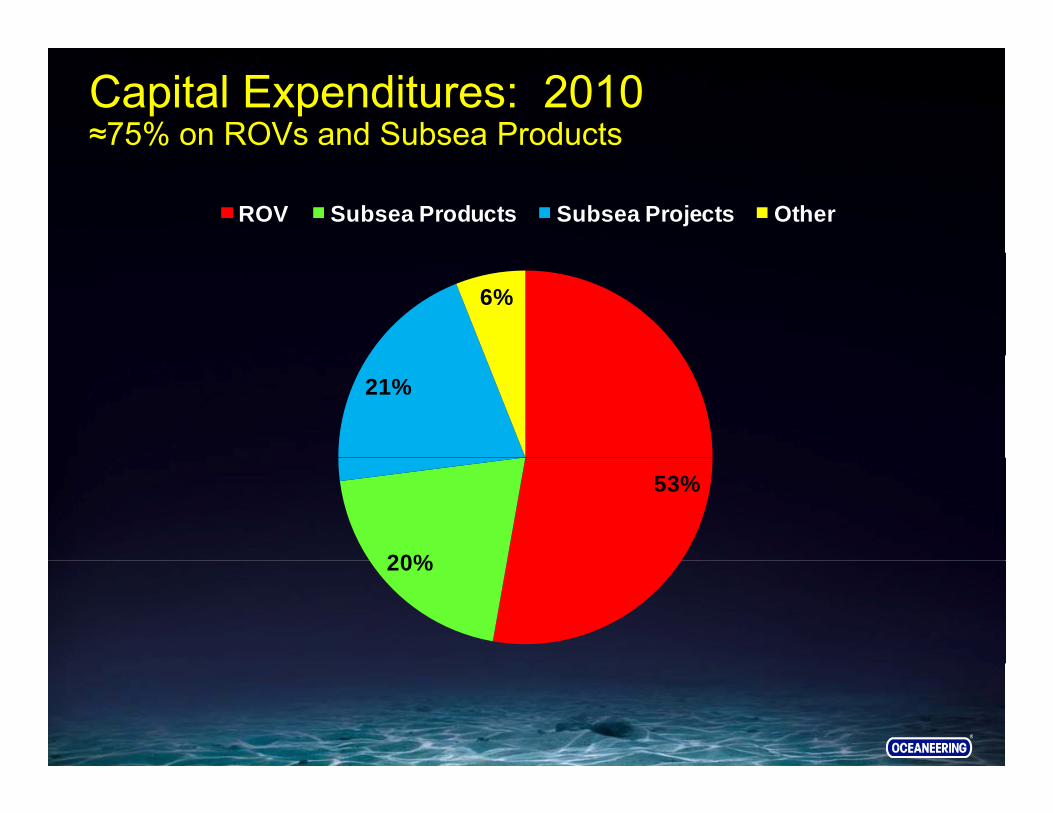
Capital Expenditures: 2010≈75% on ROVs and Subsea Products
ROV Subsea Products Subsea Projects Other
6%
21%
53%
20%20%
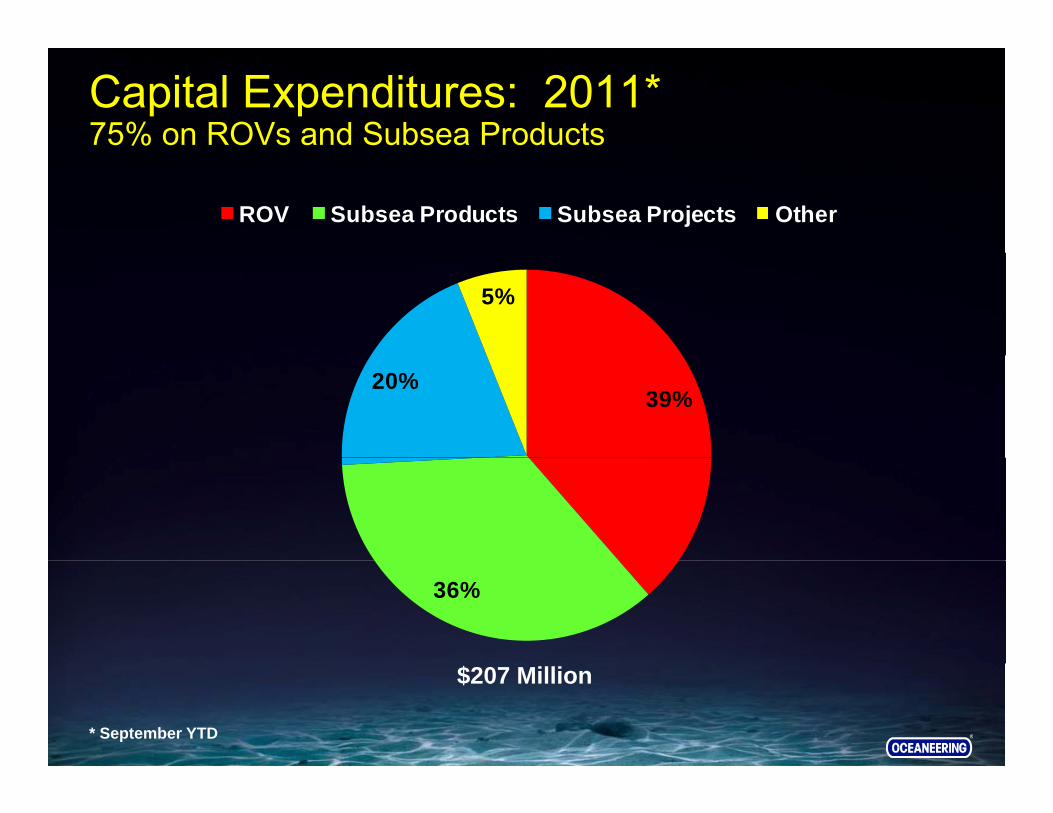
Capital Expenditures: 2011*75% on ROVs and Subsea Products
ROV Subsea Products Subsea Projects Other
5%
39%20%
36%
* September YTD
$207 Million

Business Segment Revenue
% of Oilfield% of Oilfield
90% ROV - 38%
Products - 40%
Inspection - 14%Inspection - 14%
Projects - 8%
Oilfield Non-Oilfield
YTD September 2011

Business Segment Operating Income
% of Oilfield% of Oilfield
97% ROV - 52%
Products - 32%
Inspection - 8%Inspection - 8%
Projects - 8%
Oilfield Non-Oilfield
YTD September 2011

Supplemental Market Information
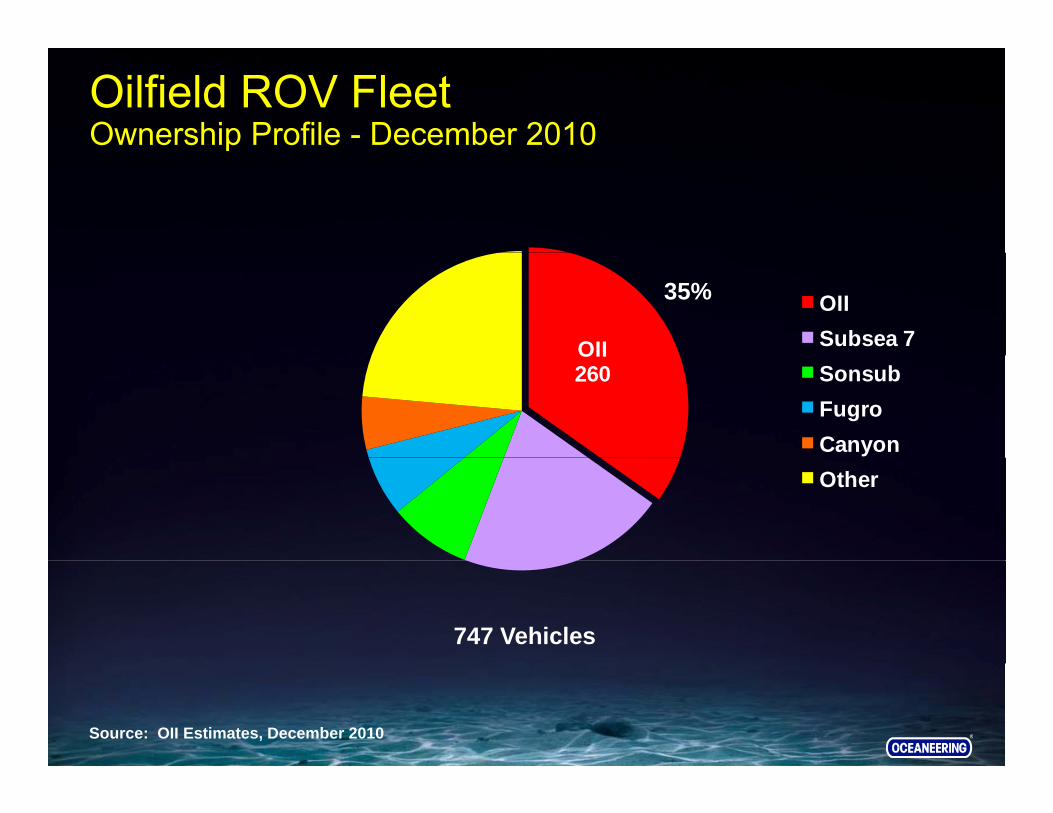
Oilfield ROV FleetOwnership Profile - December 2010p
OII
OIISubsea 7
35%
OII260 Sonsub
FugroCanyonOther
747 Vehicles
Source: OII Estimates, December 2010

OII ROV FleetGeographic Profile – September 2011g p p
1127 56
19
GOM
Africa
5839
19Norway
Brazil
U K58
52
U.K.
Asia/Pac
Can/Mex
262 Vehicles

Oilfield ROV Drill Support MarketSeptember 2011p
OII
Subsea 7
59%
Subsea 7
Fugro
Sonsub
Other
243 Floating Rigs Contracted
Source: ODS-Petrodata and OII Estimates

OII ROV FleetConstruction/Field Maintenance Locations
16
9 GOM
Africa16 Africa
Norway
Other1616
Other
57 Vehicles
September 2011

OII ROV FleetConstruction/Field Maintenance Customers
2532
Operators
Contractors
57 Vehicles
September 2011

Worldwide Umbilical Market Overview Forecasted at Historically High LevelsWorldwide Umbilical Market Overview Forecasted at Historically High Levelsy gy g
30001,000Umbilicals Tree Orders 58% Growth* - Trees
57% Growth* - Umbilicals
2500
3000
750
1,000
KMers
1500
2000
500
cal O
rder
s -K
Tree
Ord
500
1000250 U
mbi
lic
00'06 '07 '08 '09 '10 '11F '12F '13F '14F '15F
* 2011-2015 vs 2006-2010
Source: Quest Offshore Resources – Mean Case Forecast, December 2011

Umbilical Products
Steel Tube UmbilicalsSteel Tube UmbilicalsThermoplastic Hose UmbilicalsThermoplastic Hose Umbilicals
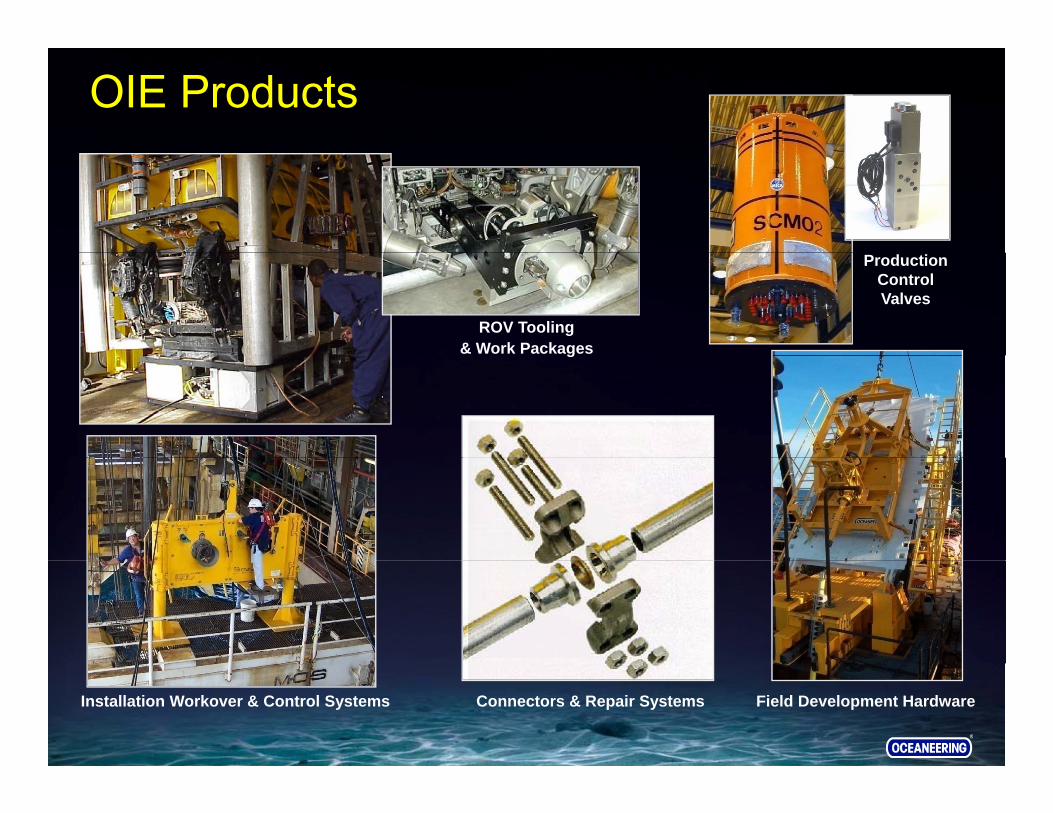
OIE Products
ROV Tooling & Work Packages
Production Control Valves
g
Installation Workover & Control Systems Field Development HardwareConnectors & Repair Systems


