M. Schaap, A. Apituley, R. Koelemeijer, R. Timmermans, G. de Leeuw
Mapping the PM2.5 distribution in the Netherlands using MODIS AOD

AT2, 01 October 2008, HelsinkiMapping the PM2.5 distribution in the Netherlands using MODIS AOD2
Introduction
• Satellite derived AOD may be used to gain insight in the regional PM2.5 distribution
• Goal: To assess the relationship between AOD and PM2.5 in the Netherlands.
• Can we use AOD data at all?• If yes, what is the relation?• When does it apply?• Can we extrapolate the relation at Cabauw to the Netherlands
and estimate PM2.5 concentrations from satellite data?

AT2, 01 October 2008, HelsinkiMapping the PM2.5 distribution in the Netherlands using MODIS AOD3
Cabauw
The combination of the instrumentation at Cabauw provides an unique opportunity to study the AOD-PM2.5 relationship in the Netherlands.
AT2, 01 October 2008, HelsinkiMapping the PM2.5 distribution in the Netherlands using MODIS AOD4
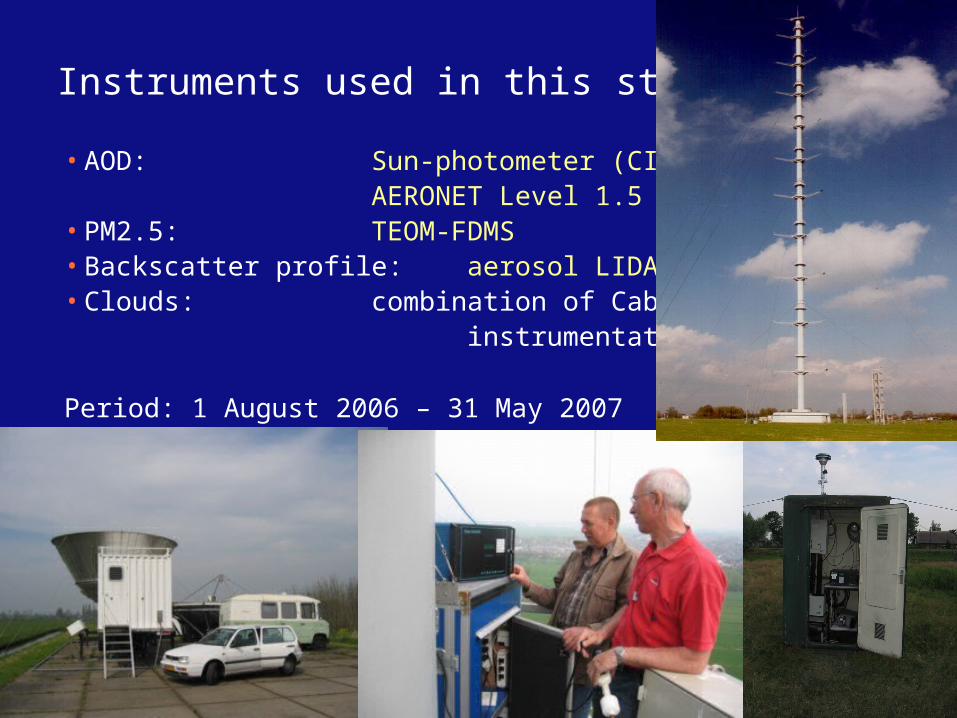
Instruments used in this study
• AOD: Sun-photometer (CIMEL)AERONET Level 1.5
• PM2.5: TEOM-FDMS• Backscatter profile: aerosol LIDAR• Clouds: combination of Cabauw
instrumentation
Period: 1 August 2006 – 31 May 2007

AT2, 01 October 2008, HelsinkiMapping the PM2.5 distribution in the Netherlands using MODIS AOD5
AOD and PM2.5: Timeseries
0
20
40
60
80
100
120
140
160
0
0,5
1
1,5
2
1-Aug 11-Aug 21-Aug 31-Aug 10-Sep 20-Sep 1-Oct
PM2.5 AOD
PM
2.5 A
OD
Date
0
20
40
60
80
100
120
140
160
0
0,5
1
1,5
2
22-Mar 2-Apr 12-Apr 22-Apr 2-May 12-May
PM2.5 AOD
PM
2.5 A
OD
Date
2006
2007
AT2, 01 October 2008, HelsinkiMapping the PM2.5 distribution in the Netherlands using MODIS AOD6
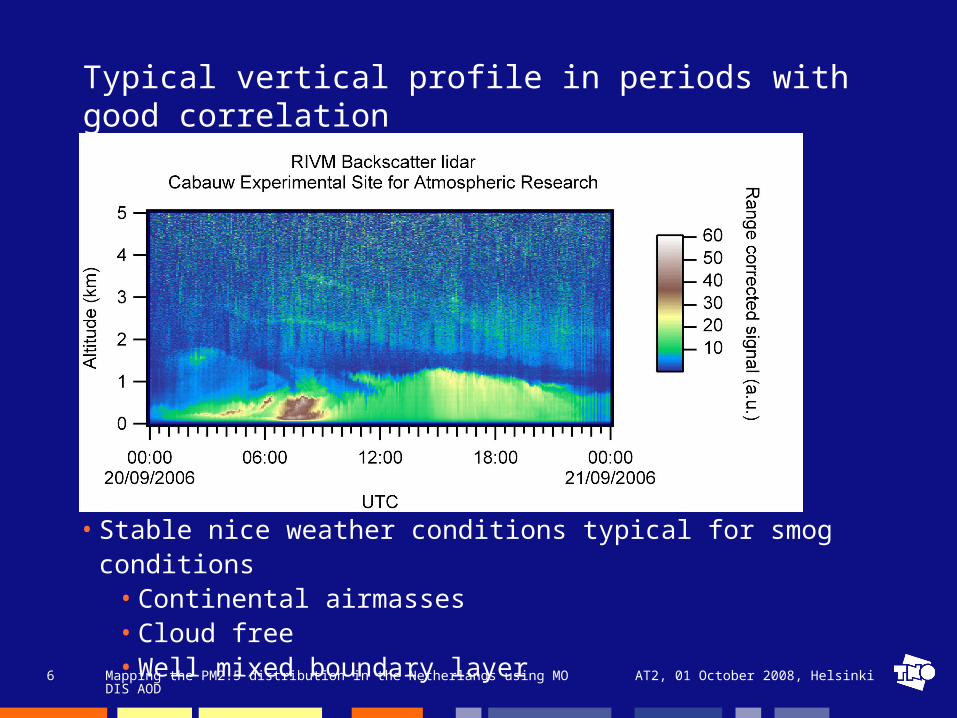
Typical vertical profile in periods with good correlation
• Stable nice weather conditions typical for smog conditions• Continental airmasses• Cloud free• Well mixed boundary layer
AT2, 01 October 2008, HelsinkiMapping the PM2.5 distribution in the Netherlands using MODIS AOD7
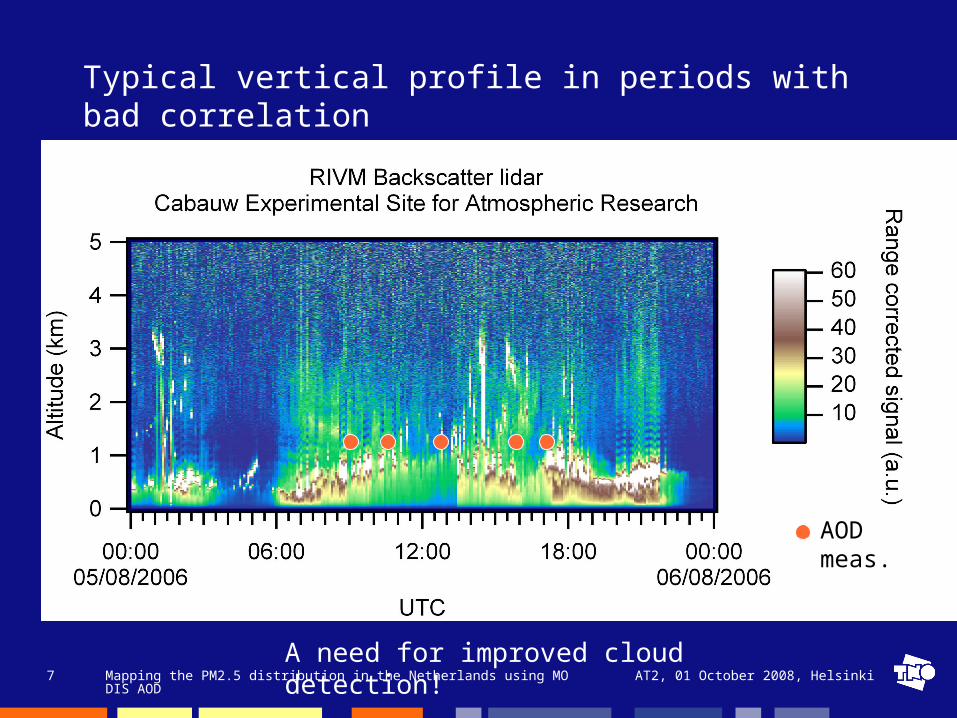
Typical vertical profile in periods with bad correlation
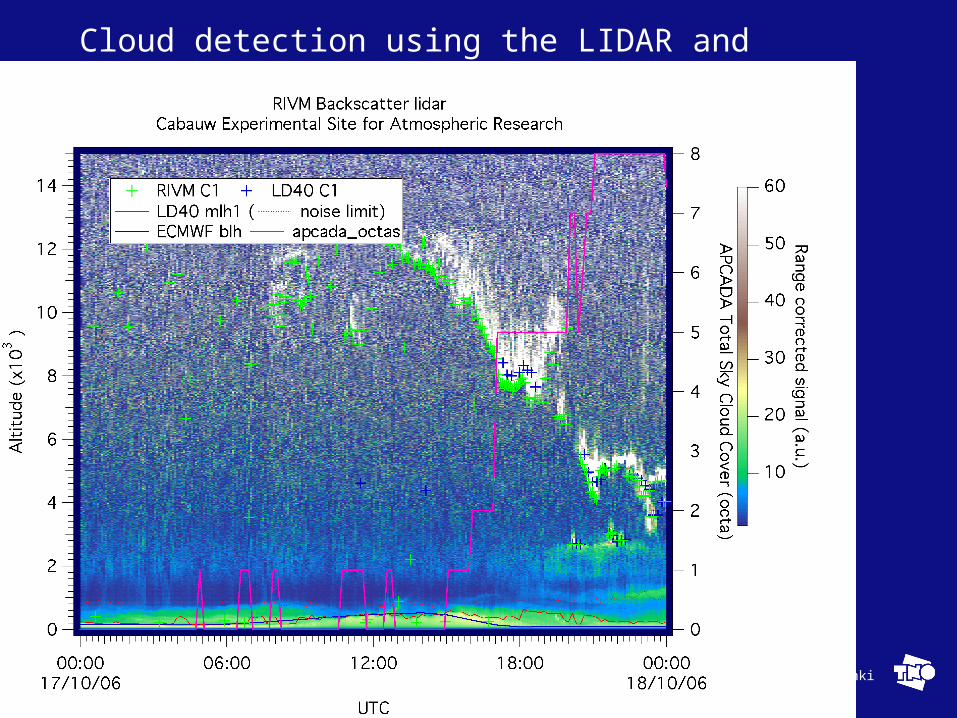
A need for improved cloud detection!
AOD meas.
AT2, 01 October 2008, HelsinkiMapping the PM2.5 distribution in the Netherlands using MODIS AOD8
Cloud detection using the LIDAR and Angstrom coef.

AT2, 01 October 2008, HelsinkiMapping the PM2.5 distribution in the Netherlands using MODIS AOD9
Influence of cloud screening
0
20
40
60
80
100
0 0.2 0.4 0.6 0.8 1 1.2
All data
LIDARy = 10.778 + 40.001x R2= 0.14572
y = 2.8901 + 97.826x R2= 0.40544
PM
2.5
(g
/m3 )
AOD
AT2, 01 October 2008, HelsinkiMapping the PM2.5 distribution in the Netherlands using MODIS AOD10
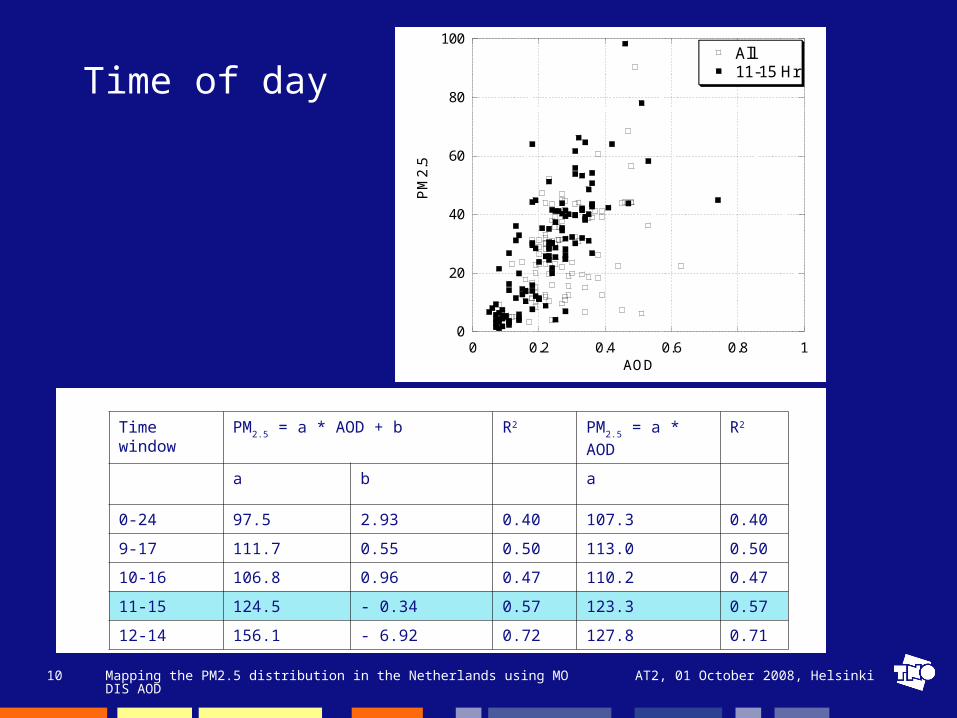
Time of day
0
20
40
60
80
100
0 0.2 0.4 0.6 0.8 1
All11-15 Hr
PM
2.5
AOD
Time window PM2.5 = a * AOD + b R2 PM2.5 = a * AOD R2
a b a
0-24 97.5 2.93 0.40 107.3 0.40
9-17 111.7 0.55 0.50 113.0 0.50
10-16 106.8 0.96 0.47 110.2 0.47
11-15 124.5 - 0.34 0.57 123.3 0.57
12-14 156.1 - 6.92 0.72 127.8 0.71
AT2, 01 October 2008, HelsinkiMapping the PM2.5 distribution in the Netherlands using MODIS AOD11
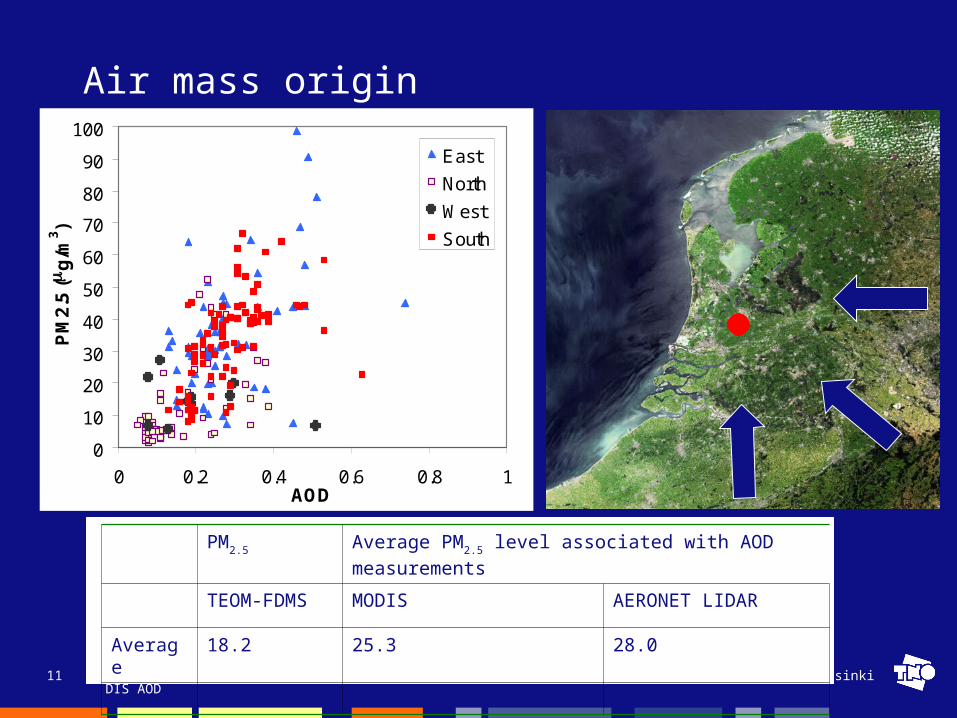
Air mass origin
0
10
20
30
40
50
60
70
80
90
100
0 0.2 0.4 0.6 0.8 1AOD
PM
2.5
(
g/m
3 )
East
North
West
South
PM2.5 Average PM2.5 level associated with AOD
measurements
TEOM-FDMS MODIS AERONET LIDAR
Average 18.2 25.3 28.0
N 3946 35 226
AT2, 01 October 2008, HelsinkiMapping the PM2.5 distribution in the Netherlands using MODIS AOD12
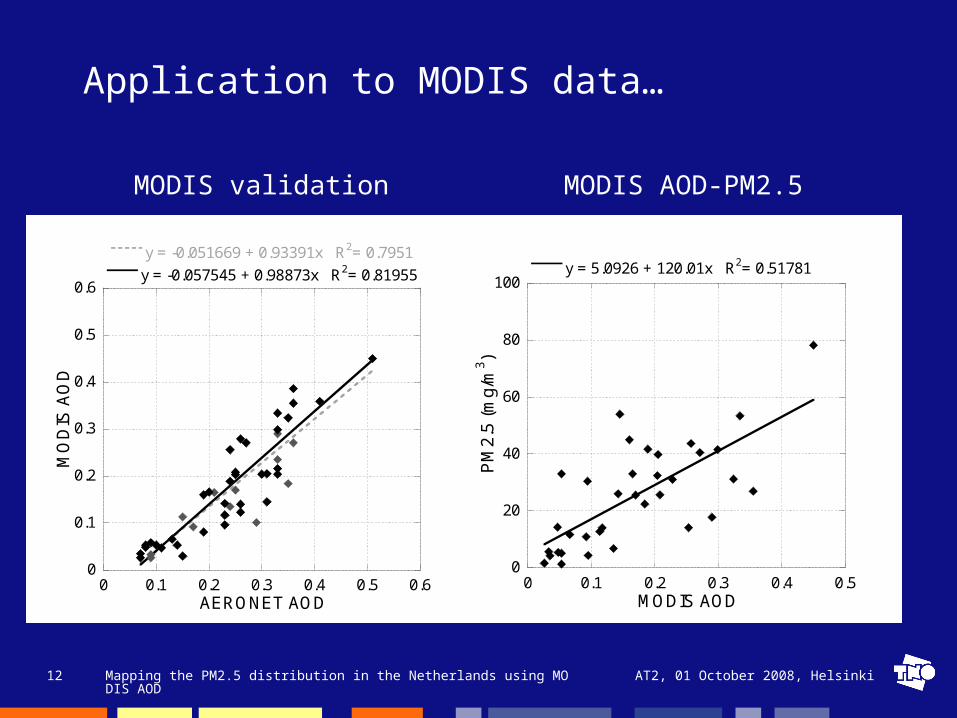
Application to MODIS data…
0
0.1
0.2
0.3
0.4
0.5
0.6
0 0.1 0.2 0.3 0.4 0.5 0.6
y = -0.051669 + 0.93391x R2= 0.7951
y = -0.057545 + 0.98873x R2= 0.81955
MO
DIS
AO
D
AERONET AOD
0
20
40
60
80
100
0 0.1 0.2 0.3 0.4 0.5
y = 5.0926 + 120.01x R2= 0.51781
PM
2.5
(m
g/m
3 )
MODIS AOD
MODIS validation MODIS AOD-PM2.5
AT2, 01 October 2008, HelsinkiMapping the PM2.5 distribution in the Netherlands using MODIS AOD13
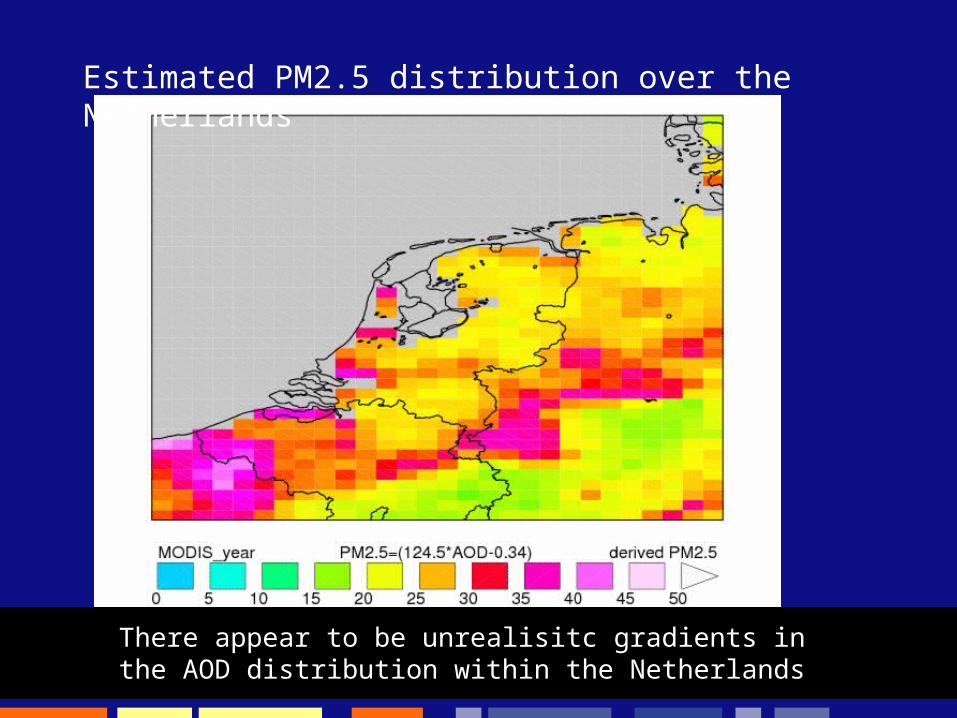
Estimated PM2.5 distribution over the Netherlands
There appear to be unrealisitc gradients in the AOD distribution within the Netherlands
AT2, 01 October 2008, HelsinkiMapping the PM2.5 distribution in the Netherlands using MODIS AOD14
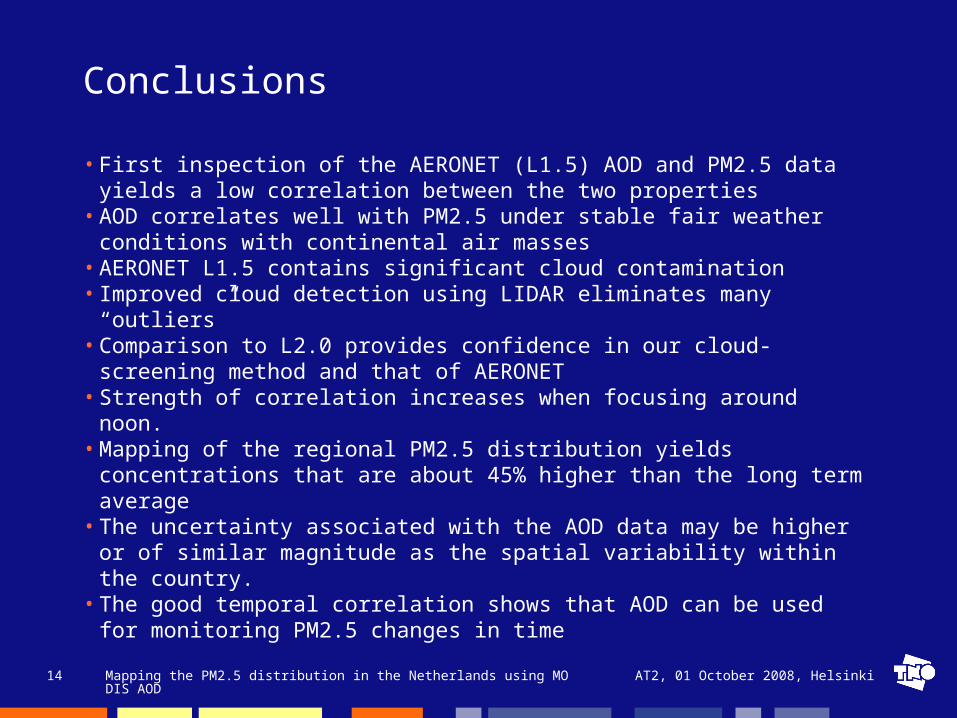
Conclusions
• First inspection of the AERONET (L1.5) AOD and PM2.5 data yields a low correlation between the two properties
• AOD correlates well with PM2.5 under stable fair weather conditions with continental air masses
• AERONET L1.5 contains significant cloud contamination• Improved cloud detection using LIDAR eliminates many “outliers”• Comparison to L2.0 provides confidence in our cloud-screening
method and that of AERONET• Strength of correlation increases when focusing around noon.• Mapping of the regional PM2.5 distribution yields concentrations
that are about 45% higher than the long term average• The uncertainty associated with the AOD data may be higher or
of similar magnitude as the spatial variability within the country.• The good temporal correlation shows that AOD can be used for
monitoring PM2.5 changes in time
AT2, 01 October 2008, HelsinkiMapping the PM2.5 distribution in the Netherlands using MODIS AOD15
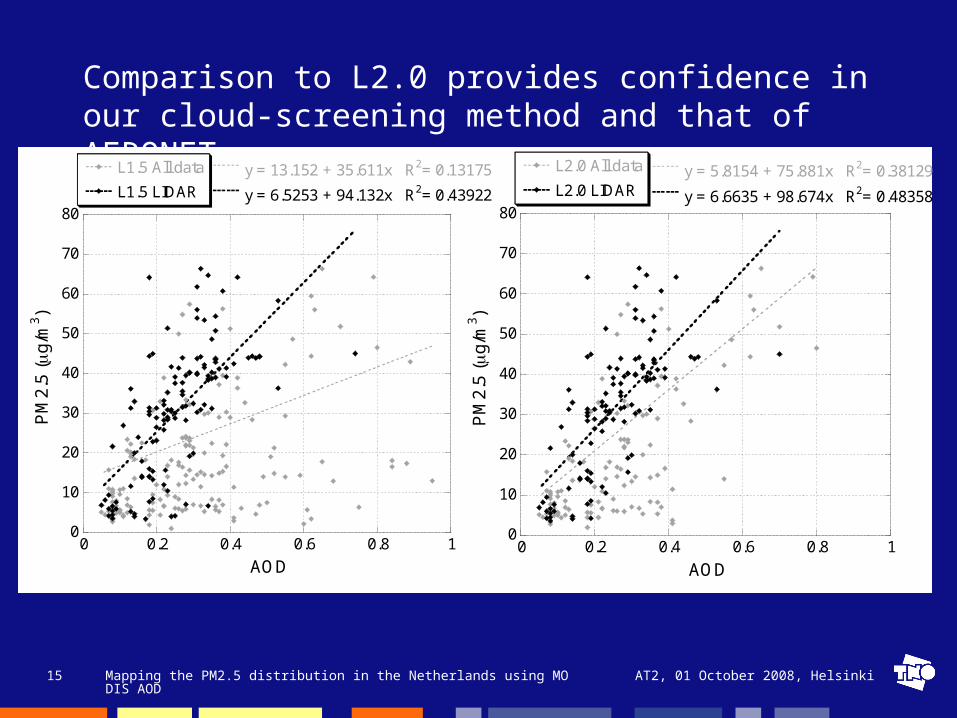
Comparison to L2.0 provides confidence in our cloud-screening method and that of AERONET
0
10
20
30
40
50
60
70
80
0 0.2 0.4 0.6 0.8 1
L1.5 All data
L1.5 LIDARy = 13.152 + 35.611x R2= 0.13175
y = 6.5253 + 94.132x R2= 0.43922
PM
2.5
(g
/m3 )
AOD
0
10
20
30
40
50
60
70
80
0 0.2 0.4 0.6 0.8 1
L2.0 All data
L2.0 LIDARy = 5.8154 + 75.881x R2= 0.38129
y = 6.6635 + 98.674x R2= 0.48358
PM
2.5
(g
/m3 )
AOD


