
Note No. As at Mar 31, 2017 As at Mar 31, 2016
Amount in ` Amount in `
I. EQUITY AND LIABILITIES
Shareholders’ funds(a) Share capital 4 248,893,140 248,728,490 (b) Reserves and surplus 5 148,722,226 78,003,956
397,615,366 326,732,446
Non-current liabilities(a) Long-term borrowings 6 304,669,267 322,889,762 (b) Other Long term liabilities 7 12,402,057 15,772,400
317,071,324 338,662,162
Current liabilities(a) Short-term borrowings 8 1,421,978,258 1,363,511,867 (b) Other current liabilities 9 59,441,024 80,428,899 (c) Short-term provisions 11 26,415,054 11,712,628
1,507,834,336 1,455,653,394
TOTAL 2,222,521,026 2,121,048,002
II. ASSETS
Non-current assets(a) Fixed assets
(i) Property, Plant and Equipment 12 70,409,750 73,384,813
(b) Deferred tax assets (net) 13 8,224,253 1,081,009 (c) Long-term loans and advances 14 184,403,608 274,543,923 (d) Other Non-current assets 15 - -
263,037,611 349,009,745
Current assets(a) Cash and Bank Balances 16 482,492,009 268,266,315 (b) Short-term loans and advances 14 1,428,694,116 1,455,672,055 (c) Other current assets 15 48,297,290 48,099,887
1,959,483,415 1,772,038,257
TOTAL 2,222,521,026 2,121,048,002
For and on behalf of the Board
Santhakumar K Jyothy Prasannan Shanto Paul Anoop P Vani C R
(Chairman) (MD) (CFO) (CS) (Partner)
Place: Valapad
Dated:28.07.2017
- -
Membership No: 232105
Firm Reg. No: 008520S
MABEN NIDHI LIMITED
Balance Sheet as at 31st March 2017
Chartered Accountants
For Manikandan & Associates
As per our Report of even date attached
Particulars

Particulars Note No. Year Ended
31st March 2017
Year Ended
31st March 2016
Amount in ` Amount in `
I Income
Revenue from operations 17 348,543,558 345,763,597
Other income 18 63,089,953 53,250,895
Total Revenue 411,633,511 399,014,492
II Expenses
Employee benefits expenses 19 63,124,809 74,824,851
Finance costs 20 140,771,032 169,899,668
Depreciation and amortization expense 21 6,507,349 70,604,641
Other expenses 22 98,476,420 6,751,844
Total Expenses 308,879,610 322,081,004
III Profit Before Tax 102,753,901 76,933,488
IV Tax expense
(1) Current tax 40,394,160 26,705,140
(2) Tax for earlier years (1,215,286) -
(3) Deferred tax (7,143,244) (760,222)
Total Tax Expense 32,035,630 25,944,918
V Profit for the year 70,718,271 50,988,570
VI Earnings per Equity Share:
(1) Basic 23 2.84 3.21
(2) Diluted 2.84 3.21
For and on behalf of the Board
Santhakumar K Jyothy Prasannan Shanto Paul Anoop P Vani C R
(Chairman) (MD) (CFO) (CS) (Partner)
Place: Valapad
Dated:28.07.2017
MABEN NIDHI LIMITED
Statement of Profit and loss for the year ended 31st March 2017
Membership No: 232105
Chartered Accountants
Firm Reg. No: 008520S
For Manikandan & Associates
As per our Report of even date attached

Particulars As at Mar 31, 2017 As at Mar 31, 2016
Amount in ` Amount in `
A. Cash flow from operating activities
Net profit before taxation 102,753,901 76,933,488
Depreciation and amortization 6,507,349 6,751,844
Interest income (12,256,325) (16,065,987)
Interest expense 138,428,315 169,401,672
Profit/(Loss) on sale of fixed assets 5,578 (290,197)
Increase/(Decrease) in provision for NPA 19,765,658 2,785,164
Operating profit before working capital changes 255,204,476 239,515,984
Movements in working capital :
Decrease / (Increase) in short-term loans and advances 26,977,939 43,386,332
Decrease / (Increase) in other current assets 6,800,406 11,637,591
Decrease / (Increase) long-term loans and advances 90,140,315 (106,959,553)
Increase / (Decrease) in non-current liabilities (15,393,411) 4,119,607
Increase / (Decrease) in current liabilities and provisions (43,339,360) 4,436,379
Cash generated from operations 320,390,365 196,136,340
Direct taxes paid (net of refunds) (39,178,874) (27,030,295)
Net cash flow from/ (used in) operating activities (A) 281,211,491 169,106,045
B. Cash flow from investing activities
Purchase of fixed assets (3,576,021) (6,994,714)
Proceeds from sale of fixed assets 38,156 778,988
Decrease/(increase) in other bank deposits 19,283,893 (5,329,371)
Interest received 5,258,516 16,065,987
Net cash flow from/ (used in) investing activities (B) 21,004,544 4,520,890
C. Cash flow from financing activities
Proceeds from issuance of share capital 164,650 168,070
Proceeds from Short term Bank Borrowings (net) 247,569,063 50,009,668
Deposits received / (repaid) (207,323,167) 3,204,951
Interest paid (93,886,646) (169,401,672)
Dividend paid (10,167,116) (26,871,044)
Tax on dividend paid (5,063,232) (5,960,627)
Net cash flow from/ (used in) financing activities (C) (68,706,448) (148,850,654)
Net increase/ (decrease) in cash and cash equivalents (A + B + C) 233,509,587 24,776,281
Cash and cash equivalents at the beginning of the year 94,756,669 69,980,388
Cash and cash equivalents at the end of the year 328,266,256 94,756,669
- -
Components of cash and cash equivalents:
Cash and cheques on hand 10,209,231 32,228,595
With banks
- on current account 318,057,025 62,528,074
For and on behalf of the Board
Santhakumar K Jyothy Prasannan Shanto Paul Anoop P Vani C R
(Chairman) (MD) (CFO) (CS) (Partner)
Place: Valapad
Dated: 28.07.2017
MABEN NIDHI LIMITED
Membership No: 232105
Firm Reg No: 008520S
For Manikandan & Associates
As per our Report of even date attached
CASH FLOW STATEMENT FOR THE YEAR ENDED 31st MARCH 2017
CHARTERED ACCOUNTANTS

NOTE No. 4
Share Capital
Number Amount in ` Number Amount in `
Authorised shares
Equity Shares of `10/- each 30,000,000 300,000,000 30,000,000 300,000,000
30,000,000 300,000,000 30,000,000 300,000,000
Issued, subscribed and fully Paid-up shares
Equity Shares of `10/-each fully paid up 24,889,314 248,893,140 24,872,849 248,728,490
Total issued, subscribed and fully Paid-up shares 24,889,314 248,893,140 24,872,849 248,728,490
Number Amount in ` Number Amount in `
Shares outstanding at the beginning of the year 24,872,849 248,728,490 12,424,364 124,243,640
Fully paid shares issued during the year 16,465 164,650 16,807 168,070
Bonus shares issued during the year - - 12,431,678 124,316,780
Shares outstanding at the end of the year 24,889,314 248,893,140 24,872,849 248,728,490
No.of Shares held % of Holding No.of Shares held % of Holding
Mr. V.P Nandakumar 9,960,280 40.02% 9,960,280 40.04%
Mrs. Sushama Nandakumar 2,096,000 8.42% 2,096,000 8.43%
Mr. Suhas Nandan 1,600,000 6.43% 1,600,000 6.43%
d. In the period of five years immediately preceding March 31, 2017
(A) Aggregate number and class of shares allotted as fully paid-up pursuant
to contract(s) without payment being received in cash.
(B) Aggregate number and class of shares allotted as fully paid-up by way of
bonus shares.
C) Aggregate number and class of shares bought back
Nil
During the F.Y 2012-13, a sum of `11,11,06,980
(1,23,45,200 Nos of equity shares @ `9 per share) was
capitalized by paying up the unpaid portion of `9/- per equity
share. During the F.Y
2015-16, a sum of Rs.12,43,16,780 (1,24,31,678 Nos of
equity shares @ ` 10 per share) was capitalized by paying as
fully paid up of `10/- per equity share.
Nil
As at 31 March 2017
b. Terms/ rights attached to equity shares
The Company has issued only one class of equity shares having a face value of `10 per share. Each holder of equity shares is entitled to one
vote per share. The company declares and pays dividend in Indian Rupees. The dividend proposed by the Board of Directors are subject to
the approval of the share holders in the ensuing Annual General Meeting. In the event of liquidation of the company, the holders of equity
shares will be entitiled to receive remaining assets of the company, after distribution of all preferential amounts. The distribution will be in
proportion to the number of equity shares held by the shareholders.
c. Details of shareholders holding more than 5% shares in the company
As at 31 March 2016
Name of Shareholder
During the year ended 31 March 2017, the amount of per share dividend recognized as distributions to equity shareholders was ` Nil per
share (31 March 2016: `1/- per share).
As at 31 March 2017
MABEN NIDHI LIMITED
NOTES TO FINANCIAL STATEMENTS FOR THE YEAR ENDED 31st MARCH 2017
Particulars As at 31 March 2017 As at 31 March 2016
Equity Shares
a. Reconciliation of the shares outstanding at the beginning and at the end of the reporting period
As at 31 March 2016

Amount in `
NOTE No. 5
Reserves and Surplus
As at 31 March 2017 As at 31 March 2016
76,196,999 175,642,383
- 124,316,780
- 24,871,396
Closing Balance [A] 76,196,999 76,196,999
1,806,956 5,624,411
70,718,271 50,988,570
- 24,871,396
(-)Tax on interim dividends - 5,063,232
(-) Transfer to general reserve - 24,871,396
Closing Balance [B] 72,525,227 1,806,957
TOTAL [A+B] 148,722,226 78,003,956
NOTE No. 6
Long Term Borrowings
As at 31 March 2017 As at 31 March 2016
NIL NIL
- -
297,619,242 307,024,284
7,050,025 15,865,478
304,669,267 322,889,762
304,669,267 322,889,762
# Details of Long-term borrowings - Term Deposits and Recurring Deposits are given under Note No.33
NOTE No. 7
Other Long Term Liabilities
As at 31 March 2017 As at 31 March 2016
Others
12,023,068 14,548,052
378,989 1,224,348
12,402,057 15,772,400
(-) Amount utilized for issuance of bonus shares
Secured
Unsecured
(a) Deposits
Recurring deposits #
Total
b. Surplus
Opening balance
(+) Profit/(Loss) for the year
a. General Reserves
Opening Balance
(+)Transferred from surplus in Statement of Profit and Loss
MABEN NIDHI LIMITED
(-) Interim dividend `Nil per share (`1 F.Y 2015-16)
Interest accrued but not due
Rent equalisation
NOTES TO FINANCIAL STATEMENTS FOR THE YEAR ENDED 31st MARCH 2017
Term deposits #
Total
MABEN NIDHI LIMITED
NOTES TO FINANCIAL STATEMENTS FOR THE YEAR ENDED 31st MARCH 2017
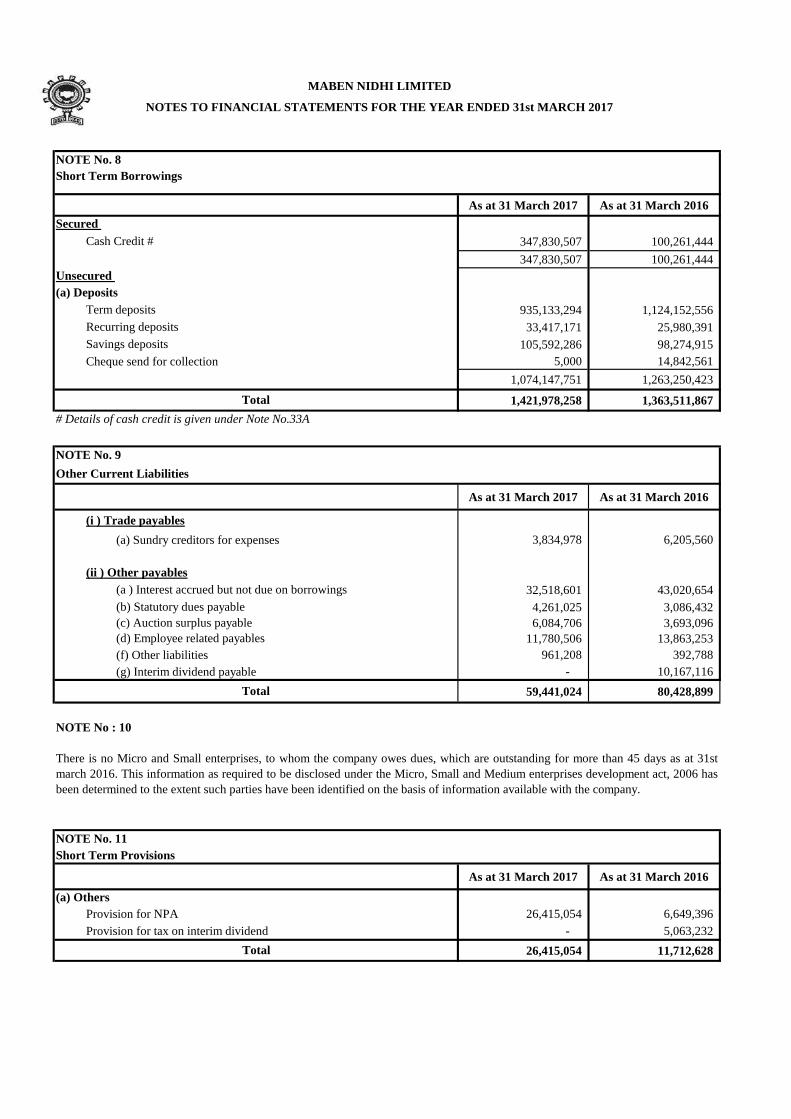
NOTE No. 8
Short Term Borrowings
As at 31 March 2017 As at 31 March 2016
347,830,507 100,261,444
347,830,507 100,261,444
935,133,294 1,124,152,556
33,417,171 25,980,391
105,592,286 98,274,915
Cheque send for collection 5,000 14,842,561
1,074,147,751 1,263,250,423
1,421,978,258 1,363,511,867
# Details of cash credit is given under Note No.33A
NOTE No. 9
Other Current Liabilities
As at 31 March 2017 As at 31 March 2016
(a) Sundry creditors for expenses 3,834,978 6,205,560
32,518,601 43,020,654
4,261,025 3,086,432
6,084,706 3,693,096
11,780,506 13,863,253
(f) Other liabilities 961,208 392,788
(g) Interim dividend payable - 10,167,116
59,441,024 80,428,899
NOTE No : 10
NOTE No. 11
Short Term Provisions
As at 31 March 2017 As at 31 March 2016
Provision for NPA 26,415,054 6,649,396
Provision for tax on interim dividend - 5,063,232
26,415,054 11,712,628
Total
(a ) Interest accrued but not due on borrowings
(b) Statutory dues payable
(c) Auction surplus payable
(a) Deposits
(i ) Trade payables
(ii ) Other payables
Term deposits
Total
(a) Others
Recurring deposits
There is no Micro and Small enterprises, to whom the company owes dues, which are outstanding for more than 45 days as at 31st
march 2016. This information as required to be disclosed under the Micro, Small and Medium enterprises development act, 2006 has
been determined to the extent such parties have been identified on the basis of information available with the company.
Total
Savings deposits
(d) Employee related payables
Unsecured
Cash Credit #
Secured

Fixed Assets
PROPERTY,PLANT & EQUIPMENT
Land Building Furniture &
Fittings
Office
equipment
Electrical
equipments Computer
Electrical
fittings Generator Motor Car Transformer TOTAL
Cost
At 1 April 2015 43,367,478 1,158,924 35,002,544 5,325,301 2,611,094 27,958,204 4,241,737 903,668 1,022,935 1,314,930 122,906,815
Additions - - 593,428 321,067 - 3,163,719 473,739 629,108 1,815,023 - 6,996,084
Deletions - - 4,721,885 2,380,097 1,530,935 13,269,089 877,428 903,668 1,022,935 - 24,706,037
At 31 March 2016 43,367,478 1,158,924 30,874,087 3,266,271 1,080,159 17,852,834 3,838,048 629,108 1,815,023 1,314,930 105,196,862
Cost
At 1 April 2016 43,367,478 1,158,924 30,874,087 3,266,271 1,080,159 17,852,834 3,838,048 629,108 1,815,023 1,314,930 105,196,862
Additions - - 7,989 139,498 1,117,928 2,256,883 53,723 - - - 3,576,021
Deletions - - 163,929 158,254 143,579 1,181,090 8,115 - - - 1,654,967
At 31 March 2017 43,367,478 1,158,924 30,718,147 3,247,515 2,054,508 18,928,627 3,883,656 629,108 1,815,023 1,314,930 107,117,916
Accumulated Depreciation
At 1 April 2015 - 3,232 15,856,739 3,672,968 1,676,967 24,003,558 1,890,722 503,649 971,788 696,457 49,276,080
Charges for the year - 36,811 2,669,517 628,726 270,780 2,414,063 358,608 47,570 190,142 135,627 6,751,844
Disposals - - 4,700,573 2,379,928 1,530,935 13,222,024 877,202 533,425 971,788 - 24,215,875
At 31 March 2016 - 40,043 13,825,683 1,921,766 416,812 13,195,597 1,372,128 17,794 190,142 832,084 31,812,049
Accumulated Depreciation
At 1 April 2016 - 40,043 13,825,683 1,921,766 416,812 13,195,597 1,372,128 17,794 190,142 832,084 31,812,049
Charges for the year - 36,811 2,535,783 554,218 214,788 2,412,079 362,665 39,844 215,534 135,627 6,507,349
Disposals - - 153,431 148,045 143,579 1,158,062 8,115 - - - 1,611,232
At 31 March 2017 - 76,854 16,208,035 2,327,939 488,021 14,449,614 1,726,678 57,638 405,676 967,711 36,708,166
Net Block at 31 March 2016 43,367,478 1,118,881 17,048,404 1,344,505 663,347 4,657,237 2,465,920 611,314 1,624,881 482,846 73,384,813
Net Block at 31 March 2017 43,367,478 1,082,070 14,510,112 919,576 1,566,487 4,479,013 2,156,978 571,470 1,409,347 347,219 70,409,750
-
NOTE No. 12
NOTES TO FINANCIAL STATEMENTS FOR THE YEAR ENDED 31st MARCH 2017
MABEN NIDHI LIMITED
Amount in `
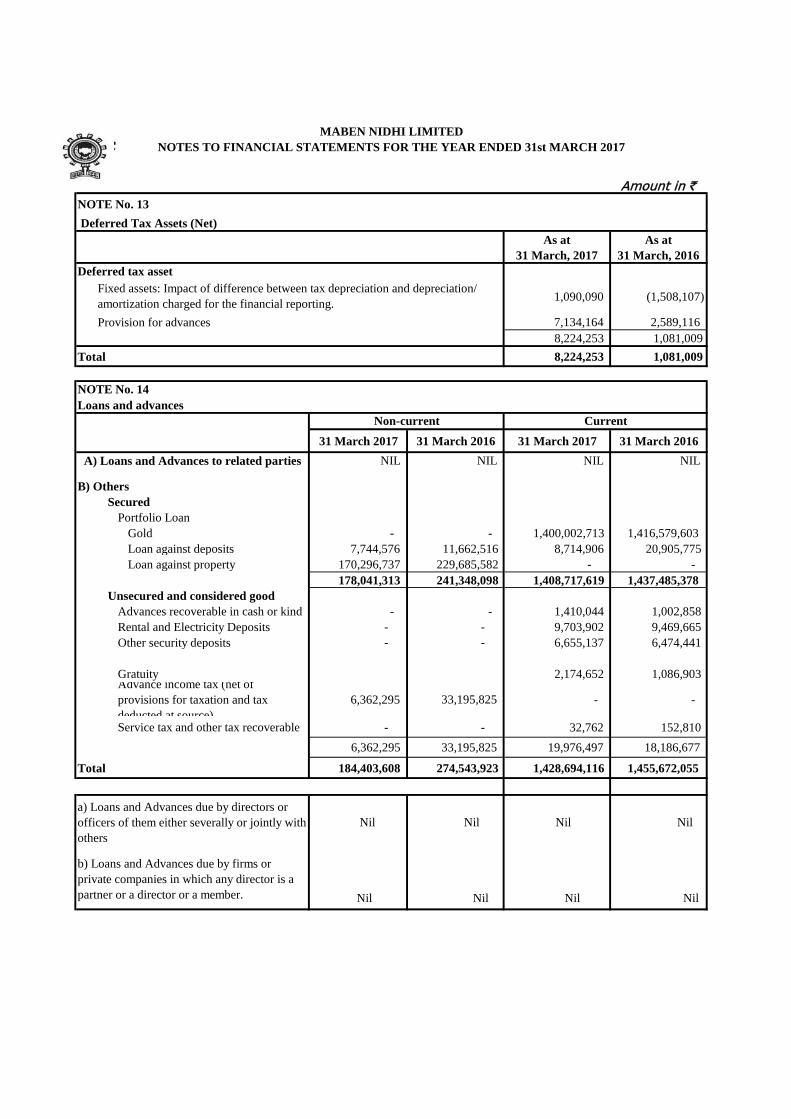
NOTE No. 13
Deferred Tax Assets (Net)
As at
31 March, 2017
As at
31 March, 2016
Deferred tax asset
1,090,090 (1,508,107)
Provision for advances 7,134,164 2,589,116
8,224,253 1,081,009
Total 8,224,253 1,081,009
NOTE No. 14
Loans and advances
31 March 2017 31 March 2016 31 March 2017 31 March 2016
A) Loans and Advances to related parties NIL NIL NIL NIL
B) Others
Secured
Portfolio Loan
Gold - - 1,400,002,713 1,416,579,603
Loan against deposits 7,744,576 11,662,516 8,714,906 20,905,775
Loan against property 170,296,737 229,685,582 - -
178,041,313 241,348,098 1,408,717,619 1,437,485,378
Unsecured and considered good
Advances recoverable in cash or kind - - 1,410,044 1,002,858
Rental and Electricity Deposits - - 9,703,902 9,469,665
Other security deposits - - 6,655,137 6,474,441
Gratuity 2,174,652 1,086,903 Advance income tax (net of
provisions for taxation and tax
deducted at source)
6,362,295 33,195,825 - -
Service tax and other tax recoverable - - 32,762 152,810
6,362,295 33,195,825 19,976,497 18,186,677
Total 184,403,608 274,543,923 1,428,694,116 1,455,672,055
a) Loans and Advances due by directors or
officers of them either severally or jointly with
others
Nil Nil Nil Nil
Nil Nil Nil Nil
MABEN NIDHI LIMITED
NOTES TO FINANCIAL STATEMENTS FOR THE YEAR ENDED 31st MARCH 2017
Fixed assets: Impact of difference between tax depreciation and depreciation/
amortization charged for the financial reporting.
b) Loans and Advances due by firms or
private companies in which any director is a
partner or a director or a member.
CurrentNon-current

MABEN NIDHI LIMITED
NOTES TO FINANCIAL STATEMENTS FOR THE YEAR ENDED 31st MARCH 2017
NOTE No. 15
Other assets
31 March 2017 31 March 2016 31 March 2017 31 March 2016
Non-current bank deposits - - - -
- - - -
Interest accrued:
Loan Portfolio - - 41,299,481 38,704,881
Fixed Deposit - - 6,997,809 9,395,006
- - - -
- - 48,297,290 48,099,887
Total - - 48,297,290 48,099,887
NOTE No. 16
Cash and Bank Balances
31 March 2017 31 March 2016 31 March 2017 31 March 2016
i). Cash & Cash equivalents:
a. Balances with banks Nil Nil
- on current accounts 318,057,025 62,528,074
b. Cheques, drafts on hand 5,000 14,842,561
c. Cash on hand 10,204,231 17,386,034
ii). Other Bank Balances Nil Nil
- on security deposits (Staff) 5,846,945 4,911,810
- on statutory deposits # 148,378,808 168,597,836
Total - - 482,492,009 268,266,315
# Break up of Statutory Deposits are as follows:
Name of the Bank As at 31 March
2017
As at 31 March
2016
As at 31 March
2017
As at 31 March
2016
Yes Bank 73,500,000 66,097,836
Dhanalakshmi Bank 12,000,000 38,000,000
South Indian Bank 30,000,000 30,000,000
Axis Bank 32,878,808 34,500,000
Total - - 148,378,808 168,597,836
Non-current Current
Nil Nil
Non-current Current
Amount in `
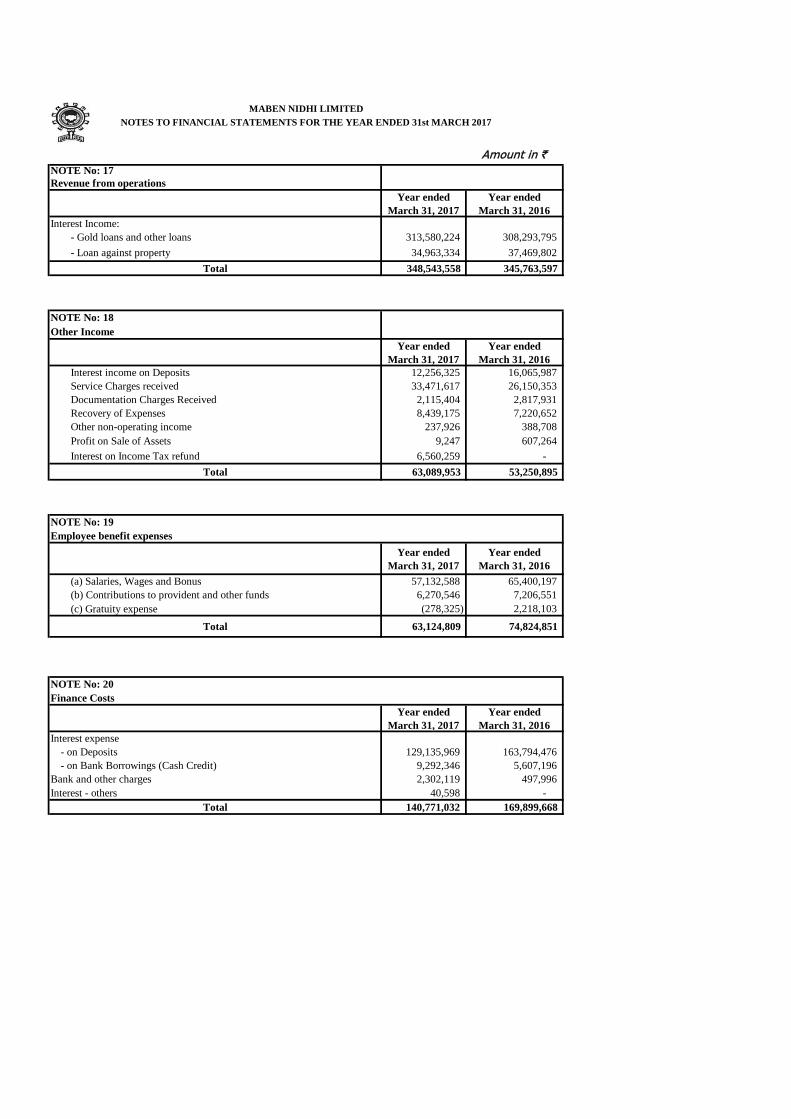
NOTE No: 17
Revenue from operations
Year ended
March 31, 2017
Year ended
March 31, 2016
Interest Income:
- Gold loans and other loans 313,580,224 308,293,795
- Loan against property 34,963,334 37,469,802
Total 348,543,558 345,763,597
NOTE No: 18
Other Income
Year ended
March 31, 2017
Year ended
March 31, 2016
Interest income on Deposits 12,256,325 16,065,987
Service Charges received 33,471,617 26,150,353
Documentation Charges Received 2,115,404 2,817,931
Recovery of Expenses 8,439,175 7,220,652
Other non-operating income 237,926 388,708
Profit on Sale of Assets 9,247 607,264
Interest on Income Tax refund 6,560,259 -
Total 63,089,953 53,250,895
NOTE No: 19
Employee benefit expenses
Year ended
March 31, 2017
Year ended
March 31, 2016
(a) Salaries, Wages and Bonus 57,132,588 65,400,197
(b) Contributions to provident and other funds 6,270,546 7,206,551
(c) Gratuity expense (278,325) 2,218,103
Total 63,124,809 74,824,851
NOTE No: 20
Finance Costs
Year ended
March 31, 2017
Year ended
March 31, 2016
Interest expense
- on Deposits 129,135,969 163,794,476
- on Bank Borrowings (Cash Credit) 9,292,346 5,607,196
Bank and other charges 2,302,119 497,996
Interest - others 40,598 -
Total 140,771,032 169,899,668
MABEN NIDHI LIMITED
NOTES TO FINANCIAL STATEMENTS FOR THE YEAR ENDED 31st MARCH 2017
Amount in `
MABEN NIDHI LIMITED
NOTES TO FINANCIAL STATEMENTS FOR THE YEAR ENDED 31st MARCH 2017
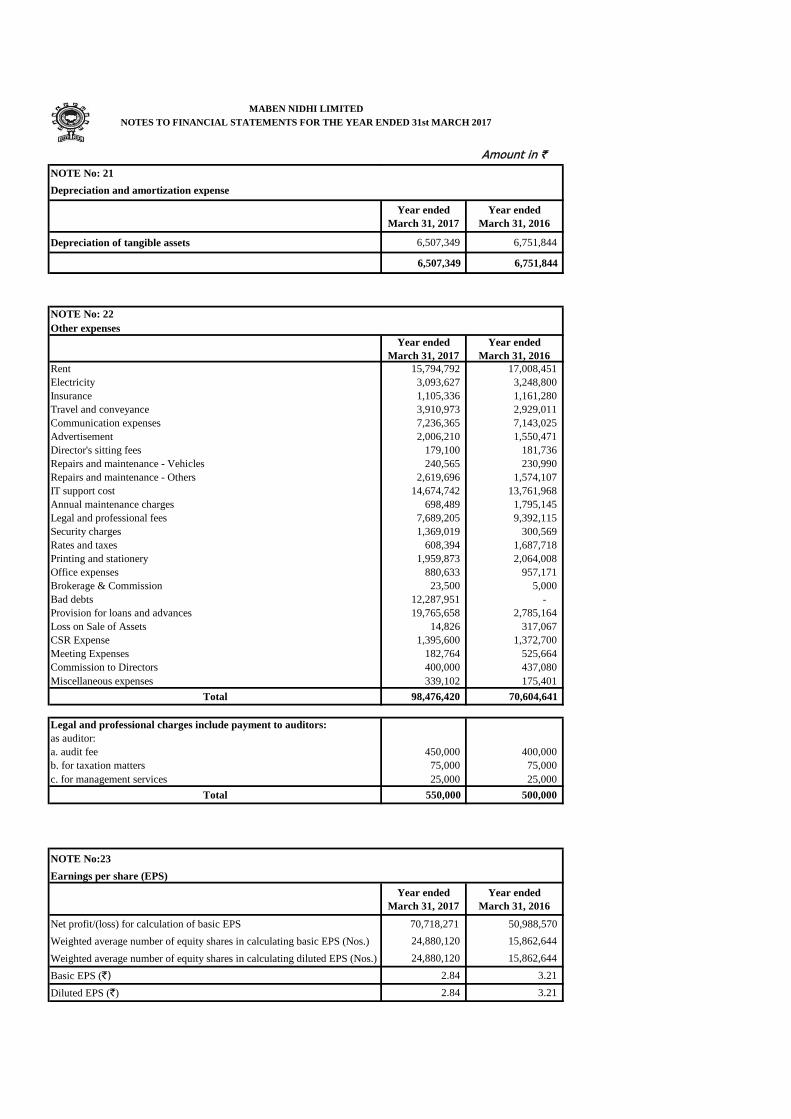
NOTE No: 21
Depreciation and amortization expense
Year ended
March 31, 2017
Year ended
March 31, 2016
Depreciation of tangible assets 6,507,349 6,751,844
6,507,349 6,751,844
NOTE No: 22
Other expenses
Year ended
March 31, 2017
Year ended
March 31, 2016
Rent 15,794,792 17,008,451
Electricity 3,093,627 3,248,800
Insurance 1,105,336 1,161,280
Travel and conveyance 3,910,973 2,929,011
Communication expenses 7,236,365 7,143,025
Advertisement 2,006,210 1,550,471
Director's sitting fees 179,100 181,736
Repairs and maintenance - Vehicles 240,565 230,990
Repairs and maintenance - Others 2,619,696 1,574,107
IT support cost 14,674,742 13,761,968
Annual maintenance charges 698,489 1,795,145
Legal and professional fees 7,689,205 9,392,115
Security charges 1,369,019 300,569
Rates and taxes 608,394 1,687,718
Printing and stationery 1,959,873 2,064,008
Office expenses 880,633 957,171
Brokerage & Commission 23,500 5,000
Bad debts 12,287,951 -
Provision for loans and advances 19,765,658 2,785,164
Loss on Sale of Assets 14,826 317,067
CSR Expense 1,395,600 1,372,700
Meeting Expenses 182,764 525,664
Commission to Directors 400,000 437,080
Miscellaneous expenses 339,102 175,401
Total 98,476,420 70,604,641
Legal and professional charges include payment to auditors:
as auditor:
a. audit fee 450,000 400,000
b. for taxation matters 75,000 75,000
c. for management services 25,000 25,000
Total 550,000 500,000
NOTE No:23
Earnings per share (EPS)
Year ended
March 31, 2017
Year ended
March 31, 2016
Net profit/(loss) for calculation of basic EPS 70,718,271 50,988,570
Weighted average number of equity shares in calculating basic EPS (Nos.) 24,880,120 15,862,644
Weighted average number of equity shares in calculating diluted EPS (Nos.) 24,880,120 15,862,644
Basic EPS (`) 2.84 3.21
Diluted EPS (`) 2.84 3.21
Amount in `
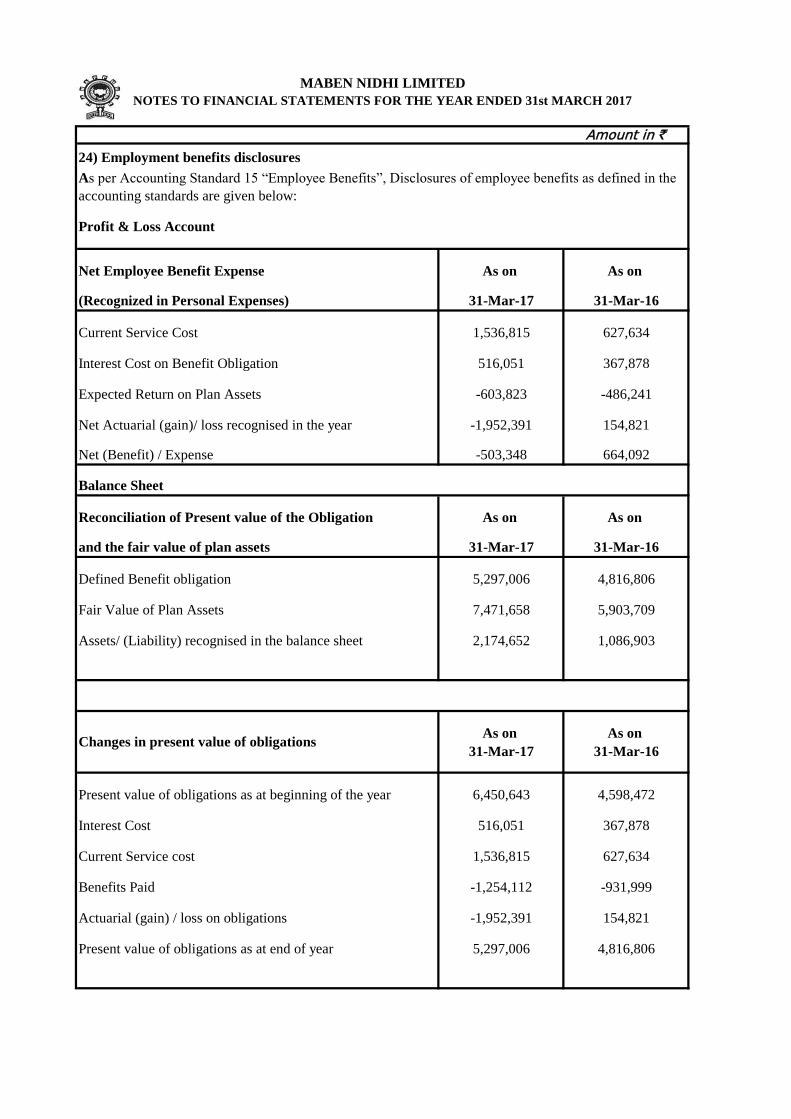
24) Employment benefits disclosures
Profit & Loss Account
Net Employee Benefit Expense As on As on
(Recognized in Personal Expenses) 31-Mar-17 31-Mar-16
Current Service Cost 1,536,815 627,634
Interest Cost on Benefit Obligation 516,051 367,878
Expected Return on Plan Assets -603,823 -486,241
Net Actuarial (gain)/ loss recognised in the year -1,952,391 154,821
Net (Benefit) / Expense -503,348 664,092
Balance Sheet
Reconciliation of Present value of the Obligation As on As on
and the fair value of plan assets 31-Mar-17 31-Mar-16
Defined Benefit obligation 5,297,006 4,816,806
Fair Value of Plan Assets 7,471,658 5,903,709
Assets/ (Liability) recognised in the balance sheet 2,174,652 1,086,903
As on As on
31-Mar-17 31-Mar-16
Present value of obligations as at beginning of the year 6,450,643 4,598,472
Interest Cost 516,051 367,878
Current Service cost 1,536,815 627,634
Benefits Paid -1,254,112 -931,999
Actuarial (gain) / loss on obligations -1,952,391 154,821
Present value of obligations as at end of year 5,297,006 4,816,806
Changes in present value of obligations
MABEN NIDHI LIMITED
NOTES TO FINANCIAL STATEMENTS FOR THE YEAR ENDED 31st MARCH 2017
As per Accounting Standard 15 “Employee Benefits”, Disclosures of employee benefits as defined in the
accounting standards are given below:

As on As on
31-Mar-17 31-Mar-16
Fair value of plan assets at beginning of the year 7,438,596 6,320,879
Expected return on plan assets 603,823 486,241
Contributions 683,350 28,588
Benefits Paid -1,254,112 -931,999
Actuarial Gains / (Losses) NIL NIL
Closing Fair Value of Plan Assets 7,471,657 5,903,709
As on As on
31-Mar-17 31-Mar-16
25) Expenditure in foreign currency Nil Nil
26) Value of imports Nil Nil
27) Value of all imported raw material Nil Nil
28) Foreign remittance on account of dividends Nil Nil
29) Earnings in foreign exchange Nil Nil
30) Contingent liabilities Nil Nil
The estimate of rate of escalation in salary considered in actuarial valuation, take into account inflation,
seniority, promotion and other relevant factors including supply and demand in the Employment market.
The above information is as certified by LIC of India and relied upon by auditors.
Changes in the fair value of plan assets
The principal assumptions used in determining gratuity obligations for the company’s plans are shown
below:
Gratuity premium is paid to LIC of India under gratuity scheme of LIC. The overall expected rate of
return on assets is determined based on the market prices prevailing on that date, applicable to the period
over which the obligation is to be settled.

MABEN NIDHI LIMITED
NOTES TO FINANCIAL STATEMENTS FOR THE YEAR ENDED 31st MARCH 2017
I) List of related parties where control exists and related parties whom transaction have taken place and relationships.
Sl No Name of the related party
1 Manappuram Comptech And Consultants Ltd
2 Manappuram Foundations (charitable trust)
3 Manappuram Agro farms Ltd
4 Manappuram Constructions & Properties P Ltd
5 Manappuram Finance Limited
6 Manappuram Asset Finance Limited
7 Manappuram Healthcare Limited
8 Manappuram Jewellers Ltd
9 Santhakumar K
10 Jyothi Prasannan Director/KMP
11 Venugopal K S Director/KMP
12 Shelly Ekalavyan Director/KMP
13 V.S. Prasannan* Director/KMP
14 V.S Vyasa Babu* Director/KMP
15 Titu Prasannan* Director/KMP
16 V.P.Nandakumar Promotor
17 Sushama Nandakumar Promotor
18 David Romy Jose KMP
19 Shanto Paul KMP
20 Anoop P KMP
21 Athira Prasannan Relative of KMP
22 Parvathy Ekalavyan Relative of KMP
23 Liala Prasannan Relative of KMP
24 Babul V V Relative of KMP
25 Suhas Nandan V Relative of KMP
26 Niniraj Suhas Relative of KMP
27 Amarsingh Relative of KMP
Associate
Director/KMP
31) As per accounting standard 18, the disclosures of transaction with the related parties as defined in the accounting standard are given below:
Relationship
Associate
Associate
Associate
Associate
Associate
Associate
Associate

II) Transactions during the year
SI No. Particulars
31-Mar-17 31-Mar-16 31-Mar-17 31-Mar-16 31-Mar-17 31-Mar-16
1 Remuneration to Directors
Jyothi Prasannan 2,170,000 1,275,000
Shelly Ekalavyan 400,000 391,548
Niniraj Suhas 1,200,000 -
V.S. Prasannan - 557,077
Titu Prasannan - 312,057
2 Remuneration to other KMPS
David Romy Jose 1,288,378 1,206,408
Shanto Paul 1,288,378 1,206,408
Anoop P 808,378 726,408
3 Sitting fee to Directors
Santhakumar K 70,000 70,000
Venugopal K S 70,000 80,000
4 Interest paid on deposit
Shelly Ekalavyan 116,342 10,483
Ekalavyan P K 177,377 -
Suhas Nandan V 24,685 -
Niniraj Suhas 10,188 -
Prasannan P D 744,510 -
Sushama Nandakumar 65,261 39,711
V.S. Prasannan 10,947 14,058
V S Vyasa Babu - 25,856
Titu Prasannan - 269
Adinath K R 20,386 -
Liala Prasannan - 118,454
Athira Prasannan - 1,138
Parvathy Ekalavyan - 26,896
Babul V V - 12,779
Amarsingh - 13,625
Manappuram Constructions & Properties P Ltd - 3,994
5 Deposit from Directors
Shelly Ekalavyan 1,389,090 110,128
Adinath K R 51,480 -
Ekalavyan P K 2,312,318 -
Prasannan P D 15,325,609 -
Sushama Nandakumar 862,602 32,500
Suhas Nandan V 565,402 55,116
Niniraj Suhas 359,760 44,176
V S Prasannan 436,688 -
Liala Prasannan - 746,399
Parvathy Ekalavyan - 280,037
Babul V V - 300,000
6 Commission to Directors
SanthaKumar K 200,000 200,000
Venugopal K S 200,000 200,000
7 Fees for Technical and Consultancy Services
Manappuram Comptech And Consultants Ltd 19,117,004 17,804,754
8 AMC and other charges
Manappuram Constructions & Properties Ltd 274,424 1,675,010
9 Lease Agreement receipt
Manappuram Agro Farms Ltd - 5,240
10 Lease Agreement payment
Manappuram Agro Farms Ltd 79,200 -
11 CSR Expense
Manappuram foundation (Charitable Trust) 1,395,600 1,372,700
Enterprises owned or
significantly influenced by
key management person
Key Management PersonnelRelative of Key Management
Personnel
Related parties have been identified on the basis of the declaration received by the management and other records available.

Amount in `
32) Loan portfolio and Provision for Non Performing Assets for major categories of loan portfolio:
a. Gold loan 1,400,002,713 1,416,579,603 5,306,764 5,732,072 1,394,695,949 1,410,847,531
b. Loan against deposit receipts 16,459,482 32,568,291 - - 16,459,482 32,568,291
c. Loan against property 170,296,737 229,685,582 21,108,290 917,324 149,188,447 228,768,258
TOTAL 1,586,758,932 1,678,833,476 26,415,054 6,649,396 1,560,343,878 1,672,184,080
33) Note 6: Contd . Long-term borrowings - Term Deposits and Recurring Deposits
The Term/Recurring deposits original maturity tenure is more than 12 months.
33A) Note 8: Contd . Cash credit facility from Banks
Sl.No Bank Facility availed
Sanctioned Limit
and Interest rate
Repayment
terms
Primary and
collateral
security
Balance as at
March 31, 2017
Balance as at
March 31, 2016
1 South Indian Bank CCBD
10 Crores
floating
MCLR+0.90%
95,823,123 100,261,444
2 Dhanlakshmi Bank CC
10 Crores
floating
MCLR+0.40%
11,417,392 -
3 Catholic Syrian Bank ODBD
10 Crores
floating
MCLR+0.65%
40,521,689 -
4 State Bank of India CC
20 Crores
floating
MCLR+2.25%
200,068,303 -
34) Managerial remuneration under section 197 of the Companies Act 2013
Current Year Previous Year
Salaries & allowances 2,570,000 2,535,682
35)Disclosure of Specified Bank Notes
SBNs*
Other
denominations Total
12,140,000 919,313.00 13,059,313.00
12,140,000.00 919,313.00 13,059,313.00
(+) Permitted receipts 690,664,579.00 690,664,579.00
(+)Other receipts 99,500.00 99,500.00
(-) permitted payments 682,744,587.00 682,744,587.00
(-) Amount deposited in Banks 12,239,500.00 2,339,289.00 14,578,789.00Closing cash in hand as on
30/12/2016 0.00 6,500,016.00 6,500,016.00
2017 2016
Repayable on
demand
Secured by
exclusive charge
on the entire
current assets of
the company
both present and
future.
The details of SBNs held and transacted during the period from 8 November ,2016 to 30 December ,2016,the denominations wise SBNS and
other notes as per the notification are as follows
Closing cash in hand as on
08/11/2016
MABEN NIDHI LIMITED
NOTES TO FINANCIAL STATEMENTS FOR THE YEAR ENDED 31st MARCH 2017
2016 2017 20162017
Gross loan outstanding Provision for N P A Net loan outstanding
*For the purpose of this clause,the term Specified Bank Notes" shall have same meaning provided in the Notification of government of India,in
the Ministry of Finance,Department of Economic affairsnumber S.O 3407(E) dated 8 November 2016
36)
37) Previous year figures have been regrouped/ reclassified ,where necessary , to conform to this year's classification.
For and on behalf of the Board
Santhakumar K Jyothy Prasannan Shanto Paul Anoop P Vani C R
(Chairman) (MD) (CFO) (CS) (Partner)
Place: Valapad
Dated: 28.07.2017
As per our Report of even date attached
For Manikandan & Associates
Chartered Accountants
Membership No: 232105
Firm Reg No: 008520S
There have been instances of fraud/theft gold on the company by outsiders amount aggregating to `53.06 lakh, out of this `2.30 lakhs is related
to current year.The company has been taking appropriate legal actions to recover the same. The company has made 100% provision in the profit
and loss account.


