
MACROECONOMIC DETERMINANTS OF SUPPLY OF HOUSES
IN REAL ESTATE INDUSTRY IN KENYA
BY
MBUGUA SAMUEL MWAURA
D61/61414/2010
A MANAGEMENT PROJECT SUBMITTED IN PARTIAL
FULFILLMENT OF THE REQUIREMENTS FOR THE AWARD OF
MASTERS IN BUSINESS ADMINISTRATION DEGREE IN THE
UNIVERSITY OF NAIROBI
2013

i
DECLARATION
This research project is my original work and has not been represented before for any
award of a degree in any university.
Signature: _________________________ Date: ___________________
MBUGUA SAMUEL MWAURA
D61/61414/2010
This research project has been submitted for examination with my approval as the
university supervisor
Signature: _________________________ Date: ___________________
DR. J. L. LISHENGA
SUPERVISOR
LECTURER, UNIVERSITY OF NAIROBI.

ii
DEDICATION
To my dear wife Veronicah and our daughter Elaine for your love, support and
encouragement. You prayed for me. This is the reason I stayed away late and deprived
you the precious moments you all deserved. May the Lord almighty bless you
abundantly.
To my mom Jacinta Mbugua and dad Paul Mbugua who have been inspirational in my endeavor
to pursue knowledge and excel in things I do in life. You have given the drive and discipline
to take any task with enthusiasm and determination. To this I say thank you and God
bless you.

iii
ACKNOWLEDGEMENT
It is with great humility that I thank God Almighty who renewed my strength at every
single stage of doing this study.
From the initial stages to the final stage of this project, I owe immense debt of gratitude
to my supervisor Dr. J. L. Lishenga for his indispensable support and invaluable
professional guidance towards this project. His constructive criticism, encouragement and
patience have been instrumental to the completion of this project in time. Many thanks
too to all my lecturers in the School of Business for giving me the extra impetus to go
through the programme.
Finally, I tried to draw a list of all persons to recognize and a few pages would not be
sufficient beside I would hate to overlook anyone and am only human….thus I cease to
rake my mind and leave it to God to acknowledge by way of blessing all who have had a
positive role in this work.
.

iv
TABLE OF CONTENTS
DECLARATION............................................................................................................................ i
DEDICATION............................................................................................................................... ii
ACKNOWLEDGEMENT ........................................................................................................... iii
TABLE OF CONTENTS ............................................................................................................ iv
LIST OF TABLES ....................................................................................................................... vi
LIST OF FIGURES .................................................................................................................... vii
ABSTRACT ................................................................................................................................ viii
CHAPTER ONE ........................................................................................................................... 1
INTRODUCTION......................................................................................................................... 1
1.1 Background to the Study .......................................................................................................... 1
1.2 Statement of the Problem .......................................................................................................... 5
1.3 Objectives of the Study ............................................................................................................. 8
1.4 Research Questions ................................................................................................................... 9
CHAPTER TWO ........................................................................................................................ 11
LITERATURE REVIEW .......................................................................................................... 11
2.1 Introduction ............................................................................................................................. 11
2.2 Theoretical review .................................................................................................................. 11
2.3 Determinants of the Supply of Houses in the Economy ......................................................... 14
2.4 Empirical Evidence on Determinants of Supply of Houses in Kenya .................................... 17
2.5 Summary of the review ........................................................................................................... 21
2.6 Conceptual Framework ........................................................................................................... 21
v
CHAPTER THREE .................................................................................................................... 23
RESEARCH METHODOLOGY .............................................................................................. 23
3.1 Introduction ............................................................................................................................. 23
3.2 Research Design...................................................................................................................... 23
3.3 Population ............................................................................................................................... 24
3.4 Data Collection Instruments and Procedure ........................................................................... 24
3.5 Data Analysis .......................................................................................................................... 25
CHAPTER FOUR ....................................................................................................................... 28
DATA ANALYSIS, RESULTS AND DISCUSSION ............................................................... 28
4.1 Introduction ............................................................................................................................ 28
4.2 Study Findings ....................................................................................................................... 28
CHAPTER FIVE ........................................................................................................................ 34
SUMMARY, CONCLUSION AND RECOMMENDATIONS............................................... 34
5.1 Introduction ............................................................................................................................ 34
5.2 Summary of the Findings ....................................................................................................... 34
5.3 Conclusions ............................................................................................................................ 35
5.4 Recommendations .................................................................................................................. 35
REFERENCES ............................................................................................................................ 37
APPENDICES ............................................................................................................................. 39
Appendix I: Inflation Rates .......................................................................................................... 39
Appendix II: Overall Weighted Lending Rate ............................................................................. 40
Appendix III: Gross Domestic Product (GDP) Values ................................................................ 41
Appendix IV: Value of New Houses Supplied .......................................................................... 412

vi
LIST OF TABLES
Table 2.1 Real Estate Sector Contribution to GDP........................................................... 16
Table 2.2 Real Estate Growth Rate ................................................................................... 16
Table 4.1 Model Summary ............................................................................................... 32
Table 4.2 Coefficients Results .......................................................................................... 33
vii
LIST OF FIGURES
Figure 2.1 Conceptual Framework ................................................................................... 22
Figure 4.1 Average Annual Inflation ................................................................................ 29
Figure 4.2 Overall Weighted Lending Rate ...................................................................... 29
Figure 4.3 GDP (in Percentage) ........................................................................................ 30
Figure 4.4 Value of New Houses Supplied ....................................................................... 31
Figure 4.5 Trend Line ....................................................................................................... 31

viii
ABSTRACT The purpose of the study was to investigate the determinants of supply of houses in real
estate sector. Specifically, the study sought to establish whether inflation (price level
changes), growth rate in Gross Domestic Product (GDP) and interest rate offered by
financiers affect the supply of real estate in the market. The study adopted descriptive
correlational research design. The target population consisted of all the new houses
constructed in Kenya annually. Secondary data was used. The data collected included,
data on new houses built annually and price levels of houses in Kenya was obtained from
the real estate firms, data for interest rate was obtained from the Central Bank of Kenya
(CBK) while data for growth of GDP was obtained from the yearly economic surveys and
the statistical abstracts between from Kenya Bureau of statistics. The study adopted the
regression model to analyze the data. The data was analyzed using statistical software
specifically, SPSS version 18 and presented in form of tables and graphs. The study
found a positive and significant relationship between supply of houses in real estate
sector in Kenya and the price levels and growth in GDP. It was concluded that growth of
GDP, price levels and interest levels have an influence on supply of houses. An increase
in interest rates affects lending and thereby affecting the supply of the houses. The
researcher recommends that the government should streamline the various real estate
policies also establish a housing loan guarantee scheme run by existing government
housing corporations to assess risks in some real estate development and also encourage
financiers to lend more and at affordable interest rates.
1
CHAPTER ONE
INTRODUCTION
1.1 Background to the Study
This section is a brief overview of the problem the researcher aspires to tackle.
1.1.1 Theoretical background
Real estate can be defined as the land and its permanent improvements. According to
Harvey (1981), real estate refers to a particular type of good, land or resources that is not
physically movable. Although real estate is a tangible asset, it can also be viewed as a
bundle of intangible rights or privileges associated with the ownership and use of the site
and improvements (Ling & Archer, 2008)
The main participants in real estate markets are: Owner-users who are both owners and
tenants. They purchase houses or commercial property as an investment and also to live
in or utilize as a business. We have owners who are pure investors. They do not consume
the real estate that they purchase. Typically they rent out or lease the property to someone
else. Renters on the other hand are pure consumers. Developers are people who prepare
raw land for building, which results in new products for the market while renovators
supply refurbished buildings to the market. The last participants are facilitators. This
group includes banks, real estate brokers, lawyers and others that facilitate the purchase
and sale of real estate.
2
Real estate has several unique characteristics that affect its value. The first one is
durability. A building can last for decades or even centuries, and the land underneath it is
practically indestructible. Because of this, real estate markets are modeled as a stock/flow
market. About 98% of supply consists of the stock of existing houses, while about 2%
consists of the flow of new development. The stock of real estate supply in any period is
determined by the existing stock in the previous period, the rate of deterioration of the
existing stock, the rate of renovation of the existing stock, and the flow of new
development in the current period. The effect of real estate market adjustments tend to be
mitigated by the relatively large stock of existing buildings.
Real estate are heterogeneous. Every unit of real estate is unique in terms of its location,
the building, and its financing. This makes pricing difficult and creates information
asymmetry, and greatly restricts substitutability. To get around this problem, economists,
beginning with Muth (1960), define supply in terms of service units; that is, any physical
unit can be deconstructed into the services that it provides. Olsen (1969) describes these
units of housing services as an unobservable theoretical construct. Housing stock
depreciates, making it qualitatively different from new buildings. The market-
equilibrating process operates across multiple quality levels. Further, the real estate
market is typically divided into residential, commercial, and industrial segments. It can
also be further divided into subcategories like recreational, income-generating, historical
or protected, and the like.
It is both an investment good and consumption good. Real estate can be purchased with
the expectation of attaining a return thus an investment good or with the intention of
3
using it hence a consumption good, or both. These functions may be separated with
market participants concentrating on one or the other function or combined in the case of
the person that lives in a house that they own. This dual nature of the good means that it
is not uncommon for people to over-invest in real estate that is, to invest more money in
an asset than it is worth on the open market.
Real estate are also immobile. Real estate is locationally immobile. Consumers come to
the good rather than the good going to the consumer. This being the case, there can be no
physical marketplace. This spatial fixity means that market adjustment must occur by
people moving to dwelling units, rather than the movement of the goods. These unique
characteristics make real estate different from the other traditional investment vehicles.
1.1.2 Contextual background
In Kenya real estate market in both rural and urban is characterized by a mismatch
between demand and supply of assets. If we consider the residential submarket as an
example, which is a major part of the overall real estate first the annual supply of
residential units fall short of demand estimated at 200,000 units. Secondly, for the new
units being supplied, the actual price set by market is way above what the majority of
buyers and tenants are willing and able to pay. This has resulted into burgeoning of slums
and related social ills including insecurity and poor standards of living. As a result
ownership of residential structures in Kenya is way out of reach to majority of its
citizens. The real estate market is characterized by a number of weaknesses including low
supply, financial and regulatory constraints.

4
Real estate growth is the sustained increase in the number of houses being constructed or
supplied in the market. Over the past few years there has been a rapid increase in the
number of houses being built in the country. Economic survey(2009) indicates that the
building and construction sector recorded a growth of 8.3% in 2008 compared to 6.9% in
2007.This was not only the highest growth for the sector since 1998 but also the highest
recorded across the sectors in 2008.
The developers of real estates in Kenya do not use their personal savings as the only
source of finance given that real estate development requires heavy financing, which may
go way beyond what an individual or organization has accumulated as savings over time.
In this regard therefore, developers always turn to the lenders of housing finance in order
to compliment their inadequate finances. Interest rates charged on mortgages and
construction loans is therefore of paramount importance in analyzing the supply of
houses in real estate
The government housing policy objectives for the private sector were stated in the 1989-
1993 development plans. These were; to increase home ownership for low income
earners, to provide long-term mortgage funds to the purchasers of houses and enhance the
private sector capacity to plan, develop and finance low cost housing for the low income
families and individuals which has not been the case.
Kenya country report (2010) records that the government in consultation with other
stakeholders has continued to formulate various policies to guide and enhance access to
housing and thereby increase the quantity of real estate available with considerable

5
degree of success. This has given way to a more pragmatic strategy of enabling other
actors to get involved in this sector.
Ayogu (1995) records that Kenya‟s housing sector has evolved from being controlled by
the government and its agencies as suppliers of housing to the current situation where
concrete efforts have been made to involve the private sector. Consequently, the number
of public buildings completed annually has decreased from 167 units in 1994 to 99 units
in 1996 a 40% decline. Comparatively, reported completions of new private residential
buildings in main towns over the same period increased from 1062 units in 1994 to 1434
units in 1996 an increase of 35%. Therefore the private sector both formal and informal
remains the largest producer of housing units in the country. Lately in the 2000s, Public
Private Partnerships (PPP) has been embraced as an approach to provision of housing
pursuant to Millennium Development Goals (MDGs).The 5th session world urban forum
(Kenya country report) indicates that the housing policy adopted by the government in
June 2004 is intended to bridge the shortfall in housing stock arising from demand that
far surpasses supply particularly in urban areas. This has not been achieved yet.
A few studies have been done on housing supply but they largely touched on the aspect
of price of houses. It is the intention of this study to fill this gap by evaluating the
determinants of supply of houses in real estates.
1.2 Statement of the Problem
Real estate growth is the sustained increase in the number of houses being constructed or
supplied in the market. Despite the fact that quantity supplied of real estate has increased,
6
this supply is still too far below the quantity demanded in the market. Central Bank
Governor Prof. Njuguna Ndung‟u (2010) at the forum for growing real estate through
finance argues that housing is a major thrust of the Vision 2030. He continues to note that
housing lies at an estimated annual demand of 150,000 units while the supply is barely at
35,000 leaving a gap of 115,000. Aritho (1990) further argues and considers housing as
the major problem in urban areas. He notes that; „Housing is the greatest thorn in the
flesh of the town folk. And if you think the problem can get better, think again‟. Kenya‟s
National Development Plan of 2002 – 2008 reaffirms that indeed shelter and housing are
basic needs and there is need for adequate supply.
Mulei (1990) addressed the issue of isolating the provision of shelter with other aspects
of urban life. He notes that both production and consumption of houses are closely linked
to income groups. His concern is that the overall investment in housing in the country is
discouraging since only 3 per cent of the GDP is invested in housing less than half of
which is in modern dwellings. In order to solve the problem he suggests that housing has
to be examined within the development process as a whole. A weakness of his work is its
descriptive nature and the failure to appreciate some of the efforts done by the
government and private sector to solve the problem.
Along the same lines Aritho (1990) consider housing as the major problem in urban areas
aside with infrastructure. He notes that; “Housing is the greatest thorn in the flesh of the
town folk. And if you think the problem can get better, think again”. The article sites the
major causes which have enhanced the problem such as rural-urban migration and high
natural rate of population in urban areas. The weakness with Aritho‟s work is that it is
7
alarmist and is only an analysis of the housing conditions in urban areas and does not
offer a solution to the problem.
Kariuki (1993) has sought the real factors underlying the level of supply for houses in the
Kenyan housing market. This supply is what Syagga (1994) defines as real estate
development which according to him is similar to any other industrial or manufacturing
process where a particular commodity is produced in response to a given demand. He
established among others the main factors affecting the supply for housing and names
them as availability and cost of credit (interest rates) together with return on housing
investment.
In Kenya several studies have been made on housing including on the estimation of
elasticity of substitution based on the cob-Douglas production function. Based on this
production function, researchers have tried to estimate the elasticity of substitution for
houses and to find out if it is significantly different from one. Wiscousin and Rydell
(1976) have estimated it to be 0.5. In a study of new multi-family housing, Fountain
(1977) found an elasticity of 0.57 a figure that is less than one. Fountain tested for non-
constant returns to scale, but could not reject the assumption that the production function
exhibits constant returns to scale.
Investment in real estate has therefore attracted the attention of researchers. Muendo
(2001) sums it up and broadly categorizes investment into autonomous and induced.
Induced investment results from recent increases in demand while new interventions and
public overhead investments principally influence autonomous investment.

8
The problem which many researchers are concerned with is the problem of housing and
what can be done to increase output of houses. Each writer has his own way of explaining
the problem and how best it can be solved. The studies have limitations of their own.
However, a general consensus is that measures need to be taken to provide adequate
products to meet demand in the real estate sector.
A few studies have been done on factors affecting housing supply and it is the intention
of this study to fill this gap by evaluating the determinants of supply of houses in real
estate by positing the questions: Does growth of national income affect the level of real
estate supplied in the market? Do the interest rates offered by financiers affect the level
of real estate supplied in the market? How do the interest rates offered by financiers
affect the level of real estate supplied in the market? Although the problem that was
addressed in this study is similar to that of other studies, an attempt to explain in terms of
the variables that determine housing supply by employing econometric technique would
yield more precise results.
1.3 Objectives of the Study
1.3.1 General Objective
The broad objective of this study was to investigate the determinants of supply of houses
in real estate sector. By and large, this study established the factors affecting the supply
of housing in the country with considerable attention being paid to the determinants that
needs to be considered to increase the supply of real estate in the market

9
1.3.2 Specific Objective
Based on the problem stated above the objectives of this study were:
i. To establish the effect of price level of a houses on the quantity supplied
ii. To establish the effect of growth rate in GDP on real estate development.
iii. To find out whether interest rate offered by financiers affect the supply of real
estate in the market.
1.4 Research Questions
The study sought to answer the following questions
i. How do the price levels of houses have an effect on quantity supplied of houses?
ii. How does growth of national income affect the level of real estate supplied in the
market?
iii. How do the interest rates offered by financiers affect the level of real estate
supplied in the market?
1.5 Significance of the Study
The findings of this study were of interest to the following parties:-
The policy makers in the government who would be interested in knowing the
determinants of supply of houses in real estate development and what ought to be done to
increase the quantity of housing in the market despite the rapid growth in this sector. This
would enable them to formulate appropriate policies that would see adequate quantities of
housing being supplied in the market.

10
Practitioners both in public and private sectors and potential investors would gain a
greater appreciation of the determinants of supply of real estates and how they affect the
quantity of houses at the market place.
Most importantly, the study would give an insight to deduce knowledge to inform stakeholders in
the academic world. This would form a basis for further research.
11
CHAPTER TWO
LITERATURE REVIEW
2.1 Introduction
This chapter presents a review of related literature on the subject under study presented
by various researchers, authors and scholars. Specifically the following subsections were
included; 2.2: Theoretical review; 2.3: Determinants of the supply of houses in the
economy; 2.4: Empirical Evidence and 2.5: Summary of the review.
2.2 Theoretical review
A theory is a reasoned statement or groups of statements which are supported by
evidence meant to explain phenomena. The theories covered herein are:-
2.2.1 Theory of Demand and Supply
The theory of demand and supply is of paramount importance in the analysis of the
housing market and in determination of the level of housing supply. Harvey (1996)
highlights that individuals and specialist development companies and financial
institutions usually carry out private sector development and particularly the supply of
real estate. He further argues that the factors affecting supply of houses are cost of credit,
expected returns and cost of producing new units
The housing market is therefore an elaborate interplay between developers seeking to
maximize profits on one hand and consumers seeking satisfaction at minimal costs on the
12
other hand (Okumu, 1998).This theory suggests that quantity supplied of houses is a
function of among other things prices of houses. That is, as returns from houses increase,
suppliers of housing will seek to supply more. Dasso (1989) argues that land and space
will tend to go to that use paying the owner the highest returns or giving the greatest
value. Along the same lines, Chege (1999) argues that indeed a developer must determine
whether the real estate project will generate sufficient returns to cover the costs of
production and leave some reward to him.
2.2.2 Property Investment Theory
In the property investment theory, capital market theory is of great relevance given that
mortgage is one of the important assets in this market. The capital market theory has
evolved from complexity to simplicity.
Harry Markowitz developed the Markowitz portfolio in 1950s. His contributions showed
that every asset could be described in terms of its mean and standard deviations of returns
and those diversifications depended on the way returns moved relative to each other. He
developed a complex algorithm which estimated the proportion of funds to be invested in
each asset in order to maximize returns. Markowitz was able to show that a Markowitz
portfolio would actually increase in risk as more assets were added.
The Sharpe model is another breakthrough in property investment theory and was
developed in 1960 as an extension of Markowitz portfolio. This model simplified the
calculation of expected returns and gave rise to what has become known as capital market
theory. This developed from recognizing that the opportunity to lend or borrow at the risk
13
free rate would enable portfolios to be constructed which lay outside the efficient frontier
as defined by the opportunity set.
2.2.3 Economic Theory
The theory of investments is another important explanation of the huge level of
investments flowing into the housing sector. Economic theory analysis emphasizes four
major factors that determine investment behavior which translates to supply in the
market.
The Neoclassical theory of investments assumes that the desired stock of capital is equal
to the value of output deflated by the price of capital. The variables included in this case
are interest rate, depreciation rate, output and changes in capital gains.
In the Accelerator theory of investment, the desired stock of capital is assumed to be
proportional to output allowing for variation in capacity utilization. Basically the main
variable is income /output such that if there is an increase in output, more investment
flows are expected.
The Expected profits theory of investment assumes that the desired capital stock of
capital investment is proportional to the market value of the firm. The determinant of
investments is therefore profits.
In the liquidity theory of investment the optimal capital stock is assumed to be
proportional to liquidity which is defined as profits after taxes and depreciation .If net
income rises, investments are expected to increase. This net income traces its origin from
the determinant factor GDP.

14
2.3 Determinants of the Supply of Houses in the Economy
2.3.1 Price
Price represents the amount of value the market has assigned, fairly or unfairly, to a good
or a service. Pricing is the determination of the price at which stock or asset will sell or
the yield at which bonds will sell as new issues.
The real estate values (prices levels) determined by interaction of user markets and
capital markets becomes a guide to real estate builders, developers and conversion
specialists. When market prices exceeds the cost of production, these producers are more
inclined to build, thereby simultaneously adding to the supply of space and the stock of
investable real estate markets.
Scott (2003) stated that value is subjective rather than an objective term. The forces
influencing the values of a property includes its environment and physical characteristics,
social standards, economic influences and political or government regulations. The price
of a specific property at a point in time is a random variable reflecting the heterogeneity,
uncertainty and limited information of buyers and sellers. Heterogeneous assets refer to
assets with different characteristics from each other such as real estates.
Researchers and practitioners have found out that hundreds of factors might affect prices
in various situations. Moreover, properties trade infrequently perhaps once every 5-10
years for the average house, Lancaster (1966).
There are three models of estimating prices used by valuers. The first approach is income
model which uses the discounting cash flows expected from a property over a specific

15
time. The second one is cost model also known as the summation method where the value
of the property is estimated by summing the land value and the cost to reconstruct any
improvements less depreciation of these improvements.
The third model is the comparable sales approach also known as inferred analysis
method. This approach looks at the price or price per unit area of similar properties being
sold at the market place. The basic assumption is therefore that a property is worth what
it will sell for, in the absence of undue stress and if reasonable time is given. It is the
most prevalent method in residential property market, concerning general trends and
projections and enjoying the principle of substitution, Kummerow (2002).
2.3.2 Gross Domestic Product (GDP)
Gross domestic product (GDP) is the market value of all officially recognized final goods
and services produced within a country in a given period of time. Kenya‟s economy
posted a GDP of 5.9%, 6.3%, 7.1%, 1.7%, 2.5% and 3.6% from 2005 to 2010
respectively. The growth was mainly supported by activities in tourism sector and
resilience in the building and construction industry (GOK 2010).
Kenya‟s real estate sector posted an average GDP of 5.2% from 2005 to 2010
respectively. The table below provides the annual contribution rates to GDP.
16
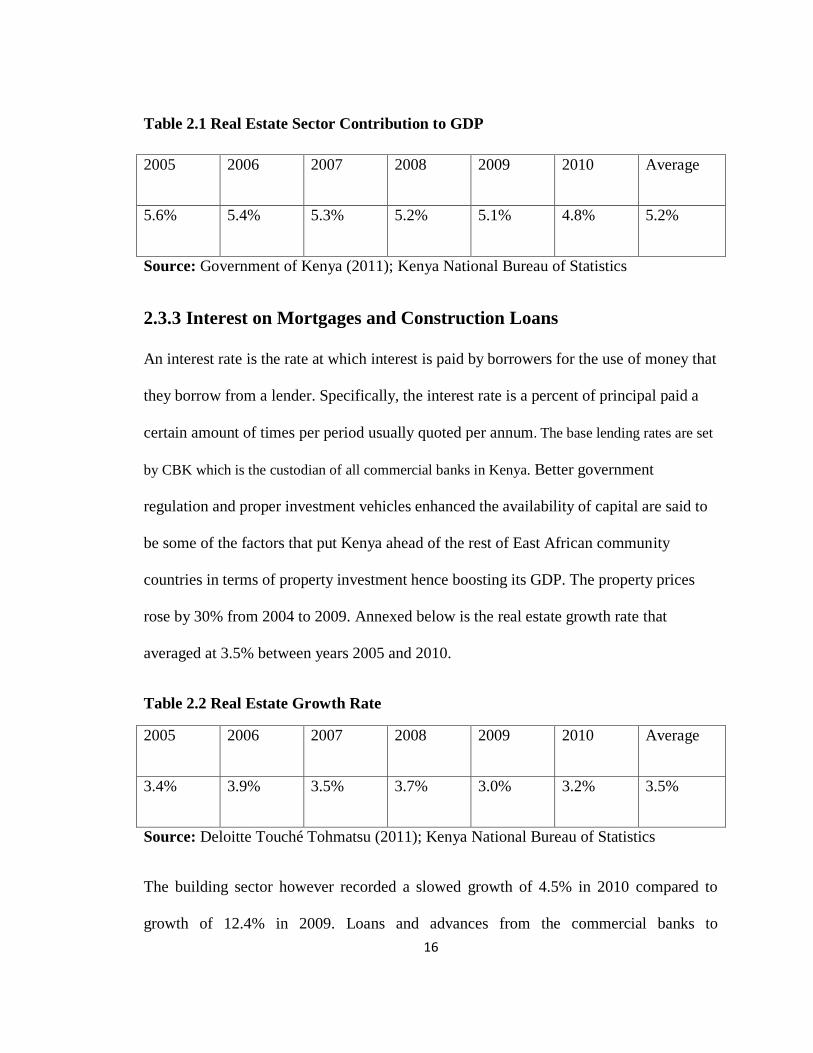
Table 2.1 Real Estate Sector Contribution to GDP
2005 2006 2007 2008 2009 2010 Average
5.6% 5.4% 5.3% 5.2% 5.1% 4.8% 5.2%
Source: Government of Kenya (2011); Kenya National Bureau of Statistics
2.3.3 Interest on Mortgages and Construction Loans
An interest rate is the rate at which interest is paid by borrowers for the use of money that
they borrow from a lender. Specifically, the interest rate is a percent of principal paid a
certain amount of times per period usually quoted per annum. The base lending rates are set
by CBK which is the custodian of all commercial banks in Kenya. Better government
regulation and proper investment vehicles enhanced the availability of capital are said to
be some of the factors that put Kenya ahead of the rest of East African community
countries in terms of property investment hence boosting its GDP. The property prices
rose by 30% from 2004 to 2009. Annexed below is the real estate growth rate that
averaged at 3.5% between years 2005 and 2010.
Table 2.2 Real Estate Growth Rate
2005 2006 2007 2008 2009 2010 Average
3.4% 3.9% 3.5% 3.7% 3.0% 3.2% 3.5%
Source: Deloitte Touché Tohmatsu (2011); Kenya National Bureau of Statistics
The building sector however recorded a slowed growth of 4.5% in 2010 compared to
growth of 12.4% in 2009. Loans and advances from the commercial banks to
17
construction sector grew by 7.3% from Kenya shillings 30.4 billion to 32.6 billion in
2010. This demonstrates how interest rates impacts on supply of houses in real estate.
Commercial banks have been competing with each other in providing mortgage products.
The interest rates charged by lenders on mortgages and construction loans has also been a
major boost towards a stable economy that offered investors higher returns due to high
demand of housing (Daily Nation 29.03.2011).
2.4 Empirical Evidence on Determinants of Supply of Houses in Kenya
Bower (1965) in his study of commercial construction attempted to discover and explain
patterns in the rate of commercial construction (building) in the United States. The main
findings of his study were that price levels (rent) and vacancy rate were directly and
inversely related to investment in housing respectively. (Review of Economics and
Statistics, 1965.pp 268).The construction of buildings amounts to real estate development
and in its broadest meaning it is generally taken to mean combining land and
improvements on it to produce a complete operational property (Dasso, 1989)
Wai and Wong (1982) in their paper on determinants of private investment in developing
countries attempted to explore a modified version of the flexible accelerator theory of
investment. The main hypothesis they tested is that private investment in less developed
countries depends on government, the change in bank credit to the private sector, the flow
of foreign capital to private sector and actual capital stock lagged one year. Their
empirical results using time series data indicate that all the coefficients of explanatory
variables are significant and are of expected signs. When each explanatory variable is
tested and treated as the only explanatory variable, its impact is significant for most of the
18
countries. Abott (1987) goes further to define investment as an addition to a stock of
capital over time. A major limitation of this study is that it is a general research on
investment rather than being specific to a certain sector.
Mulei (1990) addressed the issue of isolating the provision of shelter with other aspects
of urban life. He notes that both production and consumption of houses are closely linked
to income groups. His concern is that the overall investment in housing in the country is
discouraging since only 3 per cent of the GDP is invested in housing less than half of
which is in modern dwellings. In order to solve the problem he suggests that housing has
to be examined within the development process as a whole. A weakness of his work is its
descriptive nature and the failure to appreciate some of the efforts done by the
government and private sector to solve the problem.
Aritho (1990) consider housing as the major problem in urban areas aside with
infrastructure. He notes that; “Housing is the greatest thorn in the flesh of the town folk.
And if you think the problem can get better, think again”. The article sites the major
causes which have enhanced the problem such as rural-urban migration and high natural
rate of population in urban areas.
Kariuki (1993) has sought the real factors underlying the level of supply for houses in the
Kenyan housing market. This supply is what Syagga (1994) defines as real estate
development which according to him is similar to any other industrial or manufacturing
process where a particular commodity is produced in response to a given demand. He
established among others the main factors affecting the supply for housing and names
19
them as availability and cost of credit (interest rates) together with return on housing
investment.
Yahya and Nzioki (1993) in their study of informal settlements in Kenya noted, among
other things, that slums have been growing in Nairobi and other major cities in Kenya at
a rate faster than the urban population growth which was 10% in 1994. Worse still was
the fact that 60% of the urban population lives in poor shelter which was an indication of
poor policy and planning. There was therefore need for more participation by the private
sector in the provision of housing in Kenya.
According to Njihia (2010), Kenya has a well developed construction industry. Quality
engineering, building and architectural design services are readily available. This industry
is very important to the Kenyan economy. It accounts 4.5% of the country‟s GDP (Gross
Domestic Product). This being the case it is fundamental that factors that determine or
affect the supply of houses in real estate be evaluated.
The fifth session World Urban Forum (Kenya Country Report) indicates that the housing
policy adopted by the government in June 2004 is intended to bridge the shortfall in
housing stock arising from demand that far surpasses supply particularly in urban areas.
A report by Central Bank of Kenya (CBK) in conjunction with World Bank indicates that
investment in real estate sector grew to 61 billion shillings as of May 2012, compared to
19 billion shillings five years ago. In addition the number of mortgages taken up by
individuals and organizations grew from 7,834 to 13,803 over the same period, a
demonstration of the great potential and growing interest in the sector.
20
Syagga (1994) argued that the property market deals in heterogeneous commodities that
prevent standardization of the product and its price. Due to these differences, there is a
great difficulty in disseminating market information. Muthama (2012) evaluated the
effects of investor psychology on real estate market prices in Nairobi, Kenya. Wanjohi
(2012) looked into the application of heterogeneous asset pricing model in the residential
real estate market in Kenya citing that the differences in prices as the positive or negative
due to hedonic characteristics between the properties. Also, Gitonga (2003) studied the
performance of real estate markets. The case of central business district of Nairobi
Morris (2010) reports that investors‟ interest in residential real estate development has
indeed continued to soar, with the latest reports indicating that monies flowing into the
sector over the last five years have more than tripled. In addition the number of
mortgages taken up by individuals and organizations grew from 7,834 to 13,803 over the
same period, a demonstration of the great potential and growing interest in the sector.
This makes the interests charged on construction loans and mortgages a vital determinant
of supply in the sector.
Researchers and practitioners have found out that hundreds of factors might affect supply
in various situations. Moreover, properties trade infrequently perhaps once every 5-10
years for the average house, Lancaster (1966). This market adjustment process is subject
to time delays due to length of time it takes to finance, design and construct new supply
and also due to relatively slow rate of change in demand. This demand continues to be
inelastic as the population size increases.
21
2.5 Summary of the review
In general the literature review indicates that the primary determinants of housing supply
are the real interest rates (cost of credit) and expected returns. Empirical studies have
been done to ascertain importance of these factors either through cross section analysis or
time series analysis. In Kenya research has concentrated more on low income group
housing and the methodology has been surveys. Most of the studies are based on
descriptive analysis of field data. The problem which many researchers are concerned
with is the problem of housing and what can be done to increase output of houses. Each
writer has his own way of explaining the problem and how best it can be solved. The
studies have limitations of their own. However, a general consensus is that measures need
to be taken to provide adequate products in the real estate sector. A few studies have been
done on factors affecting housing supply and it is the intention of this study to fill this
gap. Although the problem that will be addressed in this study is similar to that of other
studies, an attempt to explain in terms of the variables that determine housing supply by
employing econometric technique will yield more precise results.
2.6 Conceptual Framework
This is a research tool intended to assist the researcher to develop awareness and
understanding of the situation and scrutiny and to communicate it. This shows the
relationship between the dependent and independent variables.

22
Figure 2.1 Conceptual Framework
SOURCE- Author (2013)
Interest rates on mortgages
Inflation rates ( Price indecies)
Gross Domestic Product
Independent variables Dependent variable
Quantity (Value) of new houses

23
CHAPTER THREE
RESEARCH METHODOLOGY
3.1 Introduction
The formidable problem that follows the task of defining the research problem is the
preparation of the research design. Decisions regarding what, where, how much, by what
means concerns an inquiry or a research study constitute a research design. (Kothari
2004)
This chapter sets out various stages and phases that were followed in completing the
study. It involves a blue print for the collection, measurement and analysis of data.
Specifically the following subsections will be included; 3.2: Research design; 3.3: Target
population; 3.4: Data collection instruments and procedures; 3.5: Data analysis; 3.5.1:
Conceptual model and 3.5.2: Analytical model
3.2 Research Design
A research design is the arrangement of conditions for collection and analysis of data in a
manner that aims to combine relevance to the research purpose with economy in
procedure (Claire et al 1962).
This study adopted descriptive correlational research design, which according to Kothari
(2004), is used when the researcher wants to establish the relationship between two or
more variables. The researcher uses theories or at least hypothesis to account for forces
that cause certain phenomenon to incur. In descriptive as well as in diagnostic studies, the
researcher must be able to define clearly, what he wants to measure and must find

24
adequate methods of measuring it along with a clear definition of „population‟ he wants
to study. Since the aim is to study. Since the aim is to obtain complete and accurate
information in the said studies, the procedure to be used must be carefully planned.
3.3 Population
Population is defined as an entire group of individuals, events or objects having common
observable characteristics (Mugenda & Mugenda, 1999). Target population is the
population to which the researcher wants to generalize the results of the study. The
population of this study consisted of all the new houses constructed in Kenya annually.
3.4 Data Collection Instruments and Procedure
The study used secondary sources of data. The secondary sources of data involved
gathering data that has already been collected before. It involves collection and analysis
of published material and information from internal sources (Kombo & Tromp, 2006). In
this study the researcher will make use of secondary time series data for the last 15 years
(1987-2012). Data on new houses built annually and price levels of houses in Kenya was
obtained from the real estate firms e.g. Hass consultant, data for interest rate was
obtained from the Central Bank of Kenya (CBK) while data for growth of GDP was
obtained from the yearly economic surveys and the statistical abstracts between 1987 and
2012 from Kenya National Bureau of Statistics.
25
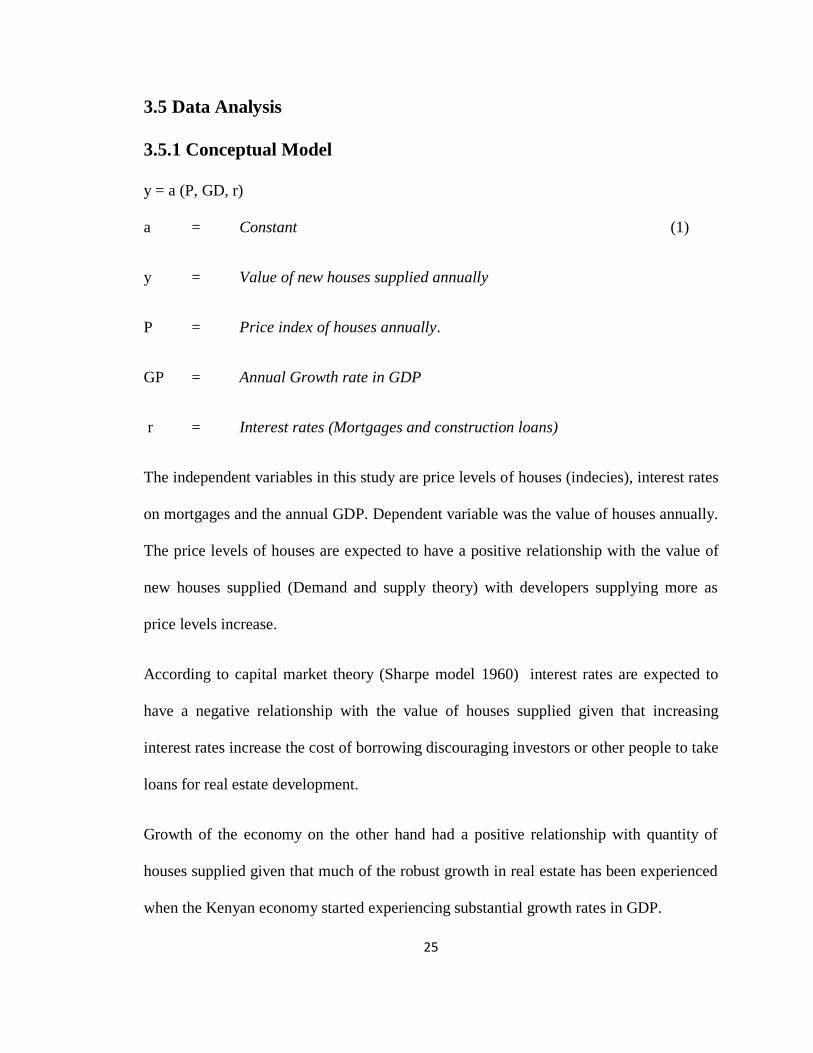
3.5 Data Analysis
3.5.1 Conceptual Model
y = a (P, GD, r)
a = Constant (1)
y = Value of new houses supplied annually
P = Price index of houses annually.
GP = Annual Growth rate in GDP
r = Interest rates (Mortgages and construction loans)
The independent variables in this study are price levels of houses (indecies), interest rates
on mortgages and the annual GDP. Dependent variable was the value of houses annually.
The price levels of houses are expected to have a positive relationship with the value of
new houses supplied (Demand and supply theory) with developers supplying more as
price levels increase.
According to capital market theory (Sharpe model 1960) interest rates are expected to
have a negative relationship with the value of houses supplied given that increasing
interest rates increase the cost of borrowing discouraging investors or other people to take
loans for real estate development.
Growth of the economy on the other hand had a positive relationship with quantity of
houses supplied given that much of the robust growth in real estate has been experienced
when the Kenyan economy started experiencing substantial growth rates in GDP.

26
3.5.2 Analytical Model
This study borrowed the supply theory model. This model has been chosen taking into
consideration the availability of data. The study hypothesizes that the increase in new
houses in Kenya is determined by growth in GDP, changes in price levels alongside
falling interest rates charged on mortgages and construction loans. The following
modified supply function was then be assumed for multiple regression using ordinary
least squares (OLS) method :-
QHS = β0 + β1GP+ β2P + β3r + e (2)
Where:-
QHS = Value of new houses supplied annually.
β0 = Intercept
P = Price index of houses annually.
GP = Annual Growth rate in GDP
r = Interest rates (Mortgages and construction loans)
e = Error term.
The model was estimated using balanced data estimation. Asteriou (2006) suggests that
panel data models are more efficient as they control the chance of biased results by
providing more degrees of freedom on pooling data. The models are used in three
27
specifications: common constants; allowing for fixed effects and allowing for random
effects.
In the first attempt, the model was estimated using a system of Ordinary Least Squares
(OLS), with period seemingly unrelated regressions, which is expected to be
simultaneously correct for both cross-section heteroscedastity and autocorrelation. Next,
the researcher assessed the appropriate stochastic assumptions of the regressors on
components of the error term. This is very crucial for the estimation of the parameter β.
The numerous variables highlighted in the regression equation suggest that cross-section
specificity will affect results of panel estimation. To test whether this is so, the researcher
included cross-section fixed effects and conduct the F and Chi-square redundant fixed
effect tests. Where results suggest that fixed effects are not redundant, the researcher
assumed the panel regressions with fixed effects.
The data was analysed using statistical software specifically, SPSS version 18 and
presented in form of tables and graphs.

28
CHAPTER FOUR
DATA ANALYSIS, RESULTS AND DISCUSSION
4.1 Introduction
This chapter presents the findings of the study based on the data collected from the field.
The study sought to investigate to investigate the determinants of supply of houses in real
estate sector. The study sought establish to establish whether price level, growth rate in
GDP and interest rate offered by financiers affect the supply of real estate in the market.
4.2 Study Findings
This section presents the findings of the study. The study used the secondary data which
for a period of five years starting from 2007 to June 2012. The analysis adopted both
descriptive and inferential analysis. In inferential analysis, a regression analysis was
adopted to establish the form of relationship between supply of houses and price level,
growth rate in GDP and interest rate
29
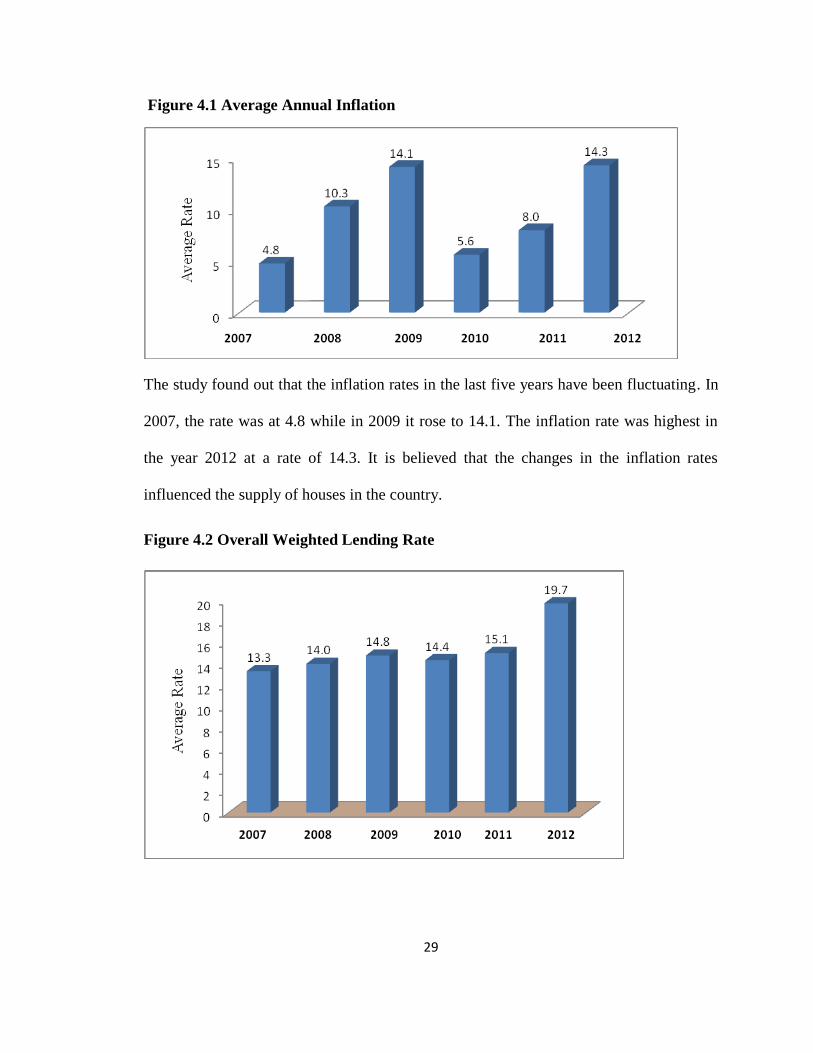
Figure 4.1 Average Annual Inflation
The study found out that the inflation rates in the last five years have been fluctuating. In
2007, the rate was at 4.8 while in 2009 it rose to 14.1. The inflation rate was highest in
the year 2012 at a rate of 14.3. It is believed that the changes in the inflation rates
influenced the supply of houses in the country.
Figure 4.2 Overall Weighted Lending Rate
30
On the lending rate, figure 4.2 shows that the interest rate has been in an increasing rate
in the last 5 years. In 2007 the lending rate was at 13.3 percent, rose to 14.8% in 2009
while in 2012 it was highest at 19.7%. The interest rates are also believed to have an
influence on the supply of houses in the country.
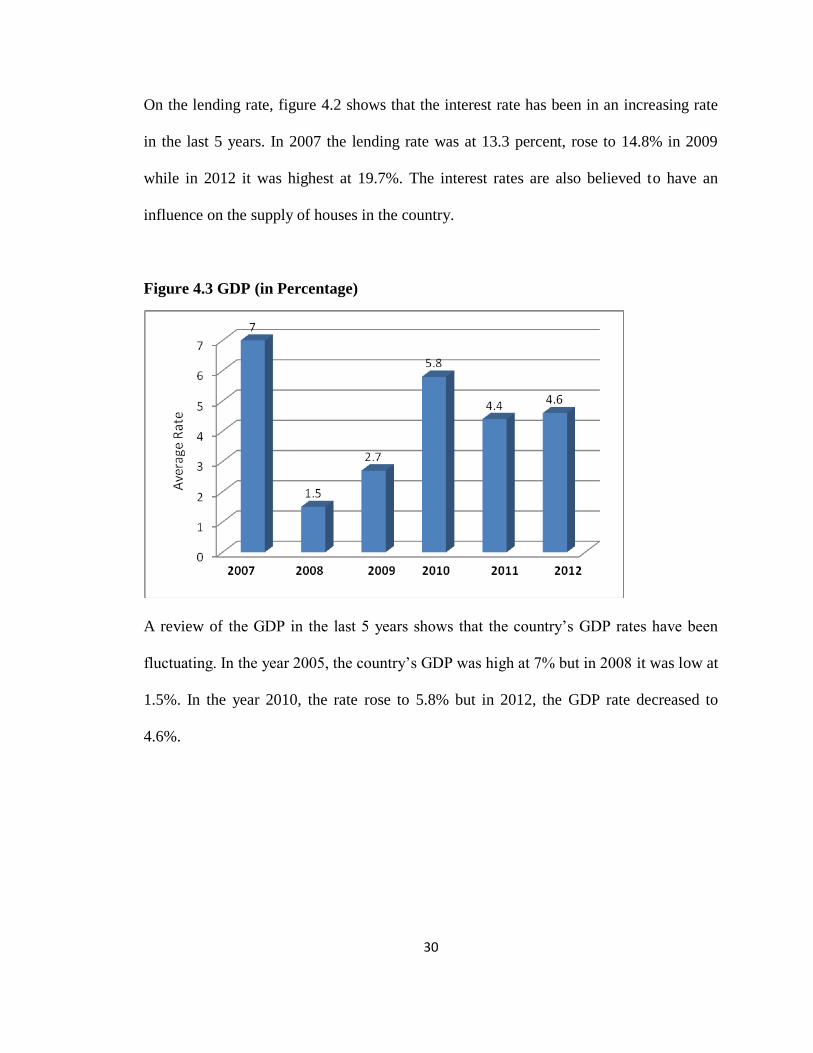
Figure 4.3 GDP (in Percentage)
A review of the GDP in the last 5 years shows that the country‟s GDP rates have been
fluctuating. In the year 2005, the country‟s GDP was high at 7% but in 2008 it was low at
1.5%. In the year 2010, the rate rose to 5.8% but in 2012, the GDP rate decreased to
4.6%.

31
Figure 4.4 Value of New Houses Supplied
Figure 4.4 shows that the supply of houses has been in the increase in the last 5 years. In
2007, the value was at 70,860 (in ksh 000), in 2009 it was at 75,674 while in the year
2012, the value rose to 85,165.
Figure 4.5 Trend Line

32
4.2.2 Regression Analysis
Multiple regression model was used to establish relationship between price level, growth
rate in GDP, interest rate and the supply of real estate in the market. The model took the
following form.
QHS = β0 + β1GP+ β2P + β3r + e
Table 4.1 Model Summary
Model R R Square
Adjusted R
Square
Std. Error of the
Estimate
1 0.934(a) 0.872 0.680 2.809865
a Predictors: (Constant), GDP, Interest, Inflation
Adjusted R2 is called the coefficient of determination and tells us how the supply of
houses in the real estate in Kenya varied with price level, growth rate in GDP, interest
rate. The value of adjusted R2 is 0.680. This implies that, there was a variation of 68.0%
of supply of houses (dependent variable) with the independent variables (Price level,
growth rate in GDP, interest rate).
33
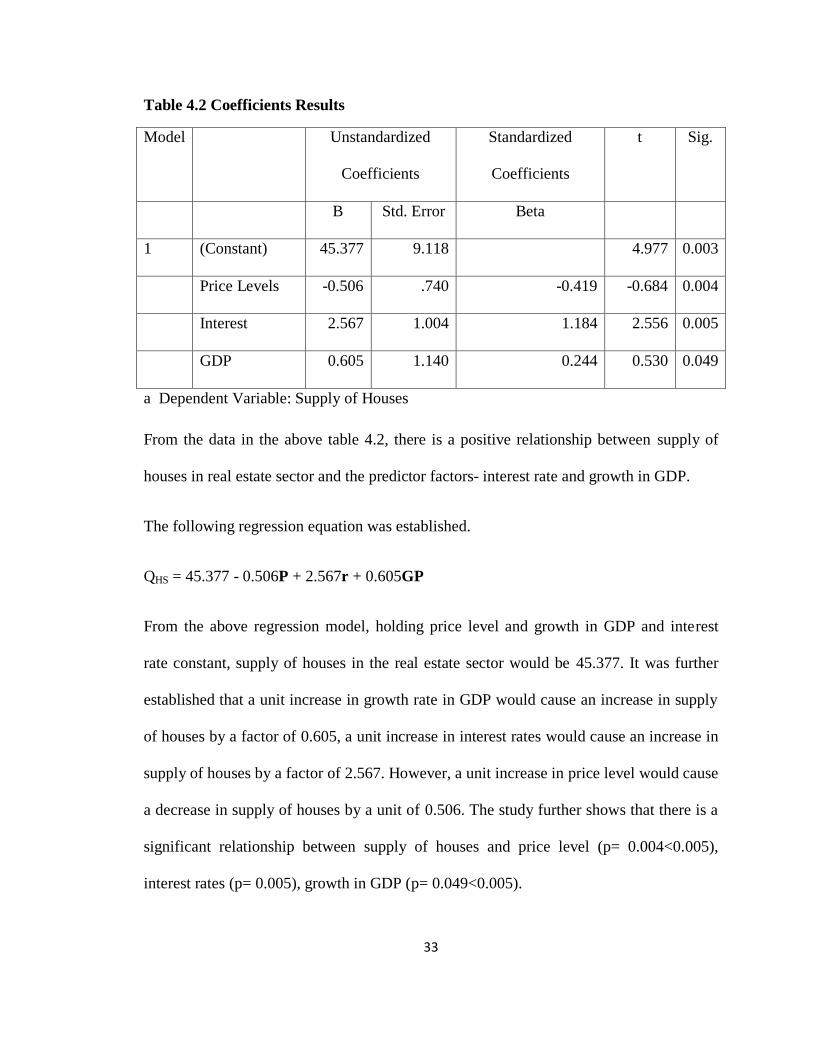
Table 4.2 Coefficients Results
Model Unstandardized
Coefficients
Standardized
Coefficients
t Sig.
B Std. Error Beta
1 (Constant) 45.377 9.118 4.977 0.003
Price Levels -0.506 .740 -0.419 -0.684 0.004
Interest 2.567 1.004 1.184 2.556 0.005
GDP 0.605 1.140 0.244 0.530 0.049
a Dependent Variable: Supply of Houses
From the data in the above table 4.2, there is a positive relationship between supply of
houses in real estate sector and the predictor factors- interest rate and growth in GDP.
The following regression equation was established.
QHS = 45.377 - 0.506P + 2.567r + 0.605GP
From the above regression model, holding price level and growth in GDP and interest
rate constant, supply of houses in the real estate sector would be 45.377. It was further
established that a unit increase in growth rate in GDP would cause an increase in supply
of houses by a factor of 0.605, a unit increase in interest rates would cause an increase in
supply of houses by a factor of 2.567. However, a unit increase in price level would cause
a decrease in supply of houses by a unit of 0.506. The study further shows that there is a
significant relationship between supply of houses and price level (p= 0.004<0.005),
interest rates (p= 0.005), growth in GDP (p= 0.049<0.005).
34
CHAPTER FIVE
SUMMARY, CONCLUSION AND RECOMMENDATIONS
5.1 Introduction
This chapter is a synthesis of the entire report and contains summary of findings,
conclusions arrived at, the recommendations and the suggestions for further study.
5.2 Summary of the Findings
The findings show that the supply of houses has been in the increase in the last 5 years. It
was also established that the inflation rates in the last five years have been fluctuating;
whereby in 2007, the rate was at 4.8 while in 2009 it rose to 14.1. The inflation rate was
highest in the year 2012 at a rate of 14.3. On the lending rate, figure 4.2 shows that the
interest rate has been in an increasing rate in the last 5 years. In 2007 the lending rate was
at 13.3 percent, rose to 14.8% in 2009 while in 2012 it was highest at 19.7%. The interest
rates are also believed to have an influence on the supply of houses in the country. On the
growth of GDP the study found out that the GDP rates have been fluctuating whereby in
2005, the country‟s GDP was high at 7% while in 2012, the rate was at 4.6%.
In the regression analysis, the study found out that there was a positive relationship
between supply of houses in real estate sector and the predictor factors- interest rate and
growth in GDP and a negative relationship with price levels. It was also established that a
unit increase in growth rate in GDP would cause an increase in supply of houses by a
factor of 0.605, a unit increase in interest rates would cause an increase in supply of
35
houses by a factor of 2.567. However, a unit increase in price level would cause a
decrease in supply of houses by a unit of 0.506. There is a significant relationship
between supply of houses and price level (p= 0.004<0.005), interest rates (p= 0.005),
growth in GDP (p= 0.049<0.005).
5.3 Conclusions
The study established a positive and significant relationship between supply of houses in
real estate sector in Kenya and the price levels. It can be concluded that there is greater
value in relation to price that creates significant demand for a real estate. Hence pricing
can influence the supply of houses. Real estate‟s price is however also determined by
costs, demand conditions, competition, legal and political issues.
It can also be concluded that growth of GDP and interest levels have an influence on
supply of houses. While growth in GDP was found to have a positive relationship with
supply, interest rates were found to have a negative relationship. This implies that any
increase in growth domestic product would increase the supply of houses while an
increase in interest rates will affect lending and thereby affecting the supply of the
houses.
5.4 Recommendations
The researcher recommends that the government should streamline the various real estate
policies in different ministries into a single guide and to set up a separate real estate
division within the ministry with the objective of running a single window clearance of
all required paper work and clearances. Also the government should establish a housing

36
loan guarantee scheme run by existing government housing corporations to assess risks in
some real estate development and the applicant‟s credit scores then giving guarantees to
the developers and financiers so as to encourage financiers to lend more and at affordable
interest rates.
37
REFERENCES Aritho G.M (1980). The Role of Estate Agents on Housing Markets. Nairobi,
Kenya
Cheeseman, N. & Griffths, R. (2005). ‘Increasing Tax Revenue in Sub- Saharan Africa:
The Case of Kenya’. Oxford, United Kingdom.
Chege W. (2003): The Causes of Non -performing Mortgage Loans in Kenya's
Residential property. Nairobi.
Clauretie I. M. & Sirmans G. S. (2008). Real Estate Finance; Theory and Practice. (5 th
Edition). Thomson Nelson, Canada
Damien AboX\{\9?,l) Encyclopedia of Real Estate Terms. Gower Technical Press,
Aldershot
Dasso J,A Ring (1989).Real Estate -Principles and practices, Edgeworth cliffs (N.J):
Prentice Hall
Economic survey (1990-2008)
Eldered G. (1987). Real Estate; Analysis and Strategy. Newyork: Harper and Row
Publishers
Fjeldstad, O. & Rakner, L. (2003). Taxation and Tax Reforms in Developing Countries.
Norway.
KIPPRA. (2004). ‘Tax Compliance Study’, Tax Policy Unit, Macroeconomics Division,
Kenya Institute of Public Policy Research and Analysis, Nairobi.
KRA. (2006). Third Corporate Plan: Kenya Revenue Authority. Taxation and Tax
Modernization in Kenya. Nairobi, Kenya.
Kombo, D. & Tromp, D. (2006). Proposal and thesis Writing. Kenya, Nairobi.
Ling D. C. & Archer W. R. (2008). Real Estate Principles. A Value Approach. (2nd
Edition). McGraw- Hill Irwin, Boston
Macleary A.R, Nanthakuncan,N {\9%1).Property investment theory London:
E&F.N Sports, 1988.
Mahon, J. (1997). Tax Reform and its Determinants. Guadalajara, Mexico.
McLaney, E. (2009). Business Finance, Theory and Practice.
(8th
edition).England.
38
Mikkelsen, B. (2008). Methods for Development Work and Research. (2nd
edition).
England.
Moyi, E. & Muriithi, M. (2003). ‘Tax Reforms and Revenue Mobilization in Kenya’,
Research Paper No. 131, African Economic Research Consortium, Nairobi,
Mugenda, A. & Mugenda, O. (1999). Research Methodology . Nairobi: Art Press.
Njuguna A. M. (2012) Strategic Responses to Changes in the Environment by
Real Estates Firms in Nairobi. (Unpublished MBA Project) School of Business.
University of Nairobi, Kenya.
Orodho, A. (2003). Essentials of Education and Social Science Research Methods.
Kenya, Nairobi: Masola Publishers.
Orodho, A. & Kombo, D. (2002). Research Methods. Nairobi, Kenya: Masola Publishers.
Oso, Y. & Onen, D. (2005). A General Guide to Writing Research Proposal and
Reports. Kisumu, Kenya: Option printers and publishers
Smith, A. (2004). Taxation and its Principles. (2nd
Edition). United States Statistical
Abstract (1990-2008)
Wanjohi F. K. (2012). The Application of Heterogenous Asset Pricing Model in the
Residential Real Estate Market in Kenya. (Unpublished MBA Project). School of
Business. University of Nairobi, Kenya.
39
APPENDICES
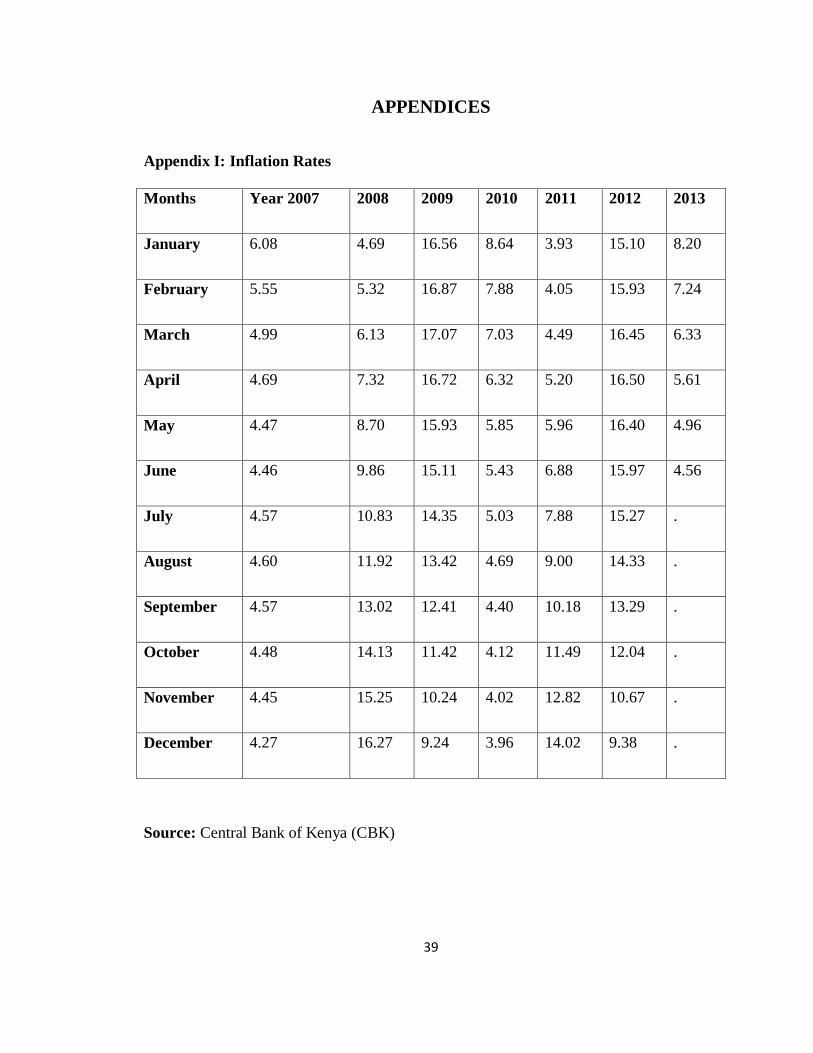
Appendix I: Inflation Rates
Months Year 2007 2008 2009 2010 2011 2012 2013
January 6.08 4.69 16.56 8.64 3.93 15.10 8.20
February 5.55 5.32 16.87 7.88 4.05 15.93 7.24
March 4.99 6.13 17.07 7.03 4.49 16.45 6.33
April 4.69 7.32 16.72 6.32 5.20 16.50 5.61
May 4.47 8.70 15.93 5.85 5.96 16.40 4.96
June 4.46 9.86 15.11 5.43 6.88 15.97 4.56
July 4.57 10.83 14.35 5.03 7.88 15.27 .
August 4.60 11.92 13.42 4.69 9.00 14.33 .
September 4.57 13.02 12.41 4.40 10.18 13.29 .
October 4.48 14.13 11.42 4.12 11.49 12.04 .
November 4.45 15.25 10.24 4.02 12.82 10.67 .
December 4.27 16.27 9.24 3.96 14.02 9.38 .
Source: Central Bank of Kenya (CBK)

40
Appendix II: Overall Weighted Lending Rate
Months Year 2007 2008 2009 2010 2011 2012 2013
January 13.78 13.78 14.78 14.98 14.03 19.54 18.13
February 13.64 13.84 14.67 14.98 13.92 20.28 17.84
March 13.56 14.06 14.87 14.96 13.92 20.34 17.78
April 13.33 13.91 14.71 14.58 13.92 20.22 17.87
May 13.38 14.01 14.85 14.44 13.88 20.12 17.45
June 13.14 14.06 15.03 14.39 13.91 20.30 16.97
July 13.29 13.90 14.79 14.29 14.14 20.15 17.02
August 13.04 13.66 14.76 14.18 14.32 20.13 .
September 12.87 13.66 14.74 13.98 14.79 19.73 .
October 13.24 14.12 14.78 13.85 15.21 19.04 .
November 13.39 14.34 14.85 13.95 18.48 18.74 .
December 13.32 14.87 14.76 13.87 20.04 18.15 .
Source: Central Bank of Kenya (CBK)
41
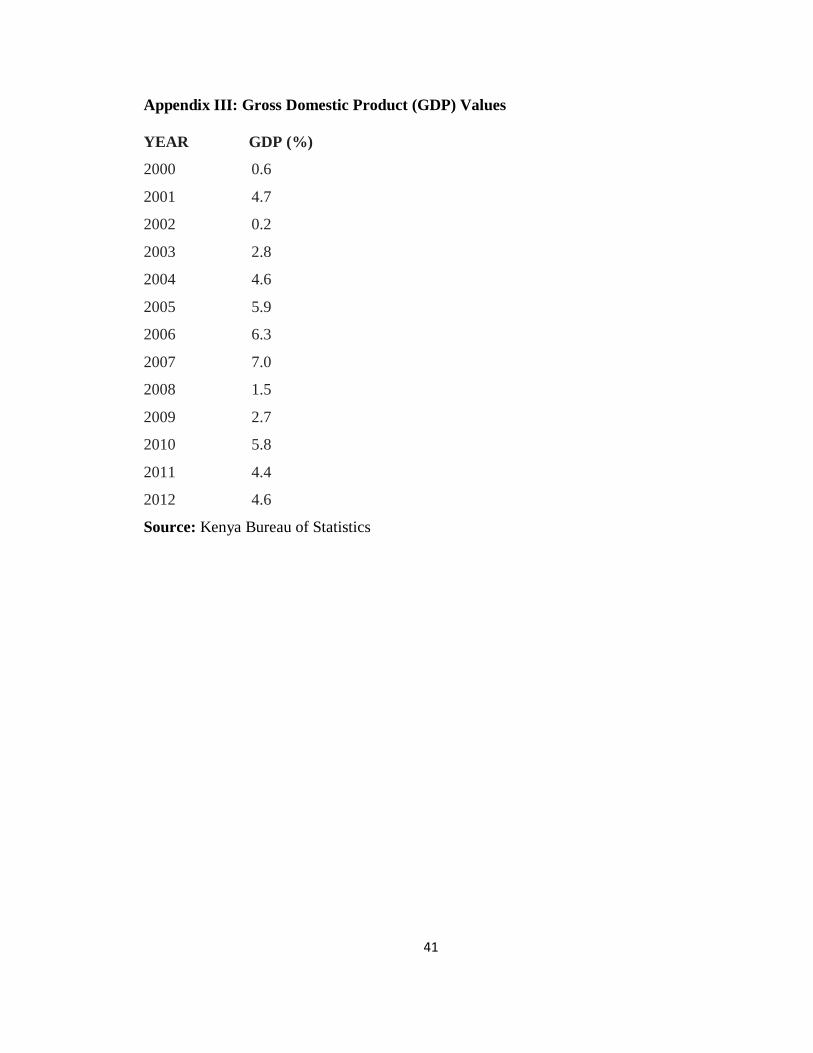
Appendix III: Gross Domestic Product (GDP) Values
YEAR GDP (%)
2000 0.6
2001 4.7
2002 0.2
2003 2.8
2004 4.6
2005 5.9
2006 6.3
2007 7.0
2008 1.5
2009 2.7
2010 5.8
2011 4.4
2012 4.6
Source: Kenya Bureau of Statistics

42
Appendix IV: Value of New Houses Supplied
Year Prices in Kshs. ‘000’
2007 70,860
2008 73,503
2009 75,674
2010 77,633
2011 79,176
2012 85,165


