
1
CHAPTER 1
Biology, prey preference and bioefficacy of Rhynocoris fuscipes (Fab.) (Heteroptera:
Reduviidae) against two cotton pests and a factitious host
1.1. ABSTRACT
The reduviid bug, Rhynocoris fuscipes Fab. (Heteroptera: Reduviidae) has tremendous
potential as a biological control agent against many economically important pests. The
relationships between the R. fuscipes and its prey organisms, such as Dysdercus cingulatus
Fab. (red cotton bug), (Hemiptera: Pyrrhocoridae), Phenacoccus solenopsis Tinsely
(cotton mealy bug) (Hemiptera: Pseudococcidae) and Corcyra cephalonica Stain. (rice
flour moth) (Lepidoptera: Pyralidae), were studied to determine the influence of these
hosts on biology and bioefficacy of the predator. The experiments were carried out when
the reduviid predator fed, larvae of the factitious prey C. cephalonica (control) compared
with data obtained when R. fuscipes fed on nymphs of red cotton bug and cotton mealy
bug. In addition, choice tests were conducted to determine if the predators had a specific
preference on stage and prey type. Rhynocoris fuscipes completed nymphal period in 41
days on C. cephalonica, 45 and 50 days on D. cingulatus and P. solenopsis, respectively.
Adult longevity, fecundity, hatchability, nymphal survival rate and life table parameters
were in favour of control category and least against P. solenopsis. Third instar
D. cingulatus was preferred by both third and fourth instars predators. Fifth and adult
stage predators preferred fourth and fifth instars of D. cingulatus, respectively. Invariably
nymphs and adult predators preferred P. solenopsis adults. The adult predator voraciously
fed D. cingulatus and P. solenopsis and life stages of the reduviid responded positively
with type II functional response curve. The results obtained from the study signified that
the high biocontrol potentiality of R. fuscipes against cotton pest management.
Key words: Biology, bioefficacy, functional response, life table, preference

2
1.2. INTRODUCTION
The control and restraint of natural herbivore populations are imperative to
ecology. A variety of biotic and abiotic factors govern herbivore populations. Hairston et
al. (1960) proposed a hypothesis that the world is green because natural enemies manage
and limit herbivores, preventing them from depleting green plants completely.
Consequently, it has been shown that natural enemies limit herbivore profusion (Schmitz
et al., 2000; Terborgh et al., 2001), resulting in increased productivity of primary
producers ie, plants (Pace et al., 1999). There is now consensus that both resources and
natural enemies interplay in herbivore population control (Rogers, 1972; James et al.,
1994; Leibold, 1996; Denno et al., 2003; Sinclair et al., 2003). There is a range of possible
interactions between resources and natural enemies (says Helen and Ted, 2008).
One of the major obstacles hindering cotton cultivation is insect pests infestation.
The red cotton bug Dysdercus cingulatus Fab. (Hemiptera: Pyrrhocoridae) and mealy bug
Phenacoccus solenopsis Tinsley (Hemiptera: Pseudococcidae) causing serious damage by
feeding on developing cotton bolls and ripe cotton seeds. Further more, D. cingulatus
transmitting fungi, Nematospora gossypii Kurtzman that grows on the immature lint and
seeds (Ahmed and Schaefer, 1987; Yasuda, 1992). These pests are difficult to control by
insecticides either because of the high mobility of D. cingulatus (Kohno and Ngan, 2004)
or P. solenopsis having a white waxy coat (Patel et al., 2010) as adaptative mechanisms.
Therefore, the use of natural enemies to control these pests can be considered.
The significance of reduviid predators as suppressors of herbivorous insect
populations on crops has long been recognized (Schafer and Ahmed, 1987; Aldrich et al.,
1991; James, 1994; Schafer, 1998; Ambrose, 2000; James, 2000; Alan et al., 2003;
Grundy, 2004; Sahayaraj, 2007a; Sahayaraj and Balasubramanian, 2009; Alexandre et al.,

3
2009; El-Sebaey and El-Wahab, 2011; Freddy et al.,2011; Sahayaraj et al., 2012;
Guanyang and Christiane, 2013).
Cotton field offers a predominantly good example of such biological control by
predators. Although about 250 insect species occur in the cotton ecosystem, only about 27
of these are well thought out prone to cause damage, of which only 5-6 species get to
population levels beyond the economic threshold (Hossain et al., 2012; Ramesh Kumar et
al., 2013). However, when profusion of naturally occurring predators decreases, the cotton
pest populations increases (Hagerty et al., 2005; Vahid, 2013; Pickett et al., 2013).
Predatory hemipterans are commonly found in several crop ecosystems, where they feed
primarily on larval stages of various herbivore pests and non-pests (De Clercq, 2000;
Torres et al., 2006; Vahid, 2013).
The anticipation in any augmentative release programme is that predator
population increase in the targeted area and its ambience. However, release of predatory
reduviid bugs in to row crops ecosystems features different conditions than those in
bordering ecosystems (Hossain et al., 2012). Several insect predator species including
hunter reduviids have been observed feeding on D. cingulatus (Ambrose, 1999; Sahayaraj
and Asha, 2010; Sahayaraj et al., 2012) and P. solenopsis (Tanwar et al., 2007, David et
al., 2009; Anita Singh and Dolly Kumar, 2012; Asifa Hameed et al., 2013) in India.
1.2.1. Rhynocoris fuscipes (Fab.)
Rhynocoris fuscipes (Fab.) a crepuscular, fiercely coloured (black and red),
entomophagous, harpactorine reduviid found in concealed habitats such as underneath the
leaves, pebbles and crevices and common in agro ecosystems (Ambrose, 1988; George,
2000; George et al., 2000; Sahayaraj and Selvaraj, 2003; Sahayaraj, 2007b; Sahayaraj and
Sujatha, 2012). Bioecology of this predator has been studied by Ambrose and Livingstone
(1986). Ambrose (1997) first described the mating behaviour of this bug; later, the impact

4
of mating on oviposition pattern and hatchability (Vennison and Ambrose, 1986).
Previously, impact of sex, starvation, antennectomy, eye blinding and tibial comb coating
on the predatory behaviour of this reduviid was studied (Ambrose and Mayamuthu, 1994).
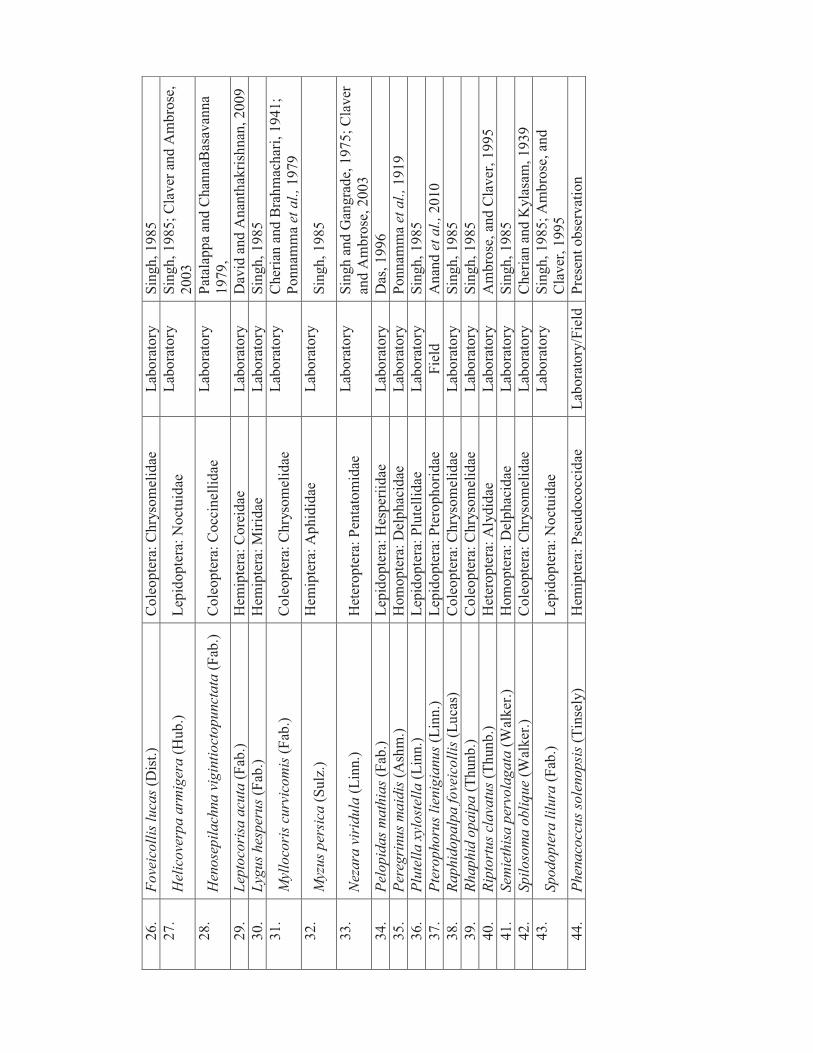
It is a predator of 44 insect pests (see Table 1). Moreover, food requirement has also been
known for this predator (Ambrose and Kumaraswami, 1993). Both biotic and abiotic
factors influence the distribution and diversity of reduviid predators. In agroecosystems,
abundance of this predator has been artificially enhanced and makes them sustain; for
instance, the influence of mulching and intercropping on the abundance of the Reduviid
predator, Rhynocoris fuscipes (Claver and Ambrose, 2003a).
Many authors studied the pest suppression efficacy of R. fuscipes on various crop
pests (Singh and Gangrade, 1975; Ponnamma et al., 1979; Singh, 1985; Ambrose and
Livingstone, 1986; Singh and Singh 1987; Ambrose, 1995), particularly Riptortus clavatus
Thunberg (Heteroptera: Alydidae) and Spodoptera lilura F. (Ambrose, and Claver, 1995),
three pests of pigeonpea (Cajanus cajan) (Ambrose and Claver, 2001), Helicoverpa
armigera (Hubner), Nezara viridula (L.) and Riptortus clavatus Thunberg (Claver and
Ambrose, 2003a) and reproductive performance on three lepidopteran pests (Babu et al.,
1995; Ambrose and Claver, 1995; George and Ambrose, 1998; George et al., 2002) has
also been studied. Claver and Ambrose (2001b) evaluated suitability of various substrata
for the mass rearing of this reduviid. Moreover, field release studies showed its efficacy in
pest management programme (Claver and Ambrose, 2003a,b).
The R. fuscipes nymphs are not found along with their parents or in groups. Adults are
having nodding behaviour as defensive mechanism. Nymphal instars are orange red with
black eyes, light yellowish green legs with brown spots. Black lateral and median
abdominal spots and wing rudiments are seen in older instars. Rao (1974) first reported its
development and breeding techniques. But he failed to provide the details of its biology.

Ta
ble
1.
Rh
yno
cori
s fu
scip
es p
rey
s li
st w
ith
cit
ati
on
1.
P
est
Ord
er:
Fa
mil
y
La
b/F
ield
A
uth
or
1.
Ach
aea
ja
na
ta (
Lin
n.)
L
epid
op
tera
: N
oct
uid
ae
Lab
ora
tory
S
ingh
, 1
98
5
2.
A
ph
ids
go
ssyp
ii (
Glo
ver
) H
emip
tera
: A
ph
idid
ae
Lab
ora
tory
M
ajes
h e
t a
l.,
20
11
3.
A
ph
is c
racc
ivo
ra (
Ko
uch
.)
Hem
ipte
ra:
Ap
hid
idae
L
abo
rato
ry
Sah
ayar
aj e
t a
l.,
20
02
4.
A
ula
cop
ho
ra f
ove
ico
llis
(L
uca
s.)
Co
leo
pte
ra:
Ch
ryso
mel
idae
L
abo
rato
ry
Am
bro
se,
19
95
5.
C
alo
cori
s a
ng
ust
atu
s (L
eth
.)
Hem
ipte
ra:
Mir
idae
L
abo
rato
ry
Am
bro
se,
19
80
; 1
98
5
6.
C
ato
psi
lia
pyr
an
the
(Lin
n.)
L
epid
op
tera
: P
ieri
dae
L
abo
rato
ry
Hir
emat
h a
nd
Th
on
dar
ya,
19
83
7.
C
hil
o p
art
ellu
s (S
win
h.)
L
epid
op
tera
: P
yra
lid
ae
Lab
ora
tory
R
ao e
t a
l.,
19
81
8.
C
lavi
gra
lla
gib
bo
sa (
Sp
ino
la)
Hem
ipte
ra:
Co
reid
ae
Lab
ora
tory
D
as,
19
96
9.
C
lavi
gra
lla
ho
rren
s (D
ist.
) H
emip
tera
: C
ore
idae
L
abo
rato
ry
Das
, 1
99
6
10
.
Co
rcyr
a c
eph
alo
nic
a (
Sta
in.)
L
epid
op
tera
: P
yra
lid
ae
Lab
ora
tory
S
ingh
, 1
98
5
11
.
Cyr
taca
nth
acr
is s
ucc
inct
a (
Kir
by.)
O
rth
op
tera
: A
crid
idae
L
abo
rato
ry
Am
bro
se,
19
85
12
.
Dia
cris
ia d
elig
na
(F
ab.)
L
epid
op
tera
: A
rcti
dae
L
abo
rato
ry
Sin
gh
an
d G
ang
rad
e,
19
76
; S
ingh
, 1
98
5
13
.
Dia
cris
ia o
bli
qu
e (W
alk
.)
Lep
ido
pte
ra:
Arc
tid
ae
Lab
ora
tory
S
ingh
an
d G
ang
rad
e, 1
97
5
14
.
Dia
ph
an
ia i
nd
icu
s (S
aun.)
L
epid
op
tera
: P
yra
ust
idae
L
abo
rato
ry
Nag
araj
an a
nd
Am
bro
se,
20
10
15
.
Dic
lad
isp
a a
rmig
era
(O
liv
er)
Lep
ido
pte
ra:
Pte
rop
ho
rid
ae
Lab
ora
tory
S
ingh
, 1
98
5
16
.
Do
lyco
ris
ind
icu
s (S
tat.
) H
emip
tera
: P
enta
tom
idae
L
abo
rato
ry
Das
, 1
99
6
17
.
Dys
der
cus
cin
gu
latu
s (F
ab.)
H
emip
tera
: P
yrr
ho
cori
dae
L
abo
rato
ry
Am
bro
se,
19
85
; S
ingh
an
d S
ingh
,
19
87
18
.
Ea
ria
s in
sula
na
(B
ois
d.)
L
epid
op
tera
: N
oct
uid
ae
Lab
ora
tory
A
mb
rose
, 19
99
19
.
Ea
ria
s vi
tell
a (
Fab
.)
Lep
ido
pte
ra:
No
ctu
idae
L
abo
rato
ry
Sin
gh
an
d S
ingh
, 1
98
7
20
.
Ep
ila
chn
a 1
2-s
tig
ma
(M
uls
.)
Co
leo
pte
ra:
Co
ccin
elli
dae
L
abo
rato
ry
Nayar
et
al.
, 1
97
6
21
.
Ep
ila
chn
a v
igin
tio
cto
pu
nct
ata
(F
ab.)
C
ole
op
tera
: C
occ
inel
lid
ae
Lab
ora
tory
N
ayar
et
al.
, 1
97
6
22
.
Ep
ila
cris
ia s
tig
ma
(M
uls
.)
Co
leo
pte
ra:
Co
ccin
elli
dae
L
abo
rato
ry
Dav
id a
nd
Nat
raja
n,
19
89
23
.
Eu
tect
on
a m
ach
aer
ali
s (W
alk
er)
Lep
ido
pte
ra:
Pyra
lid
ae
Lab
ora
tory
N
agar
ajan
an
d A
mb
rose
, 2
01
0
24
.
Exe
last
is a
tom
osa
(W
lsm
.)
Lep
ido
pte
ra:
Pte
rop
ho
rid
ae
Lab
ora
tory
S
ingh
an
d S
ingh
, 1
98
7
25
.
Fa
lan
ga
su
ccin
ct (
Lin
n.)
L
epid
op
tera
: P
yra
ust
idae
L
abo
rato
ry
Sin
gh
an
d S
ingh
, 1
98
7
26
.
Fo
veic
oll
is l
uca
s (D
ist.
) C
ole
op
tera
: C
hry
som
elid
ae
Lab
ora
tory
S
ingh
, 1
98
5
27
.
Hel
ico
verp
a a
rmig
era
(H
ub
.)
Lep
ido
pte
ra:
No
ctu
idae
L
abo
rato
ry
Sin
gh
, 1
98
5;
Cla
ver
an
d A
mb
rose
,
20
03
28
.
Hen
ose
pil
ach
na
vig
inti
oct
op
un
cta
ta (
Fab
.)
Co
leo
pte
ra:
Co
ccin
elli
dae
L
abo
rato
ry
Pat
alap
pa
and
Ch
ann
aBas
avan
na
19
79
,
29
.
Lep
toco
risa
acu
ta (
Fab
.)
Hem
ipte
ra:
Co
reid
ae
Lab
ora
tory
D
avid
an
d A
nan
thak
rish
nan
, 2
00
9
30
.
Lyg
us
hes
per
us
(Fab
.)
Hem
ipte
ra:
Mir
idae
L
abo
rato
ry
Sin
gh
, 1
98
5
31
.
Myl
loco
ris
curv
ico
mis
(F
ab.)
C
ole
op
tera
: C
hry
som
elid
ae
Lab
ora
tory
C
her
ian
an
d B
rah
mac
har
i, 1
94
1;
Po
nn
amm
a et
al.
, 1
97
9
32
.
Myz
us
per
sica
(S
ulz
.)
Hem
ipte
ra:
Ap
hid
idae
Lab
ora
tory
S
ingh
, 1
98
5
33
.
Nez
ara
vir
idu
la (
Lin
n.)
H
eter
op
tera
: P
enta
tom
idae
L
abo
rato
ry
Sin
gh
an
d G
ang
rad
e, 1
97
5;
Cla
ver
and
Am
bro
se,
20
03
34
.
Pel
op
ida
s m
ath
ias
(Fab
.)
Lep
ido
pte
ra:
Hes
per
iid
ae
Lab
ora
tory
D
as,
19
96
35
.
Per
egri
nu
s m
aid
is (
Ash
m.)
H
om
op
tera
: D
elp
hac
idae
L
abo
rato
ry
Po
nn
amm
a et
al.
, 1
91
9
36
.
Plu
tell
a x
ylo
stel
la (
Lin
n.)
L
epid
op
tera
: P
lute
llid
ae
Lab
ora
tory
S
ingh
, 1
98
5
37
.
Pte
rop
ho
rus
lien
igia
nu
s (L
inn
.)
Lep
ido
pte
ra:
Pte
rop
ho
rid
ae
Fie
ld
An
and
et
al.
, 2
01
0
38
.
Ra
ph
ido
pa
lpa
fo
veic
oll
is (
Lu
cas)
C
ole
op
tera
: C
hry
som
elid
ae
Lab
ora
tory
S
ingh
, 1
98
5
39
.
Rh
ap
hid
op
aip
a (
Th
un
b.)
C
ole
op
tera
: C
hry
som
elid
ae
Lab
ora
tory
S
ingh
, 1
98
5
40
.
Rip
tort
us
cla
vatu
s (T
hu
nb
.)
Het
ero
pte
ra:
Aly
did
ae
Lab
ora
tory
A
mb
rose
, an
d C
lav
er,
19
95
41
.
Sem
ieth
isa
per
vola
ga
ta (
Wal
ker
.)
Ho
mo
pte
ra:
Del
ph
acid
ae
Lab
ora
tory
S
ingh
, 1
98
5
42
.
Sp
ilo
som
a o
bli
qu
e (W
alk
er.)
C
ole
op
tera
: C
hry
som
elid
ae
Lab
ora
tory
C
her
ian
an
d K
yla
sam
, 1
93
9
43
.
Sp
od
op
tera
lil
ura
(F
ab.)
L
epid
op
tera
: N
oct
uid
ae
Lab
ora
tory
S
ingh
, 1
98
5;
Am
bro
se,
and
Cla
ver
, 1
995
44
.
Ph
ena
cocc
us
sole
no
psi
s (T
inse
ly)
Hem
ipte
ra:
Pse
ud
oco
ccid
ae
Lab
ora
tory
/Fie
ld
Pre
sen
t o
bse
rvat
ion

5
But in 1986, Ambrose and Livingstone described the life history of this bug on houseflies,
ants and caterpillars. The nymphs took 58.15 day and consumed 60.99 second/third instar
Neara viridula Linn (Singh and Singh, 1987). Earlier, Singh and Gangrade (1976)
observed this predator feeding on the Diacriia oblique Walker (Lepidoptera: Arctiidae).
They reported that nymphal instars needed 102 to 110 days for completing the lifetime and
consumed 96 to 101 larvae. In Madhya Pradesh, Ponnamma et al. (1979) observed total
nymphal period range from 33 to 44 days on Myllocerus curvicornis (Fab.), a pest of
coconut palm in Kerala. In Tamil Nadu, R. fuscipes completed its lifetime within 41.22
days on houseflies, ants and lepidopteran caterpillars (Ambrose and Livingstone, 1986).
Recently, George et al. (2000) found that it needs only 34.21 days to complete its nymphal
stage. They used C. cephalonica as a prey and further reported that it laid 58.37 eggs.
The growth, development and reproduction of the reduviid predators vary in
relation to hosts (Bass and Shepard, 1974; Sahayaraj et al., 2004; Sahayaraj, 2007b;
Sahayaraj, 2012). However, no information is available about the influence of
D. cingulatus and P. solenopsis on the life history and bioefficacy of R. fuscipes moreover;
the predator has not been released augmentatively under cotton field to manage the pests
and previous reports confirmed that R. fuscipes can suppress the pest population. Hence
the biology, life table parameter, and bioefficacy were recorded for this predator under
laboratory, pot and field conditions with the following objectives,
Objectives
1. To record the biology and life table parameters of Rhynocoris fuscipes on
Dysdercus cingulatus, Phenacoccus solenopsis and a factitious host Corcyra
cephalonica.
2. To record the prey preference, stage preference and functional response of R.
fuscipes against D. cingulatus, and P. solenopsis.

6
1.3. MATERIALS AND METHODS
1.3.1. Cotton plant cultivation and pest rearing
Cotton seedlings (SVPR variety 2) were individually maintained in 25 cm diameter
pots kept inside the screen house (36 x 21.5 sq. ft.) until they were grown approximately
25 cm height (~30 day old) and suitable for rearing Dysdercus cingulatus and
Phenacoccus solenopsis. The seedlings were watered twice in a week, and grown in
composts. Separate cultures of D. cingulatus, and P. solenopsis were maintained on cotton
plant for more than five generations. Insects reared on the cotton plants were used for the
study. Dysdercus cingulatus and P. solenopsis nymphs and adults were collected on cotton
at Munanjipatty (N8052’11” E77
077’614”), Panagudi (N8
048’00” E77
067’00”), and
Pavoorchathram (N8069’33” E78
004’706”), Tirunelveli district, Tamil Nadu, India. The
laboratory stock culture of D. cingulatus and P. solenopsis life stages were maintained by
using artificial diet (Sahayaraj et al., 2011) and surface of cleaned pumpkin (Patel, 2010)
respectively.
1.3.2. Maintenance of Reduviid predator
Individuals of reduviid predator were collected from cotton agro-ecosystems in and
around Tirunelveli and Kanyakumari districts, Tamil Nadu, India. They were maintained
room at a constant temperature of 28 ± 2oC, 60-10% RH and photoperiod of 11: 13 (L:D)
hrss in transparent plastic containers (15 cm diameter x 8 cm height) with fourth
(15.3±0.05 mg) and fifth (19.6±0.02 mg) instar larvae of C. cephalonica and also
D. cingulatus third (43.7±0.3mg), fourth (49.6±0.03mg) and fifth nymphal instars
(78.8±0.05) and adult of P. solenopsis (17.4±0.3mg).
1.3.3. Biology and life table of predator
The study was performed in three experimental levels.

7
1.3.3.1. Experiments:
1) The first evaluated the effect of natural and factitious hosts on the biological
characteristic features. For this experiment, freshly hatched R. fuscipes nymphs (≤ 24 hrs
old) were used. Dysdercus cingulatus third (43.7±0.3mg), fourth (49.6±0.03mg) and fifth
nymphal instars (78.8±0.05) and adults (17.4±0.3mg) of P. solenopsis, from colonies
maintained at Crop Protection Research Centre (CPRC) were offered (1 pest/3 predators at
first and second instars and 1 pest/1 predator at remaining stadia) to each nymph as per the
method described by Sahayaraj et al. (2007a). The randomized complete block design
with three treatments was maintained for the study. Reduviids provided with nymphs of
D. cingulatus.
2) Reduviids provided with adults of P. solenopsis and
3) Reduviids provided with fourth and fifth instar larvae of C. cephalonica and maintained
for three generations continuously. The predators were maintained in 300-ml transparent
plastic containers (12 cm diameter x 5 cm height). One newly emerged nymph was placed
in each container. For treatments with prey, two preys (nymphs or larvae or adult) per day
were supplied to each of the predator nymphs throughout the experiment. After every 24
hrs, the consumed prey was removed from the experimental arena. Similarly, molted
exuviae’s and dead predators (if any) were removed every 24 hrs using a fine Camlin
brush (2 mm). Total nymphal development, nymph mortality, adult longevity and adult
weight (male and female separately of the predator on each pest was recorded separately.
After the emergence of adult, sex ratio (number of females/number of males +
number of females) was calculated and each R. fuscipes pair was released into 500 ml (17
cm diameter x 7 cm height) plastic container for mating. Adults were also maintained on
the same food regimen as that of the nymphs from whom they had originated. All
R. fuscipes adults received three to four red cotton bug or cotton mealy bug or rice flour

8
moth larvae per day. The reduviid was maintained for three generations with the same
food regime, space provision and environmental conditions over eight months. Following
biological parameters were recorded during the experiment: duration of the pre-
oviposition period, number of eggs per dropt, total number of eggs laid over the life-time,
oviposition time (time from the mating to the last egg batch), oviposition index (number of
egg laying days/female life time) and the post-oviposition time (after the last egg batch to
death of the insects). Lower fitness index was calculated for each category to record the
females’ fitness to produce the progeny.
Using the data, life table was constructed (Southwood, 1978). Construction of a
life table for a predator species is an important component for understanding its dynamics.
Laboratory reared R. fuscipes on D. cingulatus and P. solenopsis were maintained and
used in the study for life table parameters. Different batches of eggs were allowed to hatch
separately in 1 L capacity plastic containers covered with netted lids for free aeration and
also to avoid the nymphal cannibalism. The newly hatched nymphs were reared in
laboratory condition on the above mentioned pests. To construct the life table, the rate of
increase was determined by using the following formula:
Σ e-rmx
lxmx = 1 (or) Σ e-rmx
lxmx = 1096.6
where e-rmx
= rate of increase
lxmx = net reproductive rate
Net reproductive rate, (R0=lxmx), the rate of multiplication of the population in
each generation was measured in terms of female produced per generation. The
approximate value of cohort (Tc) was calculated as:
Tc = (Σ lxmx)x/Ro
where Σ lxmx =sum of net reproductive rate; Ro = net reproductive rate
9
The arbitrary value of innate capacity (rc) was calculated using the formula: Rc=
log e Ro/ Tc. It was the arbitrary value of ‘rm’. Since the value of e-rmx obtained from
experiments often lay outsides the range, both sides equation were multiplied by a factor of
Σ e-rmx
lxmx = 1096.6. The innate rate of increase (λ) was calculated as λ=antilog
erm
/female/day. The weekly multiplication of the predator was calculated as antilog erm
. The
doubling time (DT) was calculated as DT= In2/rm.
1.3.4. Macromolecular profile of preys
The macromolecules like total body carbohydrate, total body protein and total body
lipid (Sadasivam and Manikam, 1997; Lowry et al., 1951; Bragdon, 1951) contents of
D. cingulatus, A. gossypii, P. solenopsis and H. armigera were quantified using standard
procedure.
1.3.4.1. Total body carbohydrate (Sadasivam and Manikam, 1997)
Preparation of Anthrone reagent: Take 200 mg of anthrone (0.2%) added with 5 ml of
ethanol solution and to this solution add 95 ml of 75 % Con H2SO4.
Standard glucose solution: Take 10 mg of glucose to be added with 100 ml of distilled
water and it was considered as a standard glucose solution.
Extraction of carbohydrate from insect prey: 100mg weight of live animal was taken in
a homogenizer tube with phosphate buffer and homogenised. Centrifuge it at 3000 rpm for
30 minutes. Collect the supernatant (1 ml) and take particular volume of aliquots for
analysis of carbohydrate.
Procedure for carbohydrate estimation
Prepare the 0.1, 0.2, 0.3, 0.4, 0.5, 0.6, 0.7, 0.8, 0.9 and 1.0 ml of standard glucose in
a series of test tubes. ‘0’ serves as blank. Make the volume to 1 ml in all the test tubes
including the sample test tube by distilled water. Then add 4 ml of anthrone reagent. Heat
them for 10 minutes in a boiling water bath. Cool rapidly and read the green colour at 630

10
nm. Standard graph was drawn according to the optical density (OD) of the standard. From
the graph and also using formula the amount of carbohydrate present in the sample was
calculated:
Con. of standard × OD of the sample
Carbohydrate content in sample mg/100 mg = ----------------------------------------------
OD of the standard
1.3.4.2. Estimation of prey whole body protein (Lowry et al., 1951)
Preparation of Reagents
Reagent A: 2% sodium carbonate (Na2CO3) in 0.1N sodium hydroxide (NaOH)
(prepare freshly).
Reagent B: 0.5 % copper sulphate (CuSO4. 5H2O) in 1% potassium sodium tartrate
(PST) (prepare freshly).
Reagent C: Mix 50 ml of Reagent A and 1 ml of B (prepare prior to use).
Reagent D: Folin-ciocaltteau reagent dilutes the commercially available reagent with an
equal volume of distilled water on the day of use.
Preparation of standard protein: Take 10 mg Bovine Serum Albumin (BSA). Add 50 ml
of distilled water and it is considered as a standard.
Working standard: Dilute 10 ml of protein solution to 5 ml of distilled water in a
standard flask.
Extraction of protein from insect prey: Take 100 mg of alive animal and homogenise
with the 1 ml of phosphate buffer (pH 7.2) and centrifuge it at 3000 rpm for 30 minutes.
Supernatant (1 ml) was used for estimating the protein.
Procedure for protein estimation
Pipette out 0.1, 0.2, 0.3, 0.4, 0.5, 0.6, 0.7, 0.8, 0.9 and 1.0 ml of the working
standard protein solution into a series of test tubes. Pipette out a known volume of sample
into a test tube. The volumes of the sample as well as standard were made up to 1 ml by
11
distilled water. A test tube with 1 ml of water was serves as the blank. Add 5 ml of reagent
(to each test tube including blank). Mix well and allow it to stand for 10 minutes, then add
0.5 ml of reagent D mixed well and incubate at room temperature for about 30 minutes.
Blue colour was developed; the intensity of the colour was measured at 650nm. The optical
density (OD) was compared with standard graph to estimate protein in mg/100g.
Con. of standard × OD of the sample
Protein content in sample mg/100 mg = ---------------------------------------------------
OD of the standard
1.3.4.3. Estimation of whole body lipid (Bragdon, 1951)
Preparation of Acetic anhydride solution: About 50 ml of acetic anhydride solution was
taken in a beaker which was kept in an ice bucket. To this, 2 ml of concentrated H2SO4
acid was added carefully and gently stirred and kept in a cool place for some time. The
mixture should be colourless otherwise it should be discarded and prepared freshly.
Preparation of Potassium dichromate: Potassium dichromate (K2Cr2O7) (2%) was mixed
with con. H2SO4. This reagent was prepared freshly.
Standard cholesterol solution: Take 10 mg of cholesterol; make it up to 100 ml of
chloroform.
Preparation of standard graph
Standard cholesterol was pipetted out into a series of test tubes in different volumes
from 0.1, 0.2, 0.3, 0.4, 0.5, 0.6, 0.7, 0.8, 0.9 and 1.0 ml. All the test tubes were made up to
1 ml with chloroform. A test tube with 1 ml of distilled water was served as blank. Then to
each test tube, 5 ml of acetic anhydride was carefully added and mixed well. The test tubes
were covered with dark black colour cloth and kept for about 15 minutes without any
disturbance. In concentrated solution one can notice the colour becoming rosy red, to blue
and greenish blue. The developed colour was measured at 640nm in a spectrometer and

12
optical density (OD) value was recorded. Standard graph was drawn by applying
concentrations of cholesterol on X axis and optical density (OD) on Y.
Extraction of lipid from insect prey
Take 100 mg of animal was taken in a homogenizer tube and homoginize it with 2
ml of chloroform. This was centrifuged at 3000 rpm for 30 minutes. The supernatant (1 ml)
was transferred to a test tube and evaporated to dryness. This was kept at room temperature
for 2 days. Three ml of distilled water and an equal amount of freshly prepared potassium
dichromate solution was added. The intensity of the colour developed was measured at
640nm in spectrophotometer. The optical density (OD) of the sample was compared with
standard graph to estimate lipid in mg/100g.
Con. of standard × OD of the sample
Lipid content in sample mg/100 mg = -----------------------------------------------------
OD of the standard
1.3.5. Stage preference (Joseph, 1959)
To evaluate whether R. fuscipes life stages exhibited a preference over various life
stages of D. cingulatus and P. solenopsis or preference differed with predator life stage,
separate experiments were conducted. Choice test was carried out and it consisted of
exposing a reduviid nymph from one of the three instars (all three tested separately) and
adults to four prey of each of the following pest life stages: first, second, and third
(08.5±0.2 mg) nymphal instar and adult of P. solenopsis (17.4±0.3mg) or all life stages of
D. cingulatus. This resulted in their exposure to 16 and 24 total preys per test for the
former and the latter test, respectively into a Petri dish (16 cm diameter x 2.0 cm height)
containing fresh cotton leaf (SVPR II). The pests were allowed to move undisturbed for 10
minutes, then a third (28.7±0.08 mg), fourth (40.5±0.06 mg), fifth (64.8±0.02) nymphal
instars and adults (male=78.6±0.04, female=96.9±0.07) of R. fuscipes were released into

13
each Petri dish separately and the successfully captured stage was recorded. The
experiments were replicated 10 times for each instars with separate individuals.
Reduviid feeding behavior was observed visually. During observations, the number
of each prey life stage encountered and consumed by the reduviids was recorded. Each test
was terminated when a predator had consumed three preys, the point after which reduviid
predator would become satiated. For this reason, we used three preys as the standard in all
tests. Individual tests were mostly completed within 60 min for adults and within 90 min
for the third, fourth and fifth instar predators. Tests with each reduviid predator stage
against each host species were replicated 10 times. Prey acceptability for each prey life
stage was measured as the percentage of encountered prey of each individual life stage
that was consumed (i.e. for each individual host life stage, the number consumed over the
number encountered x 100).
1.3.6. Host preference (Ambrose, 1999)
Once the stage preference was recorded, then host preference studies were
conducted by introducing four numbers the preferred stages of D. cingulatus [third
nymphal instar (43.7±0.3mg), for R. fuscipes third and fourth instars; fourth nymphal
instar (49.6±0.03mg) for R. fuscipes fifth instars and fifth nymphal instars (78.8±0.05) for
R. fuscipes adult) and P. solenopsis adult (17.4±0.3mg) (for all the tested stages of the
predator) in to Petri dish (9 cm diameter x 1.5 cm height) containing fresh cotton leaf
(SVPR II) to mimic the field condition. The pests were allowed to move undisturbed
condition for 10 minutes, then a third (28.7±0.08 mg), fourth (40.5±0.06 mg), fifth
(64.8±0.02) nymphal instars and adults (male=78.6±0.04, female=96.9±0.07) of
R. fuscipes were released into each Petri dishes separately and the successfully captured
prey was recorded visually for a period of 60 minutes. The experiments were replicated for
10 times for each instar with separate individuals.

14
1.3.7. Functional response (Holling, 1959)
Functional response is an appropriate way to characterize the interaction of
R. fuscipes with two different hemipteran prey species in a highly simplified environment.
Experimental arena is glass Petri dishes (9.0 cm diameter x 1.5 cm height). A cotton leaf
was placed at the base of the arena to mimic the field condition during the experiments. To
evaluate the functional response, 24 hrss pre-starved predators of third (28.7±0.08 mg),
fourth (40.5±0.06 mg), fifth (64.8±0.02) and adult (male and female) (85.2±0.03) stages
were used in each one of the densities of (1, 2, 4, 8, and 10) D. cingulatus third instars
nymphs and P. solenopsis adults. The prey was first introduced in to the Petri dish and was
allowed to settle for 15 min. Then the predator was introduced and the prey consumed or
killed within 24 hrs was recorded. To understand the impact of prey and prey size on the
functional response, all the functional response parameters were analyzed separately for
D. cingulatus and P. solenopsis. The experiments were replicated 10 times with separate
and healthy predators.
1.3.7.1. Data analysis
The modified “Holling disc equation” of Holling (1959) ie ‘random predator
equation’ (Rogers 1972) was used to find out the functional response of R. fuscipes against
D. cingulatus third instar and P. solenopsis adult. Prey density (No), total number of prey
killed (Ne) in a given period of time, and the maximum prey consumed (k) were recorded.
Prey attack ratio (E=Ne/No), rate of discovery per unit of searching time [a = (Ne/No)/Ts],
time spent by the predator in searching for prey (Ts), and time spent for handling each
prey by the predator (b = Th/k) were calculated. Data of prey attack ratio (E) was
converted into prey attacking efficiency (PAE) by multiplying with 100 (PAE =Ne/No X
100).

15
1.3.8. Statistical analysis
Individual data of developmental time, adult longevity, fecundity, oviposition
periods and adult weight of the reduviid reared on mealy bug and red cotton bugs were
compared using one-way analysis of variance (ANOVAs) with factitious host insect
species as fixed variables. The influence of feeding regime on nymphal survival was
analyzed using one-way ANOVA and post ANOVA, Tukey test. Correlation was recorded
between the attack ratios (Ne/No) and predicted attack ratio (YY’’//NNoo). Mean number of
prey attacked by a predator as a function of prey density was subjected to ANOVA and
significance was expressed at 5% level. All analyses were performed using the SPSS
statistical software (Version 20.0) and all statistical tests were carried out at 5% level of
significance (α = 0.05).
1.4. RESULTS
1.4.1. Incubation
The mean duration of incubation period was significantly prolonged in both D.
cingulatus (6.8±0.1 days; F= 3.399, df= 4, 176, P=0.01) and and P. solenopsis (6.5±0.1
days; F= 3.432, df= 4, 155, P= 0.01) when comparing with factitious host C. cephalonica
(6.3±0.1 days; F= 3.009, df= 6, 174, P= 0.008) (Table 2, 3, 4, 5).
1.4.2. Nymphal developmental period
The total mean nymphal period of R. fuscipes was increased when reared on
D. cingulatus (F= 2.550, df= 14, 48, P= 0.008) or P. solenopsis (F= 4.125, df= 11, 51,
P=0.005). The same trend was noted in D. cingulatus reared predator’s first instar
(F=3.536, df=6,160, P=0.003); second instar (F=3.033 df=5,140, P=0.012) and fifth instar
(F=4.007, df=3,88, P=0.010) and also in P. solenopsis reared predator’s first instar
(F=6.440, df=4,132, P=0.005); second instar (F=2.329, df=5,116, P=0.047); third instar

Table 2. Individual and total nymphal developmental period (days), oviposition
periods (days ± SE), fecundity (eggs/female) and hatchability (%) of R.
fuscipes on two cotton pests and a factitious hosts during first generation.
Life stages Prey
C. cephalonica D. cingulatus P. solenopsis
Incubation 6.6±0.1abc
6.8±0.1 abc
7.8±0.1 abc
First instar 7.9±0.1 abc
7.9±0.1 abc
8.1±0.1 abc
Second instar 6.7±0.1 ab
7.1±0.1 abc
7.4±0.1 abc
Third instar 8.0±0.1 abc
8.3±0.2 abc
8.8±0.1 c
Fourth instar 6.7±0.1 abc
7.4±0.1 abc
7.8±0.2 abc
Fifth instar 7.6±0.1 ac
8.3±0.2 bc
9.8±0.2 bc
Total 42.5±0.3 abc
45.6±0.4 abc
49.5±0.5 abc
Pre-oviposition 10.9±0.2 abc
09.1±0.4 ab
12.8±0.4 abc
Oviposition 18.9±0.7 abc
12.7±0.7 abc
10.9±0.2 ac
Post-oviposition 9.8±0.5 abc
10.2±0.8 abc
9.9±0.6 bc
Fecundity 44.5±0.8 abc
27.4±0.8 abc
21.6±0.8 abc
Hatchability 97.7±1.5 abc
97.1±1.4 ab
95.4±2.8 bc
Oviposition index 0.086 0.073
0.064
Minimum no. of
eggs
4.6±0.2 ab
4.1±0.2 abc
3.1±0.4 bc
Maximum no. of
eggs
24.8±0.2 ab
18.6±0.1 ab
13.2±0.1 bc
Mean followed by the same letter do not differ significantly by DMRT at 5% level.
Comparison was made between C. cephalonica, D. cingulatus and P. solenopsis.

Table 3. Individual and total nymphal developmental period (days), oviposition
periods (days ± SE), fecundity (eggs/female) and hatchability (%) of R.
fuscipes on two cotton pests and a factitious hosts during second
generation.
Life stages Prey
C. cephalonica D. cingulatus P. solenopsis
Incubation 6.8±0.1abc
7.9±0.2abc
7.2±0.2abc
First instar 8.1±0.1ac
8.2±0.1 b
9.4±0.2 ac
Second instar 6.8±0.2ac
7.4±0.1bc
9.2±0.2bc
Third instar 8.1±0.2abc
8.1±0.1ab
9.4±0.2bc
Fourth instar 7.1±0.1a 8.1±0.1
abc 9.9±0.2
ac
Fifth instar 7.8±0.2a 8.7±0.2
bc 10.7±0.2
c
Total 44.1±0.4ab
48.6±0.3abc
56.3±0.4abc
Pre-oviposition 11.7±0.3abc
11.7±0.4bc
14.0±0.6abc
Oviposition 21.5±0.8abc
21.1±0.5bc
6.3±0.4 ac
Post-oviposition 9.8±0.4abc
9.6±0.5abc
7.1±0.5abc
Fecundity 41.5±0.3abc
31.5±0.2abc
20.4±0.2bc
Hatchability 96.3±0.1abc
97.1±0.2bc
93.6±0.3bc
Oviposition index 0.080 0.065 0.045
Minimum no. of
eggs
3.8±0.02ab
3.5±0.1abc
2.2±0.2bc
Maximum no. of
eggs
20.1±0.1ab
13.8±0.1ab
09.8±0.01bc
Mean followed by the same letter do not differ significantly by DMRT at 5% level.
Comparison was made between C. cephalonica, D. cingulatus and P. solenopsis.

Table 4. Individual and total nymphal developmental period (days), oviposition
periods (days ± SE), fecundity (eggs/female) and hatchability (%) of R.
fuscipes on two cotton pests and a factitious hosts during third generation.
Life stages Prey
C. cephalonica D. cingulatus P. solenopsis
Incubation 6.8±0.2abc
7.3±0.1abc
7.8±0.1abc
First instar 7.9±0.2a 8.3±0.1
abc 9.5±0.2
ac
Second instar 7.3±0.2abc
7.5±0.2ab
8.9±0.2abc
Third instar 8.1±0.2ab
8.0±0.1ab
9.4±0.2abc
Fourth instar 6.7±0.2abc
7.9±0.1abc
10.0±0.2abc
Fifth instar 7.9±0.2abc
8.5±0.2bc
9.8±0.3bc
Total 44.1±0.9abc
47.9±0.6abc
56.8±0.6bc
Pre-oviposition 15.4±0.3abc
12.9±0.7abc
18.7±0.3abc
Oviposition 18.3±0.2ab
21.9±0.5ab
-
Post-oviposition 14.9±0.5ab
8.9±0.8ab
-
Fecundity 21.2±0.04ab
14.1±0.0ab
-
Hatchability 94.1±0.04ab
93.4±0.2ab
-
Oviposition index 0.080 0.061 -
Minimum no. of
eggs
3.1±0.1ab
2.6±0.1ab
-
Maximum no. of
eggs
16.6±0.1ab
14.8±0.1ab
-
Mean followed by the same letter do not differ significantly by DMRT at 5% level.
Comparison was made between C. cephalonica, D. cingulatus and P. solenopsis.

Table 5. Nymphal developmental period ( X ± SE) of R. fuscipes cumulative data of
three generations on C. cephalonica, D. cingulatus and P. solenopsis
Life stage
Prey
C. cephalonica
(N=186)
D. cingulatus
(N=180)
P. solenopsis
(N=159)
First instar 7.7±0.1ab
7.9±0.1b 8.4±0.1
c
Second instar 6.3±0.1ab
7.1±0.1bc
7.4±0.1bc
Third instar 7.9±0.1ab
8.3±0.2ab
8.8±0.1ac
Fourth instar 6.2±0.2ac
7.4±0.1b 7.8±0.2
ac
Fifth instar 7.4±0.2a 8.3±0.2
bc 9.8±0.2
bc
Total 41.1±0.4ab
45.6±0.4ab
48.9±0.3c
Mean followed by the same letter do not differ significantly by DMRT at 5% level.
Comparison was made between C. cephalonica, D. cingulatus and P. solenopsis.

16
(F=4.095, df=4,98, P=0.004); fourth instar (F=2.644, df=3,77, P=0.055) and fifth instar
(F=2.778, df=3,59, P=0.049) (Table 2,3,4,5).
1.4.3. Survival rate
The nymphal survival rate decreased while the predator grew older. The total
nymphal survival per cent was significantly lower in D. cingulatus (F= 3.721, df= 10, 52,
P= 0.03) and P. solenopsis (F= 4.964, df= 9, 53, P= 0.02) when compared to the
C. cephalonica (58.8%). Higher survival was observed in the first instar predator
invariably provided with C. cephalonica (F=0.898, df=4,5, P=0.528), D. cingulatus
(F=0.484, df=4,5, P=0.749), and P. solenopsis (F=0.279, df=4,5, P=0.880). For a while,
least survival rate was observed in fifth instars reduviid reared on C. cephalonica
(F=0.051, df=5,4, P=0.997), D. cingulatus (F=0.807, df=5,4, P=0.599), and P. solenopsis.
Invariably in three generations, total nymphal survival percent of R. fuscipes was lower in
both D. cingulatus (F=3.721, df=10, 52, P=0.03) and P. solenopsis (F=4.964, df=9, 53,
P=0.02) than C. cephalonica (F=0.754, df=9, 53, P=0.241) (Fig. 1).
1.4.4. Adult longevity
Female predator lived longer than the male predator (Fig. 2). The adult longevity
was shorter for D. cngulatus (F=1.987, df=11, 48, P=0.075; F=1.087, df=12, 47, P=0.037
for male and female, respectively) and P. solenopsis (F=0.637, df=9, 27, P=0.05 for male;
F=3.738, df=9, 10, P=0.026 for female) offered predators when compared to the factitious
host, C. cephalonica (F=1.004, df=12, 47, P=0.460 for male; F=0.869, df=11, 48, P=0.324
for female).
1.4.5 Adult weight and sex ratio
When compared to C. cephalonica fed category, D. cingulatus fed animals were
significantly heavier (F=5.624, df= 2, 7, P=0.026) than the P. solenopsis (F= 3.470, df=1,
8, P=0.054) fed male and female of R. fuscipes adults (Fig. 3). Invariably, male biased sex

Figure 1. Mean nymphal survival rate (%) of R. fuscipes nymphal stages reared on
host C. cephalonica (CC), D. cingulatus (DC) and P. solenopsis (PS).
0
20
40
60
80
100
120
First Second Third Fourth Fifth
CC DC PS
Figure 2. Mean adult longevity (days) of R. fuscipes male (suffix - M) and female
(suffix - FM) reared on (CCM - C. cephalonica (CC) reared male; CCFM
– C. cephalonica reared female; DCM – D. cingulatus (DC) reared male;
DCFM–D. cingulatus reared female; PSM – P. solenopsis (PS) reared
male; PSFM – P. solenopsis reared female).
0
10
20
30
40
50
60
CCM CCFM DCM DCFM PSM PSFM
Ad
ult
lo
ng
ev
ity
(d
ay
s)
Adult category

Figure 3. Adult weight of R. fuscipes reared on C. cephalonica, D. cinguatus and
P. solenopsis (CCM - C. cephalonica reared male; CCFM - C. cephalonica
reared female; DCM – D. cingulatus reared male; DCFM – D. cingulatus
reared female; PSM – P. solenopsis reared male; PSFM – P. solenopsis reared
female).
0
10
20
30
40
50
60
CCFM CCM DCFM PSFM PSM DCM
Adult category
Wei
gh
t (m
g)

Table 6. Oviposition periods (days ± SE), fecundity (eggs/female) and hatchability
(%) of R. fuscipes reared with C. cephalonica, D. cingulatus and
P. solenopsis
Life stages of
predator
Prey
C. cephalonica D. cingulatus P. solenopsis
Preoviposition
(days)
12.7±0.1abc
15.2±0.2bc
16.3±0.2bc
Oviposition (days) 20.4±0.2
ac 14.7±0.17
bc 10.6±0.2
abc
Post-oviposition
(days)
11.8±0.3abc
9.4±0.13abc
5.6±0.3abc
Fecundity
(no./female)
32.6±0.3ac
27.4±0.1bc
21.6±0.2bc
Hatchability (%) 97.7±1.5
ab 97.6±1.4
ab 94.4±2.8
bc
Oviposition index 0.082
0.068 0.053
Minimum number
of eggs/batch/female
4.3±1.2ab
3.8±1.8abc
3.96±1.3bc
Maximum number
of eggs/batch/female
33.6±1.2ab
28.3±1.68ab
22.4±1.3bc
Mean followed by the same letter do not differ significantly by TMRT at 5% level.
Comparison was made among C. cephalonica, D. cingulatus and P. solenopsis.

17
ratio was observed in all the three tested preys [1:0.43, 1:0.37 and 1:0.37 (Female: Male)
for C. cephalonica, D. cingulatus and P. solenopsis respectively].
1.4.6. Fecundity and hatchability
The duration of the preoviposition period got reduced (F=0.696, df=5, 26, P=0.638),
whereas both oviposition (F=8.342, df=7, 24, P=0.004) and post-oviposition (F=2.688,
df=4, 27, P=0.221) periods were extended when C. cephalonica was provided to immature
stages and adults of R. fuscipes. Longer pre-oviposition (F=4.000, df=7, 24, P=0.092) and
shorter oviposition (F=0.602, df=7, 24, P=0.647) periods were observed in P. solenopsis
fed predators. The oviposition index was higher in C. cephalonica reared predator than in
D. cingulatus and also in P. solenopsis offered predators. The predator laid eggs as single
as well as in batches, having a maximum of 34 and minimum of 4 eggs. Significantly
higher fecundity was observed in D. cingulatus (F=2.643, df=7, 31, P=0.036) than in
P. solenopsis (F=1.396, df=6, 10, P=0.244) fed group. These differences translated into a
significantly lower fitness index for P. solenopsis (r= 0.028), D. cingulatus (r= 0.031) and
C. cephalonica (r = 0.037). The hatchability of predators varied with pests. Significant
higher percent hatchability was recorded in C. cephalonica fed predator (F=0.845, df=7, 38,
P=0.238) rather than in D. cingulatus (F=3.144, df=7, 31, P=0.043) and also in
P. solenopsis (F=1.434, df=7, 9, P=0.134) fed groups (Table 6).
1.4.7. Life table
The prepared life table showed that the gross reproductive rate (GRR) was higher
in all the categories than the net reproductive rate (Ro). Corcyra cephalonica fed predator
showed maximum GRR (94.32) and Ro (72.03). The mean length of generation (Tc) was
higher in P. solenopsis (57 days) category than in D. cingulatus (55 days) and also in
C. cephalonica (53 days) fed groups. Higher innate capacity was recorded in
C. cephalonica (0.080) fed category followed by D. cingulatus (0.074). Finite rate of

18
increase was higher in C. cephalonica fed predator (1.08) than D. cingulatus (1.075) and
P. solenopsis (1.07). Shorter weekly multiplication was observed in P. solenopsis category
(1.56) followed by D. cingulatus (1.66). Shorter doubling time was observed in
C. cephalonica fed predator (8.25) and longer in P. solenopsis (10.83). Maximum
hypothetical female in F2 generation was in C. cephalonica fed predator rather than
D. cingulatus (3360.52) and P. solenopsis (1120.9) fed predators. In general, all the life
table parameters were in favour of the C. cephalonica fed R. fuscipes (Table 7).
1.4.8. Macro molecular profile of cotton pests
Among the three pests analysed, the larvae of C. cephalonica contain more amount
of total body protein (14.7/100 mg) followed by nymphs of D. cingulatus (11.5 mg/100
mg) and P. solenopsis (4.50 mg/100 mg) adult (Fig. 4). The total body carbohydrates
content was higher in the larvae of C. cephalonica (22.8 mg/100 mg) followed by nymphs
of D. cingulatus (13.6 mg/100 mg) and adults of P. solenopsis (10.8 mg/100 mg). The lipid
content was higher amount in nymphs of D. cingulatus (16.6 mg/100 mg).
1.4.9. Stage preference
Binomial distribution value was calculated for the preference of R. fuscipes on
cotton pests. The third (0.9989), fourth (0.9999) nymphal instars of R. fuscipes preferred
third nymphal instar of D. cingulatus. Fifth nymphal instars R. fuscipes preferred (0.9989)
fourth nymphal instar of D. cingulatus and adult R. fuscipes preferred (0.9989) fifth
nymphal instar of D. cingulatus (Fig. 5a). However, invariably all the tested life stages of
reduviid preferred P. solenopsis adults (0.9999, 1.0, 1.0 and 0.9989 for third, fourth, fifth
instars and adult respectively) (Fig. 5b).
1.4.10. Host preference
When the predator were released in to the Petri dish, R. fuscipes showed more
positive response to D. cingulatus (P<0.05) by Chi-square as compared to that of

Table 7. Mean life table parameters of Rhynocoris fuscipes reared on caterpillars of
C. cephalonica (fourth and fifth instar), nymphs of D. cingulatus (third,
fourth and fifth instars) and P. solenopsis (third instar and adult)
continuously for three generations.
Life table parameter
Host insect
C. cephalonica D. cingulatus P. solenopsis
Gross reproductive rate (GRR) 94.32 85.24 67.02
Net reproductive rate (NRR) Ro 72.03 57.97 33.48
Length of generation (Tc) 53 55 57
Innate capacity for increase (rc) 0.080 0.074 0.063
Corrected (rm) 0.084 0.073 0.064
Finite rate of increase (λ) 1.08 1.075 1.07
Weekly multiplication 1.71 1.66 1.56
Doubling time (in days) 8.25 9.49 10.83
Hypothetical female in F2
generation 5188.32 3360.52 1120.9

Figure 4. Biochemical analysis of total body protein, lipid and carbohydrate
(mg/100mg) in C. cephalonica (CC), D. cingulatus (DC) and P. solenopsis
(PS).
0
5
10
15
20
25
30
CC DC PS
mg
/10
0m
g
Preys
Protein Lipid Carbohydrate

A
B
Figure 5. Prey stage preference (%) of R. fuscipes life stages against first, second,
third, fourth and fifth nymphal instars and adults (both male and
female) life stages of D. cingulatus (A) and P. solenopsis (B).
0
5
10
15
20
25
30
35
40
45
50
Third Fourth Fifth Adult
Predator life stages
Pre
fere
nce (
in%
)
I II III IV V adult
0
10
20
30
40
50
60
70
80
90
100
Third Fourth Fifth Adult
Predator life stages
Pre
fere
nce (
in%
)
I II III adult
19
P. solenopsis (P<0.05). The adult R. fuscipes showed higher preference against
D. cingulatus (c2=0.05) than third instar (c
2=0.400), fourth instar (c
2=1.60) and fifth instar
(c2=0.400). The adult predator showed more positive choice (r=0.9999) on D. cingulatus
than other nymphal instars. Invariably all the life stages of the predator showed equal
choice (c2=6.40) against P. solenopsis (r=0.9318) (Table 8).
1.4.11. Functional response
It is a typical density dependant function of the tested predators responding to the
increasing prey density by killing more number of prey than they killed at lower prey
densities ie, its predatory rate increased with increasing of preys density (Fig. 6). The
functional responses of third, fourth, fifth and adult of R. fuscipes were recorded, and the
results revealed that the attack ratio (E) decreased with increase of D. cingulatus (Table 9)
and P. solenopsis densities (Table 10). The predators exhibited Holling’s Disc equation
type II functional curve. The maximum and minimum attack ratio was observed in prey 1
and 10 prey/predator respectively (F=4.324, df=2, 7, P=0.039 and F=6.546, df=1, 8,
P=0.046 for fifth instar nymphs and adult predator respectively). Similar trends were
observed for D. cingulatus (F=4.258, df=3, 6, P=0.046 and F=7.526, df=1, 8, P=0.054 for
fourth instar nymphs and adult predator respectively). The attack ratio ‘E’ and the
predicted attack ratio (Y1/No) were positively correlated for the third, fourth, fifth and
adult stages of the predator (r= 0.99) and two types of the preys encountered (r= 0.99).
The rate of discover ‘a’ values were decreased while the prey density increased
both for P. solenopsis (F=5.160, df=2, 7, P=0.042; F=6.241, df=2, 7, P=0.043; F=5.580,
df=2, 7, P=0.027 and F=4.359, df=2, 7, P=0.038 for third, fourth, fifth instars and adult
predator, respectively) and D. cingulatus (F=6.562, df=4, 5, P=0.055 and F=5.364, df=4,
5, P=0.015 for fourth instar nymphs and adult predator respectively) (Table 9). The
correlation data was observed between preys offered and prey consumption, and it was

Table 8. Host preference (%) of R. fuscipes third, fourth and fifth nymphal instars
and adults (male and female) stages against D. cingulatus and P. solenopsis
Parameter Predator life stages
III IV V Adult
D. cingulatus
Positive choice 8 6 8 10
Negative choice 12 14 12 10
c2 0.400 1.60 0.400 0.00
Significance P<0.05 P<0.05 P<0.05 P<0.05
Preference (%) 40 30 40 50
Binomial
distribution value 0.9999 0.9989 0.9999 0.9999
P. solenopsis
Positive choice 2 2 2 2
Negative choice 18 18 18 18
c2 6.40 6.40 6.40 6.40
Significance P<0.05 P<0.05 P<0.05 P<0.05
Preference (%) 10 10 10 10
Binomial
distribution value 0.9138 0.9138 0.9138 0.9138

Figure 6. Rhynocoris fuscipes third, fourth, fifth nymphal instars and adult functional
response curve when provided with D. cingulatus (A) and P. solenopsis (B).
0
0.5
1
1.5
2
2.5
3
3.5
4
4.5
5
0 2 4 6 8 10 12
A
0
1
2
3
4
5
6
7
0 5 10 15 20
B

20
highly significant in both the pests. For instance third instar (0.915, P=0.029), fourth instar
(0.994, P=0.001), fifth instar (0.981, 0.003) and adult (0.987, 0.002) predator against
D. cingulatus and third instar (0.929, P=0.023), fourth instar (0.921, P=0.026), fifth instar
(0.935, 0.020) and also adult (0.940, 0.018) predators against P. solenopsis.
The third, fourth and fifth nymphal instars and adult of R. fuscipes on D. cingulatus
showed maximum Na values (3.33, 3.96, 4.23 and 4.41) at 10 prey densities respectively
(y=1.24+0.22x, r=0.921; y=0.89+0.32x; r=0.99; y=0.96+0.34x; r=0.98; y=0.92+0.36x;
r=0.98). The same result was also observed in P. solenopsis at the prey densities of 1, 2, 4,
8 and 16 for preys per predator recorded high biocontrol potential (y=1.30+0.28x; r=0.93;
y=1.22+0.23x; r=0.92; y=0.99+0.26x; r=0.93 and y=1.40+0.31x; r=0.94 for third, fourth,
fifth and adults stages of the predator respectively) (Fig. 7). Maximum number of preys
eaten (Ne) was higher for adult predator at 24 hrs when D. cingulatus and P. solenopsis
were offered as a prey. Prey attacking efficiency (PAE) was high in the prey density of
1(100) for both pests, and it decreased when the prey density was increased (Table 9, 10,
11). Lower PAE was observed in third instar of R. fuscipes for D. cingulatus (330) and
fourth instar of R. fuscipes for P. solenopsis (280).
1.5. DISCUSSION
The biology of the predators were affected by a variety of external and internal
factors and among them, nutrition seems to be the most crucial single factor affecting the
development and reproduction in many ways in reduviid predators (Ambrose et al., 1990;
Sahayaraj, 1993; Claver, 1998).
1.5.1. Development
For a prey species to be suitable, it must provide all nutritionally important factors,
such as proteins, carbohydrates, lipids, vitamins and minerals in balanced proportion and
concentration to meet a predator’s metabolic requirements (House, 1977; Cohen and Tang,

Ta
ble
9.
Fu
nct
ion
al
resp
on
se p
ara
met
ers
(No
. o
f p
rey
ea
ten
, a
tta
ck r
ati
o,
ha
nd
lin
g t
ime,
ra
te o
f d
isco
ver
) o
f th
ird
, fo
urt
h a
nd
fif
th
ny
mp
ha
l in
sta
rs a
nd
ad
ult
s of
the
R.
fusc
ipes
ex
po
sed
to
dif
fere
nt
den
siti
es (
1,
2,
4,
8,
10 p
rey
s/p
red
ato
r) o
f D
. ci
ng
ula
tus
for
24
hrs
in
Pet
ri d
ish
.
Pre
dato
r li
fe
stage
Pre
y
den
siti
es
(No)
No. of
pre
y
eate
n
(Ne)
Att
ack
rati
o
(E)
Han
dli
ng
tim
e (T
h)
Days
searc
hin
g
(Ts)
Pre
dic
ted
Ne (
Y’)
Pre
dic
ted
att
ack
ra
tio
Han
dli
ng
tim
e/P
rey
(b)
Rate
of
Dis
cover
(a)
Slo
pe
(r2)
III
1
1.0
1.0
0
0.1
6
0.8
4
0.9
9
0.9
9
0.0
4
1.1
9
0.8
37
2
1.8
0.9
2
0.0
8
0.9
2
1.8
4
0.9
2
1.0
0
4
2.7
0.6
6
0.1
7
0.8
3
2.6
6
0.6
7
0.8
0
8
3.0
0.3
8
0.1
6
0.8
4
3.0
2
0.3
8
0.4
5
10
3.3
0.3
3
0.1
2
0.8
8
3.3
4
0.3
3
0.3
8
IV
1
1.0
1.0
0
0.1
5
0.8
5
1.0
0
1.0
0.0
4
1.1
8
0.9
88
2
1.6
0.8
2
0.2
5
0.7
5
1.6
5
0.8
3
1.1
0
4
2.3
0.5
7
0.1
3
0.8
7
2.3
0.5
8
0.6
6
8
3.4
0.4
3
0.1
8
0.8
2
3.4
0.4
3
0.5
2
10
4.0
0.4
0
0.1
6
0.8
4
4.0
0.4
0.4
8
V
1
1.0
1.0
0
0.1
8
0.8
2
0.9
8
0.9
8
0.0
3
1.2
0
0.9
63
2
1.7
0.8
4
0.1
5
0.8
5
1.6
6
0.8
3
0.9
8
4
2.7
0.6
8
0.1
6
0.8
4
2.7
2
0.6
8
0.8
1
8
3.7
0.4
6
0.1
3
0.8
7
3.6
9
0.4
6
0.5
3
10
4.2
0.4
2
0.1
2
0.8
8
4.2
2
0.4
2
0.4
8
Ad
ult
1
1.0
1.0
0
0.2
4
0.7
6
0.9
9
0.9
9
0.0
3
1.3
0
0.9
73
2
1.7
0.8
7
0.1
8
0.8
2
1.7
4
0.8
7
1.0
6
4
2.7
0.6
7
0.2
0
0.8
0
2.6
9
0.6
7
0.8
4
8
3.8
0.4
8
0.1
6
0.8
4
3.8
3
0.4
8
0.5
7
10
4.4
0.4
4
0.1
4
0.8
6
4.3
9
0.4
4
0.5
1

Ta
ble
1
0.
Fu
nct
ion
al
resp
on
se p
ara
met
ers
(No
. o
f p
rey
ea
ten
, a
tta
ck r
ati
o,
ha
nd
lin
g t
ime,
ra
te o
f d
isco
ver
) o
f th
ird
, fo
urt
h a
nd
fif
th
ny
mp
ha
l in
sta
rs a
nd
ad
ult
s o
f th
e R
. fu
scip
es e
xp
ose
d t
o d
iffe
ren
t d
ensi
ties
(1
, 2
, 4
, 8
, 1
6 p
rey
s/p
red
ato
r) o
f P
. so
len
op
sis
for
24
hrs
in
Pet
ri d
ish
.
Sta
ge
of
pre
dato
r
Pre
y
den
siti
es
(No)
No. of
pre
y
eate
n
(Ne)
Att
ack
rati
o
(E)
Han
dli
ng
tim
e (T
h)
Days
searc
hin
g
(Ts)
Pre
dic
ted
Ne (
Y’)
Pre
dic
ted
att
ack
ra
tio
Han
dli
ng
tim
e/P
rey
(b)
Rate
of
dis
cover
(a)
Slo
pe
(r2)
III
1
1.0
1.0
0
0.0
5
0.9
5
1.0
5
1.0
5
0.0
3
1.1
0
0.8
48
2
1.6
0.8
0
0.1
0
0.9
0
1.6
0
0.8
0
0.8
9
4
2.8
0.7
0
0.1
2
0.8
8
2.7
8
0.6
9
0.7
9
8
4.6
0.5
8
0.1
7
0.8
3
4.6
5
0.5
8
0.7
0
16
5.3
0.3
3
0.1
4
0.8
6
5.2
3
0.3
2
0.3
8
IV
1
1.0
1.0
0
0.0
9
0.9
1
0.9
9
0.9
9
0.0
3
1.0
9
0.8
74
2
1.3
0.6
5
0.2
5
0.7
5
1.3
1
0.6
6
0.8
7
4
2.6
0.6
5
0.1
3
0.8
7
2.6
1
0.6
5
0.7
5
8
3.8
0.4
8
0.2
1
0.7
9
3.8
6
0.4
8
0.6
1
16
4.4
0.2
8
0.1
3
0.8
7
4.4
5
0.2
8
0.3
2
V
1
1.0
1.0
0
0.0
6
0.9
4
0.9
9
0.9
9
0.0
3
1.0
6
0.8
62
2
1.4
0.7
0
0.1
5
0.8
5
1.4
0
0.7
0
0.8
2
4
1.8
0.4
5
0.1
8
0.8
2
1.8
0
0.4
5
0.5
5
8
4.2
0.5
3
0.1
5
0.8
5
4.2
0
0.5
3
0.6
2
16
4.8
0.3
0
0.1
3
0.8
7
4.7
0
0.2
9
0.3
4
Ad
ult
1
1.0
1.0
0.1
7
0.8
3
0.9
9
0.9
9
0.0
3
1.2
0
0.8
82
2
1.8
0.9
0
0.1
8
0.8
2
1.8
0
0.9
0
1.1
0
4
3.2
0.8
0
0.2
6
0.7
4
3.2
0
0.8
0
1.0
8
8
4.7
0.5
8
0.3
2
0.6
8
4.6
0
0.6
0
0.8
5
16
5.8
0.3
6
0.1
8
0.8
2
5.1
0
0.3
2
0.3
9

Table 11. Proportion (%) of D. cingulatus and P. solenopsis attacked by R. fuscipes
third, fourth and fifth nymphal instars and adult (male and female) in
laboratory conditions.
Prey density
Predatory rate
Third instar Fourth instar Fifth instar Adult
D. cingulatus
1 100.0 100.0 100.0 100.0
2 90.0 80.0 85.0 85.0
4 67.5 57.5 67.5 67.5
8 37.5 42.5 46.3 47.5
10 33.0 40.0 42.0 44.0
P. solenopsis
1 100.0 100.0 100.0 100.0
2 80.0 65.0 70.0 90.0
4 70.0 65.0 52.5 80.0
8 57.5 47.5 45.0 58.7
16 33.13 27.5 30.0 36.2

Figure 7. Cumulative predatory rate of R. fuscipes against D. cingulatus (A) and
P. solenopsis (B) at different densities.
0
200
400
1
2
4
8
10
100
90
67.5
37.5
33
100
80
57.5
42.5
40
100
85
67.5
46.3
42
100
85
67.5
47.5
44
Pre
da
tory
ra
te
Adult Fifth Fourth Third
Prey density
0
100
200
300
400
12
48
16
100 80
70 57.5
33.13
100
65 65
47.5
27.5
100
70
52.5
45
30
100
90
80
58.7
36.2
Third Fourth Fifth Adult
Prey density
Pre
dato
ry r
ate
B
A

21
1997). For example, George (2000) and Sahayaraj et al. (2004) found that among several
species of lepidopteran prey for a reduviid, R. marginatus, S. litura and Helicoverpa
armigera were the most suitable preys tested for its development. From our study, we
observed that C. cephalonica has higher primary nutrients for development of reduviids
than D. cingulatus and P. solenopsis. Non-nutritional factors such as sequestered secondary
plant metabolites (Bruno et al., 2001), odor, texture and mobility of prey (Chandral and
Retna Latha Sinazer, 2011) also play a large role in prey selection. For example, nymphal
instars of R. marginatus are likely to have difficulty in feeding on prey having well
developed or strong mandibles (Ambrose et al., 1990), or hairs (Sahayaraj, 1999), or very
large and active preys (elusive behaviour) (Sahayaraj 1995a) and prey with impenetrable
integuments (Ambrose, 1999; Sahayaraj, 1999b) etc..
1.5.2. Survival of reduviids
The present results showed that all R. fuscipes nymphs and adults used larvae of
C. cephalonica as suitable prey, when compared with D. cingulatus and P. solenopsis. The
survival rate was in each stadium was also higher in C. cephalonica fed predators than
D. cingulatus and P. solenopsis fed predators. Same kind of results were observed by
George (2000) and Claver and Ambrose (2002). This was reflected that C. cephalonica
larvae, reduced predator total nymphal developmental period (4-7 days) and nymphal
mortality (10-30%), shorter pre-oviposition period (3-4 days), high fecundity (24-30%),
hatchability, and oviposition index. The most direct way in which nutrition can influence
the predator biology is on its nymphal developmental period and nymphal mortality
(Ambrose, 1999). The lepidopteron pests are the suitable preys for the growth of reduviid
predators (Claver and Ambrose, 2001a, b, George, 2000). In the present study the total
nymphal development was prolonged by P. solenopsis followed by D. cingulatus and
C. cephalonica. This indicates that the latter factitious host is the suitable prey for

22
reduviids. This, in a broad sense, agrees with the concept of Slansky (1982), who
establishes a correlation between prey preference and accelerated developmental rate in
predators. Previously, studies on Cydnocoris gilvus (Venkatesan et al., 1997), Acanthaspis
siva Fab. and R. fuscipes Fab. (George, 2000), R. marginatus Fab. (Sahayaraj et al., 2004,
2006a; Sahayaraj, 2007a, b; 2012) proved the above statement along with the results of
present study. All the reports mentioned confirm the higher nutritional contents of
lepidopteran larvae. The results of this study indicated that when fed on C. cephalonica, the
development of R. fuscipes into adult was a little faster than feeding on D. cingulatus and
P. solenopsis.
1.5.3. Sex ratio
Sex ratio is the key factor for the development of an insect population (Ambrose,
1999). Male based sex ratio was observed in the present study, but the increased number
of females gives the potential development of insect population, especially the predatory
insects. Sahayaraj and Selvaraj (2003) reported that the life table of R. fuscipes was in
accordance with sex ratio, They found that 2:1 (Male: Female) was the best fit for the
population dynamics of R. fuscipes.
1.5.4. Body weight and Reproduction
Furthermore, in most cases the adults gained more weight (51.4 mg) when
maintained on this prey. But the lower female weight was observed in P. solenopsis fed
insects (41.2 mg) than D. cingulatus (48.7 mg). The adult female body size is often
influenced by the nymphal nutrition, which in turn affects the fecundity of the insect
(Sahayaraj and Ambrose, 1994; Sadeghi and Gilbert, 1999; George, 2000; Sahayaraj,
2003; Claver and Ambrose, 2003a; Sahayaraj and Balasubramanian, 2009). Stewart et al.
(1991) reported the diet relationship between female body size and fecundity.
23
The results of Phoofolo and Obrycki (1997), confirm the fact that female body size
may be a good indicator of potential fecundity. This generalization is supported by the
results of the present study, wherein the fecundity was higher in R. fuscipes reared on
C. cephalonica, which were heavier as compared to the smaller R. fuscipes females reared
on P. solenopsis (41.2 mg) and D. cingulatus (48.7 mg). The nature of the prey species
consumed by the predator has a major impact on the fecundity of the predators as stated by
Enkegaard et al. (1997), Hansen et al. (1999), Sahayaraj and Selvaraj (2003), Sahayaraj et
al. 2004). Our results have a resemblance with the observations of previously mentioned
studies. Higher fecundity was observed in weighty females. Thus the higher fecundity of
R. fuscipes females reared on C. cephalonica may be due to the higher primary nutrients in
the latter.
Also higher fecundity and higher adult longevity were observed in C. cephalonica
provided R. fuscipes than D. cingulatus and P. solenopsis. These differences translated into
a significantly lower fitness index (r= 0.028) for D. cingulatus (r= 0.031) and for
C. cephalonica (r = 0.037). This also seems to be a reflection of the superior nutritional
quality of the larvae. This conclusion concurs with that of Sahayaraj et al. (2006b, 2012),
who observed high fecundity and higher adult longevity in reduviid predator when reared
on lepidopteran larvae. The fact that in the present study larvae of C. cephalonica as prey
for R. fuscipes were found to favor for faster development, longer survival, high fecundity,
higher net reproductive rate and shorter population doubling time than D. cingulatus and
P. solenopsis offered predator. This result might make the C. cephalonica larvae an ideal
candidate for the laboratory rearing of R. fuscipes for use in biological control programs.
The hatchability of the reduviids eggs were not differentially varied according to the prey
offered (Sahayaraj and Paulraj, 2001). Percent hatchability was similar in three categories.

24
1.5.5. Adult longevity
The longevity of females fed at different prey densities as nymphs and adults did
vary. The longest nymphal time observed among the individuals fed with P. solenopsis
might be due to the feeding stress developed by the size of the prey. Due to its smaller size
and its waxy coating on the surfaces the predator was compelled to capture a higher number
of prey to satiate itself which in turn developed a feeding stress. Similar type of result was
reported by Ambrose and Livingston (1986), Ambrose and Claver (1999), Cohen and Tang
(1997). The present study indicates that C. cephalonica is the most suitable prey for rearing
predator. Because all R. fuscipes nymphs and adults used C. cephalonica and D. cingulatus
larvae as efficient prey, indicating that they provide all necessary nutrients in adequate
concentration and proportion and have a penetrable integument, texture and
C. cephalonica odor does not present a barrier against larval feeding (George, 2000). The
prey type couldn’t affect the hatchability of R. fuscipes eggs. Higher percent hatchability
was observed in C. cephalonica and D. cingulatus fed category and a slightly decreased
hatchability in P. solenopsis reared predator. The same result observed by Sahayaraj et al.
(2012) revealed that the reduviid predator, R. longefrons make characteristic growth and
development on C. cephalonica larvae, and show maximum fecundity and hatchability.
The life table result of R. fuscipes varied with P. solenopsis and D. cingulatus
compared to C. cephalonica. The net reproductive rate was higher for C. cephalonica
reared R. fuscipes as compared to P. solenopsis and D. cingulatus fed R. fuscipes. This is in
accordance with the results of George et al. (2000), who have attributed such finding to the
sharp decline in the survivorship value of parent females. However, the net reproductive
rate, innate capacity for increase, intrinsic rate of increase and weekly multiplication
declined in the case of Cydnacoris gilvus (Venkatesan et al., 1997), R. kumarii (Claver,
1998), Cotesia glomeratus (Linn.) (Singh et al., 2002), R. marginatus (Sahayaraj et al.,

25
2004) and R. fuscipes (George et al., 2000; Shayaraj et al., 2006a). The values of the
intrinsic rate of increase (r), the finite rate of increase (λ) and the population doubling time
(DT), which reflect the overall effect of prey type on immature development, survival and
fecundity were greater for individuals of R. fuscipes fed on larvae of C. cephalonica.
Higher values for these parameters were due to faster immature development time, lower
immature mortality, higher daily rate of progeny production (24/female) and an earlier peak
in oviposition (12 days). Results obtained in this study can be useful for further study of
population dynamics and the development of management tactics for control of aphid and
mealy bug pests, as controlled laboratory studies provide insights into the development and
population dynamics of insects.
1.5.6. Bioefficay
The present finding shows that the size of the R. fuscipes nymphal instar affects
prey selection. For instance, third instar reduviid did not accept adults D. cingulatus; this
tendency diminished and was lost as predators increased in age. It has also been reported
that mean prey preference increases with body size of the predator (Cisneros and
Rosenheim, 1997). The result revealed that the particular stage of the predator preferred the
desired stage of the pests. Moreover, younger reduviid preferred younger prey and vice
versa. Stage preference exhibited by the life stages of R. fuscipes could be attributed to the
dynamics of prey – predator interaction which is governed by the size of both predator and
prey. Our results were similar to the studies carried out with different reduviids predators
on cotton stainer, D. cingulatus such as Rhynocoris marginatus (Ambrose and
Kumaraswami, 1990), Allaeocranum quadrisignatum (Ambrose and Sahayaraj, 1993),
Ectomocoris tibialis (Sahayaraj, 1995a; 1997). Reduviids are non-specific predators, but
some species are known to exhibit preferences for particular prey when they are
simultaneously offered a number of different species. Changes in prey preference

26
associated with the age of the predator have been well documented among invertebrates,
including reduviid (Ambrose, 1999, Sahayaraj, 2007a). The biological control potential of
R. fuscipes was previously studied against Heliothis armigera (Hub.) (Lepidoptera:
Noctuidae) (Rao, 1974), Nagarkatti (1982); Corcyra cephalonica (Stain.) (Lepidoptera:
Pyralidae), Chilo partellus (Swinh.), Achaea janata L. (Lepidoptera: Noctuidae), Plutella
xylostella F. (Lepidoptera: Plutellidae), Spodoptera litura F. (Lepidoptera: Noctuidae),
Myzus persicae S. (Hemiptera: Aphididae) (Rao et al., 1981); Dicladispa armigera (Oliver)
( Lepidoptera: Pterophoridae ) (Singh, 1985) ; Epilachna 12-stigma Muls. (Coleoptera:
Coccinellidae), E. vigintioctopunctata Fab. (Coleoptera: Coccinellidae) (Nayar et al.,
1976); Raphidopalpa foveicollis Lucas (Coleoptera: Chrysomelidae), Semiothisa
pervolagata Walker, Diacrisia oblique Walk. (Lepidoptera: Arctidae) (Singh, 1985); Terias
hecab L., Coptosilla pyranthe (Linn.) (Lepidoptera: Pieridae) (Hiremath and Thontadarya,
1983); Calocoris angustatus Leth. (Hemiptera: Miridae), Cyrtacanthacris succincta Kirby
(Orthoptera: Acrididae), Dysdercus cingulatus Dist. (Hemiptera: Pyrrhocoridae), Earias
vittella F. (Lepidoptera: Noctuidae) (Ambrose, 1988); E. insulana Bios. (Lepidoptera:
Noctuidae) (Ambrose, 1999). Rhynocoris fuscipes is the most abundant reduviid predator in
cotton ecosystems (Hafeez et al., 2006; Sahayaraj, 2007; Nurindah, 2008; Kalidas and
Sahayaraj, 2012) and reported to feed on 44 insect pests of economical importance
(Ambrose and Claver, 1999; Sahayaraj, 2007a). The biology of this predator was carried
out by George (2000) on C. cephalonica and the life table was constructed by Sahayaraj
and Selvaraj (2003). The bioefficacy of this reduviid was evident under laboratory
(Ambrose and Livingstone 1986; Ambrose and Livingstone, 1993; Ambrose and Claver,
1995, 1997, Claver and Ambrose 2002, Sahayaraj et al., 2002; Ambrose and Nagarajan,
2010; Nagarajan and Ambrose, 2010) and field conditions (Anand et al., 2012), Diaphania
indicus (Nagarajan and Ambrose, 2012) and Eutectona machaeralis (Ambrose et al., 2010).

27
The results of previous studies revealed that the R. fuscipes has high biocontrol potentiality
against wide ranges of insect pest. Similarly, in the present study a new emerging pest
P. solenopsis is also suppressed by the predator. The results obtained from the present
study showed that the reduviid predator, R. fuscipes has high ability to control the cotton
sucking pests such as D. cingulatus and P. solenopsis.
In this study, R. fuscipes presented a Type II functional response (Holling, 1959),
similar to several reports on the functional response in Rhynocoris marginatus (Ambrose
and Kumaraswami 1990, 1993), Allaeocranum quadrisignatum (Ambrose and Sahayaraj,
1993), Ectomocoris tibialis (Sahayaraj, 1995a, 1997), Coranus nodulus (Sahayaraj, 1993),
Neohamatorhhophus therasii (Sahayaraj, 1996), Antilochus coqueberti (Kohno et al.,
2004) and R. fuscipes (Ambrose and Nagarajan, 2010). The proportion of red cotton bug
and cotton mealy bug preyed by the reduviid life stages increased at a decreasing rate in
case of D. cingulatus and P. solenopsis densities, and the proportion of preys fed was not
constant (Table 9 and 10). The Type II functional response was more evident at 24 hrs
(Fig. 6), possibly because they are voracious feeders, a plateau or predator satiation was not
reached at 24 hr with 10 and 16 red cotton bug and cotton mealy bug density respectively.
The present study showed that the type of functional response shown and the
magnitude of predation by R. fuscipes against D. cingulatus and P. solenopsis could be
adversely affected by ageing. The maximum prey consumption was observed in adult
reduviids rather than nymphal instars evaluated. Rhynocoris fuscipes exhibited Type II
responses at various ages tested, and the magnitudes of functional response in adults were
significantly greater than nymphal life stages, because the adult predator consumed higher
number of preys in each prey density, so the predatory rate was higher in adult R. fuscipes.
This could be attributed to the fact that reproductive preparation started at adult stage and
their ability to respond to increasing prey density indicated that physiological senescence in

28
adults was faster than in nymphs (Ambrose, 1999; Rocha and Redaelli, 2004; Sahayaraj,
2007a). Accelerating functional response, which are more typical of generalist than
specialist predator, can result in density dependent predation (Murdoch and Qaten, 1975).
The statement was directly related to the results obtained from the present study. The
predatory rate of R. fuscipes on cotton pests was directly proportional to the density of
D. cingulatus and P. solenopsis. The predation increased, when the prey density increased.
The handling time is a feature of predatory behavior, and influences the functional
response by decreasing the search-and-attack rates as prey density increases (Nordlund and
Morrison, 1990). The handling time of R. fuscipes against both prey species decreased over
time and the attack coefficient increased at 24 hrs (Table 9 and 10). It is important to
observe the handling time of the predator up on a prey, because it gives the time taken to
paralyze or kill and utilize of the prey. Nordlund and Morrison (1990) observed that the
handling time affect the type of functional response: the shorter it is, the faster the curve
reaches the asymptote. Our results are in agreement with the observations of Ambrose and
Claver (1997). They observed the efficacy of R. fuscipes against S. litura and reported that
handling time decreased while prey density increased. Besides, handling time can influence
other components such as attack ratio and search efficiency (Beddington, 1975).
Another important component of functional response is the attack ratio. The
maximum attack ratio was observed in prey density 1 and minimum at the higher density
might be due to lesser time required to find each prey and more time spent in non-searching
activities at higher densities (Ambrose et al., 1990; Claver and Ambrose, 2002). The results
obtained from the present study is similar to the observations of Nagarajan and Ambrose
(2010). They recorded the functional response of R. fuscipes against Diaphania indicus
(Saun.) and Eutectona machaeralis (Walker). The reduviid showed maximum prey

29
consumption at higher density. These results might be due to the predators taking time to
acclimate to the new experimental arena.
Rhynocoris fuscipes consumed more number of P. solenopsis (k) than
D. cingulatus, although the calculated handling time was almost the same (b= 0.03).
However, laboratory measure of the functional response provides a biased perspective on
the effectiveness of predators in the field because, in laboratory trials, the prey density is
artificially high with low search requirements and an absence of alternative prey (O’Neil,
1997). Field trials of functional response are necessary to understand the predatory level of
R. fuscipes and its effectiveness as a biological control agent.
1.6. CONCLUSION
Corcyra cephalonica larvae can be used for the laboratory rearing of R. fuscipes in a
small scale. The results confirmed that P. solenopsis is a lower quality feed than
D. cingulatus and C. cephalonica. The nymphs fed with the former prey took significantly
longer period to develop into adults (50 days), body weight was less (40.4 mg) and laid
minimum eggs (22 eggs/female). These differences translated into a significantly lower
fitness index (r= 0.028) for D. cingulatus (r= 0.031) and for C. cephalonica (r = 0.037). In
general, R. fuscipes fed on P. solenopsis had extended developmental time but with low
reproductive performance. The life stages of R. fuscipes preferred different stages of the
pests tested. The results also suggest that both fifth instar and adult predators were more
successful in encountering the large sized D. cingulatus and P. solenopsis. In the order of
the stage of the predator, they invariably preferred D. cingulatus than P. solenopsis. The
feeding efficacy of the predators was increased while the prey density increased. This
exhibits a typical type II model holling’s disc equation. The feeding efficacy was positively
correlated with prey density but the attack ratio was higher in low prey densities. This
experiment clearly revealed that different stages of the predator can be utilized in pest

30
management program. The laboratory results presented in this study suggest that
R. fuscipes could be considered as a prospective candidate for use as a commercial
biological control agent for cotton mealy bug and red cotton bug in India.


![An intra-specific consensus genetic map of pigeonpea [Cajanus … · 2017-08-25 · ORIGINAL PAPER An intra-specific consensus genetic map of pigeonpea [Cajanus cajan (L.) Millspaugh]](https://cdn.vdocument.in/doc/165x107/5f72f42408f2804e715f64dc/an-intra-speciic-consensus-genetic-map-of-pigeonpea-cajanus-2017-08-25-original.jpg)
