
© OOO Siemens in Russia Sector Energy
Making Russia Energy Efficient -Energy Efficient Cities and Towns
Pilote Yekatarinburg: A Cooperation of the Russian Government and Siemens under participation of German and Russian industry, supported by DENA and the German Government
Making Russia Energy Efficient -Energy Efficient Cities and Towns
June 15, 2010
Hans-Juergen WioVice-President of OOO Siemens in RussiaCEO Siemens Energy in Russia and Central Asia

15th June 2010 © Siemens Russia 2010Slide 2
Energy Efficiency in Russian Federation:One of the most discussed topics
«By 2010 Russia should become 40% more energy efficient»
July 2008Д.А. Медведев
Президент Российской Федерации
Yes - we can fulfill President’s expectationsYes - we can fulfill President’s expectations

15th June 2010 © Siemens Russia 2010Slide 3
Making Russia Energy Efficient -Energy Efficient Cities and Towns
1. The Challenge - Sustainable Urban Infrastructure
2. Energy Efficiency Studies
3. Siemens Solutions for Cities
4. Pre-requisites for success in Russia
15th June 2010 © Siemens Russia 2010Slide 4
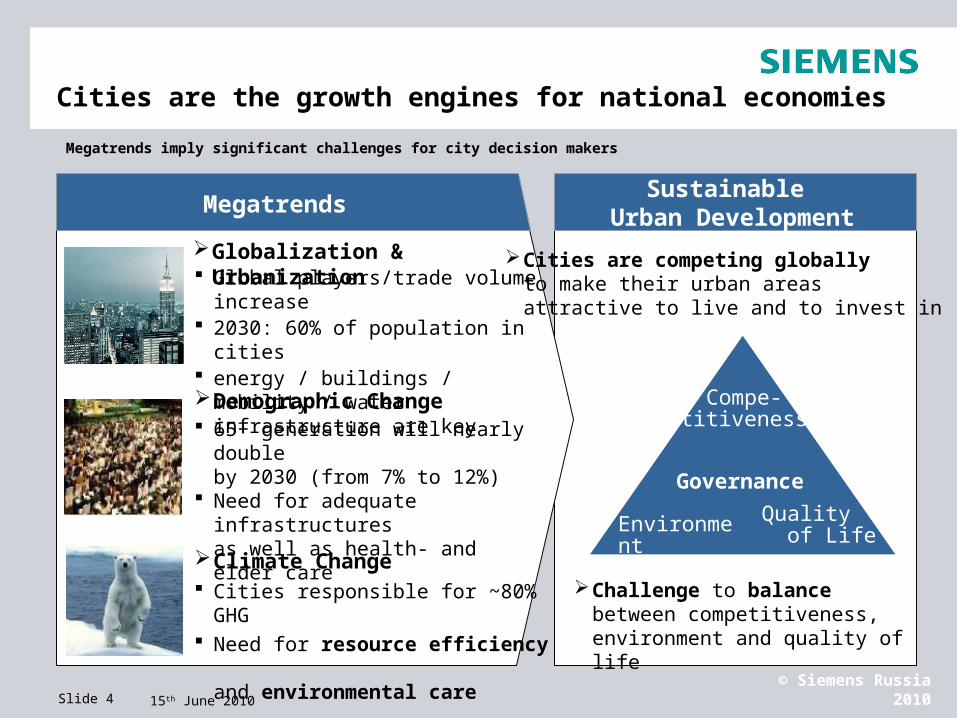
Cities are the growth engines for national economies
Compe-titiveness
Environment
Quality of Life
Governance
Challenge to balance between competitiveness, environment and quality of life
Sustainable Urban DevelopmentMegatrends
Globalization & Urbanization Global players/trade volume increase 2030: 60% of population in cities energy / buildings / mobility / water
infrastructure are key
Demographic Change 65+ generation will nearly double
by 2030 (from 7% to 12%) Need for adequate infrastructures
as well as health- and elder care
Climate Change Cities responsible for ~80% GHG Need for resource efficiency
and environmental care
Cities are competing globallyto make their urban areas attractive to live and to invest in
Megatrends imply significant challenges for city decision makers

15th June 2010 © Siemens Russia 2010Slide 5
Making Russia Energy Efficient -Energy Efficient Cities and Towns
2. Energy Efficiency Studies
3. Siemens Solutions for Cities
1. The Challenge - Sustainable Urban Infrastructure
4. Pre-requisites for success in Russia

15th June 2010 © Siemens Russia 2010Slide 6
Implementa-tion studies
in major cities
Green CityIndex
City sustainability
trends & challenges
Siemens insights into “how to become energy efficient”, jointly developed with major world cities
Megacity Challenges Study
Comprehensive analysis based on interviews with over 500 city managers in 25 selected megacities
Urban infrastructure trends and challenges as well as global best practices
Green City Index
Index compares cities across 8 dimensions of sustainability: CO2, Energy, Buildings, Transport, Waste & Land Use, Water, Air, Governance
Started in Europe, rollout in other regions started
Sustainable urban infrastructure studies / projects
Studies on “how to become a sustainable city” with focus on resource efficiency
Examples: London, Munich, Yekaterinburg Shanghai, Dublin, Trondheim, ...

15th June 2010 © Siemens Russia 2010Slide 7
London’s own measures combined with effective policies and supervision trigger the changes
48%
3%
21%
28%
Examples: Public buildings Hybrid buses Traffic management
City
Individuals
Examples: Buildings insulation Low-emission cars Efficient household
appliances
National level
Businesses
Examples: Biofuels Central electricity
supply (grid mix)
Examples: Lighting in commercial
buildings Cooling displays Decentral energy (CHP)
Siemens Sustainability Study – Example London

15th June 2010 © Siemens Russia 2010Slide 8
Full impact only if private sector incentivized to take initiative
Findings Conclusion
4.5
2.7
1.4
1.3
0.7
1.2
0.5
0.3
0.2
0.9
3.7
2.1
Levers
Abatement potential Mt CO2
Average abatement cost EUR/t CO2
Additional invest-ment bn EUR
Transport
Buildings
Energy
Insulation
Heating efficiency
Lighting
Appliances
Other
Higher car efficiency
Biofuels
Hybrid passenger cars
Hybrid bus
Other
Energy mix
CHP -90
40
230
140
460
-30
-150
-120
-190
-320
1,700
-240
10.4
1.0
0.9
0.8
7.3
2.4
–
5.3
0.5
4.3
1.1
4.0
! Two-third of all CO2-
abating technologies pay back their investment
Around 75% of the abatement potential lies in the hands of individuals/ businesses who make technological choices
The total investment required constitutes less than 1% of London’s total economic output until 2025

15th June 2010 © Siemens Russia 2010Slide 9
A different look on the results offers a perfect “implementation road map”
Source: McKinsey & Company
Abatement cost – buildings sectorEUR/t CO2 – decision maker perspective
Cumulative abatement potential Mt CO2
0
100
200
300
400
500
-100
-200
Lighting
Office appliances
Hot water insulation
Display cabinets
Drives
Cavity wall insulation
Public lighting
Electric appliances
Condensing boilers
Loft insulation
Air conditioning
Optimisation of buildings controls
Cooking
Heat recovery
Improved heating controls
Solid wall insulation
Insulation schools
Lighting
Floor insulation
Insulation office
Draught proofing
Windows
Large cooling
Cooling with renewables
More efficient new builds
Small cooling
2 4 6 8 10
Residential
Public and Commercial
€>0
€<0

15th June 2010 © Siemens Russia 2010Slide 10
Russia develops international partnerships in sphere of energy efficiency
02.10.2008 – St. PetersburgRussian/German agreement on cooperation in sphere if energy efficiency between Merkel/ Medwjedew
16.07.1009 – MunichCeremonial signature of RUDEA cooperation
Energy Dialogue Russia – European Union
IPEEC - International Partnership for Energy Efficiency Cooperation
►►Focus Target:
Significant decrease of power resources consumption in Russia

15th June 2010 © Siemens Russia 2010Slide 11
“Energy Efficient City Ekaterinburg” – Russian/German pilot project with Siemens leadership
Energy efficiency potential 2020 in TWh/a
1) Derived from difference to most common used / best technology from reference database 2) Combined Cycle Power Plant Source: Team Ekaterinburg
16
62
44
3478
Baseline primary
energy 2020
Efficiency potential– Most
common 1)
2020 atMost common
Efficiency potential– Best 1)
2020 atBest
Most common Basic wall insulation 2-plane windows Efficient drives Optimization of district
heating boilers …
62(-79%)
34(-44%)
Best Super insulation 3-plane windows Frequency converters Combined Cycle Smart Grid …
Adoption of "common" technology can save 44% of primary energy by 2020

15th June 2010 © Siemens Russia 2010Slide 12
“Energy Efficient City Ekaterinburg” – Russian/German pilot study to be presented in St. Petersburg
Strong commitment and support from Government Sverdlovskaja Oblast

15th June 2010 © Siemens Russia 2010Slide 13
12 Key levers
1) Shown impact is after Wall Insulation and Triple-glazed windows are implementedSource: Team Ekaterinburg
Effic. potentialin TWh/a ofprimary energy
CAPEX in mil. EUR
Avg. savingsp.a. 2010–2020cityin mil. EUR
Payback city & gas providerwith capital costs, years
Expertiseprovided by
2) Suggested to implement before levers related to automation of buildings
Payback city & gas providerw/o capital costs, years
Implementation would pay back in ~6 years
Key levers
Process improvement., e.g. steel
Frequency converters
Traffic management system
Cogeneration (CHP)
Insulation of district heating pipes
5.7
0.5
0.4
0.5
0.2
0.4
0.5
0.5
1.2
3.5
3.8
17.2 TWh primary =>22% points of potential
Triple-glazed windows
Heat recovery ventilation (HRV)
Heating controls 1)
Wall insulation 2)
Water saving devices
Building automation (e.g. HVAC)
41
2,400
16
57
9
427
11
35
98
21
483
tbd
~3,600
Energy-saving lamps
tbd
0.6
3.3
0.4
21
0.3
2.9
2.3
1.9
31
tbd
2.2
1.8
125
115
40
18
14
6
15
34
12
223
tbd
14
5.8 11.0
3.8
2.9
2.2
–
0.6
4.5
0.4
–
0.3
tbd
2.6
2.0
Better Better
Trans-port
Build-ings
Indus-try
Energy
1
2
3
6
7
9
10
11
12
4
5
8
15th June 2010 © Siemens Russia 2010Slide 14
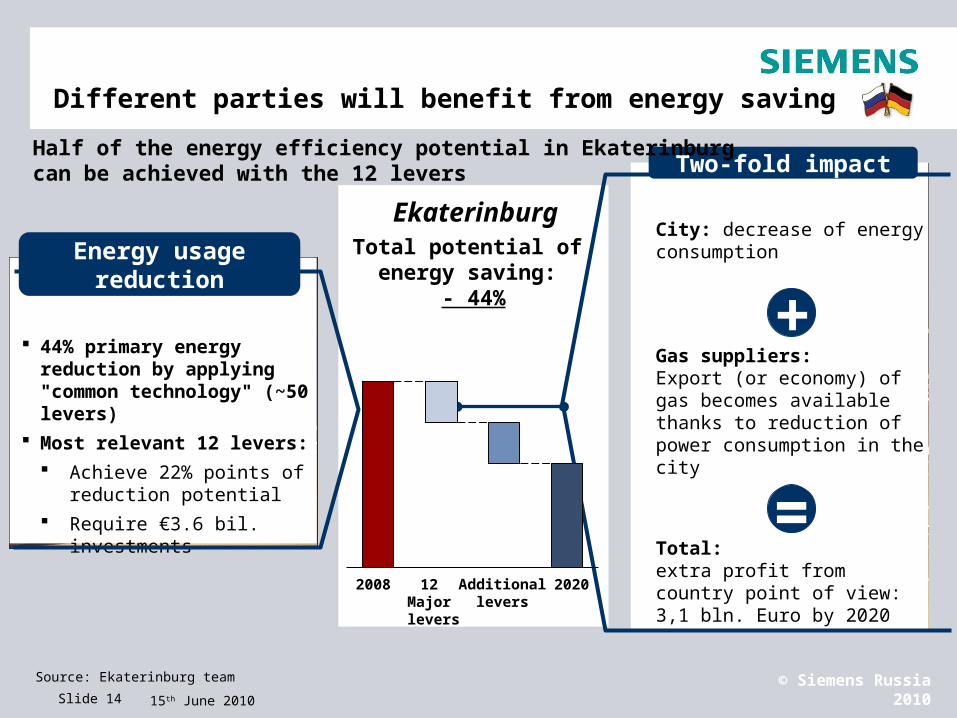
Different parties will benefit from energy saving
Source: Ekaterinburg team
Total potential of energy saving:
- 44%
Ekaterinburg
+
=
Two-fold impact
12 Major levers
Additionallevers
2008 2020
City: decrease of energy consumption
Gas suppliers: Export (or economy) of gas becomes available thanks to reduction of power consumption in the city
Total: extra profit from country point of view: 3,1 bln. Euro by 2020
44% primary energy reduction by applying "common technology" (~50 levers)
Most relevant 12 levers:
Achieve 22% points of reduction potential
Require €3.6 bil. investments
Half of the energy efficiency potential in Ekaterinburg can be achieved with the 12 levers
Energy usage reduction

15th June 2010 © Siemens Russia 2010Slide 15
~€100 bln. investments ~€100 bln. total positive effect
Key 12 levers:Extrapolationto Russia (~60%)
Rollout of Yekaterinburg energy efficiency to Russia would generate ~100 billion EUR benefits by 2020
Krasnoyarsk
Yakutsk
Murmansk
Moskau
St. Petersburg
Ekaterin-burg
Wolgo-grad
Rostov
Chabarovsk
Anadyr

15th June 2010 © Siemens Russia 2010Slide 16
Making Russia Energy Efficient -Energy Efficient Cities and Towns
2. Energy Efficiency Studies
3. Siemens Solutions for Cities
1. The Challenge - Sustainable Urban Infrastructure
4. Pre-requisites for success in Russia

15th June 2010 © Siemens Russia 2010Slide 17
We cannot solve everything with technology, but we cannot solve anything without
Existing technology achieves high gains along entire energy conversion chain
CO2-free energy to the city
Example HVDC: China 800 kV,
6.4 GW, 2,000 km
Building technologies
30% less energy used through building
energy management
SIPLINK
12 tons less CO2 emissions
per ship and day by local grid connection
High-voltage urban link
Efficient energy transport by HV close
to the consumer
Industry
40% less energy consumption with
variable-speed drives
Complete Mobility
Higher attractiveness of public transport
(reduced waiting and up to 20% fuel savings)
Street lighting
Potential in Europe: 3.5 million tons less CO2 emissions with
LED systems
Renewables
Wind turbines:Efficiency up from 1 MW to 3.6 MW
Efficient energy production
Combined Cycle: from 50% to 60%
Steam Power Plant: from 40% to 47%
Traffic management system
30% less downtime with “Progressive traffic
signal system“

15th June 2010 © Siemens Russia 2010Slide 18
The world’s most powerful gas turbine – proven efficiency and output
375 MW GT
570 MW CC
40% GT efficiency
> 60% CC efficiency

15th June 2010 © Siemens Russia 2010Slide 19
Ветроэнергетика РФ сегодня и завтра
SWT-2.3 (-82-93-101) SWT-3.0-101 DD SWT-3.6 (-107-120)
4 ноября 2007: внесены изменения в Федеральный Закон №35 «Об электроэнергетике»; 3 июня 2008: Постановление Правительства РФ №426 «О квалификации генерирующего объекта на основе возобновляемых источников энергии»
8 января 2009 года: Распоряжение Правительства РФ №1-р, определило основные направления государственной политики в области развития электроэнергетики на основании использования возобновляемых источников энергии. К 2020 году планируется увеличить долю возобновляемых источников в производстве электроэнергии до 4,5 % без учета крупных ГЭС, что составит порядка 80 млрд.кВт час выработки.
Законодательная база РФ
Проект государственной программы энергосбережения и повышения энергетической эффективности на период до 2020 года предполагает ввод к 2020 году 4,75 ГВт мощностей на основе энергии ветра
Умеренный сценарий Агентства по прогнозированию балансов и Института энергетической стратегии предполагает ввод к 2020 году 7,5 ГВт мощности ВЭС
Сценарии развития ветроэнергетики в РФ
Ожидаемые шаги в части компенсирующих тарифов в РФ Директор департамента государственной энергетической политики и
энергоэффективности Минэнерго РФ г-н Михайлов на конференции REnergy2010 в мае этого года заявил, что из четырех подзаконных актов, требующихся в развитие положений федерального закона «Об электроэнергетике», два приняты. Еще два, представляющие особый интерес для потенциальных инвесторов – еще на стадии разработки и согласований. Ожидается, что до конца этого года РФ будет иметь законодательную базу, обеспечивающую возможность широкомасштабного внедрения проектов возобновляемой энергетики.
Технический ветропотенциал РФ
Технический ветропотенциал РФ составляет порядка 1 637 ГВт потенциально возможных установленных мощностей ВЭС
Разрабатываемые проекты по строительству ВЭС в РФ
Современные ВЭУ* Сименс
На сегодняшний день в стадии проектирования уже есть проекты по строительству ВЭС в таких регионах как: Краснодарский край, Калмыкия, Волгоград, Калининград, Алтайский край, Дальний Восток.
Сименс предлагает полный спектр решений для строительства ВЭС. Линейка продукции Сименс постоянно совершенствуются и сегодня мы уже предлагаем ветроустановку нового поколения SWT-3.0 с технологией прямого привода.
15th June 2010 © Siemens Russia 2010Slide 20
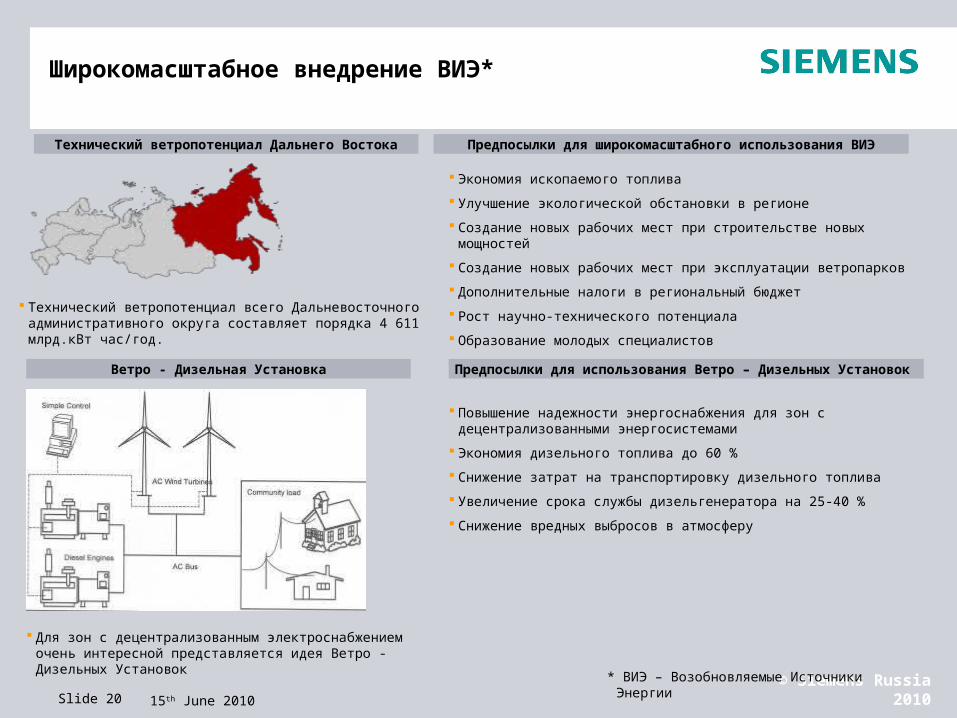
Широкомасштабное внедрение ВИЭ*
Технический ветропотенциал всего Дальневосточного административного округа составляет порядка 4 611 млрд.кВт час/год.
Для зон с децентрализованным электроснабжением очень интересной представляется идея Ветро - Дизельных Установок
Повышение надежности энергоснабжения для зон с децентрализованными энергосистемами
Экономия дизельного топлива до 60 %
Снижение затрат на транспортировку дизельного топлива
Увеличение срока службы дизельгенератора на 25-40 %
Снижение вредных выбросов в атмосферу
Технический ветропотенциал Дальнего Востока
Ветро - Дизельная Установка Предпосылки для использования Ветро – Дизельных Установок
Предпосылки для широкомасштабного использования ВИЭ
Экономия ископаемого топлива
Улучшение экологической обстановки в регионе
Создание новых рабочих мест при строительстве новых мощностей
Создание новых рабочих мест при эксплуатации ветропарков
Дополнительные налоги в региональный бюджет
Рост научно-технического потенциала
Образование молодых специалистов
* ВИЭ – Возобновляемые Источники Энергии

15th June 2010 © Siemens Russia 2010Slide 21
Cogeneration will save 35% of gas consumption
Pilot Ekaterinburg: proposed technology
Current technology
After new technology is implemented
Electricity
Heat
Heat
Gas saving:35%
Gas
Gas
Boiler
CHP Steam power plant
Gas
Electricity
Steam power plant
Gas
Electricity

15th June 2010 © Siemens Russia 2010Slide 22
Electrical capacity: 7,5 MW
Heat capacity: 11,7 Gcal/h
Overall efficiency: 85%
Annual electricity generation: 62.000 MWh
Annual heat energy generation: 97.000 Gcal
Exhaust heat boiler
Exhaust pipe
Turbine SGT-300Automatic control
system and associated equipment
CHP allows to increase energy efficiency by 35%Leasing finance model reduces investment for cities
Source: SMART CHP Russia
CHP Pilot: description of proposed technology
Technical features:
11 mil. m3 p.a.Gas savings:
23 т/годReduction of CO2 emissions:
35%Increase in energy efficiency:

15th June 2010 © Siemens Russia 2010Slide 24
XXX XXX
Energy consumption in buildings Siemens building Munich-Perlach
Efficient operation requires continuous optimization and monitoring
* Building Automation and Control System
No BACS*
BACS* without EnergyMonitoring
BACS* with EnergyMonitoring
100%
90%
80%
70%
60%
Time
En
erg
y co
nsu
mp
tio
n
BACS* withadditional energyefficiency measures
What we know about buildings … Importance of building automation and a life cycle approach
Heating energy demand reduced by 34%
Electricity demand reduced by 15% ROI of less than 2 years

OSRAM Charts | FY 2009 | Page 25091204_OSRAM_Charts_GB_ls.ppt | Date: 12.4.2009 | PR
OSRAM - Potential of sustainable development
Example with home lamp
Easy arithmetical problem:
TERMS:
Lamp wattage 100W (0,1KW)
Lamp price 15 rub.
Lamp lifespan 1000 hours
1000 hour of burning per year
3 rub/KWh
QUESTION:
what are annual expenses for lighting coming from?
Possibilities in professional lighting
• More installed power capacities More burning hours• More investments into equipment• Maintenance of fleets of equipment
MORE POSSIBILITIES FOR ENERGY SAVING!!!
• New technologies• More effective types of light sources• More effective luminaries • SYSTEM approach to SYSTEM of
lighting
OSRAM: world‘s principal manufacturer of light sources
Established in 1906 as joint venture of SIEMENS and 2 other companies
100% SIEMENS owned from 1978
Market leader in Russia
Large factory in Russia, 1500 employees
OSRAM at glance

15th June 2010 © Siemens Russia 2010Slide 26
1) ICT = Information and Communication Technologies
Paradigm shift in power grids: The new age of electricity
Electrification of society'Age of Coal'
'Generation and load closely coordinated'
Supply island withstochastic load
Extensive generation of electrical energy
'Age of fossil fuels'
'Generation follows load' Integrated network, central
generation, load stochastically predictable, unidirectional energy flow
Fossil energy source,hydro
Fossil energy sources,hydro, nuclear
No environmental concerns
19th Century 20th Century
Shift to new age of electricity
Challenges require rethinking: 1.) Demographic change 2.) Scarce resources
3.) Climate change
'Energy system shifting'Increasingly decentralized,
fluctuating generation'consumer' becoming 'prosumer'
Fossil energy sources, hydro, nuclear, biomass,
wind, solar
Early 21st Century
Environmental awareness
Unsustainable energy system
The new age of electricity Electricity will be the energy source for most
applications in daily life. Integrated energy systemwith power grid as backbone
'Load follows generation'Central + decentralized generation,
intelligence with ICT1,bi-directional energy flow
Renewable energy sources (solar, wind, hydro, biomass),
'clean' coal, gas, nuclear
End of 21st Century
Sustainable energy systemUnsustainable energy system

15th June 2010 © Siemens Russia 2010Slide 27
Moscow Ring / Beskudnikovo – Switchgear view 27 ha AIS or 6 ha GIS
GIS and AIS, flexible in cost position or environmental ground savings
-77%

15th June 2010 © Siemens Russia 2010Slide 28
DistrictHeating
The Siemens City Management solution approach:Coupling of today’s separated resources supply systems
EnergyManagement
From decoupled individual optimization to integrated City Management
BuildingManagement
WaterManagement
EnergyManagement
BuildingManagement
WaterManagement
DistrictHeating

15th June 2010 © Siemens Russia 2010Slide 29
Localization contributes to modernization of Russian industry
High Voltage products
Transformers Wind turbinesI&C components
Compressors Gas turbines
Siemens Energy in Russia is fully localized

15th June 2010 © Siemens Russia 2010Slide 30
Making Russia Energy Efficient -Energy Efficient Cities and Towns
2. Energy Efficiency Studies
3. Siemens Solutions for the Cities
4. Pre-requisites for success in Russia
1. The Challenge - Sustainable Urban Infrastructure

15th June 2010 © Siemens Russia 2010Slide 31
In achieving Russian energy efficiency goals international experience can be leveraged
Source: European Council Directives (96/93, 2003/54, 2001/77, 2009/28, 2004/8/EC); Russian Energy Strategy for 2030; German Electricity Feed Act (1991); German Renewable Energy Sources Act (2000, 2004, 2009); Renewables Global Status Report 2009 Update
Goals of energy programs worldwide and ways to achieve them
The European Union created different directives for its member countries in order to reach goals
Germany: incentive model for renewables (& CHP)
- was most successful and served as an example for 47 countries worldwide
- can be implemented in Russia due to similar goals (Energy Strategy for 2030)
Russia already created good preconditions for reaching energy efficiency goals:
- Liberalization of electricity market in progress
- Feed-in tariffs being discussedLiberalization of energy market
1
Diversification of primary energy sources
Increase of renewable energy
Efficiency in Energy SectorReliable Energy SupplyEnvironmental Protection
2
3

Page 32 Month 2010 Author Confidential / © Siemens AG 2010. All rights reserved
Cooperation between Russia and Europe canbe optimized
Timeline of events
GE
RU
1991EFA 1)
2008REHPA 5)
2002CHPA 4)
2000REA 3)
1998EMA 2)
Germangoals German Measures
2009 2015 2020 20301st stage 2nd stage 3rd stage
1) Electricity Feed Act 2) Energy Management Act
Source: TEAM Smart CHP Russia
2003Federal law on
Electric Power IndustryEnergy Strategy for 2030
Creating Incentives Financing Incentives Supporting Incentives
Feed-In-Obligation Feed-In-Tariff Feed-in-Preference
Cost transfer system Completion of liberalization Tariff regulation by FTS6)
Network authority structure reform Reduction of cross-subsidizing Penalties for de-installed meters
Adjusted to Russia
German Measures
3) Cogeneration Act 5) Renewable Energy Sources Act
4) Renewable Energies in the Heat Sector Promotion Act 6) Federal Tariff Service
1 2 3
Russian MeasuresRussiangoals
Suggested: Transfer of know- ledge and experience
2020Integrated Energy &
Climate Program

15th June 2010 © Siemens Russia 2010Slide 33
Prerequisites for successful implementation
Source: Ekaterinburg Team
Implementation systematic
Financing / Legislation
Social Mobilization
Comprehensive energy efficiency stimulus measures (e.g. loan subsidies, attractive tariff structure)
Involvement of key beneficiaries of gas savings (gas providers e.g. Gazprom)
Legally worked out “menu” of financing mechanisms, e.g. Energy Contracting
Advertising geared towards changing consumer behavior
PR campaigns
Well defined energy efficiency program office at the country level with clearly assigned responsibilities
Targets cascaded from the country level down to regions, cities / towns
Implementation systematic (tools, access to necessary data, clear milestones to reach targets)
Statistics
Country-wide defined KPI consistently used across the country
Energy consumption statistics at multiple levels: city, region, country
Transparency of and accessibility to energy consumption and efficiency measures across cities
Beyond technology, there are 4 prerequisites for successful energy efficiency program
15th June 2010 © Siemens Russia 2010Slide 34
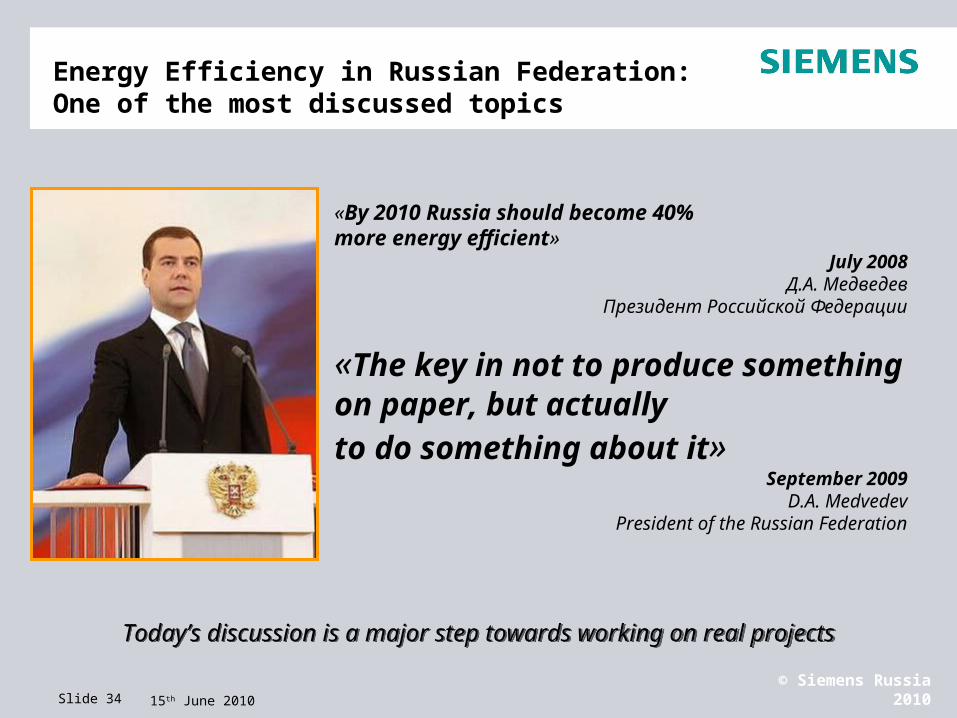
Energy Efficiency in Russian Federation:One of the most discussed topics
«By 2010 Russia should become 40% more energy efficient»
July 2008Д.А. Медведев
Президент Российской Федерации
«The key in not to produce something on paper, but actually to do something about it»
September 2009D.A. Medvedev
President of the Russian Federation
Today’s discussion is a major step towards working on real projectsToday’s discussion is a major step towards working on real projects

Page 35 Energy T
Thank you very much!Спасибо за внимание!


