
Malaria epidemiology and key control
interventions in the Democratic Republic of Congo
INAUGURALDISSERTATION
zur
Erlangung der Würde eines Doktors der Philosophie
vorgelegt der
Philosophisch-Naturwissenschaftlichen Fakultät
der Universität Basel
von
Henry Maggi Tabala Ntuku
aus Kinshasa, (Demokratische Republik Kongo)
Basel, 2016
Originaldokument gespeichert auf dem Dokumentenserver der Universität Basel edoc.unibas.ch

ii
Genehmigt von der Philosophisch-Naturwissenschaftlichen Fakultät
auf Antrag von Prof. Dr. Christian Lengeler und Prof. Dr. Immo Kleinschmidt.
Basel, 20.09.2016
Prof. Dr. Jörg Schibler
The Dean of Faculty

iii
To the Almighty Lord
To my parents
To my lovely wife Lisa and my adorable sons Dylan David and Allan Daniel

iv
Table of contents
List of figures……………………………………………………………...…………………vii
List of tables…………………………………………………………………..….………..….ix
List of acronyms……………………………………………..…..…….…….…..…...……....xi
Acknowledgements…………………………………..………………….………..…………xiii
Summary……………………………………………………………………………………..xv
Résumé……………………………………………………….…….………………………xviii
1 Introduction ............................................................................................................ 1
1.1 Malaria parasite and disease ..................................................................................... 1
1.2 Global malaria distribution, burden and population at risk ........................................ 2
1.3 Malaria vector .......................................................................................................... 3
1.4 Malaria prevention ................................................................................................... 3
1.5 LLIN distribution channels ....................................................................................... 4
1.6 Malaria treatment: severe malaria ............................................................................. 5
1.7 The Democratic Republic of Congo: administrative and health organisation ............ 6
1.8 Epidemiology of malaria in the Democratic Republic of Congo ................................ 8
1.9 Malaria control in the DRC..................................................................................... 11
2 Goal and objectives of the present thesis ............................................................. 13
2.1 Goal ....................................................................................................................... 13
2.2 Objectives .............................................................................................................. 13
3 A comprehensive malaria risk map in Kinshasa, Democratic Republic of Congo14
3.1. Abstract .................................................................................................................. 15
3.2. Background ............................................................................................................ 17
3.3. Method ................................................................................................................... 18
3.4. Results.................................................................................................................... 26
3.5. Discussion .............................................................................................................. 41
v
3.6. Conclusions ............................................................................................................ 43
4. Identifying risk factors for Plasmodium infection and anaemia in Kinshasa,
Democratic Republic of Congo ............................................................................ 44
4.1. Abstract .................................................................................................................. 45
4.2. Background ............................................................................................................ 47
4.3. Method ................................................................................................................... 48
4.4. Results.................................................................................................................... 50
4.5. Discussion .............................................................................................................. 58
4.6. Conclusions ............................................................................................................ 60
5. An operational comparative study of quinine and artesunate for the treatment
of severe malaria in hospitals and health centres in the Democratic Republic of
Congo: The MATIAS study ................................................................................. 61
5.1. Abstract .................................................................................................................. 62
5.2. Background ............................................................................................................ 63
5.3. Methods ................................................................................................................. 64
5.4. Results.................................................................................................................... 71
5.5. Discussion .............................................................................................................. 77
5.6. Conclusions ............................................................................................................ 80
6. Feasibility and acceptability of injectable artesunate for the treatment of severe
malaria in the Democratic Republic of Congo .................................................... 81
6.1. Abstract .................................................................................................................. 82
6.2. Background ............................................................................................................ 83
6.3. Methods ................................................................................................................. 84
6.4. Results.................................................................................................................... 88
6.5. Discussion .............................................................................................................. 94
6.6. Conclusions ............................................................................................................ 96

vi
7. Long-Lasting Insecticidal Net (LLIN) ownership, use and cost of
implementation after a mass distribution campaign in Kasaï Occidental
Province, Democratic Republic of Congo ............................................................ 97
7.1. Abstract .................................................................................................................. 98
7.2. Background .......................................................................................................... 100
7.3. Methods ............................................................................................................... 101
7.4. Results.................................................................................................................. 106
7.5. Discussion ............................................................................................................ 121
7.6. Conclusions .......................................................................................................... 124
8. Malaria morbidity in the Democratic Republic of Congo from 2010 to 2014:
What is really captured by the surveillance system?. ....................................... 125
8.1. Abstract ................................................................................................................ 126
8.2. Background .......................................................................................................... 127
8.3. Methods ............................................................................................................... 129
8.4. Results.................................................................................................................. 132
8.5. Discussion ............................................................................................................ 140
8.6. Conclusions .......................................................................................................... 143
9. General discussion and conclusions ................................................................... 144
9.1. Implications for malaria control in Kinshasa ......................................................... 145
9.2. Implications for the implementation of injectable artesunate ................................. 146
9.3. Implications for LLIN distributions ...................................................................... 148
9.4. Implications for malaria surveillance .................................................................... 149
9.5. Overall conclusions and outlook ........................................................................... 150
10. References ........................................................................................................... 152

vii
List of Figures
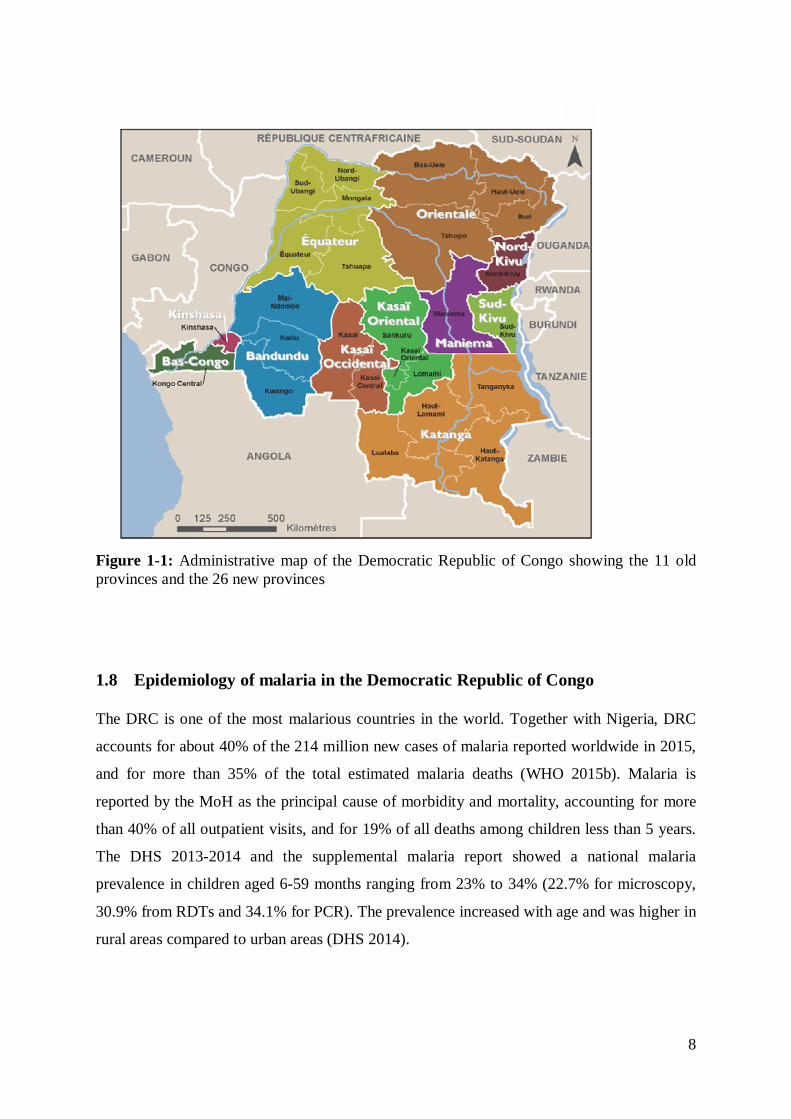
Figure 1-1: Administrative map of the Democratic Republic of Congo showing the 11 old
provinces and the 26 new provinces ...................................................................................... 8
Figure 3-1: Plasmodium falciparum malaria prevalence (RDT positivity) by age group for the
health zones of Selembao and Ngiri Ngiri ........................................................................... 28
Figure 3-2: Standardized Plasmodium falciparum malaria prevalence in children aged 6-59
months, by health area. The 2009 data for the health zones of Bumbu, Kingabwa, Kisenso,
Kokolo and Ndjili were only available at the level of the health zones. ................................ 30
Figure 3-3: Interpolation results for standardized Plasmodium falciparum malaria prevalence
in children aged 6-59 months, by health area. Note: The data of Figure 3-2 were used for an
inverse distance weighting (IDW) interpolation and then a mean prevalence value was
calculated for every health area. .......................................................................................... 31
Figure 3-4: Standardized prevalence of anaemia (Hb<11g/dl) in children aged 6-59 months,
by health area, surveys 2009 and 2011. ............................................................................... 33
Figure 3-5: Standardized prevalence of severe anaemia (Hb<7g/dl) in children aged 6-59
months, by health area, surveys 2009 and 2011. .................................................................. 34
Figure 3-6: Percentage of children <5 years having slept under an ITN the night before the
survey in 2009, by health area. ............................................................................................ 39
Figure 3-7: Percentage of children < 5 years having slept under an ITN the night before the
survey in 2011, by health area ............................................................................................. 40
Figure 4-1: Left panel: ITN usage among children 6 to 59 months by transmission intensity.
Right panel: ITN usage among individuals older than five years in Ngiri Ngiri (0.8%) and
Selembao (26.8%) in Kinshasa, 2011. Light grey bars represent proportions of reported ITN
usage in high transmission strata, and dark grey bars in low transmission strata. Error bars
indicate 95% CI................................................................................................................... 57
Figure 5-1: Map showing the location of the study sites and the selected health zones ......... 66
Figure 7-1: Map showing the location of the study sites .................................................... 102
Figure 7-2: Number of LLIN received from the mass distribution campaign by household 109
Figure 7-3: Lorenz concentration curve showing equity in LLIN use before and after the
campaign........................................................................................................................... 110
Figure 7-4: Population access and use before and after the mass distribution campaign ..... 112
Figure 7-5: Age specific use of LLIN. Before and after the mass distribution campaign (5A).
By coverage level after the mass distribution campaign (5B) ............................................. 113
viii
Figure 8-1: Population-adjusted Plasmodium falciparum parasite rate in 2-10 years olds, by
region (large figure) and by health zones for three regions (detailed map for Ituri, Nord Kivu
and Sud Kivu), 2013. ........................................................................................................ 129
Figure 8-2: Health system structure in the DRC................................................................. 130
Figure 8-3: Total all-cause outpatients incidence, total suspected and confirmed malaria case
incidence, per 1000 population, by province and year, 2010-2014, DR Congo .................. 136
Figure 8-4: RDT and slide positivity rates, by province and year, 2010-2014, DR Congo .. 137
Figure 8-5 A and B: A: Average slide positivity rate, B: average RDT positivity rate. 2010-
2014, DR Congo ............................................................................................................... 139
ix
List of Tables
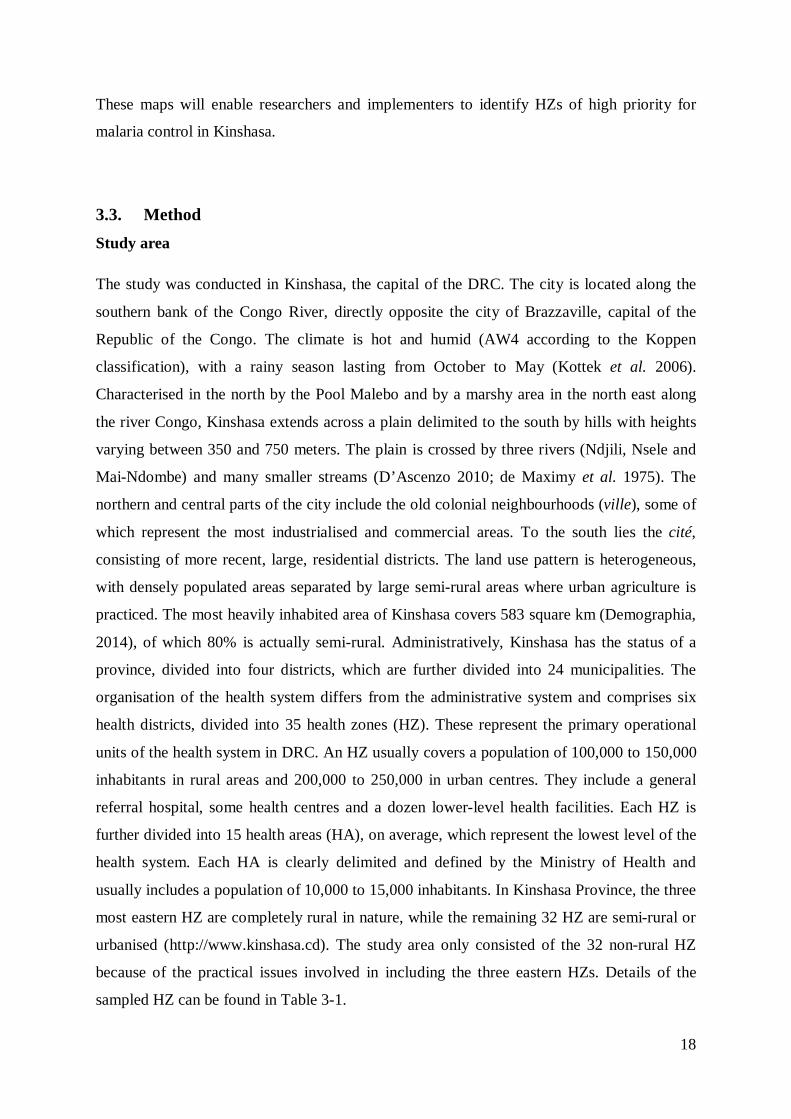
Table 3-1: List of the Health Zones in Gretaer Kinshasa surveyed in 2009 and 2011 and their
corresponding populations. .................................................................................................. 21
Table 3-2: Characteristics of study households and individuals in the 2009 and 2011 surveys,
Kinshasa, Democratic Republic of Congo. .......................................................................... 26
Table 3-3: Clinical outcomes, by health zones ..................................................................... 36
Table 4-1: Number of children 6 to 59 months examined and prevalence of Plasmodium spp
in Kinshasa, by health zone and strata, 2011 ........................................................................ 50
Table 4-2: Univariate and multivariate analysis of risk factors associated with malaria in
children between 6 and 59 months of age in Kinshasa, stratified by malaria transmission zone
........................................................................................................................................... 52
Table 4-3: Univariate and multivariate analysis of risk factors associated with malaria in
individuals aged > 5 years in Kinshasa, stratified by malaria transmission zone, 2011 ......... 54
Table 4-4: Univariate and multivariate analysis of risk factors associated with anaemia in
children between 6 and 59 months of age in Kinshasa, stratified by malaria transmission
zone, 2011 ........................................................................................................................... 56
Table 5-1: Characteristics and clinical presentation of patients at recruitment ...................... 73
Table 5-2: Clinical examination at discharge ....................................................................... 74
Table 5-3: Key time intervals .............................................................................................. 74
Table 5-4: Personnel time (in minutes) required to complete pre-administration tasks, by drug
type ..................................................................................................................................... 75
Table 5-5: Overall cumulative personnel time (in minutes) .................................................. 75
Table 5-6: Mean cost (with SD) for treating one episode of severe malaria in patients
admitted to hospitals and health centres in the Democratic Republic of Congo .................... 76
Table 6-1: Summary of interviews with health care providers.............................................. 89
Table 6-2: Summary interview with patients/caretakers ....................................................... 93
Table 7-1: Characteristics of surveyed households ............................................................ 107
Table 7-2: Key malaria household survey indicators before and after the mass distribution
campaign........................................................................................................................... 114
Table 7-3: Key malaria household survey indicators by distribution strategy ..................... 115
Table 7-4: Logistic regression model showing determinants of LLIN use before the mass
distribution campaign ........................................................................................................ 117
x
Table 7-5: Logistic regression showing determinants of LLIN use after the mass distribution
campaign........................................................................................................................... 118
Table 7-6: Financial costs of the LLIN distribution by cost category and delivery strategy 120
Table 8-1: Summary of malaria surveillance indicators at national level form 2010 to 2014
......................................................................................................................................... 134
xi
List of Acronyms
ACT Artemisinin-based Combination Therapy;
ADB Asian Development Bank
AL Artemether plus Lumefantrine
ALU Artemether plus LUmefantrine (ALU).
AS-AQ ArteSunate plus AmodiaQuine
ANC Ante Natal Care
CDC Centre for Disease Control
CI Confidence Interval
CRF Case Report Form
DFID Department For International Development
DHIS2 District Health Information System 2
DHS Demographic and Health Survey
DRC Democratic Republic of the Congo
EKBB EthikKommission Beider Basel
GF Global Fund
GFATM Global Fund to fight AIDS TB and Malaria
GIS Geographic Information System
GPS Global Positioning System
HA Health Area
Hb Haemoglobin
HMIS Health Monitoring Information System
HZ Health Zone
IDW Inverse Distance Weighting
INFORM Information for Malaria
IPTp Intermittent Preventive Treatment in pregnancy
ITN Insecticide-Treated Net
IV Intravenous
JICA Japanese International Cooperation Agency

xii
KOICA Korean International Cooperation Agency
KSPH Kinshasa School of Public Health
LLIN Long Lasting Insecticidal Net
MAP Malaria Atlas Project
MATIAS MAlaria Treatment with Injectable ArteSunate
MICS Multiple Indicators Cluster Survey
MIS Malaria Indicators Survey
MMV Medicines for Malaria Venture
MMWR Morbidity and Mortality Weekly Report
MoH Ministry of Health
MSH Management Science for Health
NGO Non-Governmental Organization
NMCP National Malaria Control Programme
NMSP National Malaria Strategic Plan
OR Odds Ratio
PCT Parasite Clearance Time
PMI President’s Malaria Initiative
PNLP Programme National de Lutte contre le Paludisme
PSI Population Services International
RDT Rapid Diagnostic Test
SP Sulfadoxine-Pyrimethamine
UK United Kingdom
UNICEF United Nations International Children’s Emergency Fund
USAID United States Agency for International Development
USD United States Dollar
WHO World Health Organization

xiii
Acknowledgements
The completion of this thesis has been a long journey with its ups and downs but has been
made possible thanks to the support and contribution from a number of people; we would
take pages and pages to name them one by one. I dedicate this page to all those who helped
me through this journey, each one in his/her own unique way.
First and foremost, I would like to express my deepest gratitude to my supervisor Professor
Christian Lengeler for his constant support and availability throughout this perilous process. I
have been impressed by his immense knowledge, his simplicity and flexibility. His scientific
guidance made this thesis reach the right standard for acquisition of a PhD.
I am deeply grateful to my Mentor, Professor Antoinette Tshefu of the Kinshasa School of
Public Health, who accepted me in her team and introduced me in the field of malariology.
Her scientific rigor, valuable advices and enriching discussions were crucial throughout the
duration of this PhD. I hope somehow that I was able to successfully “borrow your brain”.
I also would like to thank Professor Christian Burri of the Swiss TPH, who told me the first
time we met “there will be ups and downs, you should remain constant”. It turned out to be so
true that I was thinking of him every time I had found myself in the downs. My gratitude also
goes to the staff of Swiss TPH office in Kinshasa, in particular to Didier Kalemwa Mitembo
(Chef) for accepting me in the Swiss TPH family in Kinshasa, for his support and friendship.
Many thanks to Jean-Emmanuel Julo-Réminiac for his valuable advices and enriching
discussions. Celestin Mwambi (Celestino), thank you for your invaluable support. Angèle
Dilu (Angelo), Didi Mvumbi, Antoine Masendi (Antonio), Winny Kialanda (Winniston)
thank you for being good friends and creating a nice working environment.
To my colleagues from the Kinshasa School of Public Health Dalau Nkamba, Daniel Ishoso,
Eric Mafuta, Willy Onema (who introduced me to Prof Tshefu), Dieudonné Punga for their
support and wonderful moments. Many thanks to the big team from Mama Yemo for your
support and friendship: Nelly Kediamosiko, Bibiche Mambele, Bellys Lubambuka, Annie
Kasenga, Blaise Mavoka, Paulin Kasonga. Many thanks also to the staff of malaria
longitudinal study: Kashamuka (Mr Kash), Nono Mvuama, Georges Kahuma, Marthe
Nkelani and Alex Bala. Many thanks go also to Pius Mafuta, for his laboratory skills and
careful supervision of all laboratory related activities during the projects.
xiv
I would like to thank amico mio Dr Giovanfrancesco Ferrari (Cesco) for his support, help and
kindness. Thanks for making me feel at home in Como. Many thanks to my friends with
whom we spent time together in the field: Sandro Schmidlin, Philipp Bless and Laura
Ruckstuhl for their collaboration, friendship and invaluable support. Many thanks to Melissa
Penny and Katya Galactionova for guidance in analysis and interpretation of some results.
Many thanks to all the people who contributed to the FEVERKIN, MATIAS and KASAINET
studies, all supervisors, interviewers, medical doctors, nurses, laboratory technicians for their
excellent work. I am very grateful to all patients and their parents for their collaboration. I am
thankful to the National and provincial health authorities and the National Malaria control
staff who facilitated the studies.
Very special thanks to Christine Mensch and her colleagues in the training office for the
invaluable support with the administrative issues. Your hard and amazingly efficient work
helped me focus on my studies. Thanks to the travel and accommodation team: Margrit
Slaoui, Dagmar Batra, Laura Innocenti, Christine Walliser.
To my friends, colleagues, fellow students who made my stay in Switzerland very special:
Astrid Knoblauch, Sammy Khagayi, Josephine Malinga, Francis Mhimbira, Koku Awoonor;
Mari Dumbaugh, Sabine Renggli, Severine Erismann, Nick Sabelo Dlamini, Clarisse
Houngbedji, Castor Rhastin, Nerina Vischer, Maira Bholla, Natalie Hofmann.
I would like to express my gratitude to the Federal Commission for Scholarships for Foreign
Students for the financial support through the ESKAS program.
I would like to express my sincere appreciation and heartfelt gratitude to my lovely wife Lisa
Ntuku and my adorable sons Dylan David and Allan Daniel for their moral support, they
haven’t seen me that much during the last 3 years. Special thanks should also go to my
parents Jean and Charlotte Ntuku, my brothers and sisters Declerck, Love, Thethe and
Chancelvie Ntuku as well as my brothers and sisters in-laws for their prayers and always
giving me excellent moral support.
To the Almighty God be the Glory.
xv
Summary
Malaria remains a major global public health problem causing over 400,000 deaths annually,
mainly among children in sub Saharan Africa. The Democratic Republic of Congo (DRC),
the second largest and the fourth most populated country in Africa, is one of the most
malarious countries in the world. An estimated 97% of its 71 million inhabitants live in high
transmission areas. Together with Nigeria, DRC accounts for about 40% of the total
estimated malaria cases worldwide, and for more than 35% of the total estimated malaria
deaths. The national malaria control programme (NMCP) is committed to reducing malaria
and the associated morbidity and mortality in DRC through the implementation of specific
proven interventions. The aim of this thesis was to contribute to the improvement of malaria
control activities in the DRC, through the provision of new evidence on the epidemiology of
malaria and key control interventions, to support evidence-based policy making.
Kinshasa, the capital of DRC, has been expanding very rapidly in the past 20 years (going
from an estimated 3 million inhabitants to a current estimate of 10 million) and available
evidence has shown that urbanization had a significant impact on the ecosystems and disease
patterns, including malaria. However, in the context of scaling up of interventions, data on
malaria distribution in Kinshasa are scarce; the latest epidemiological study was conducted in
2000. We conducted two cross-sectional surveys to update malaria risk stratification in
Kinshasa, identify factors contributing to the distribution patterns, and update information on
malaria control activities. Geo-referenced data for key parameters were mapped at the level
of the health area (HA) by means of a geographic information system (GIS). The overall
standardized malaria prevalence was 11.7%, showing a decline compared to previous studies.
The spatial distribution showed higher malaria risk in the peri-urban areas compared to the
more urban central areas. Compared to the Demographic and Health Survey 2007 (DHS-
DRC, 2007), coverage of malaria control measures showed considerable progresses in a
pattern inversely proportional to the malaria risk distribution: low LLIN coverage in the peri-
urban areas and higher coverage in the centre of the city. The analysis of drivers of malaria in
both children less than five years and individuals aged older than five years highlighted the
variation of the effect of age and reported history of fever by level of endemicity. In low
endemicity strata, a shift in the peak of malaria prevalence towards the older age groups was
observed, while the history of fever in the last two weeks increased the risk of malaria in all
age groups and regardless of the level of endemicity. Individual use of LLIN was associated
xvi
with reduced risk malaria infection among children less than five years. The risk of malaria
was lower among children less than five years of the wealthiest socio economic group. This
risk map constitutes a strong basis for the planning of malaria control interventions in
Kinshasa.
Following the publication of the results of two large open-label randomized controlled trials
(SEAQUAMAT, AQUAMAT) that demonstrated the benefits of injectable artesunate over
quinine in the treatment of severe malaria, and in line with the updated WHO guidelines, the
NMCP changed the policy for treating severe malaria in children and adults from injectable
quinine to injectable artesunate in 2012 A transition period of 3 years was set, including the
need for operational research to support the national deployment. We conducted an
operational comparative study of quinine and injectable artesunate for the treatment of severe
malaria (MATIAS study) with the aims of assessing the operational feasibility of this
introduction, providing national cost estimates, and assessing the acceptability of the new
drug among both health care providers and patients. Our findings showed that all the
operational parameters measured (time to discharge, interval between admission and the start
of intravenous treatment, personnel time spent on patient management, and parasite clearance
time) were equal or in favour of injectable artesunate. The mean total cost per patient treated
for severe malaria in hospitals and health centres was also lower with injectable artesunate.
There was a high acceptability by both health care providers and patients. These findings
support the rapid scale up of injectable artesunate in the country.
Mass distribution campaigns of LLIN are accepted as the best approach to rapidly increase
coverage and use. To promote correct and consistent use of distributed LLIN, the WHO
recommends the integration of door-to-door visits with “hang up” activities into mass
distribution campaigns. Integrating hang-up activities requires obviously additional human
and financial resources. Since published data on the effects and cost of door-to-door visits
with hang up activities on LLIN use are scarce, more evidence is still required to optimize the
efficiency of national LLIN programmes. We used a LLIN mass distribution campaign in the
province of Kasai Occidental that used two different approaches, a fixed delivery strategy and
a door-to-door strategy including hang-up activities, to evaluate comparatively household
LLIN ownership, access and individual use, and examine factors associated with LLIN use.
We also compared the two delivery strategies with regard to the LLIN coverage achieved and
the cost of implementation. Results showed that the mass distribution campaign was effective
at achieving high LLIN ownership and use. Having sufficient numbers of LLIN to cover all
xvii
residents in the household was the strongest determinant of LLIN use. Compared with the
door-to-door strategy, the fixed delivery strategy achieved a higher LLIN coverage at lower
delivery cost, and seems to be a better LLIN delivery option in the context of DRC.
Information on the number and distribution of malaria cases and deaths is fundamental for the
design, implementation and evaluation of malaria control programmes. In many endemic
areas, health facility-based data remain the only consistent and readily available source of
information on malaria. Because of known inherent limitations, this source of date can
underestimate the total burden of disease by a considerable fraction. In DRC, the use of rapid
diagnostic tests has been expanded since 2010, leading to a marked increase in suspected
malaria cases receiving a diagnostic test. Together with other management measures, this
should improve the quality of the incidence rates obtained through the Health Monitoring
Information System (HMIS). Based on household survey data, the Malaria Atlas Project
(MAP) of the University of Oxford has produced estimates of clinical incidence of malaria
for the years 2000-2015 for all African countries, providing something like a reference value
on incidence rates. We compared the malaria incidence rates obtained from the HMIS data in
the DRC from 2010 to 2014 to the MAP modelled incidence rates for the same time period,
in order to assess the relative reporting of the HMIS system. Our preliminary results showed
that due to the expansion of parasitological diagnosis, the number of confirmed malaria cases
reported and hence the fraction of incident cases captured by the HMIS data had increased
substantially over time. By contrast, the number of incident malaria cases predicted by the
MAP model had progressively decreased. Because of inconsistencies in reporting, it has been
difficult to establish trends in malaria morbidity, but the unchanged high values of test
positivity rates suggest malaria transmission remains high and stable over time.
xviii
Résumé
Le paludisme reste un problème mondial de santé publique causant plus de 400,000 décès par
an, essentiellement chez les enfants en Afrique sub-saharienne. La République Démocratique
du Congo (RDC), le deuxième plus vaste et le quatrième plus peuplé pays d’Afrique, est l’un
des pays qui paie le plus lourd tribut au paludisme dans le monde. Environ 97% des 71
million d’habitants de la RDC vit dans des régions à forte transmission du paludisme. Avec le
Nigeria, la RDC représente près de 40% de tous les cas de paludisme recensés dans le monde
et plus de 35% de tous les décès. Le Programme National de Lutte contre le Paludisme
(PNLP) est engagé à réduire la morbidité et la mortalité palustres en RDC à travers la mise en
œuvre d’interventions spécifiques. L’objectif de cette thèse était de contribuer à
l’amélioration des activités de lutte contre le paludisme en RDC en apportant un complément
d’évidence sur l’épidémiologie du paludisme ainsi que sur les interventions clés pour une
prise de décision basée sur les évidences.
Kinshasa, la capitale de la RD C, a connu une expansion rapide dans les 20 dernières années
(de 3 millions d’habitants à 10 millions) et les évidences ont montré que l’urbanisation a un
impact significatif sur l’écosystème et la transmission des maladies, dont le paludisme.
Cependant, dans un contexte de mise à échelle des interventions, les données sur la
distribution du paludisme à Kinshasa sont rares ; les dernières études épidémiologiques datent
des années 2000. Nous avons conduit deux études transversales pour identifier les facteurs
contribuant à la distribution observée et mettre à jour les informations sur les activités de lutte
contre le paludisme. Les données géo-référenciées sur les paramètres-clé ont été
cartographiées au niveau des Aire de Santé (AS) au moyen d’un système d’information
géographique. La prévalence standardisée du paludisme était de 11.7%, montrant une baisse
comparée aux études précédentes. La distribution spatiale a montré que le risque du
paludisme était plus élevé dans les zones périurbaines comparées aux zones plus urbanisées
du centre. Comparé à l’enquête démographique et de santé 2007, la couverture des mesures
de contrôle a montré des progrès considérables, avec une tendance opposée au risque
d’infection : une couverture en moustiquaire faible dans les zones périurbaines et élevée dans
le centre de la ville. L’analyse des déterminants du paludisme chez les enfants de moins de 5
ans et les sujets de plus de 5 ans a révélé la variation de l’effet de l’âge et de l’histoire de
fièvre par niveau d’endémicité. Dans la strate de faible endémicité, nous avons observé un
shift du pic de prévalence du paludisme vers les groupes d’âge plus élevés, alors que
xix
l’histoire de fièvre durant les 2 dernières semaines augmentait le risque du paludisme dans
tous les groupes d’âge et indépendamment du niveau d’endémicité. L’utilisation de la
moustiquaire était associée à un risque réduit du paludisme chez les enfants de moins de 5
ans. Le risque du paludisme était plus faible chez les enfants du niveau socio-économique le
plus riche.
Suivant la publication des résultats de deux grands essais randomisés (SEAQUAMAT,
AQUAMAT) qui ont démontré la supériorité de l’artesunate injectable comparé à la quinine
dans le traitement du paludisme sévère, et en ligne avec les recommandations de l’OMS, le
PNLP a changé la politique de prise en charge du paludisme sévère en RDC en 2012 de la
quinine à l’artesunate injectable. Une période de transition de 3 ans a été instaurée incluant un
besoin en recherche opérationnelle pour appuyer le déploiement du nouveau médicament à
l’échelle nationale. Nous avons conduit une étude comparative opérationnelle entre la quinine
et l’artesunate injectable avec pour but d’évaluer la faisabilité de l’introduction de
l’artesunate injectable en RDC, fournir des estimations des coûts, et évaluer l’acceptabilité du
nouveau médicament par les prestataires et les patients. Nos résultats ont montré que tous les
paramètres opérationnels mesurés (durée d’hospitalisation, intervalle entre l’admission et le
début du traitement, temps du personnel pour la surveillance du patient, temps de clearance
parasitaire) étaient en faveur de l’artesunate. Le coût total moyen par patient traité dans les
hôpitaux et les centres de santé était aussi plus bas avec l’artesunate injectable. Ces résultats
ont plaidé pour une mise à échelle rapide de l’artesunate injectable dans le pays.
Les campagnes de distribution de masse des moustiquaires imprégnées d’insecticide à longue
durée d’action (MILD) sont reconnues comme la meilleure approche pour augmenter
rapidement la couverture et l’utilisation de la MILD. Pour promouvoir l’utilisation correcte et
systématique de la MILD, l’OMS recommande l’intégration des visites porte-à-porte avec des
activités de «hang-up» dans les campagnes. L’intégration de ces activités requiert des
évidemment des ressources humaines et financières additionnelles. Actuellement, les
publications sur l’effet de ces activités sur l’utilisation de la MILD ainsi que le coût
d’implémentation sont peu nombreuses. Plus d’évidences sont nécessaires pour permettre au
PNLP de distribuer les MILD de la manière la plus efficiente et efficace possible. Nous avons
utilisé le cadre de la campagne de distribution des MILD dans la province du Kasaï
Occidental avec deux stratégies de distribution, la stratégie fixe et le porte à porte avec
activités de «hang-up», pour évaluer l’impact sur la possession, l’accès et l’utilisation de la
MILD, et évaluer les facteurs associés à l’utilisation de la MILD. Nous avons aussi comparé

xx
les deux stratégies en rapport avec le niveau de possession en MILD atteint, ainsi que le coût
d’implémentation. Les résultats montrent que la campagne a permis d’atteindre des niveaux
élevés de couverture et d’utilisation de la MILD. Avoir un nombre suffisant de MILD pour
couvrir tous les membres du ménage était le plus important déterminant d’une bonne
utilisation de la MILD. Comparée à la stratégie porte à porte, la stratégie fixe a atteint des
couvertures plus élevées à plus faible cout. Elle semble donc être la meilleure option de
distribution des MILD dans le contexte de la RDC.
Connaitre le nombre et la distribution des cas et des décès du paludisme est fondamental pour
la mise en œuvre et l’évaluation d’un programme de lutte contre le paludisme. Dans plusieurs
pays endémiques, les données des formations sanitaires demeurent la seule source
d’information sur le paludisme rapidement accessible. A cause des limites y inhérentes, cette
source de données peut sous-estimer d’une fraction considérable le fardeau total de la
maladie. En RDC, l’utilisation des tests de diagnostic rapide a été étendue depuis 2010,
entrainant une augmentation du nombre de cas suspects de paludisme testés. Avec d’autres
mesures de gestion améliorée, ce développement a le potentiel d’améliorer la qualité des taux
d’incidence obtenus à travers le système national d’information sanitaire (SNIS). A partir des
données d’enquêtes ménages, le Malaria Atlas Project (MAP) de l’université d’Oxford a
produit des estimations de l’incidence du paludisme clinique pour tous les pays africains pour
les années 2000-2015, offrant au moins une valeur de référence permettant d’évaluer les taux
d’incidence rapportés par le SNIS. Nous avons comparé les taux d’incidence obtenus des
données SNIS à ceux projetés par le projet MAP pour la RDC de 2010 à 2014. Les résultats
préliminaires ont montré que suite à l’expansion du diagnostic parasitologique, le nombre de
cas confirmés rapportés et partant la fraction de cas incidents captée par le SNIS a augmenté
significativement avec le temps, alors que le nombre de cas projetés par le projet MAP a
diminué. A cause des incohérences dans les données, il a été difficile d’établir des tendances
claires pour la morbidité palustre, mais les valeurs constantes et élevées des taux de positivité
suggèrent que la transmission du paludisme reste forte et stable dans le temps.
1
1 Introduction
1.1 Malaria parasite and disease
Malaria is a protozoan parasitic infection caused by a single-celled parasite of the genus
Plasmodium. Four species have been identified to be responsible for human malaria:
Plasmodium falciparum, Plasmodium vivax, Plasmodium malariae and Plasmodium ovale.
Recently, Plasmodium knowlesi, a simian parasite, was found to also occur in humans in Asia
(Cox Singh et al. 2008). P. falciparum and P. vivax are the most important parasites to
humans. P. falciparum is the main cause of malaria morbidity and mortality and it is the most
prevalent species in sub-Saharan Africa (Marsh et al. 1995).
The parasite life cycle is complex and unfolds in two stages: an asexual reproduction stage in
the human host and a sexual reproductive stage inside the mosquito definitive host. When an
infected Anopheles mosquito bites a human, the parasite is introduced in the body in the form
of a sporozoite. Shortly after inoculation into the blood circulation, sporozoites enter
hepatocytes where they develop asexually (schizogony) into pre-erythrocytic schizonts. P.
vivax and P. ovale have a dormant stage, named hypnozoite that may remain in the liver for
many years before resuming the pre-erythrocytic schizogony, resulting in relapses of malaria
infection. A pre-erythrocytic schizont contains thousands of small offsprings (merozoites)
which are released into the blood stream and which invade new red blood cells. Within the
erythrocyte, the merozoite develops asexually through the ring, trophozoite and schizont
stages (erythrocytic schizogony). The infected erythrocyte eventually ruptures and releases
the newly formed merozoites that invade new erythrocytes. After some times, a small
proportion of merozoites differentiate into male or female gametocytes, which will be taken
up by the mosquito in her blood meal. In the gut of the mosquito, male and female
gametocytes will fuse (sexual reproduction) to form a zygote. The zygote matures into new
sporozoites which then migrate to the salivary glands of the female Anopheles mosquito,
ready to be expelled when the mosquito takes the next blood meal.
The massive destruction of erythrocytes associated with the accumulation of toxic wastes in
the blood leads to the clinical symptoms of malaria. Depending on many factors including
host/parasite genetics, age of the patient and intensity of transmission, clinical presentation of
malaria varies from asymptomatic to a severe or even fatal condition (Reyburn et al. 2005).

2
Uncomplicated malaria is characterized by non specific symptoms including fever and any of
the following symptoms: headache, body and joint pains, cold, shivering, occasionally
diarrhoea, nausea, vomiting, splenomegaly (Warrell et al. 2002). The clinical manifestations
of severe/complicated malaria result from vital organ dysfunctions. They include cerebral
malaria which is associated with impairment of consciousness, abnormal behaviour, seizures,
coma or other neurological abnormalities; severe anaemia; acute respiratory distress
syndrome; prostration; shock; acute kidney injury; clinical jaundice; abnormal bleeding
(WHO 2013a).
1.2 Global malaria distribution, burden and population at risk
Malaria is a major global public health problem and a leading cause of morbidity and
mortality in many countries. According to the World Health Organization (WHO), in 2015
approximately 3.2 billion people - nearly half of the world’s population - were at risk of
malaria and 97 countries and territories had ongoing malaria transmission. There were
globally an estimated 214 million new malaria cases and 438,000 deaths (WHO 2015b).
Although this represents a decrease in malaria case incidence and mortality of 37% and 60%
since the year 2000, the African Region continues to experience the heaviest malaria burden.
About 88% of all malaria cases and 90% of malaria deaths are estimated to have occurred in
the WHO African Region, mainly in children under 5 years. The Democratic Republic of
Congo (DRC) and Nigeria together account for more than 35% of the total of estimated
malaria cases and deaths (WHO 2015b).
Malaria is linked with poverty in a vicious circle, as higher case incidence and mortality rates
are reported in countries with lower gross national income per capita, and the highest burden
of disease is shouldered by resource constrained settings. Malaria is thought to be responsible
for a 1.3% reduction in economic growth in affected countries (Sachs et al. 2002). The
disease may account for as much as 40% of public health expenditures, and households in
Africa lose up to 25% of their income to the disease (RBM 2000a; RBM 2000b).
In 2015, 15 countries mainly in sub Saharan Africa accounted for 80% of malaria cases and
78% of deaths globally. In these countries, the decline in malaria incidence was slower than
in other countries. The slower reduction in malaria in high burden countries is a challenge
that needs to be addressed if global progress is to be achieved (WHO 2015b).

3
Lowering malaria burden in sub Saharan Africa may pave the way for economic growth, both
at household level and at large scale by the reallocation of public health expenditure to other
parts of the health system.
1.3 Malaria vector
Malaria parasites are transmitted by female mosquitoes belonging to the genus Anopheles.
There are about 400 species of Anopheles mosquitoes. Approximately 60–70 species
worldwide can transmit malaria; of these, about 40 are vectors of major importance (Bruce-
Chwatt 1985; Hay et al. 2010). The main properties of mosquitoes that influence their ability
to transmit malaria efficiency are: (1) the susceptibility to malaria parasites; some vectors
transmit all Plasmodium species equally well, while others are somewhat specific; (2) the
longevity, expressed as the probability that a mosquito will survive through one day; (3)
anthropophily, defined as the preference of mosquitoes for human blood; (4) mosquito
population density. The main properties of vectors that are important for vector control are:
(1) exo or endophagy, i.e. preference to feed outside or inside houses; (2) exo- or endophily,
i.e. preference to rest outdoor or indoor during blood digestion; (3) anthropophily or
zoophily; (4) biting time; and (5) predilection to rest at a particular height on a wall. The
Anopheles gambiae complex in Africa includes seven species, of which Anopheles gambiae
sensu stricto and Anopheles arabiensis are the most important vectors. Anopheles funestus is
probably the best malaria vector because of its close association with humans. These species
combine high parasite susceptibility, a high daily survival rate, anthropophily and the ability
to use different types of breeding sites. On the other hand, the indoor biting and resting
characteristic of these vectors makes them susceptible to indoor vector control measure using
insecticides (i.e treated mosquito nets and indoor residual spraying).
1.4 Malaria prevention
The primary focus of malaria prevention is to reduce contacts between mosquitoes and
human hosts, largely through vector control methods. Currently, by far the most effective
measures of controlling malaria transmission are Long-Lasting Insecticidal Nets (LLIN) and
Indoor Residual Spraying (IRS). LLINs reduce human vector contact at individual level via
the physical barrier they provide, and also via the repellency of the insecticide imbedded or
bound to its fibers. LLINs also kill mosquitoes in large numbers, thus reducing their
4
population density through reduced longevity. In addition to the individual protection for net
sleepers, LLINs provide a community effect by which the overall transmission reduction
offers protection from malaria infection even to those not sleeping under a net, particularly
when use rates are high (Binka et al. 1998; Hawley et al. 2003; Killeen et al. 2007). Evidence
of the efficacy of insecticides treated nets has been established in various large randomized
trials, (D’Alessandro et al. 1995; Binka et al. 1996; Phillips-Howard et al. 2003; Ter Kuile et
al. 2003) summarized in a Cochrane Review showing a substantial decrease in the occurrence
of clinical cases of malaria by about 50% and child mortality by about 20% (Lengeler 2004).
These results laid the foundation for the scale-up of LLINs as the primary method of vector
control. Over the USD 1.6 billion spent in 2014 on malaria control commodities, LLIN
accounted for 63% of total expenditure with 189 million nets delivered (WHO 2015b).
Although the number of distributed LLINs is still insufficient to achieve universal coverage
in all endemic settings, the current success in malaria control owes a lot to the massive rollout
of LLINs and other effective prevention and treatment tools. LLINs have been estimated to
contribute about 70% to the decline in malaria prevalence, and 70% of the 6.5 million
clinical malaria cases averted in Africa from 2000 to 2015 (Bhatt et al. 2015). However, these
gains are threatened by the development and spread of insecticide resistance in many
countries (Coetzee et al. 2006; Ranson et al. 2011). This situation calls for urgent and
coordinated action to monitor the spread of resistance, maintain effectiveness of current
vector control interventions and develop new and innovative vector control tools (WHO
2012a; Hemingway et al. 2016).
1.5 LLIN distribution channels
To rapidly and equitably reach universal coverage, LLINs are mostly distributed through
mass distribution campaigns designed to reach the entire population. Based on an agreed
average LLIN lifespan of 3 years, mass distribution campaigns are repeated every 3-4 years.
These campaigns have proven to be highly cost-effective in quickly achieving high coverage
in countries where they have been implemented (Willey et al. 2012). However, under field
conditions LLINs durability is highly variable, with a gradual process of loss beginning
immediately after a campaign (Kilian et al. 2008; Kilian et al. 2011; Allan et al. 2012;
Massue et al. 2016). Moreover, during the interval between campaigns, new sleeping spaces
are created as new children are born or people move. The result is that repeated campaigns
cannot maintain consistently high coverage and the WHO recommends therefore that mass

5
distribution campaigns be complemented by continuous or routine distributions through
multiple channels” in order to maintain universal coverage (WHO 2013b). These continuous
distribution channels include antenatal consultations, immunization and child health clinics,
school based distribution, social marketing, commercial sales and other channels currently
under consideration.
Although mass distribution campaigns have been widely accepted as the best approach to
rapidly increase ITN coverage, there is a gap between LLIN ownership and use, mainly
attributed to the lack of ability or willingness to hang the LLIN (Rickard et al. 2011;
MacIntyre et al. 2012; Bowen 2013) . To promote correct and consistent use of LLIN, door-
to-door visits with “hang up” and interpersonal communication activities have been
integrated in to LLIN mass distribution campaigns, with varying effects on LLIN ownership
and use (Thwing et al. 2008; Thawani et al. 2009; MacIntyre et al. 2012; Smith Paintain et
al. 2014; Zegers de Beyl et al. 2016). Including hang-up activities requires additional human
and financial resources, with implications on the cost of implementation. Published data on
the effects of door-to-door visits with hang up activities are limited. A recent cluster
randomised controlled trial conducted in Uganda showed that door-to-door visits and
additional hang up activities did not provide any additional impact on net use and were
therefore not cost-effective (Kilian et al. 2015). As funding for malaria control interventions
might become more restricted in the future (WHO 2012b), more evidence is needed to
support national programmes in delivering LLIN as efficiently and effectively as possible.
1.6 Malaria treatment: severe malaria
Severe malaria is the most serious form of Plasmodium falciparum infection, and it can be
fatal in the absence of prompt recognition of the disease and appropriate patient management
(WHO 2013a). Reducing this burden is currently the highest priority for malaria control, as
evidenced by the Roll Back Malaria (RBM) target of near-zero deaths by 2015 (Roll Back
Malaria Partnership 2011). For many decades, quinine has been the mainstay for the
treatment of severe malaria. Two large open-label randomized controlled trials conducted in
malaria endemic countries in Southeast Asia (SEAQUAMAT) and in Africa (AQUAMAT),
as well as additional small trials, demonstrated the benefits of injectable artesunate compared
to quinine for the treatment of severe malaria in both children and adults (Dondorp et al.
2005; Dondorp et al. 2010; Sinclair et al. 2012).

6
These results with a high quality of evidence led to a rapid change in the WHO guidelines for
the treatment of severe malaria (WHO 2011b). WHO now recommends injectable artesunate
for the treatment of severe malaria in children and adults and countries are adopting the new
policy. However, because of reported cases of delayed anaemia associated with the use of
injectable artesunate (Rolling et al. 2013; CDC 2013; Rolling et al. 2014), the long term
safety profile of the drug needs still needs to be monitored.
In early 2012, following the new WHO guidelines, the National Malaria Control Programme
(NMCP) of the Democratic Republic of Congo (DRC) changed the national policy for the
treatment of severe malaria in both children and adults from intravenous quinine to injectable
artesunate (PNLP 2012). A transition period of three years was set to allow clinical and
operational adaptations. Operational research to establish the feasibility and acceptability of
the new drug in the context of the routine care is needed to support this policy change.
The cost effectiveness of artesunate in the management of severe malaria has been shown in
modelling studies, with an incremental cost per death averted of approximately US$150
(Lubell et al. 2009; Lubell et al. 2011). Cost estimates for the DRC are lacking and studies
are required to establish procurement and operational costs.
1.7 The Democratic Republic of Congo: administrative and health organisation
The Democratic Republic of the Congo (DRC) is located in central Africa and is the second
largest country by area in Africa (after Algeria). With a surface area of 2.345.000 km2 it is the
equivalent of two-thirds of the European Union. The country shares 9.165 km of border with
nine countries, and it is bordered by the Atlantic Ocean to the west. With an estimated
population of 71 million people (National Statistic Institute 2015), the majority of whom are
living in rural areas, the DRC is the fourth most populated country in Africa (after Nigeria,
Ethiopia and Egypt). Current population estimates are derived from the last census conducted
in 1984 - which recorded 30.7 million inhabitants - by applying a fixed yearly growth rate
(3%) without consideration of changes in fertility, mortality or displacement.

7
The DRC lies on the equator between latitudes 6°N-14°S, with one third of the landmass to
the north and two thirds to the south. Temperatures are hot and humid in the central region,
cooler and drier in the southern highlands, and cooler and wetter in the eastern highlands.
Low ambient temperatures affect the likelihood of malaria transmission in mountainous
regions (about 3% of total area).
Administratively, the DRC is a highly decentralized state which until recently had 11
provinces. Following a constitutional reform in 2006, the country has engaged in reform that
led to the creation of 26 provinces (Figure 1-1). Kinshasa, the capital city, is a megacity of
more than 10 million inhabitants and is divided into 24 communes.
The DRC is one of the poorest countries in the world, ranking second from the bottom (186th
out of 187 countries) in terms of the 2014 human development index (HDI) (UNDP 2014).
An estimated 80% of the population lives on less than $1 per day and capita gross national
income was at US$ 410 in 2015 (World Bank 2016). According to the 2013-14 Demographic
and Health Survey (DHS), the under-five mortality rate is currently 104/1,000 live births, a
significant reduction from the previous rate of 158/1,000 in 2010 (UNICEF 2010).
The health system organization in DRC has a pyramidal structure with three levels: central,
intermediate and peripheral. Policy decisions are made at central level: the office of the
minister of health (MoH), the general secretary and the directorates of national disease
specific programs. The intermediate (provincial) level performs the functions of technical
support and monitoring, and comprises 26 provincial health divisions (11 until 2013). The
peripheral level comprises 516 Health Zones (HZ), which are the operational unit for
planning and implementing the national health policy. The HZ operate as autonomous
decentralised entities with their own management. A HZ includes a general referral hospital
and 15-20 health centres, and covers an average population of 150.000 in rural health zones
and 250.000 in urban health areas. The 516 Health Zones are further divided into 8504 Health
Areas (HA). Each HA serves between 5000 and 10,000 people. The health system also
includes community health workers providing treatment at community level in the frame of
the integrated community case management (iCCM).
8
Figure 1-1: Administrative map of the Democratic Republic of Congo showing the 11 old provinces and the 26 new provinces
1.8 Epidemiology of malaria in the Democratic Republic of Congo
The DRC is one of the most malarious countries in the world. Together with Nigeria, DRC
accounts for about 40% of the 214 million new cases of malaria reported worldwide in 2015,
and for more than 35% of the total estimated malaria deaths (WHO 2015b). Malaria is
reported by the MoH as the principal cause of morbidity and mortality, accounting for more
than 40% of all outpatient visits, and for 19% of all deaths among children less than 5 years.
The DHS 2013-2014 and the supplemental malaria report showed a national malaria
prevalence in children aged 6-59 months ranging from 23% to 34% (22.7% for microscopy,
30.9% from RDTs and 34.1% for PCR). The prevalence increased with age and was higher in
rural areas compared to urban areas (DHS 2014).

9
1.8.1. The parasite
Four Plasmodium species are reported in the DRC, with Plasmodium falciparum being the
predominant species, accounting for approximately 95% of all infections either in mono-
infections (90.4%) or in co-infection with Plasmodium malariae (4.9%) or Plasmodium ovale
(0.6%)(Ngimbi et al. 1982; Taylor et al. 2011). A number of studies have reported the
presence of Plasmodium vivax in the DRC (Ngimbi et al. 1982; Guerra et al. 2010). Because
of the possible confusion between P. vivax and P. ovale by microscopy (Rosenberg 2007) and
the presence of Duffy negative trait preventing endemic P.vivax transmission in much of sub-
Saharan Africa, it is difficult to interpret these data. However, evidence of the transmission of
a parasite with P. vivax characteristics among Duffy negative individuals has been reported in
some African countries and among travellers to central and west Africa (Gautret et al. 2001;
Ryan et al. 2006; Culleton et al. 2009; Dhorda et al. 2011). Further investigations on the
epidemiology of P. vivax infections in the DRC should be undertaken.
The last therapeutic efficacy trial of Artemisinin-Based Combination Treatments (ACT)
conducted in 2012 showed an adequate clinical and parasitological response rates of 93% for
both artemether-lumefantrine (AL) and artesunate-amodiaquine (AA). The latterhas been
extensively used in the DRC since its introduction in 2006 (Onyamboko et al. 2014).
1.8.2. Vectors
The confirmed dominant vectors of malaria in the DRC include Anopheles gambiae s.l. and
Anopheles funestus s.l., with several secondary vectors present in different parts of the
country, including Anopheles nili, Anopheles moucheti, Anopheles paludis and Anopheles
hancocki (Coene 1993; Karch & Mouchet 1992; Karch et al. 1992).
In 2009, reduced kill rates of Anopheles gambiae were observed with DDT and with
pyrethroids (deltamethrin, permethrin) in four sites in the country (Basilua Kanza et al.
2013). In 2010, Anopheles gambiae was shown to be resistant to both DDT and permethrin in
the region of Kinshasa, with mortality rates of 27.3% and 75.8%, respectively (Bobanga et al.
2013). Results of insecticide resistance monitoring in seven sentinel sites from 2013 to 2015
using Anopheles gambiae suggested that deltamethrin and permethrin showed signs of
resistance while Anopheles gambiae was sensitive to carbamates (PMI, 2014).
10
1.8.3. Risk stratification
The stratification used to describe the epidemiology of malaria in the DRC is based on the
concepts of eco-faciae developed by Mouchet and Carnevale in the nineties and widely used
across Francophone Africa (Mouchet et al. 1993). This stratification has been used in the
DRC since 2002 and defines three principal areas:
1) Equatorial facies (central African forests and post forest savannas) where malaria
transmission is intense and perennial, with an EIR of up to 1000 infected bites per person per
year, resulting in an early acquisition of clinical immunity.
2) Tropical facies (African humid savannas) where transmission is seasonal with a peak in
the rainy season during five to eight months, and where people might receive 60 to 400
infected bites per person per year. Semi-immunity appears later.
3) Mountain facies (between an altitude of 1000 and 1500 m) where the transmission period
is very short and there may even be years without transmission. Semi-immunity is low or
even absent, resulting in a risk of malaria epidemics.
It is estimated that 97 percent of the Congolese population lives within the first two
epidemiological ecotypes, and hence lives in areas of high transmission intensity.
Using polymerase Chain Reaction (PCR) analysis of dried blood spots samples from the 2007
DRC Demographic and Health Survey (DHS-DRC, 2007), Messina et al. generated the first
malaria risk map based on the intensity of transmission as measured by parasite prevalence,
(Messina et al. 2011). Low prevalence rates were recorded in the Centre and East-Central
regions and near the urban areas of Kinshasa and Lubumbashi. High prevalence rates were
recorded in the Northern regions of the country, and in the rural areas close to Kinshasa and
Lubumbashi.
Recent collaborative work from the INFORM project assembled data from available
households surveys to stratify the spatial extent of malaria transmission intensity across the
DRC for 2013 (PNLP et al. 2014). The results showed that over two thirds of the population
live in areas where the population adjusted prevalence was >=50%. Areas of lowest
transmission were located in the higher altitude Eastern provinces where the low ambient
temperatures limit sporogony in vector populations. This work also highlighted the need to
generate more data to improve the precision of predictions at lower levels (Health Zone), and
11
provide a baseline for updated predictions of malaria risk, and for more effective control
planning and monitoring.
1.9 Malaria control in the DRC
The Congolese national malaria control programme (NMCP) was created in 1998, and is
committed to reducing malaria and the associated morbidity and mortality in DRC through
the implementation of proven interventions. Key strategies and activities in line with global
and African policies are defined in the National Malaria Strategic Plan. The National Malaria
Strategic Plan is continuously updated to follow WHO and RBM recommendations (PNLP
2016). Key strategies include:
1) Malaria prevention with an emphasis on individual and collective protection through
LLIN, IRS, the treatment of mosquito breeding sites, and the prevention of malaria in
pregnancy through intermittent preventive (IPTp). LLIN are distributed through free mass
distribution campaigns and routinely through ANC and immunisation clinics. To cover the
entire country, the NMCP carries out distribution cycles. The first distribution cycle was
completed in 2012 and covered the whole country over a period of 5 years. The second cycle
was initiated in 2013 and completed in early 2016. The country has now started the third
distribution cycle. Limited IRS activities are only undertaken by the Tenke-Fungurume
mining company. IPTp consists in administrating a single dose of Sulfadoxine-
Pyrimethamine (SP) at every ANC visit after the first trimester. In 2014, only 14% of
pregnant women received at least 2 doses of SP as IPT (DHS 2014).
2) Improved case management by promoting diagnostic confirmation of malaria and
appropriate treatment at all levels of the health system. Parasitological confirmation is
recommended for all suspected cases of malaria seen at all levels of the health system using
Rapid Diagnostic Test (RDT).The use microscopy is only recommended in case of treatment
failures and severe malaria cases. Artemether-lumefantrine and artesunate-amodiaquine are
recommended for the treatment of uncomplicated malaria. Injectable artesunate is
recommended for all cases of severe malaria in replacement of quinine during a transition
phase of three years, and rectal artesunate for pre-referral treatment is recommended for pre-
referral treatment at community level.

12
3) Improving epidemiological surveillance and strengthening monitoring and evaluation
efforts. The main source of information for malaria surveillance in the DRC is reports of
malaria cases, malaria inpatients and malaria deaths obtained from health facilities in the
frame of the Health Monitoring Information System (HMIS). These data consist of monthly
counts of malaria cases, inpatients and deaths collected at community (iCCM) and health
facility level. Paper forms go through different levels of the DRC health system where they
are checked. The entire system is progressively being made electronic by the scaling up of the
District Health Information Software 2 (DHIS2), but at present many HZ continue to use
paper forms for the collection of routine malaria data. The data quality, reporting
completeness and timeliness still need to be improved. This source of data is complemented
by weekly data collected by the MoH on potential outbreaks, and data from malaria
surveillance sentinel sites, although both systems are not yet fully functional.
Several donors are contributing to the malaria control efforts in DRC, with the Global Fund,
The World Bank, the US President’s Malaria Initiative (USAID/PMI) and the UK
Department for International Development (DfID) being the most important. Additional
donors include UNICEF, KOICA, the Sweden International Development Agency, and the
Canadian International Development Agency. Each donor is covering a number of HZs.
Currently, partner support to the 516 HZ is being restructured according to the 26 new
provinces, with a given partner covering entirely a given province.
With support from its donors, the NMCP has been scaling up key interventions over the past
decade, especially LLINs. The household ownership of at least 1 LLIN, the LLIN use among
children and pregnant women have increased from 9%, 6% and 7% in 2007 to 70%, 56% and
60% in 2014, respectively. However, because of the scarcity of epidemiological data and the
low quality of routine health facility data, the impact of these interventions has not been
clearly established.
In this thesis we present the results of a number of studies that aimed at better understanding
the epidemiology of malaria in the DRC and improving the implementation of key control
interventions.
13
2 Goal and objectives of the present thesis
2.1 Goal
To contribute to the improvement of malaria control activities in the Democratic Republic of
the Congo, through the provision of quality evidence on the epidemiology of malaria and key
control interventions.
2.2 Objectives
1. To establish a comprehensive and representative risk map of malaria transmission in
the Greater Kinshasa area.
2. To estimate the malaria associated risk factors among different subgroups of the
population of greater Kinshasa.
3. To investigate through limited scope implementation studies how injectable
artesunate may be best implemented as the preferred treatment for severe malaria in
the Democratic Republic of the Congo.
4. To estimate LLIN ownership, use and cost of implementation after a mass distribution
campaign in the Kasaï Occidental Province.
5. To determine the fraction of all malaria cases reported by the Health Monitoring
Information System.

14
3 A comprehensive malaria risk map in Kinshasa, Democratic
Republic of Congo
Giovanfrancesco Ferrari1,2, Henry M Ntuku1,2,3, Sandro Schmidlin1,2, Antoinette T Kitoto3,
Christian Lengeler1,2
1 Swiss Tropical and Public Health Institute, P.O. Box, 4002, Basel, Switzerland
2 University of Basel, Basel, Switzerland
3 Kinshasa School of Public Health, Kinshasa, Democratic Republic of the Congo
This paper has been published in the Malaria Journal 2016, 15:27.

15
3.1. Abstract Background
In Kinshasa, malaria remains a major public health problem but its spatial epidemiology has
not been assessed for decades now. The city’s growth and transformation, as well as recent
control measures, call for an update. To identify highly exposed communities and areas
where control measures are less critically needed, detailed risk maps are required to target
control and optimise resource allocation.
Methods
In 2009 (end of the dry season) and 2011 (end of the rainy season), two cross-sectional
surveys were conducted in Kinshasa to determine malaria prevalence, anaemia, history of
fever, bed net ownership and use among children 6–59 months. Geo-referenced data for key
parameters were mapped at the level of the health area (HA) by means of a geographic
information system (GIS).
Results
Among 7,517 children aged 6–59 months from 33 health zones (HZs), 6,661 (3,319 in 2009
and 3,342 in 2011) were tested for both malaria (by Rapid Diagnostic Tests) and anaemia,
and 856 (845 in 2009 and 11 in 2011) were tested for anaemia only. Fifteen HZs were
sampled in 2009, 25 in 2011, with seven HZs sampled in both surveys. Mean prevalence for
malaria and anaemia was 6.4% (5.6–7.4) and 65.1% (63.7–66.6) in 2009, and 17.0% (15.7–
18.3) and 64.2% (62.6–65.9) in 2011. In two HZs sampled in both surveys, malaria
prevalence was 14.1% and 26.8% in Selembao (peri-urban), in the 2009 dry season and 2011
rainy season respectively, and it was 1.0% and 0.8% in Ngiri Ngiri (urban). History of fever
during the preceding two weeks was 13.2% (12.5–14.3) and 22.3% (20.8–23.4) in 2009 and
2011. Household ownership of at least one insecticide treated net (ITN) was 78.7% (77.4–
80.0) and 65.0% (63.7–66.3) at both time points, while use was 57.7% (56.0–59.9) and
45.0% (43.6–46.8), respectively.

16
Conclusions
This study presents the first malaria risk map of Kinshasa, a mega city of roughly 10 million
inhabitants and located in a highly endemic malaria zone. Prevalence of malaria, anaemia and
reported fever was lower in urban areas, whereas low coverage of ITN and sub-optimal net
use were frequent in peri-urban areas.
Keywords: Malaria, Anaemia, mosquito nets, DRC, Democratic Republic of Congo,
Kinshasa

17
3.2. Background Malaria is the leading cause of morbidity and death in children under five years in the
Democratic Republic of Congo (DRC), accounting for an estimated 40% of outpatient visits
and 40% of overall mortality (Roll Back Malaria 2014) Malaria is also a major public health
issue in the capital city Kinshasa; an issue that has been studied since colonial times(Ngimbi
et al. 1982). After Cairo and Lagos, Kinshasa is Africa’s third largest city, with an estimated
population of more than 10 million (Nations). In 1979–1980, the average malaria parasite rate
in a representative sample of children was 33% (Ngimbi et al. 1982). Around the same time,
malaria admissions comprised 29.5% of consultations in 1983, then 38.2% in 1985–86
(Greenberg et al. 1989). In 1986–1987, the mean prevalence rate of malaria in six districts of
Kinshasa was 50%, with a higher prevalence in the peripheral districts (Mulumba et al.
1990). This reflected the distribution pattern of the main vector Anopheles gambiae, which
was less present in the city centre than in the periphery (Karch et al. 1992; Coene 1993). The
latest study in 2000 confirmed the general prevalence distribution pattern, with lower
prevalence in the city centre (parasite rate 4%) than in peri-urban areas (46%) (Kazadi et al.
2004).
A first insecticide treated net (ITN) distribution campaign in 2007 achieved a 15.9% rate of
ITN ownership and a 12.6% rate of use among children under five (DHS 2007). In 2008, the
World Bank financed the acquisition and distribution of two million ITNs in Kinshasa
through the PURUS project (Programme d’Urgence de Réhabilitation Urbaine et Sociale).
The National Malaria Control Programme (NMCP), along with technical and logistic support
from Population Services International (PSI), distributed two ITNs per household. Eight
months after that distribution, the Kinshasa School of Public Health (KSPH) conducted a
survey on basic malaria indicators to assess the impact of the intervention in 15 health zones
(HZ) of the city. In 2011, the Swiss Tropical and Public Health Institute (Swiss TPH), in
collaboration with the KSPH, conducted a second survey to evaluate the coverage and use of
key malaria indicators, parasitaemia, anaemia and fever in the 23 HZ excluded from the 2009
survey. Kinshasa has expanded very rapidly in the past 20 years, thus updating and
consolidating these data was urgently required for general malaria control purposes and for
planning specific further research projects. Using geo-referenced prevalence data, this study
aimed to generate the first map of malaria risk among children 6–59 months in Greater
Kinshasa, down to the lowest level of the health system in DRC, the health area (HA).
18
These maps will enable researchers and implementers to identify HZs of high priority for
malaria control in Kinshasa.
3.3. Method Study area
The study was conducted in Kinshasa, the capital of the DRC. The city is located along the
southern bank of the Congo River, directly opposite the city of Brazzaville, capital of the
Republic of the Congo. The climate is hot and humid (AW4 according to the Koppen
classification), with a rainy season lasting from October to May (Kottek et al. 2006).
Characterised in the north by the Pool Malebo and by a marshy area in the north east along
the river Congo, Kinshasa extends across a plain delimited to the south by hills with heights
varying between 350 and 750 meters. The plain is crossed by three rivers (Ndjili, Nsele and
Mai-Ndombe) and many smaller streams (D’Ascenzo 2010; de Maximy et al. 1975). The
northern and central parts of the city include the old colonial neighbourhoods (ville), some of
which represent the most industrialised and commercial areas. To the south lies the cité,
consisting of more recent, large, residential districts. The land use pattern is heterogeneous,
with densely populated areas separated by large semi-rural areas where urban agriculture is
practiced. The most heavily inhabited area of Kinshasa covers 583 square km (Demographia,
2014), of which 80% is actually semi-rural. Administratively, Kinshasa has the status of a
province, divided into four districts, which are further divided into 24 municipalities. The
organisation of the health system differs from the administrative system and comprises six
health districts, divided into 35 health zones (HZ). These represent the primary operational
units of the health system in DRC. An HZ usually covers a population of 100,000 to 150,000
inhabitants in rural areas and 200,000 to 250,000 in urban centres. They include a general
referral hospital, some health centres and a dozen lower-level health facilities. Each HZ is
further divided into 15 health areas (HA), on average, which represent the lowest level of the
health system. Each HA is clearly delimited and defined by the Ministry of Health and
usually includes a population of 10,000 to 15,000 inhabitants. In Kinshasa Province, the three
most eastern HZ are completely rural in nature, while the remaining 32 HZ are semi-rural or
urbanised (http://www.kinshasa.cd). The study area only consisted of the 32 non-rural HZ
because of the practical issues involved in including the three eastern HZs. Details of the
sampled HZ can be found in Table 3-1.

19
Study design and sampling procedure
Two cross-sectional household surveys were conducted. The first survey was carried out at
the end of the dry season between mid-September and end of October 2009 in 15 HZ, eight
months after the first large ITN distribution campaign. The second survey was conducted at
the end of the rainy season from mid-April to early June 2011 and covered 25 non-rural HZ.
Seven HZ were sampled in both studies, including five HZ for which malaria prevalence was
not measured in 2009 and two HZ for which prevalence was measured previously in 2009.
The detailed list of HZ surveyed in 2009 and 2011 is presented in Table 3-1. For both
surveys, a multi-stage cluster sampling design was adopted to select households for inclusion,
using the HZ as a primary sampling stage and the HA as a secondary sampling stage.
2009 survey
Fifteen HZ were selected using a probability proportional to size (PPS) sampling method, so
that more populated HZ had a higher probability of being selected. Of these 15 HZ, 10 were
selected by simple random sampling for the determination of malaria by rapid diagnostic test
(RDT). In the remaining five HZ, only haemoglobin (Hb) was measured and malaria
preventive measures were investigated using a pre-tested, structured questionnaire. In each
HZ, data collection took place in half of the HA, selected again with PPS. In case of an odd
number of HAs per HZ, (n +1)/ 2 HAs were selected. In a third stage, a list of all streets with
their approximate population number was obtained for each selected HA. Streets with fewer
than 200 inhabitants were excluded and three streets were selected by simple random
sampling. Households with at least one child aged 6–59 months were listed by community
health workers (CHW) for each of the three streets. From this list, 25 eligible households
were randomly selected, proportional to the size of each street. The target sample size of 325
children was calculated based on an estimated prevalence of anaemia of 69.2% in children
aged 6–59 months. Assuming 1.3 children aged 6–59 months per household, a sample size of
260 households was set as the target per health zone (DHS 2007).

20
2011 survey
From mid-April to early June 2011, the remaining 23 HZ were sampled, including the five
HZ for which malaria prevalence had not been measured in the 2009 survey. In all 23 HZ, a
questionnaire was administered to households and malaria parasite prevalence and the Hb
concentration were measured in children aged 6–59 months. Two additional HZ already
investigated in 2009 were re-sampled in 2011 among children 6-59 months for both malaria
and anaemia. To obtain the epidemiological age profile for all age groups in these latter HZ
only, all individuals older than five were also included. In all, 25 HZ were sampled in the
2011 survey. The primary outcome measure was documented malaria in study children, as
measured by RDT. The sample size was calculated based on the prevalence estimate for 2009
survey (6.4%) during the dry season, and increased to 10% to take into account the seasonal
variation. In each HZ, the aim was to measure children’s malaria with a precision of ± 8
absolute percent. The sample size calculation indicated the need for 55 children in each HZ.
With a design effect accounting for clustering of two, this number increased to 110. With an
average 1.3 children under five years in households in Kinshasa, 87 households needed to be
selected (DHS 2007). To account for losses in the study process, we aimed for 100
households in each of the 25 HZ. Hence, the total number of households sampled in Kinshasa
in 2011 was 2,500, including 3,250 children aged 6–59 months. HA and household selection
followed the same methodology applied in the 2009 survey (described above). An average of
25 households was set per HA.

21
Table 3-1: List of the Health Zones in Gretaer Kinshasa surveyed in 2009 and 2011 and their corresponding populations.
Health zone Environment Population Year survey
Bandalungwa Urban 147.252 2011
Barumbu Urban 115.780 2011
Binza Meteo Urban 325.446 2009†/2011
Binza Ozone Urban 317.731 2011
Biyela Urban 174.232 2009†/2011
Bumbu Urban 316.188 2009
Gombe Urban 22.732 2011
Kalamu I Urban 112.915 2011
Kalamu II Urban 100.782 2011
Kasa-Vubu Urban 102.856 2009
Kikimi Urban 198.997 2011
Kimbanseke Urban 217.772 2011
Kingabwa Urban 162.323 2009
Kingasani Urban 171.538 2011
Kinshasa Urban 135.665 2011
Kintambo Urban 81.026 2011
Kisenso Urban-rural 335.265 2009
Kokolo Urban 336.086 2009
Lemba Urban 249.292 2009†/2011
Limete Urban 145.331 2009†/2011
Lingwala Urban 66.595 2011
Makala Urban 238.088 2011
Maluku I Urban 149.040 Excluded
Maluku II Rural 54.158 2009
Masina I Urban 258.687 2011
Masina II Urban 214.401 2009†/2011
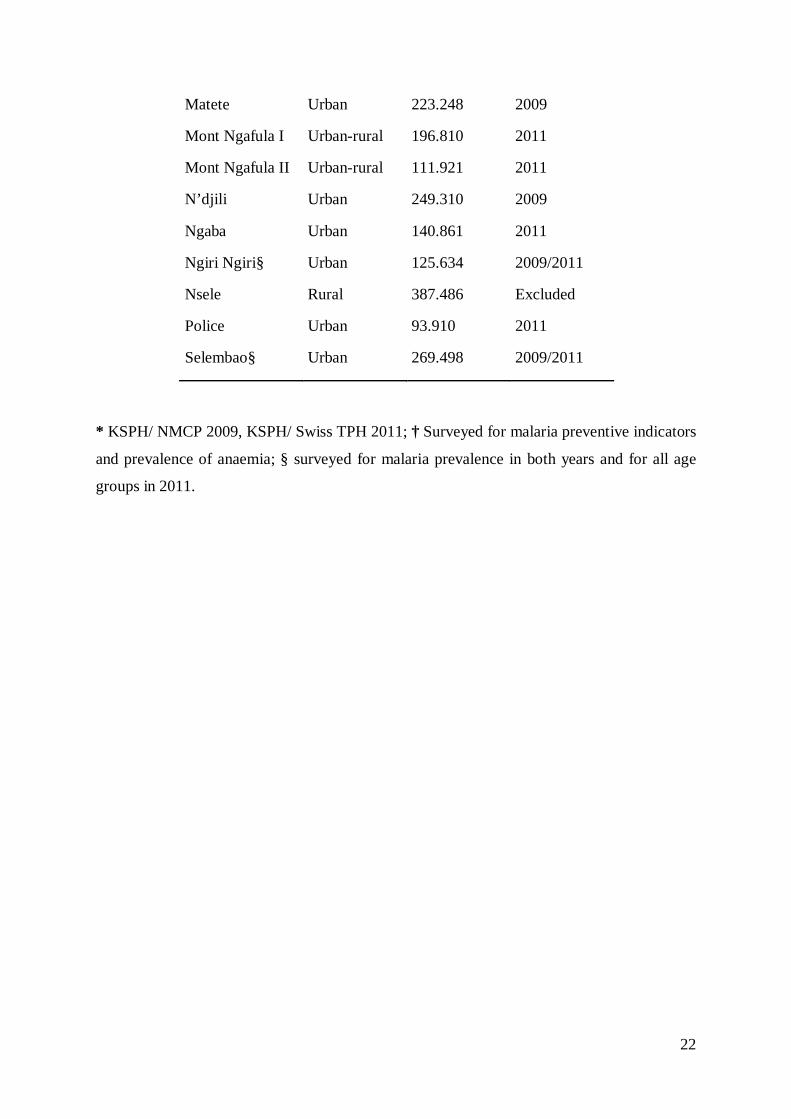
22
Matete Urban 223.248 2009
Mont Ngafula I Urban-rural 196.810 2011
Mont Ngafula II Urban-rural 111.921 2011
N’djili Urban 249.310 2009
Ngaba Urban 140.861 2011
Ngiri Ngiri§ Urban 125.634 2009/2011
Nsele Rural 387.486 Excluded
Police Urban 93.910 2011
Selembao§ Urban 269.498 2009/2011
* KSPH/ NMCP 2009, KSPH/ Swiss TPH 2011; † Surveyed for malaria preventive indicators
and prevalence of anaemia; § surveyed for malaria prevalence in both years and for all age
groups in 2011.

23
Data collection
Household survey questionnaire
In 2009, survey data were collected using a paper-based questionnaire. In 2011, survey data
were collected using smartphone technology. For the 2011 survey, a validated electronic
semi-quantitative questionnaire was developed on an HTC smartphone running Google’s
Android operating system. Eight teams of three field workers (one interviewer, one
laboratory technician, one community liaison person) were trained in using the electronic
questionnaire, in general interviewing skills and in administering informed consent during
simulated interviews sessions. Each of the eight teams visited, on average, 25 households per
day in each selected HA. The 2011 questionnaire was a simplified version of the one used in
2009, which was adapted from the standard Malaria Indicator Survey Household
Questionnaire from the Roll Back Malaria Partnership (www.RBM.org). All questions
retained from the 2009 survey form were kept as they were in 2011 to ensure comparability
between both surveys. The questionnaire was developed in French with oral translation into
Lingala (the second lingua franca in Kinshasa) and field tested prior to the survey.
Prior to administering the questionnaire, a signed informed consent form was obtained from
the head of the household or his/her representative. Participation was entirely voluntary.
Respondents were asked about demographic information of usual residents, educational level,
factors indicating the household’s socio-economic status, household construction material,
presence and type of mosquito bed net (verified by direct observation), use of mosquito bed
net and ITN in the night prior to the survey, history of fever (past 2 weeks), whether fever
was present on the day of the survey and health seeking behaviour in case of a fever episode.
During the 2011 survey, the coordinates (longitude and latitude) of all investigated
households were recorded on-site using the integrated Global Positioning System (GPS) of
the data collection devices. Households were revisited if no one was available for interview
on the first attempt; if no one was available after two attempts, the interviewer continued to
the next randomly selected household on the list until the desired number of households was
obtained.

24
Blood testing
For each selected participant who gave signed informed consent, the same laboratory
procedures as in 2009 were adopted during the 2011 survey. They included measuring
axillary temperature with a digital thermometer, collecting peripheral blood by standard
finger prick to test for malaria parasites with an RDT for Plasmodium falciparum-specific
histidine rich protein 2 (HRP2) and other Plasmodium species (Pan pLDH for P. vivax, P.
malariae and P. ovale) (Paracheck pf in 2009 and SD Bioline Malaria Antigen P.f/Pan in
2011) and assessing Hb level using a blood haemoglobin photometer (HemoCue 201 plus,
Ängelholm, Sweden). In two HZ in 2011, Selembao and Ngiri Ngiri, individuals of all ages
(not only children) were surveyed. RDT were used for on–site diagnosis of malaria and
treatment with artesunate-amodiaquine, the official first-line malaria treatment at the time of
the survey, was offered as needed. The HemoCue was validated by running a weekly high
and low Hb liquid control (HemoCue – HemoTrol).
Statistical analysis
To ensure consistency and integrity of data collected during the 2009 survey, all paper forms
were rechecked by team supervisors in the field at the end of each day. Incomplete entries
were sent back to be filled the next day. Questionnaires were first checked for completeness,
and the information was manually coded and entered using EpiData and crosschecked using
EpiInfo (v. 6.04). Statistical analyses were performed using SPSS software for Windows
(version 16.0), NCSS, and STATA (version 10).
Data collection devices used in the 2011 survey (HTC phones) were equipped with Open
Data Kit (ODK) software (University of Washington & Google Foundation) to allow for data
entry in the field. ODK programming also allowed for systematic range and consistency
checks. Data in xml format were downloaded every evening from the HTC smartphones and
then converted on the ODK Aggregate Server into tabular format (ODK aggregate).
Statistical analyses were performed using Stata version 12.1 (Stata Corp, College Station, Tx,
USA). Analysis and mapping for the 2011 survey were based on geo-referenced prevalence
data at the level of the HA. Since households could not be georeferenced in 2009, HA spatial
coordinates were assigned to the HA’s mean malaria prevalence. Maps were produced using
ArcGIS version 10.0 (Environmental Systems Research Institute Inc. Redlands, USA).

25
A centroid for every HA was first generated (for 2009 the centroid was generated at the
centre of the HZ, since GPS coordinates of the households were not collected). The
standardized prevalence data were then assigned to the centroids of the surveyed health zone.
The next step involved using the IDW interpolation to get prevalence estimates at un-
surveyed HZ. Lastly, the interpolated prevalence estimates were extracted using the centroids
(points data) of the HZ. These estimates were subsequently used map out the prevalence at
HZ level (polygons data). Boundaries (shape files) were initially available at the level of the
HZ only, from the Health Monitoring Information System Unit of the Ministry of Health
(MoH). By using images developed by the Japan International Cooperation Agency (JICA)
and through collaborating with a team of experts from the Institut géographique du Congo
(IGC), it was possible to develop shape files at the level of the HA. The most eastern rural
HZ (Maluku I and II and Nsele) were excluded from the final map due to the great effort that
drawing boundaries in remote HA would have entailed. This was beyond the means and the
scope of this study.
Ethical consideration
For both surveys, ethical clearance was obtained from the Ethics Committee of the KSPH, at
the University of Kinshasa. In addition, the 2011 survey received authorization from the
ethical committees in Basel (Ethikkommission beider Basel, Basel-Stadt) as well as clearance
from Swiss TPH’s internal research commission.
Signed informed consent to participate was obtained from parents or guardians on behalf of
the enrolled children or by the adult participants themselves. Precautions to minimise the risk
of secondary infection during blood collection were taken. All tested participants with a
positive RDT but no evidence of severe illness were diagnosed as having uncomplicated
malaria and given a voucher for treatment, free of charge, as per the DRC national malaria
treatment policy (artesunate-amodiaquine or artemether-lumefantrine), at the nearest health
facility. Drugs were provided to the relevant facilities one day before the household visits
started in the area, to ensure drug availability for treatment. Participants diagnosed with
severe anaemia and those with severe illnesses were excluded from the study and
immediately referred to the nearest health facility for diagnosis and management, as
recommended by national guidelines.

26
3.4. Results Characteristics of the study population
Household and individual characteristics of the study populations in 2009 and 2011 are
shown in Table 3-2. A total of 3,896 households distributed throughout 15 HZ were included
in the 2009 survey, while 2,512 household in 25 HZ were sampled in 2011. The age
distribution of individuals was similar between surveys, as were the proportions of men and
women. Overall, 27,371 people were surveyed in 2009, including 12,761 men and 14,610
women. Of these, 47.1% were under 15 years of age, while the percentage of children 6–59
months was 24%. In addition, 302 pregnant women also participated. The 2011 survey
included 15,005 people; 6,770 men and 8,235 women. Of these, 44.7% were under 15 years
of age, while the percentage of children 6–59 months was 24.9%.
Table 3-2: Characteristics of study households and individuals in the 2009 and 2011 surveys, Kinshasa, Democratic Republic of Congo.
Survey 2009
Survey 2011 Household characteristics
Number of households sampled 3896 2512 Mean (SD) household size 7.1 5.9 (2.1) Individual characteristics Number of persons in sampled households 27371 15005 Median Age years (90% central range) - 17 Age groups < 6 months - 0.9 6-59 months (%) 24.0 24.9 5-9 years (%) 13.1 10.9 10-14 years (%) 10.0 8.9 15-19 years (%) 9.2 8.1 ≥ 20 years (%) 43.7 46.2 Proportion of females (%) 53.4 54.9

27
Prevalence of P. falciparum by health zone
Table 3-3 gives the proportion of children 6–59 months who tested positive for malaria with
RDT, by sampled HZ. A total of 3,319 children 6–59 months in 10 HZ were tested for
malaria by RDT in the 2009 survey, whereas 3,342 were tested in 25 HZ in 2011. Prevalence
of confirmed malaria was 6.4% (5.6–7.4) at the end of the 2009 dry season, ranging from
1.0% (0.3–2.6) in Ngiri Ngiri (urban centre) to 14.1% (10.6–18.2) in Selembao (peri-urban).
At the end of the 2011 wet season, malaria prevalence was 17.0% (15.7–18.3), ranging from
0.7% (0.0–4.1) in Kinshasa and Lingwala (urban centre) to 46.0% (37.1–55.1) in Biyela
(peri-urban). P. falciparum accounted for 52% (95% CI: 47.4-55.8) of infections in 2011
survey, non-falciparum infections for 0.3% (95% CI: 0.0-1.3) while mixed infection (were
not distinguished) prevalence was 48% (95% CI: 43.9-52.3).
In the two HZ sampled in both 2009 and 2011, prevalence of malaria in children aged 6–59
months was 1.0% (0.3–2.6) and 0.8% (0.0–4.2) in Ngiri Ngiri, and 14.1% (10.6–18.2) and
26.8% (19.9–34.7) in Selembao. Age-specific rates (Figure 3.1) show that prevalence in Ngiri
Ngiri in 2011 was highest among individuals aged 15–19 years (14.0%), followed by the
groups aged 5–9 years (4.8%), > 20 (4.2%), 10–14 (1.4%) and 6–59 months (0.0%). In
Selembao, malaria prevalence was highest among the groups aged 5–9 (34.2%) and 15–19
(28.3%) years, followed by those 6–59 months (26.2%), 10–14 years (25.0%) and over 20
years (17.6%). All-ages malaria prevalence was 3.8% (2.4–5.8) in Ngiri Ngiri and 23.8%
(20.4–27.6) in Selembao.
To prepare the data for mapping, direct standardisation was used to make prevalence rates of
malaria comparable between surveys, accounting for the two different years and seasons. The
standardisation was done according to the following formula:
28
Ps =p1n1p1 n1å + p2n2 p2 n2å
( n1å + n2 )å
where, Ps is the overall standardized prevalence for surveys 2009 and 2011, p1 is the
prevalence rate in survey 1 (2009), p2 is the prevalence rate in survey 2 (2011), n1 is the
number of study participants in survey 1, n2 is the number of study participants in survey 2,
p¯1 is the overall prevalence rate for survey 1, p¯2 is the overall prevalence rate for survey 2
and ∑ is the total number of study participants (per survey).
Figure 3-1: Plasmodium falciparum malaria prevalence (RDT positivity) by age group for
the health zones of Selembao and Ngiri Ngiri
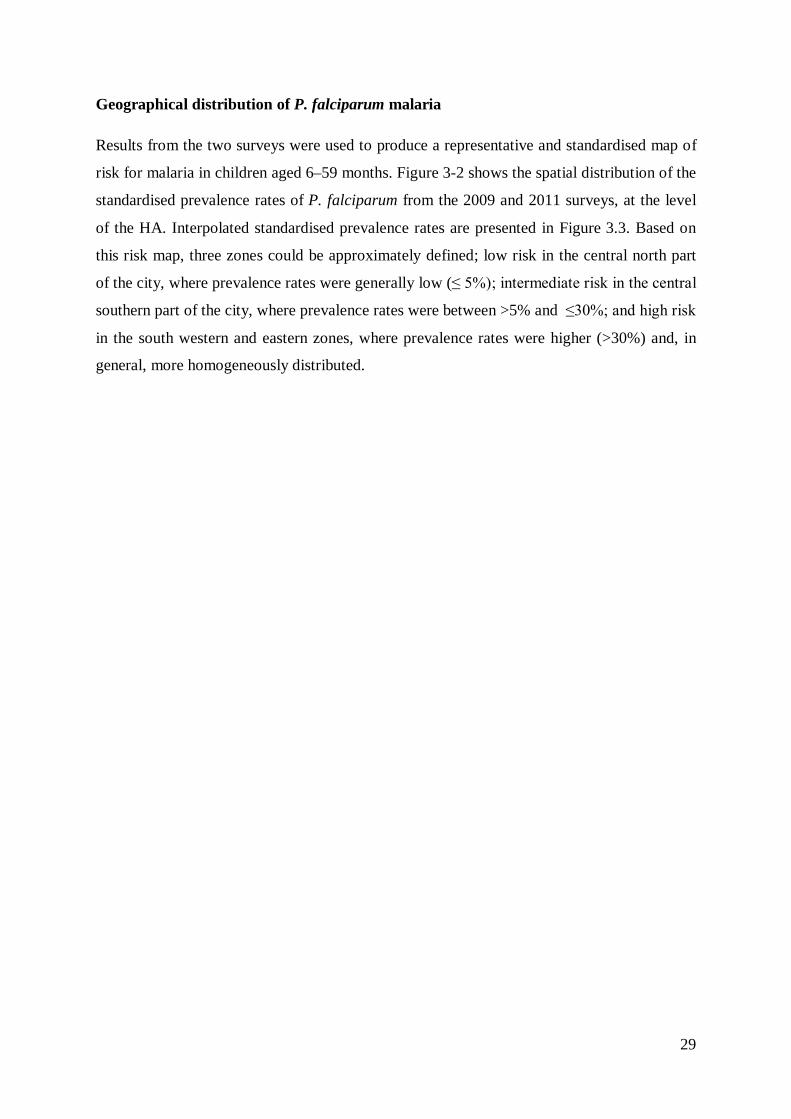
29
Geographical distribution of P. falciparum malaria
Results from the two surveys were used to produce a representative and standardised map of
risk for malaria in children aged 6–59 months. Figure 3-2 shows the spatial distribution of the
standardised prevalence rates of P. falciparum from the 2009 and 2011 surveys, at the level
of the HA. Interpolated standardised prevalence rates are presented in Figure 3.3. Based on
this risk map, three zones could be approximately defined; low risk in the central north part
of the city, where prevalence rates were generally low (≤ 5%); intermediate risk in the central
southern part of the city, where prevalence rates were between >5% and ≤30%; and high risk
in the south western and eastern zones, where prevalence rates were higher (>30%) and, in
general, more homogeneously distributed.

30
Figure 3-2: Standardized Plasmodium falciparum malaria prevalence in children aged 6-59 months, by health area. The 2009 data for the health zones of Bumbu, Kingabwa, Kisenso, Kokolo and Ndjili were only available at the level of the health zones.
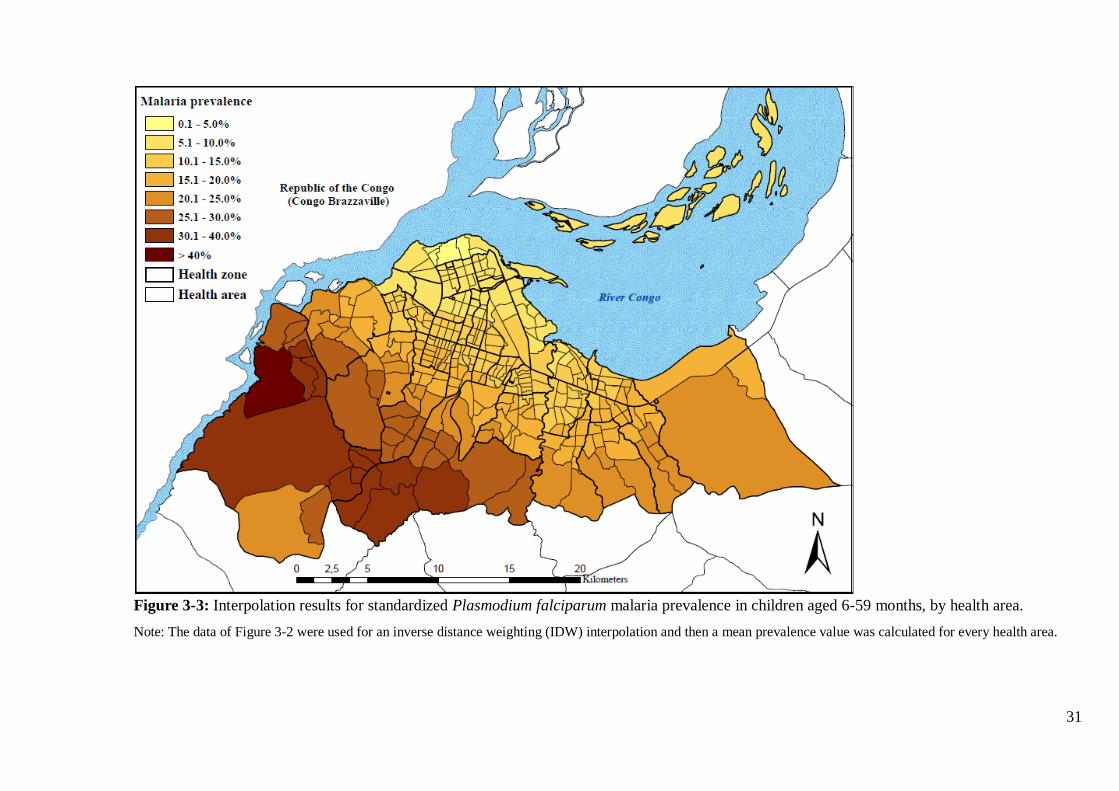
31
Figure 3-3: Interpolation results for standardized Plasmodium falciparum malaria prevalence in children aged 6-59 months, by health area. Note: The data of Figure 3-2 were used for an inverse distance weighting (IDW) interpolation and then a mean prevalence value was calculated for every health area.
32
Geographical distribution of anaemia
A total of 4,164 and 3,353 children aged 6–59 months were tested for anaemia in the 2009
and 2011 surveys, respectively. The mean prevalence of anaemia (Hb < 11g/dl) was similar
between surveys: 65.1% (63.7–66.6) in 2009 and 64.2% (62.6–65.9) in 2011. Results also
show that the prevalence of moderate (7.0-9.9 g/dl) and severe (< 7.0 g/dl) anaemia was
34.2% and 1.9% in 2009, and 30.1% and 1.9% in 2011 (Table 3).
The formula given above was used to standardise the prevalence of anaemia and of severe
anaemia. The spatial distribution of the standardised prevalence of anaemia for both surveys
is shown in Figure 3-4. The risk of anaemia was consistently high across the entire study
area, with maximal mean prevalence rates (> 70%) in the HZ of Kingabwa, Matete and
Biyela. A map showing the standardised prevalence of severe anaemia is presented in Figure
3-5.

33
Figure 3-4: Standardized prevalence of anaemia (Hb<11g/dl) in children aged 6-59 months, by health area, surveys 2009 and 2011.

34
Figure 3-5: Standardized prevalence of severe anaemia (Hb<7g/dl) in children aged 6-59 months, by health area, surveys 2009 and 2011.

35
History of fever
The proportion of children aged 6–59 months reporting a history of fever in the two weeks
preceding the survey was 13.2% (12.5–14.3) in 2009 and 22.3% (20.8–23.4) in 2011. On the
day of the 2011 survey (data not available for 2009), 3.2% (106/3348) were febrile (defined
as temperature > 37.5 C). The positive predictive value (PPV) of history of fever among
children with a positive RDT was 29.7% (26.3–32.7) in 2011. Health seeking behaviour in
case of fever was high in 2011 (data not available for 2009): overall, 91.4% (770/842) of
children sought some type of care. In all, 53.9% sought modern treatment at home by a
family member, whereas 36.1% were taken to a health facility. Very few (0.5%) made use of
traditional medicine. Private facilities were the most common provider of treatment among
those who sought care outside the home, covering 65.4% of the cases, whereas 22.9%
consulted a public facility and 11.8% consulted a confessional structure. In case of home
treatment, drug outlets represented the principal source of treatment (96.3%). Unfortunately,
only 4.3% of the antimalarials purchased were the recommended combination of artesunate-
amodiaquine. As a result, only 3.6% received the recommended treatment at home within the
24 hours. In 66.5% of fever cases, treatment was sought within 24 hours regardless of
whether treatment was recommended or not.
36
Table 3-3: Clinical outcomes, by health zones
Health zone Malaria prevalence in children aged 6-59 months Anaemia prevalence in children aged 6-59 months Children <5 years with a fever episode in the 2 weeks before the
survey Survey 2009 Survey 2011 Standa
rdised prevale
nce
Survey 2009 Survey 2011 Survey 2009 Survey 2011 (dry season) (wet season 2011) (dry season) (wet season 2011) (dry season) (wet season 2011)
% [95% CI] N % [95% CI] N % % % N % % N % N % N severe
(<7g/dl) any
(<11g/dl) severe
(<7g/dl) any
(<11g/dl)
Bandalungwa 1.5 [0.2-5.3] 134 1.0 0.7 51.5 134 22.8 149 Barumbu 2.4 [0.5-6.9] 125 1.7 0.8 57.8 128 19.6 143 Binza Météo 24.8 [17.0-34.0] 109 17.1 1.3 70.6 238 1.7 65.3 118 20.4 339 24.4 131 Binza Ozone 19.1 [12.9-26.7] 136 13.2 1.5 66.2 136 19.0 158 Biyela 46.0 [37.1-55.1] 126 31.7 4.5 64.9 313 2.4 78.6 126 9.5 422 24.7 150 Bumbu 7.4 [4.7-10.9] 299 13.6 3.6 69.2 308 9.3 407 Gombe 11.5 [6.7-18.0] 139 7.9 3.6 65.5 139 29.6 159 Kalamu I 16.2 [8.4-27.1] 68 11.2 0.0 73.5 68 28.8 73 Kalamu II 2.5 [0.8-5.7] 200 1.7 1.5 56.7 203 19.5 221 Kasa Vubu 2.8 [1.2-5.4] 286 5.1 1.6 55.4 242 10.2 352 Kikimi 32.8 [24.9-41.6] 131 22.6 2.3 64.9 131 18.5 151 Kimbanseke 36.1 [27.9-44.9] 133 24.9 2.3 75.9 133 22.7 154 Kingabwa 2.6 [1.2-4.9] 345 4.8 1.5 74.3 315 9.8 386 Kingasani 25.0 [18.3-32.7] 152 17.2 3.3 76.2 151 24.6 175 Kinshasa 0.7 [0.0-4.0] 136 0.5 1.5 61.2 134 30.7 150 Kintambo 11.7 [7.0-18.1] 145 8.1 1.5 68.2 132 24.8 165 Kisenso 11.2 [8.0-15.1] 331 20.5 1.0 69.3 267 8.3 348 Kokolo§ 9.3 [6.5-12.9] 353 17.0 0.6 66.7 36 10.3 39 Lemba 7.7 [3.8-13.7] 130 5.3 1.8 59.4 276 3.1 53.8 130 25.8 357 15.3 150

37
Limete 17.3 [11.3-24.8] 133 11.9 1.8 69.5 334 3.0 72.2 133 14.3 399 29.1 148 Lingwala 0.7 [0.0-4.1] 135 0.5 0.7 63.0 135 27.3 154 Makala 17.9 [11.8-25.5] 134 12.3 4.5 69.4 134 20.6 155 Maluku II* 8.0 [5.0-12.0] 261 14.7 1.2 54.2 260 11.1 342 Masina I 12.3 [7.3-19.0] 138 8.5 0.7 66.7 138 20.2 163 Masina II 24.8 [17.7-33.0] 133 17.1 2.5 57.6 321 2.3 60.9 133 15.6 458 21.7 161 Matete 3.5 [1.8-6.0] 344 6.4 2.1 74.0 334 6.6 394 Mont Ngafula I 33.6 [25.7-42.2] 134 23.2 3.7 69.4 134 20.8 154 Mont Ngafula II 35.3 [27.3-44.1] 133 24.4 3.0 68.4 133 19.0 158 Ndjili 6.3 [4.0-9.3] 366 11.5 2.4 61.3 287 16.7 412 Ngaba 7.5 [3.6-13.3] 134 5.2 1.5 50.7 134 28.8 153 Ngiri Ngiri 1.0 [0.3-2.6] 387 0.8 [0.0-4.2] 124 1.5 1.3 62.4 314 0.8 58.8 131 15.3 428 12.9 140 Police§ 17.0 [11.1-24.5] 135 11.7 0.7 53.3 135 13.4 164 Selembao 14.1 [10.6-18.2] 347 26.8 [19.9-34.7] 145 23.6 1.9 67.1 319 1.3 65.3 150 15.2 387 19.1 162 TOTAL 6.4 [5.6-7.4] 3319 17.0 [15.7-18.3] 3342 11.7 1.9 65.1 4164 1.9 64.2 3353 13.2 5470 22.3 3841
* The HZ of Maluku II although surveyed in 2009 was excluded from the final risk map since the choice was to map only HZs of non-rural character.
§ The HZs Kokolo and Police consist of military and police camps scattered in the city.

38
Coverage of malaria control measures
Eight months after the 2009 distribution campaign, ITN coverage (measured by the
possession of at least one ITN per household) reached 78.7% (77.4–80.0). In 2011, it was
57.7% (56.0–59.9). In 2009, coverage ranged from 51.7% in Biyela (peri-urban) to 92.7% in
Maluku II (peri-urban) (Table 3-4), with a mean number of 2.0 ITNs per household. In 2011,
ITN coverage ranged from 34.4% in Biyela to 81.8% in Kinshasa, with a mean number of 1.9
ITN per household (1.1).
The most common reasons for not owning an ITN, as given by households in both the 2009
and 2011 surveys, included not having obtained the ITN during the mass distribution
campaign (38.7% and 23.8%), either because they were absent (26.6%, 2009) during the
campaign or because the stock had been sold out (3.8% and 18.8%). A high proportion of
respondents reported having discarded or destroyed their ITN because of rumours (7.4% and
23.8%). Other reasons given were heat (2.4% and 10.6%) and the absence of mosquitoes at
home (9.4% in 2009).
The proportion of respondents who reported that their child slept under an ITN the night
before the survey decreased from 65.8% (63.5–66.0) in 2009 to 45.0% (43.6–46.8) in 2011.
Figures 3-6 and 3-7 show the geographical distribution of ITN usage among children under
five, geo-referenced and mapped at the level of the HA for both surveys. Use rate decreases
progressively towards the periphery in both surveys, with markedly lower use rates (<30%) in
the south-eastern and western health zones of Biyela (30.8%, 2009; 17.3%, 2011), Selembao
(53.3% 2009; 28.4% 2011), Kikimi (27.2% 2009) and Kimbanseke (20.1% 2011). A higher
proportion of pregnant women, 83.1% (77.5–87.7), reported using an ITN in 2009, than in
2011, were reported use decreased to 43.1% (37.5–48.9). Again, the HZ on the outskirts of
the city showed the lowest use rates.

39
Figure 3-6: Percentage of children <5 years having slept under an ITN the night before the survey in 2009, by health area.
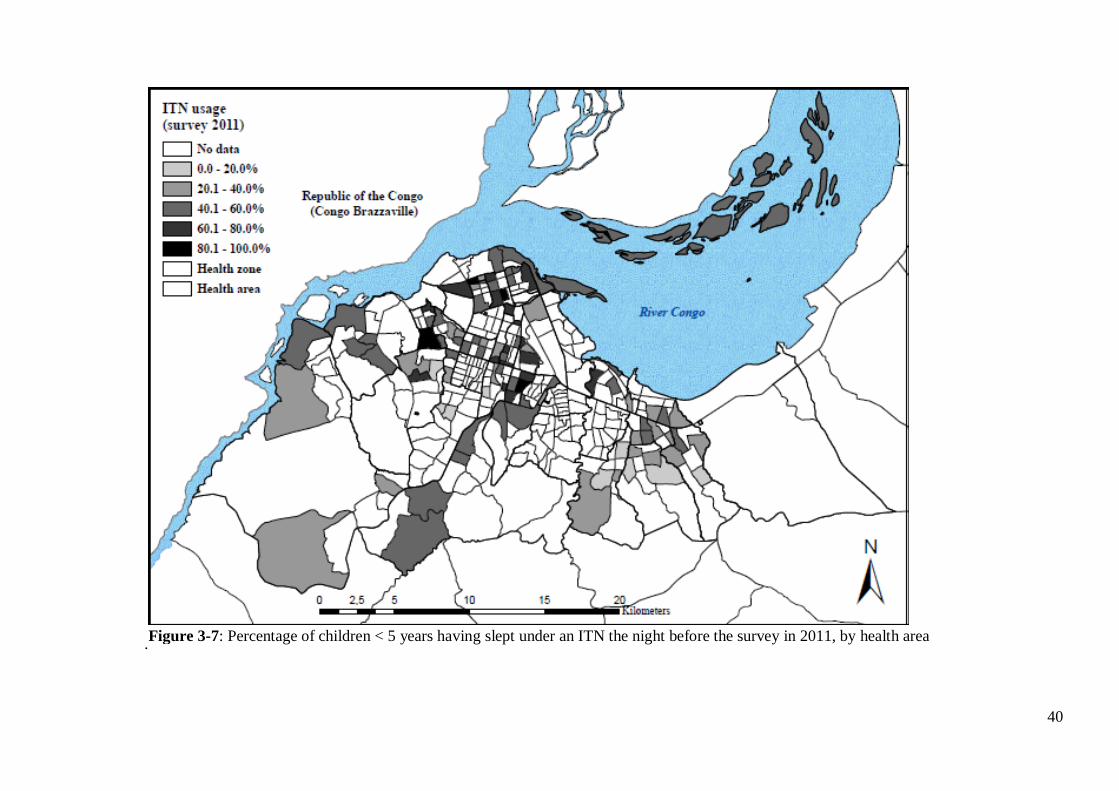
40
. Figure 3-7: Percentage of children < 5 years having slept under an ITN the night before the survey in 2011, by health area
41
3.5. Discussion
Kinshasa falls within the perennial transmission in the classification of the Mapping Malaria
Risk in Africa (MARA) project. This study created the first malaria risk map at the scale of a
health area, the lowest level of the health system in DRC. Although the mean endemicity level
seems to have declined over the last 30 years in Kinshasa, the results from the 2009 and 2011
cross-sectional surveys show that malaria was still a public health concern (Ngimbi et al.
1982; Mulumba et al. 1990; Kazadi et al. 2004). The geographic pattern of endemicity is
comparable to that identified in earlier studies done in Kinshasa (Ngimbi et al. 1982;
Mulumba et al. 1990; Kazadi et al. 2004). Prevalence is clearly highest in the more densely
populated and less urbanised districts in the periphery, although marked variations in rates are
apparent, even over a few kilometres. These findings are consistent with a recent meta-
analysis that used data on the prevalence of malaria parasitaemia to document an analogous
situation in other cities in Sub-Saharan Africa (Pond 2013). A similar reduction in the annual
P. falciparum entomological inoculation rates (APfEIR) has been observed in the more
urbanised central areas, with a tendency to increase gradually towards the peri-urban areas
(Hay et al. 2000; Robert et al. 2003; Keiser et al. 2004). The relative reduction in the APfEIR
in urban areas was also reported in Kinshasa and in Brazzaville (Trape 1987; Karch et al.
1992; Coene 1993). Trape JF et al. suggested a relationship between levels in transmission in
certain districts of Brazzaville and prevalence of malaria reported (Trape 1987). The existence
of a linear correlation between APfEIR and prevalence was also confirmed by Hay SI et al.
(Hay et al. 2005).
In this study, the overall standardised malaria prevalence was 11.9% in children 6–59 months,
ranging from 0.5% in the downtown health zones of Kinshasa and Lingwala, to 31.7% in
Biyela, a semi-rural peripheral district extending south east. Results also show that spatial
heterogeneity is high in the central and northern urbanised HZ, whereas in the western and
south-eastern HZs, more homogeneous levels of high risk can be found (Figure 3-2). It is
likely that the proximity to productive breeding sites could account for the uneven distribution
of malaria risk, together with socio-economic stratification and level of control measures
(Machault et al. 2009; Clark et al. 2008). Kazadi et al. observed that initial urbanisation might
increase levels of malaria transmission through increased human density and the creation of
breeding sites favourable to Anopheles gambiae, the main local vector (Coene 1993; Kazadi
et al. 2004). In a second phase, the densification of human habitations reduces potential
mosquito breeding sites and hence transmission levels.

42
In Kinshasa, the increase in the density of dwellings in older urban districts has progressively
eliminated the last remaining open spaces, contributing to the scarcity of Anopheles breeding
sites through elimination and pollution. However, exceptions exist, especially where urban
agriculture and gardens persist. In particular, the districts extending towards the south-east
and west maintain a semi-rural character. Various studies have documented the presence of
higher prevalence or transmission rates in areas close to agriculture fields (Afrane et al. 2004;
Matthys et al. 2006; Clark et al. 2008; Klinkenberg et al. 2008; Stoler et al. 2009; Yadouléton
et al. 2010). Kinshasa is crossed by rivers from north to south, creating large flood zones
where much of the gardening is practised. This characteristic is particularly evident in the
large semi-rural areas south west of the boulevard Lumumba, encompassing the health zones
of Kingasani, Biyela, Kimbanseke and Kikimi. The areas favour Anopheles sp. breeding sites
and are consistent with the more homogeneous transmission pattern observed in the areas on
the outskirts of the city, compared to the more urbanised zones.
Additional factors, such as the use of personal protection against mosquitoes or socio-
economic status, should also be considered as important determinants explaining the
distribution of disease prevalence. A spatial regression analysis linking malaria prevalence to
risk factors for malaria in Kinshasa will be published separately (Ferrari et al. 2016).
Not surprisingly, the age groups with the highest prevalence, independent from the level of
endemicity in both urban and semi-rural areas (Ngiri Ngiri and Selembao), were those aged
5–9 and 15–19. Hence, in Kinshasa, malaria infections seem to occur more frequently late in
childhood. This could be in part explained by the age specific ITN usage across age groups,
with highest use in younger children in the low endemicity setting (percent of usage in Ngiri
Ngiri 49% compared to 28% in Selembao) as compared to lower and similar utilization rates
among age groups in the high transmission setting (Ferrari et al. 2016). Higher malaria
prevalence rates in older children were also found in school surveys carried out in the 1980s
in Kinshasa and in Brazzaville. At that time, the finding was attributed to the increased use of
antimalarials in early childhood (Trape 1987; Kazadi et al. 2004).
A concerted effort to scale-up ITN coverage through a free distribution in Kinshasa led to an
ITN ownership rate of 78.7% of households in 2009. This represented a 395% increase in
household possession of ≥1 ITN over the 2007 estimate of only 15.9% (DHS 2007).
However, 24 months after the distribution campaign, ITN ownership had decreased to 57.7%
of households.

43
Clearly, this points to the need for stronger programmes for routine ITN distribution as it
occurs in most endemic settings, in addition to the campaigns, (Grabowsky et al. 2007).
The prevalence of anaemia was high in 2009 (65.1% in children 6 to 59 months) and in 2011
(64.2%). This is consistent with the 69.2% prevalence reported by the DHS 2007 (DHS
2007). Furthermore, the distribution of anaemia across Kinshasa was highly heterogeneous as
shown in Figure 4, and the absence of a spatial trend seems in favour of the role of additional
factors other than malaria in the aetiopathogenesis of this condition. Multiple factors account
for anaemia and their contributions can vary according to the setting (Hall et al. 1982). In
Kinshasa, 23% and 9% of children suffer from chronic and severe forms of malnutrition
(DHS 2007) and sickle cell anaemia is widespread (Tshilolo et al. 2009).
The maps we present for different variables reflect survey results from two distinct time
periods and seasons. Since malaria transmission is neither constant throughout the year nor
between years, this has likely introduced some mistakes. To account for these differences, we
tried standardising prevalence rates, but that is an imperfect means of accounting for such
differences. Moreover, surveys were based on detection of cases of uncomplicated malaria
and, therefore, it is not possible to draw strong conclusions about the prevalence of anaemia,
which is more often related to severe malaria.
3.6. Conclusions
This study provides the first comprehensive risk map of malaria at the level of the health areas
in Kinshasa, a mega-city in a highly endemic malarious zone. Overall malaria prevalence has
undoubtedly decreased over the last 30 years, but it is impossible to quantify the effect given
the lack of representative historical data. As expected, prevalence rates were lower in the
central urban districts compared to the more peripheral and more rural districts (Kazadi et al.
2004). The penetration of malaria control measures, especially ITN, remains insufficient and
is less successful in less developed and less accessible HZ on the outskirts of the city.
Hopefully, this gap can be closed in the years to come with renewed efforts by the National
Malaria Control Programme and its partners. Despite the methodological limitations, the risk
map provides a good baseline assessment against which to assess the effect of future control
efforts.
44
4 Identifying risk factors for Plasmodium infection and anaemia
in Kinshasa, Democratic Republic of Congo
Giovanfrancesco Ferrari1,2, Henry M Ntuku3, Amanda Ross1,2, Sandro Schmidlin1,2, Didier M
Kalemwa1,2, Antoinette T Kitoto3, Christian Lengeler1,2
1 Swiss Tropical and Public Health Institute, P.O. Box, 4002, Basel, Switzerland
2 University of Basel, Basel, Switzerland
3 Kinshasa School of Public Health, Kinshasa, Democratic Republic of the Congo
This paper has been published in the Malaria Journal 2016, 15:362.

45
4.1 Abstract
Background
There is little data on the risk factors for malaria infection in large cities in central Africa and
in all age groups. There may be different associations with the risk factors for areas with
different malaria transmission intensities such as the effect of fever or age. This study aimed
at identifying risk factors associated with Plasmodium infection and anaemia among children
6-59 months and individuals aged older than five years in Kinshasa, a large city with
heterogeneity in malaria prevalence.
Methods
This study analysed data from 3342 children aged 6-59 months from 25 non-rural health
zones (HZ) and for 816 individuals aged older than five years from two HZ in Kinshasa (non-
rural), collected during a cross sectional malaria survey in 2011. Logistic regression with
random effects was used to investigate predictors for malaria and anaemia. Differences in risk
factors in areas with a prevalence of less than 10% and 10% or greater were investigated.
Results
There was evidence of a different age-pattern in the two transmission settings. For children
under five years, the highest prevalence of malaria was observed in the 48-59 months group in
both transmission settings but it increased more gently for the lower transmission HZs
(p=0.009). In a separate analysis in children over five years in two selected HZ, the peak
prevalence was in 5-9 years old in the higher transmission setting and in 15-19 years old in
the lower transmission setting. Reported fever was associated with malaria in both
transmission strata, with no evidence of a difference in these associations (p=0.71); however
in children older than five years there was a significant interaction with a stronger association
in the low transmission HZ. Insecticide-treated net (ITN) use was associated with a lower risk
of malaria infection in children 6-59 months in the high transmission HZ. Similar estimates
were found in children over five years and the lower transmission HZ but the associations
there were not significant. There was no evidence of a difference in these associations by
strata. The risk of anaemia decreased with increasing age in all strata, whereas it increased
with malaria infection and reported fever. ITN use did not show evidence of protection
against anaemia. Low socio-economic status was associated with malaria in high transmission
setting in children 6-59 months and anaemia in low transmission setting.
46
Conclusions
This study shows that in areas of low transmission in Kinshasa, the peak prevalence occurs in
older age groups however ITN use was highest in children under five years. Targeted
distribution of ITN to all age groups should be continued. For most risk factors, there was no
evidence of an interaction with transmission intensity however the associations with age and
with fever in the last two weeks did vary significantly.
Keywords: Malaria, Malaria risk, Anaemia, Fever, ITN use, ITN ownership, Democratic
Republic of Congo, Kinshasa
47
4.2 Background
Urbanization, widespread use of malaria control measures and effective treatment in recent
years have had a significant impact in reducing the prevalence of malaria in many African
cities, as well as contributing to the more heterogeneous risk in malaria observed in many
urban areas (Staedke et al. 2003; Keiser et al. 2004; Caldas de Castro et al. 2004; Wang et al.
2005; Matthys et al. 2006). In Kinshasa, the capital of the DRC malaria has considerably
decreased during the past thirty years. A survey conducted in 2011, showed a prevalence of
17% among children 6-59 months of age, and the existence of a gradient of prevalence from
the centre (lower risk) to the periphery (higher risk) (Mulumba et al. 1990; Ngimbi et al.
1982; Kazadi et al. 2004; Ferrari et al. 2016). Moreover, traditionally attention has focused on
high risk groups, and little attention has been put on older children and adults. Understanding
the complex heterogeneity of risk factors that can contribute to increased risk of malaria in
urban settings across different age groups will enable a more effective use of control
measures.
In addition, many studies have shown that control of malaria can reduce the prevalence of
childhood anaemia (Premji et al. 1995; Premji et al. 1995; Korenromp et al. 2004; Lengeler
2004; Mathanga et al. 2010). Anaemia, in particular due to iron deficiency, is a major public
health challenge in paediatric populations in sub-Saharan Africa, and in DRC it is among the
top five leading causes of years lived with disability (YLDs) (GBD 2010). In Kinshasa the
current rate of anaemia (Hb<11 g/dl) among pre-school aged children was 65% in 2011
(Ferrari et al. 2016).
The present study investigated individual and household risk factors for Plasmodium
falciparum infection and anaemia in Kinshasa in children aged 6-59 months in 25 non-rural
HZ, as well as in individuals aged five years and older in a separate analysis in two HZ.
48
4.3 Methods
Study area and recruitment of study participants
This study used cross-sectional data from a survey conducted in 2011 in Kinshasa, the capital
city of the DRC, which is described in detail in Ferrari et al. 2016 (Ferrari, et al. 2016). In
summary, data collection took place from April to June 2011, before the end of the rainy
season and included 2512 households selected through a multi stage sampling procedure to
obtain a sample of 3342 children aged 6 to 59 months from 25 health zones (HZ) and 816
individuals aged five years or older from two HZ selected out of the 25 (Ngiri Ngiri and
Selembao). The HZ represents the primary operational unit of the health system in DRC, and
covers about 150.000 inhabitants. It includes a general referral hospital, health centres and
lower-level health facilities. Each HZ is further divided in health areas. In Kinshasa malaria
transmission is ensured by Anopheles gambiae s.l., and usually peaks during the long rainy
season from September to May (Coene 1993). From each participant a finger-prick blood
sample was collected to test for malaria by rapid diagnostic test (RDT) (SD Bioline Malaria
Antigen P.f/Pan), providing an immediate on-site diagnosis. The level of haemoglobin (Hb)
was measured with a HemoCue 201 plus+ photometer (Ångelholm, Sweden). Axillary
temperature was measured using a digital thermometer and the individual’s history of fever in
the preceding two weeks was also recorded. A standardized electronic survey questionnaire
was administered to all heads of eligible household using an HTC smartphone running with
Android OS. The survey questionnaire was an adaptation of the standard Malaria Indicator
Survey Questionnaire from the Roll Back Malaria Partnership (www.RBM.org) created with
the Build component of the Open Data Kit (ODK) software (University of Washington &
Google Foundation). Respondents were asked about demographic information of the
residents, educational level, assets owned (such as television and bicycle), presence of
insecticide treated bed net (ITN) and use of ITN the night prior to the survey.
Assessing risk factors of Plasmodium infection and anaemia
The analysis was stratified according to malaria transmission intensity, based on the
prevalence of malaria infection measured in 2011 among children 6-59 months (Ferrari et al.,
2016). The prevalence ranged from 0.7 % to 46% in children aged 6 to 59 months. Two strata
were defined at the HZ level: a prevalence of infection below 10% or prevalence above 10%.
The 10% prevalence cut-off was an arbitrary selection to allow enough observations in each
stratum. Plasmodium infection and anaemia were assessed for their association with a number
49
of variables. For individuals aged older than five years, data collection took place in only two
HZ with different transmission intensities (Ngiri Ngiri, 0.8% and Selembao, 26.8% in
children younger than 5 years); these data were analysed separately.
The primary outcomes of the study were the presence or absence of Plasmodium malaria as
measured by rapid diagnostic test (RDT) and the anaemia test results. A child aged 6 to 59
months was defined as anaemic if his/her Hb was below 11.0 g/dl. Therefore, the outcomes
variables were dichotomous. Recorded explanatory variables were: age, gender, educational
level of the respondent, occupation of the respondent, insecticide mosquito-net use and
reported fever during the last two weeks and wealth index. A wealth index, calculated
according to the method of Filmer et al. (2001), was constructed for each household based on
ownership of household assets (having a television, a radio, etc.) and house characteristics
(having electricity, drinking water, toilet type, roof and ground material) (Filmer et al., 2001).
Three categories were generated to classify households ranging from the poorest to the least
poor in the community.
Statistical methods
The proportions with malaria infection and with anaemia were analysed using a logistic
regression model with random effects to take account clustering by health zone and health
area. All analysis were performed separately for children (6 to 59 months) and individuals
older than five years since they were sampled from different HZ. The analysis was carried out
using STATA version 13 (Stata Corporation College Station, TX, USA).
Ethics approval and consent to participate
Ethical approval of the study was obtained from the ethics committee of the Kinshasa School
of Public Health University of Kinshasa, in DRC, as well as the ethical committee in Basel
(Ethikkommission beider Basel, Basel-Stadt). Individual written informed consent was
obtained by parents or guardian on behalf of their children (until the age of 10) or by the
adults study participants themselves. In addition, assent was obtained from children over 10
years of age. Every precaution to minimize the risk of infection during blood sampling was
taken. All patients who tested positive for malaria by RDT were treated for free by the
nationally recommended therapy combination with artemisinin, artesunate plus amodiaquine
(ASAQ), previously placed at the health centre of reference of the corresponding health area.

50
4.4 Results
Data collection took place in 2512 households, in the 25 HZ that were visited. A total of 3342
children aged 6-59 months were included in the analysis, 1118 and 2224 in the low and high
transmission setting respectively. A similar number of males (50%) and females were
included; the median age was 30 months (90% central range 9–55). Table 4-1 shows the
number of children examined, by HZ and by transmission strata. For individuals above 5
years, data collection took place in two HZ only and included 816 individuals, of which 34%
were males and the median age was 22 years (90% central range 6–62).
Table 4-1: Number of children 6 to 59 months examined and prevalence of Plasmodium spp in Kinshasa, by health zone and strata, 2011
Health zone Malaria prevalence in children aged 6-59 months [95% CI]
<10% >10% % N % N
Bandalungwa 1.5 [0.2-5.3] 134 Barumbu 2.4 [0.5-6.9] 125 Binza Météo 24.8 [17.0-34.0] 109 Binza Ozone 19.1 [12.9-26.7] 136 Biyela 46.0 [37.1-55.1] 126 Gombe 11.5 [6.7-18.0] 139 Kalamu I 16.2 [8.4-27.1] 68 Kalamu II 2.5 [0.8-5.7] 200 Kikimi 32.8 [24.9-41.6] 131 Kimbanseke 36.1 [27.9-44.9] 133 Kingasani 25.0 [18.3-32.7] 152 Kinshasa 0.7 [0.0-4.0] 136 Kintambo 11.7 [7.0-18.1] 145 Lemba 7.7 [3.8-13.7] 130 Limete 17.3 [11.3-24.8] 133 Lingwala 0.7 [0.0-4.1] 135 Makala 17.9 [11.8-25.5] 134 Masina I 12.3 [7.3-19.0] 138 Masina II 24.8 [17.7-33.0] 133 Mont Ngafula I 33.6 [25.7-42.2] 134 Mont Ngafula II 35.3 [27.3-44.1] 133 Ngaba 7.5 [3.6-13.3] 134 Ngiri Ngiri 0.8 [0.0-4.2] 124 Police 17.0 [11.1-24.5] 135 Selembao 26.8 [19.9-34.7] 145 TOTAL N 1118 2224
51
Risk factors for Plasmodium infection in children aged 6-59 months (25 HZ)
The risk factors for Plasmodium infections in children 6-59 months are shown in Table 2.
There was an increase in the proportion with malaria infection with age in both transmission
strata. The greatest risk was in children 48-59 months: an odds ratio (OR) of 5.86 (95%
confidence interval (CI) 1.62-21.17) for the 36-47 months group and an OR of 15.53 (95% CI
4.26-56.64) for the 48-59 months group, compared to the youngest age group. The effect was
also seen in higher transmission strata, although the OR was lower: an OR of 1.73 (95% CI
1.36-2.20) for the 36-47 months group and an OR of 2.54 (95% CI 1.93-3.35) for the 48-59
months group compared to the youngest age group. The interaction between age and
transmission intensity was significant (p=0.009).
Treated net use was found to significantly lower malaria infection risk in the higher
transmission strata with 38% protection (OR=0.62, 95% CI 0.50 – 0.77), however the effect
was not significant in the lower transmission strata. Children who reported fever in the last
two weeks had a significantly elevated risk of malaria infection in both strata.
Higher education levels showed a trend towards being protective in both transmission settings
(Table 4-2). However there was no evidence of an association with the occupation of the
respondent. Finally, children living in the wealthiest tertile were significantly less likely to
have a malaria infection compared to the children from the poorest tertile in strata of high
transmission (OR=0.27, 95% CI 0.20-0.38, p<0.001). No evidence was found in the HZ with
less than 10% prevalence (OR=0.82, 95% CI 0.31-2.13, p=0.83), however the interaction
between socioeconomic status and transmission was not significant (p=0.14).
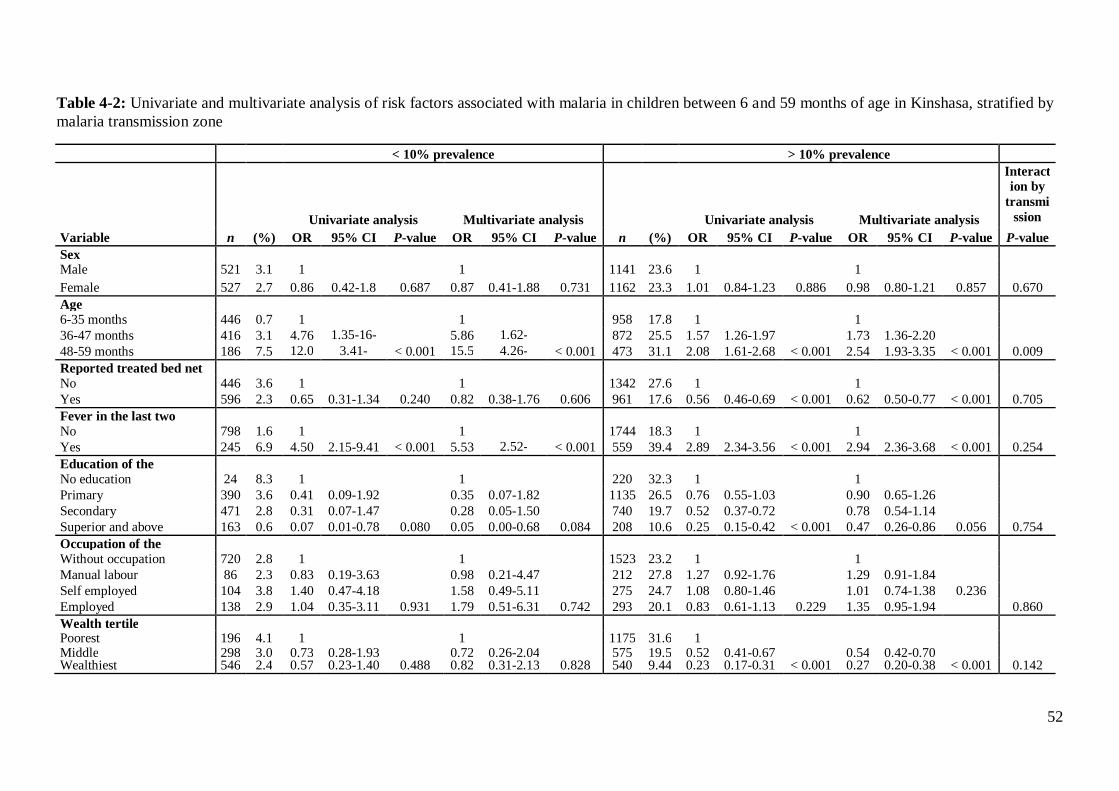
52
Table 4-2: Univariate and multivariate analysis of risk factors associated with malaria in children between 6 and 59 months of age in Kinshasa, stratified by malaria transmission zone
< 10% prevalence > 10% prevalence
Univariate analysis Multivariate analysis
Univariate analysis Multivariate analysis
Interaction by
transmission zone Variable n (%) OR 95% CI P-value OR 95% CI P-value n (%) OR 95% CI P-value OR 95% CI P-value P-value
Sex
Male 521 3.1 1
1
1141 23.6 1
1
Female 527 2.7 0.86 0.42-1.8 0.687 0.87 0.41-1.88 0.731 1162 23.3 1.01 0.84-1.23 0.886 0.98 0.80-1.21 0.857 0.670 Age
6-35 months 446 0.7 1
1
958 17.8 1
1
36-47 months 416 3.1 4.76 1.35-16-
84 5.86 1.62-
21.17 872 25.5 1.57 1.26-1.97
1.73 1.36-2.20
48-59 months 186 7.5 12.02
3.41-42.34
< 0.001 15.53
4.26-56.64
< 0.001 473 31.1 2.08 1.61-2.68 < 0.001 2.54 1.93-3.35 < 0.001 0.009 Reported treated bed net
No 446 3.6 1
1
1342 27.6 1
1
Yes 596 2.3 0.65 0.31-1.34 0.240 0.82 0.38-1.76 0.606 961 17.6 0.56 0.46-0.69 < 0.001 0.62 0.50-0.77 < 0.001 0.705
Fever in the last two
No 798 1.6 1
1
1744 18.3 1
1
Yes 245 6.9 4.50 2.15-9.41 < 0.001 5.53 2.52-12.11
< 0.001 559 39.4 2.89 2.34-3.56 < 0.001 2.94 2.36-3.68 < 0.001 0.254 Education of the
No education 24 8.3 1
1
220 32.3 1
1
Primary 390 3.6 0.41 0.09-1.92
0.35 0.07-1.82 1135 26.5 0.76 0.55-1.03
0.90 0.65-1.26
Secondary 471 2.8 0.31 0.07-1.47
0.28 0.05-1.50 740 19.7 0.52 0.37-0.72
0.78 0.54-1.14 Superior and above 163 0.6 0.07 0.01-0.78 0.080 0.05 0.00-0.68 0.084 208 10.6 0.25 0.15-0.42 < 0.001 0.47 0.26-0.86 0.056 0.754
Occupation of the
Without occupation 720 2.8 1
1
1523 23.2 1
1
Manual labour 86 2.3 0.83 0.19-3.63
0.98 0.21-4.47 212 27.8 1.27 0.92-1.76
1.29 0.91-1.84 Self employed 104 3.8 1.40 0.47-4.18
1.58 0.49-5.11 275 24.7 1.08 0.80-1.46
1.01 0.74-1.38 0.236
Employed 138 2.9 1.04 0.35-3.11 0.931 1.79 0.51-6.31 0.742 293 20.1 0.83 0.61-1.13 0.229 1.35 0.95-1.94 0.860 Wealth tertile Poorest 196 4.1 1
1
1175 31.6 1
Middle 298 3.0 0.73 0.28-1.93
0.72 0.26-2.04 575 19.5 0.52 0.41-0.67
0.54 0.42-0.70 Wealthiest 546 2.4 0.57 0.23-1.40 0.488 0.82 0.31-2.13 0.828 540 9.44 0.23 0.17-0.31 < 0.001 0.27 0.20-0.38 < 0.001 0.142

53
Risk factors for Plasmodium infection in individuals older than 5 years (2 HZ)
The risk factors for Plasmodium infection in individuals aged older than five years are shown
in Table 4-3. The association between age and malaria infection was strong. The highest
prevalence was observed in the 15-19 years age group in the low transmission HZ of Ngiri
Ngiri with an OR of 7.11 (95% CI 1.17-43.05) compared to the 5-9 years-old. In the higher
transmission HZ of Selembao however, OR were lower and more homogeneously distributed
across all age groups, compared to the 5-9 years-old group which showed the highest
prevalence. The interaction between age and transmission intensity however was not
significant (p=0.11).
ITN use was not found to significantly lower the prevalence of malaria infection, although the
estimates were in the direction of being protective. Individuals aged five years and older who
reported fever in the last two weeks had an elevated risk of having malaria infection in both
sites, and the association was stronger for the lower transmission: OR = 38.71 (95% CI 11.08-
135.23), and OR = 2.05 (95% CI 1.07-3.95) in Selembao, with a highly significant interaction
term (p<0.0001). There was no evidence of an effect of higher education levels, occupation of
the respondent or socio-economic status.

54
Table 4-3: Univariate and multivariate analysis of risk factors associated with malaria in individuals aged > 5 years in Kinshasa, stratified by malaria transmission zone, 2011
Ngiri Ngiri: 0.8% prevalence Selembao: 26.8% prevalence
Univariate analysis Multivariate analysis
Univariate analysis Multivariate analysis Interaction by
transmission zone Variable n (%) OR 95% CI P-value OR 95% CI P-value n (%) OR 95% CI P- OR 95% CI P- P-value
Sex Male 142 5.6 1.0 1.0 143 28.7 1.0 1.0 Female 257 4.3 0.75 0.29-1.91 0.548 0.74 0.23-2.37 0.616 274 20.1 0.62 0.39- 0.050 0.66 0.40-1.08 0.102 0.733 Age 5-9 years 62 4.8 1.0 1.0 76 34.2 1.0 1.0
10-14 years 68 1.5 0.29 0.03-2.90 0.22 0.01-3.39 68 25.0 0.64 0.31- 0.79 0.37-1.72 15-19 years 48 14.6 3.36 0.82-13.75
7.11 1.17-43.05 46 28.3 0.76 0.34- 0.85 0.37-1.96
> 20 221 3.6 0.74 0.19-2.87 0.022 1.09 0.21-5.72 0.009 227 17.6 0.41 0.23- 0.021 0.45 0.24-0.83 0.042 0.105 Reported treated bed net use No 244 6.1 1.0 1.0 315 25.7 1.0 1.0 Yes 155 2.6 0.40 0.13-1.24 0.089 0.33 0.09-1.21 0.075 102 14.7 0.50 0.27- 0.017 0.57 0.30-1.09 0.078 0.746 Fever in the last two weeks No 366 2.2 1.0 1.0 361 21.6 1.0 1.0 Yes 33 33.3 22.38 8.17-61.27 < 0.001 38.71 11.08-135.23 < 0.001 54 33.3 1.81 0.98- 0.066 2.05 1.07-3.95 0.036 < 0.001 Education of the respondent No education 8 12.5 1.0 1.0 35 34.3 1.0 1.0 Primary 120 5.0 0.37 0.04-3.50 0.18 0.01-2.49 186 26.9 0.70 0.33- 0.82 0.36-1.87 Secondary 189 4.8 0.35 0.04-3.16 0.27 0.02-3.48 145 18.6 0.44 0.19- 0.49 0.20-1.19 Superior and above 82 3.7 0.27 0.02-2.91 0.802 0.17 0.01-2.87 0.647 51 13.7 0.30 0.11- 0.041 0.32 0.09-1.13 0.115 0.865 Occupation of the Without occupation 244 5.7 1.0 1.0 200 26.0 1.0 1.0 Manual labourer 37 2.7 0.46 0.06-3.58 0.82 0.09-7.91 64 23.4 0.87 0.45- 1.17 0.58-2.37 Self employed 27 3.7 0.63 0.08-5.00 1.33 0.13-13.64 56 16.1 0.55 0.25- 0.398 0.56 0.24-1.28 0.425 Employed 91 3.3 0.56 0.16-2.00 0.696 0.59 0.11-3.20 0.913 97 20.6 0.74 0.41- 1.12 0.56-2.23 0.911 Wealth tertile Poorest & middle a 162 4.9 1.0 1.0 201 25.4 1.0 1.0 Wealthiest 237 4.6 0.94 0.37-2.38 0.891 1.31 0.18-9.64 0.618 99 19.2 0.74 0.42- 0.293 0.91 0.48-1.73 0.779 0.676
a Combined due to low number of observations
55
Risk factors for anaemia in children aged 6-59 months (25 HZ)
The risk of having anaemia was found to decline progressively with increasing age (Table 4-
4) in both low and high transmission strata (p<0.001). Although there was no evidence that
malaria infection increased the risk of having anaemia in the low transmission strata
(OR=2.01, 95% CI 0.89-4.51), this effect was significant in the higher transmission strata
(OR=3.40, 95% CI = 2.60–4.44). There was no evidence that reported ITN use was protective
for the anaemia status in either stratum. There was also no evidence of an association neither
with fever nor with education or occupation. Belonging to the wealthiest tertile was borderline
significantly associated with the risk of having anaemia in both low transmission (OR=0.68,
95% CI=0.47-0.99) and high transmission strata.

56
Table 4-4: Univariate and multivariate analysis of risk factors associated with anaemia in children between 6 and 59 months of age in Kinshasa, stratified by malaria transmission zone, 2011
< 10% > 10%
Univariate analysis Multivariate analysis
Univariate analysis Multivariate analysis Interaction by
transmission zone Variable n (%) OR 95% CI P-value OR 95% CI P-value n (%) OR 95% CI P-value OR 95% CI P-value P-value
Sex
Male 521 55.5 1.0
1.0
1161 69.0 1.0
1.0
Female 526 59.7 1.19 0.93-1.52 0.167 1.21 0.93-1.58 0.160 1142 66.5 0.89 0.75-1.07 0.210 0.93 0.77-1.12 0.355 0.064 Age
6-35 months 445 73.0 1.0
1.0
957 80.6 1.0
1.0
36-47 months 416 50.5 0.38 0.28-0.50
0.38 0.28-0.51 873 61.6 0.39 0.31-0.48
0.35 0.28-0.43
48-59 months 186 36.6 0.21 0.15-0.31 < 0.001 0.19 0.13-0.28 < 0.001 473 53.3 0.28 0.22-0.35 < 0.001 0.23 0.18-0.29 < 0.001 0.473 Education of the respondent
No education 24 70.8 1.0
1.0
220 75.0 1.0
1.0
Primary 390 62.1 0.67 0.27-1.66
0.64 0.24-1.70 1135 69.4 0.76 0.54-1.05
0.83 0.58-1.20
Secondary 471 57.7 0.56 0.23-1.38
0.57 0.21-1.50 740 64.9 0.62 0.44-0.86
0.78 0.53-1.15 Superior and above 162 44.4 0.33 0.13-0.84 < 0.001 0.35 0.13-0.99 0.037 208 61.5 0.53 0.35-0.81 0.004 0.80 0.49-1.31 0.629 0.412
Occupation of the respondent
Without occupation 720 60.7 1.0
1.0
1523 68.8 1.0
1.0
Manual labourer 86 39.5 0.42 0.27-0.67
0.41 0.25-0.68 212 69.3 1.03 0.75-1.40
0.97 0.69-1.36 Self-employed 104 60.6 1.00 0.65-1.52
1.03 0.65-1.63 275 65.1 0.85 0.64-1.11
0.77 0.58-1.03 0.010
Employed 137 50.4 0.66 0.46-0.95 < 0.001 0.94 0.61-1.44 0.005 293 63.8 0.80 0.62-1.04 0.268 0.92 0.68-1.24 0.313 Net use
No 446 57.2 1.0
1.0
1341 68.3 1.0
1.0
Yes 595 57.5 1.01 0.79-1.30 0.922 0.91 0.70-1.20 0.515 962 67.0 0.94 0.79-1.13 0.524 1.09 0.90-1.32 0.512 0.653
Malaria infection
No 1017 57.3 1.0
1.0
1762 63.1 1.0
1.0
Yes 30 66.7 1.49 0.69-3.21 0.302 2.01 0.89-4.51 0.078 540 83.1 2.89 2.26-3.69 < 0.001 3.40 2.60-4.44 < 0.001 0.119 Fever in the last two weeks
No 798 54.6 1.0
1.0
1744 65.0 1.0
1.0
Yes 244 66.4 1.64 1.22-2.21 < 0.001 1.30 0.93-1.80 0.197 559 76.4 1.74 1.40-2.17 < 0.001 1.32 1.04-1.67 0.039 0.755
Wealth tertile
Poorest 196 62.2 1.0
1.0
1176 72.9 1.0
1.0
Middle 298 65.8 1.17 0.80-1.70 0.423 1.14 0.76-1.71 574 64.1 0.66 0.54-0.82 0.000 0.78 0.62-0.99 Wealthiest 545 51.9 0.66 0.47-0.92 0.013 0.68 0.47-0.99 0.003 540 60.7 0.58 0.46-0.71 0.000 0.77 0.60-0.99 0.073 0.022
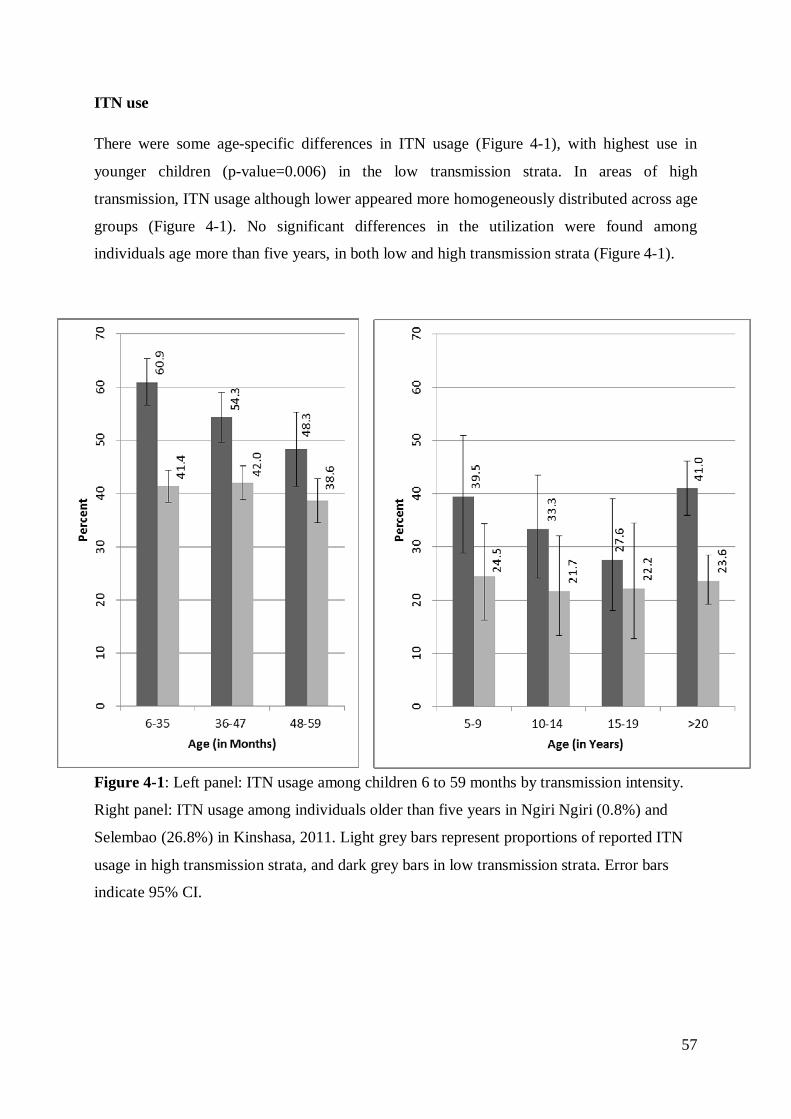
57
ITN use
There were some age-specific differences in ITN usage (Figure 4-1), with highest use in
younger children (p-value=0.006) in the low transmission strata. In areas of high
transmission, ITN usage although lower appeared more homogeneously distributed across age
groups (Figure 4-1). No significant differences in the utilization were found among
individuals age more than five years, in both low and high transmission strata (Figure 4-1).
Figure 4-1: Left panel: ITN usage among children 6 to 59 months by transmission intensity.
Right panel: ITN usage among individuals older than five years in Ngiri Ngiri (0.8%) and
Selembao (26.8%) in Kinshasa, 2011. Light grey bars represent proportions of reported ITN
usage in high transmission strata, and dark grey bars in low transmission strata. Error bars
indicate 95% CI.
58
4.5 Discussion
The identification of risk factors for malaria infection and anaemia, provides information on
the local malaria epidemiology and has the potential to lead to a more effective and targeted
use of malaria control measures. This study presents the results of an analysis of the
association of a number of variables that alone or in combination could affect the risk of
acquiring Plasmodium infection and anaemia, in a city with diverse malaria transmission
patterns. The key results from this analysis are the association between malaria infection and
age, with older age groups being exposed to higher risk of malaria in low transmission
settings and a lower and more homogeneous risk across all age groups in high transmission
settings. Shift in the age of peak prevalence towards the older groups has been described for
malaria and other infectious diseases and is consistent with exposure-related acquired
immunity (Woolhouse 1998; Snow & Marsh 2002). In zones of low transmission, children are
less exposed to infective malaria, hence delaying the age of the first infection and the
acquisition of immunity (Winskill et al. 2011). Clearly, in Kinshasa the risk of Plasmodium
infection seems to occur later in childhood, which is consistent with areas of rather low levels
of transmission. The prevalence rates by HZ shown in Table 1 (range: 0.7-46.0), with most
HZs below 30% confirm that Kinshasa overall has a moderate endemicity level. Recent
school surveys done in Kimbanseke, a relatively high prevalence HZ southeast of Kinshasa,
found similar results, showing children aged 10-13 at higher risk of malaria and a high
prevalence of asymptomatic infections (Matangila et al. 2014).
The relationship of ITN use by the different age groups could also influence the age pattern of
risk that was observed: children in the youngest age group, 6-35 months, were significantly
more likely to sleep under an ITN in the low transmission setting, whereas utilization was
similar among age groups in high transmission setting. A similar shift in age of peak of
prevalence towards the older children has been observed elsewhere with an increase in net
coverage (Wang et al. 2006). Only 44% of children 6-59 months used an ITN the night
preceding the survey, which is still far from universal coverage. In individuals > 5 years,
overall ITN use was even lower, with only 38% and 23.3% using an ITN in Ngiri Ngiri and
Selembao, respectively. In addition, less than 58% of HHs owned enough ITNs to cover all
household members in 2011. These low values are of concern.
Higher malaria prevalence in older children has also been attributed to increased use of
antimalarials in early childhood (Trape 1987).
59
In case of fever in Kinshasa, it is common practice by the caregivers to initially treat their
child at home (54% of the cases) although only 4.3% of the children treated for fever receive
a recommended combination therapy containing artemisinin (unpublished data).
Results indicated that sleeping under an ITN the previous night reduced the risk of
Plasmodium infection by 38% (OR=0.62, 95% CI 0.50 – 0.77) among children 6-59 months
of age in areas of high transmission, consistent with the vast body of evidence supporting the
efficacy and effectiveness of ITN in protecting against malaria(Lengeler 2004). In low
transmission areas, however, there was no evidence of such an association, presumably
because the overall risk of infection was lower.
Reported history of fever was associated with malaria infection overall. There was evidence
of a difference in this association with transmission level among individuals aged older than
five years (p<0.001). The weaker association of reported fever with malaria in areas of high
transmission could be explained by differences in the levels of acquired immunity.
The data confirm that anaemia is frequent in urban Kinshasa, with 65% prevalence among
children 6-59 months, 30% moderate (7.0-9.9 g/dl) and 1.9% severe (< 7.0 g/dl). ITN use in
Kinshasa did not appear to be associated with benefits in lower anaemia risk, contrary to what
has been documented in other settings (Premji et al. 1995; Korenromp et al. 2004; Lengeler
2004; Mathanga et al. 2010). These findings are consistent with a Kenyan study that found
only a small difference in prevalence of anaemia between villages with and without ITNs
(Mathanga et al. 2010). Anaemia has many causes in addition to malaria (nutrition (UNICEF,
2010), soil transmitted infections (STH) and schistosomes), and in Kinshasa these are likely
to also be contributors to this morbidity. A recent study revealed a high prevalence of STH
infections among primary school children in Kinshasa (32.8%) (Matangila et al. 2014).
Nevertheless, the estimated odds of anaemia in zones of high transmission were 3.5 times
(95% CI 2.70-4.62) higher in malaria infected children.
In this study, the risk of anaemia was shown to decrease with increasing age in both low and
high transmission strata. These results are consistent with studies conducted in West Africa,
showing a significant reduction in the mean haemoglobin level in children aged 2-5 years
compared to children aged 1-2 (Soares Magalhães et al. 2011).

60
This study also showed differences in the effect in malaria risk or anaemia risk by
socioeconomic status, consistent with previous studies carried out in sub-Saharan Africa (De
Beaudrap et al. 2011; Gahutu et al. 2011; Winskill et al. 2011; Ayele et al. 2012), and as
documented in a multi country analysis of DHS data (Balarajan et al. 2011).
This study however has some limitations. Foremost, the analysis draws on cross-sectional
data; hence the causal nature of associations should be viewed with a certain caution. A
second most important limitation of the study relates to the smaller sample size for individuals
over five years compared to that of children 6-59 months, limiting our ability to potentially
detect important differences and interactions between risk factors and transmission.
Furthermore, the low proportion of males for this survey (34%) may have triggered a gender-
response bias, with consequences on the prevalence and associations found. The direction and
magnitude of a possible bias remain unknown. Lastly, RDTs are limited in sensitivity to
detect low density parasitaemia and their use may have led to an underestimation of the true
proportion of people infected with Plasmodium falciparum. The underestimation may have
differed with acquired immunity affecting the age pattern (Alves et al. 2002; Nicastri et al.
2009; Harris et al. 2010; Wu et al. 2015).
4.6 Conclusions
For the most part, there was no evidence of an interaction between malaria infections and the
risk factors with transmission intensity; however the associations with age and with fever in
the last two weeks did vary significantly. The results also show that school-aged children are
the least protected with ITN, across the different transmission settings, hence representing an
important reservoir for infection. The observation of a shift in the peak age of risk for malaria
to older groups is consistent with areas of low transmission and highlights the need for a more
equal distribution of ITN in Kinshasa to target all age groups and not only the traditional
high-risk group of young children.
61
5 An operational comparative study of quinine and artesunate
for the treatment of severe malaria in hospitals and health
centres in the Democratic Republic of Congo: The MATIAS
study
Giovanfrancesco Ferrari1,2, Henry M Ntuku3, Christian Burri1,2, Antoinette T Kitoto3, Stephan
Duparc4, Pierre Hugo4, Didier K Mitembo1,2, Amanda Ross1,2, Philippe L Ngwala5, Joseph N
Luwawu6, Papy N Musafiri7, Symphorien E Ngoie8, Christian Lengeler1,2
1 Swiss Tropical and Public Health Institute, P.O. Box, 4002, Basel, Switzerland
2 University of Basel, Basel, Switzerland
3 Kinshasa School of Public Health, Kinshasa, Democratic Republic of the Congo
4 Medicines for Malaria Venture, Geneva, Switzerland
5 Zone de Santé de Kimpese, Kimpese, Democratic Republic of the Congo
6 Zone de Santé Rurale de Kisantu, Kisantu, Democratic Republic of the Congo
7 Zone de Santé de Maluku, Maluku, Democratic Republic of the Congo
8 Centre Hospitalier Roi Baudouin 1er Masina, Kinshasa, Democratic Republic of the Congo
This paper has been published in the Malaria Journal 2015, 14:226
62
5.1 Abstract
Background
The Democratic Republic of the Congo (DRC) has the highest number of severe malaria cases
in the world. In early 2012, the National Malaria Control Programme (NMCP) changed the
policy for treating severe malaria in children and adults from injectable quinine to injectable
artesunate. To inform the scaling up of injectable artesunate nationwide, operational research
is needed to identify constraints and challenges in the DRC’s specific setting.
Methods
The implementation of injectable quinine treatment in 350 patients aged two months or older
in eight health facilities from October 2012 to January 2013 and injectable artesunate in 399
patients in the same facilities from April to June 2013 was compared. Since this was an
implementation study, concurrent randomised controls were not possible. Four key
components were evaluated during each phase: 1) clinical assessment, 2) time and motion, 3)
feasibility and acceptability, and 4) financial cost.
Results
The time to discharge was lower in the artesunate (median = 2, 90% central range 1 – 9)
compared to the quinine group (3 (1 – 9) days; p <0.001). Similarly, the interval between
admission and the start of intravenous (IV) treatment (2 (0 – 15) compared to 3 (0 – 20)
hours; p <0.001) and parasite clearance time (23 (11 – 49) compared to 24 (10 – 82) hours; p
<0.001) were lower in the artesunate group. The overall staff pre-administration time (13 (6 –
38) compared to 20 (7 – 50) minutes; p <0.001) and the personnel time spent on patient
management (9 (1 – 24) compared to 12 (3 – 52) minutes; p <0.001) were lower in the
artesunate group. In hospitals and health centres, the mean (standard deviation, SD) total cost
per patient treated for severe malaria with injectable artesunate was USD 51.94 (16.20) and
19.51 (9.58); and USD 60.35 (17.73) and 20.36 (6.80) with injectable quinine.
Conclusions
This study demonstrates that injectable artesunate in the DRC is easier to use and that it costs
less than injectable quinine. These findings provide the basis for practical recommendations
for rapid national deployment of injectable artesunate in the DRC.
63
5.2 Background
The Democratic Republic of the Congo (DRC) has the highest severe malaria burden in the
world (WHO 2011c). The combination of artesunate plus amodiaquine (AS-AQ) was adopted
as a first-line treatment for uncomplicated malaria in 2005, with a second ACT, artemether
plus lumefantrine (AL), added in 2010. Meanwhile, injectable quinine remained the
recommended first-line drug for cases of treatment failure and for severe malaria.
In 2010, the AQUAMAT trial demonstrated that treating severe malaria with artesunate
reduced the case fatality rate in African children (<15 years) by 22.5% compared to treatment
with injectable quinine (Dondorp et al. 2010). Previously, the benefit of artesunate compared
to quinine had been demonstrated in adults in the SEAQUAMAT trial carried out in
Southeast Asia (Dondorp et al. 2005). These results led to the recommendation of injectable
artesunate as the treatment of first choice for severe malaria in children and adults in the
WHO guidelines in 2011 (WHO 2011b).Nevertheless, cases of delayed haemolytic anaemia
secondary to injectable artesunate administration were reported and the causative role of
artesunate is still controversial. Its long-term safety profile is under evaluation. In addition to
its efficacy, injectable artesunate offers a number of programmatic advantages over quinine,
such as eliminating the need for rate-controlled infusions or cardiac monitoring, and the risk
of induced hypoglycaemia (WHO 2011b).
In 2012, the National Malaria Control Programme (NMCP) of the DRC, with support from
the relevant ministry departments, decided to adopt the revised WHO severe malaria
treatment guidelines, which strongly recommended injectable artesunate in preference to
quinine or artemether as first-line treatment for severe malaria. An implementation period of
three years to scale up injectable artesunate was included in the national strategic plan.
This transition will require many operational and clinical adaptations. To support this
process, there is a need for locally derived operational experience addressing constraints and
challenges, something that all implementing countries will have to consider. These data are
essential for three reasons: 1) better planning of the implementation of the new treatment
based on quantified operational parameters; 2) identifying constraints and pitfalls to guide the
training of health care providers; and, 3) providing strong and locally relevant arguments in
situations where the health staff are reluctant to accept the change of treatment.

64
The present MATIAS study (‘MAlaria Treatment with Injectable ArteSunate’) aims to
support the national introduction of injectable artesunate as the first-line treatment of severe
malaria in the DRC by assessing four key components: 1) clinical safety, 2) time and motion,
3) feasibility and acceptability, and 4) cost.
5.3 Methods
Study design
The MATIAS study was an observational implementation study of patients aged two months
and older with severe malaria and included two successive phases. In the first phase, between
October 2012 and January 2013, severe malaria patients were treated with intravenous (IV)
quinine. Then, between April and June 2013, severe malaria patients were treated with IV
artesunate.
Four components were evaluated in each phase: 1) clinical safety, assessed on the basis of
limited routine patient information; 2) time and motion parameters; 3) feasibility and
acceptability; and 4) financial costs. The results of the feasibility and acceptability
component required additional in-depth studies and are reported elsewhere (Ntuku et al.,
personal communication).
Participants (population, inclusion, exclusion criteria)
The study population consisted of patients admitted with severe malaria to one of the study
sites between October 2012 and June 2013. Patients were included in the study if they were
older than two months, fulfilled the WHO criteria of severe Plasmodium falciparum malaria
(WHO 2013a), had either a positive rapid diagnostic test (RDT) for P. falciparum (SD
Bioline Malaria Antigen P.f/Pan Standard Diagnostics Inc, Yongin, South Korea) and/or a
positive Giemsa-stained thick blood smear on admission, and they or their relative or
guardian gave informed written consent. Patients were excluded if they had a known serious
adverse reaction to quinine and/or artemisinin derivatives, or if there was a history of
adequate anti-malarial treatment for more than 24 hours before admission.

65
Women with known or suspected pregnancy in all trimesters during the second (artesunate)
phase were not included and were treated with quinine according to the national guidelines
(PNLP, 2012). Pregnancy status was determined by details from the patient’s history and/or
by a positive pregnancy test.
Signed informed consent for participation was obtained in French or in the local language
from all participants or from their relatives or guardians. Because of the life-threatening
nature of the disease, an initial consent was obtained from the accompanying relative or
guardian on behalf of the patient, if necessary, and final consent was solicited as soon as the
patient was able to decide and respond. Since this was an observational study, investigators
did not intervene in patient management, which was left to the discretion of the attending
physicians. Ethical clearance for the study was obtained from the Ethics Committee of both
Cantons of Basel, Switzerland (EKBB, Ref No 201/12) and from the Ethics Committee of the
Kinshasa School of Public Health (KSPH Ethics Commission, Ref No 057/12), University of
Kinshasa, DRC. The study was registered in ClinicalTrials.gov (Identifier: NCT01828333).
Study settings
The study sites consisted of three hospitals and five health centres in one urban and three
rural health zones (HZ) in the DRC, representative of typical health facilities in the country
(Figure 5-1). The sample included a large public health hospital (Institut Médical
Evangélique, Kimpese, Bas Congo); one medium-sized, non-profit, missionary hospital (St
Luc Kisantu); and a medium-sized, government hospital (Centre Hospitalier Roi Baudouin).
In addition, five rural health centres were selected within the same HZ (Health Centre Bita,
Health Centre Menkao, Health Centre Ngeba, Health Centre CECO, Health centre La
Famille) (Figure 5-1 and see additional file 1).

66
Figure 5-1: Map showing the location of the study sites and the selected health zones
Interventions
During the first phase, patients receiving IV quinine were treated according to the national
treatment guidelines. An initial loading dose of 20 mg of quinine salt/kg in 5 – 10 ml isotonic
glucose solution (5%) per kg body weight was infused over four hours. Following a rest
period of eight hours and 12 hours after administration of the loading dose began, a
maintenance dose of 10 mg of quinine salt/kg was given. The maintenance dose was repeated
every 12 hours until the patient was able to swallow the oral treatment (WHO 2013a; PNLP
2012). Patients receiving artesunate (Guilin Pharmaceuticals, Shanghai, China) received
doses intravenously at 2.4 mg/kg on admission, at 12 and 24 hours, and then once daily until
oral treatment could be swallowed (WHO 2013a). The content of each 60 mg vial of
artesunate powder was dissolved in 1 ml of sodium bicarbonate and then diluted with normal
saline solution or dextrose 5% before IV injection (WHOPARs). At least three doses of
artesunate had to be given before switching to a full course of oral treatment. The drugs used
for the study were provided for free by the manufacturer (Artesunate, Guilin Pharmaceutical
Co. Ltd, Shanghai, China) and by the funding agency, Medicines for Malaria Venture
(MMV) (quinine).
Dem Rep Congo
HZ of Kisantu 1 Hospital
1 Health Centre
HZ of Masina 1 Hospital
HZ of Maluku 2 Health Centres
HZ of Kimpese 1 Hospital
2 Health Centres
67
Study outcomes
Outcome measures were defined for each of the four study components. For the clinical
assessment component, the outcomes were: 1) duration of hospitalisation, defined as the time
from hospital registration to discharge, (this was the primary study endpoint); 2) time from
hospital admission to start of parenteral treatment; 3) time from initiation of parenteral
treatment to initiation of oral treatment; 4) parasite clearance time (PCT), defined as the time
from the initiation of a patient’s parenteral treatment until the patient’s first negative blood
film; and 5) clinical status at discharge. For the time and motion component, the main
outcome measure was the cumulative staff time required for all steps of drug preparation,
administration and patient management. For the feasibility and acceptability component, the
main outcomes were health-provider perceived feasibility of patient management, perceived
ease of applying drug treatment, and perceived quality of case management by
patient/caretaker. These results are reported separately (Ntuku et al. 2016). For the financial
cost component, the main outcome was the total financial cost of patient management,
including treatment.
Sample size calculation
The study sample size was calculated based on seven centres, a mean hospitalisation of 2.23
days (standard deviation of 1.64) (Dondorp et al. 2005), 80% power and an assumed 20%
shorter hospital stay with injectable artesunate. This calculation yielded 25 patients per centre
and study period. Under the assumption of an effect variation by centre with a standard
deviation of 0.05, the required number per centre was corrected to 27. This effect was
presumed to be moderate, as each centre acted as its own control in the study. The two-phase
study design was selected to fit the implementation strategy in this area. To ensure a safety
margin and to aid disaggregation of the data by centre, the number of patients to be recruited
was finally set to 50 patients of all ages from each centre and per study phase. One of the
sites initially selected was removed due to difficulties in initiating the study. However, due to
recruitment numbers slightly below expectations during the quinine phase, two additional
study centres were added. This amendment increased the number of treatment centres to
eight.

68
Statistical methods
Continuous outcomes were described using their mean and standard deviation, or median and
90% central range if the distribution was skewed. Dichotomous outcomes were summarised
as proportions. Clinical characteristics are presented by age groups <five years and ≥five
years. Skewed data, such as the time to event outcomes, were compared using the non-
parametric Wilcoxon rank sum test. The paper-based questionnaires were double-entered and
validated in EpiData version 3.1 software (The EpiData Association, Odense, Denmark) and
analysed in Stata version 12.1 (Stata Corp, College Station, TX, USA).
Key procedures
Prior to the first study phase, all investigators and staff involved in the study in each
hospital/health centre participated in a three-day training on study procedures. Laboratory
technicians received a refresher course on thick blood smear preparation/reading and, before
the second phase, a refresher course on haemoglobin (Hb) measurement with the HemoCue
201 plus system (Angelholm, Sweden). Simulated interviews were conducted to practice
obtaining informed consent. Local principal investigators took part in practical sessions on
filling in the case report forms (CRF). Nurses and doctors attended a separate training on
reporting serious adverse events (SAE). Nurses also participated in piloting the time and
motion study tool, which included observing and timing the activities related to drug
preparation/administration prior to the first data collection. Upon completion of the first
phase, hospital and health centre personnel involved in the study convened in Kinshasa for a
two-day training on preparing and administering injectable artesunate. Job aids and training
tools developed by MMV were used for this training. In addition, each site received ten doses
of injectable artesunate for training purposes, allowing health care providers to become
familiar with the new drug prior to patient recruitment. Weekly supervision visits to each site
throughout the duration of the study ensured regular monitoring of the study team.

69
Patient assessment
Demographic information and limited routine clinical history data were collected for each
patient and local study physicians (hospitals) or nurses (health centres) performed basic
routine clinical assessments. A Giemsa-stained thick blood smear was performed and
examined every 12 hours during the first 24 hours and then every 24 hours until negative or
until patient discharge. For PCT calculations, thick blood smears were later reread for quality
control by experienced microscopists at the KSPH, blinded to the results of the first reading
and to the RDT results. Hb levels were systematically assessed with a HemoCue 201 plus+
photometer (Angelholm, Sweden) during the second study phase, at hospital admission, at
discharge and at follow-up visits on days 7, 14, 21, and 28. The HemoCue testing resulted in
a change in study protocol because of reports of haemolytic anaemia following artesunate
treatment(Centers for Disease Control and Prevention (CDC) 2013). The results of that
extension are presented elsewhere (Burri et al. 2014). To ensure the proper functioning of the
photometer, high and low Hb liquid controls (HemoCue Eurotrol HemoTrol) were run
weekly at each site. Given the observational nature of the study, laboratory tests were not
systematically performed and were left to the discretion of the physician or treating nurse,
except for parasitological tests required for inclusion in the study and the Hb assessment
during the second phase. Time of admission, time of start and end of parenteral treatment,
and time to discharge were also recorded for every patient during both phases.
Parenteral treatment was completed by administering a full course of the recommended first-
line, oral, combination therapy AS-AQ or AL in the artesunate phase, or with quinine tablets
or the standard treatment practiced by the centre in the quinine phase. The first dose of the
oral treatment was administered at the health facility in the presence of the nurse responsible.
Subsequent doses were administered at home, according to the instructions given to parents
and guardians. Patients were discharged at the discretion of the attending physician/nurse,
after a final clinical assessment. During the first study phase, patients were asked to return to
the hospital/health centre for follow-up seven days after discharge to assess their clinical
status and their adherence to oral therapy. In the second study phase, patients were asked to
return on days 7, 14, 21, and 28 after discharge to assess the clinical status and adherence to
oral therapy and to determine their Hb levels at these time points.
70
Time and motion
The time and motion methodology consisted of 1) dividing a process into key tasks, and 2)
observing each task to assess the average time required to perform it. The sum of the average
times spent on each task was used to compute the total average time to complete the process.
In each of the three participating hospitals, an external study nurse supervised the time and
motion component and was present throughout the study. In the five health centres, the health
centre personnel were responsible for the measurements. Therefore, the number of patients
followed up was limited as a second nurse was not always available. Observed activities
included: 1) pre-administration tasks (preparation of all materials and injectable solution,
searching for the vein, setting the infusion in case of quinine), 2) drug administration, and 3)
all other activities related to patient management. Observations were made by the nurses
using digital stopwatches and a checklist to record the time taken for each task. Inter-observer
agreement was not formally assessed. Materials required for all tasks were also recorded on
the same observer checklist and this information was used later to calculate financial costs.
Cost of treatment component
A financial cost analysis was carried out from the provider’s perspective, accounting only for
costs incurred by the hospitals and the health centres. Complete unit cost data on resources
used were recorded for 386 patients under quinine and for 333 patients under artesunate. To
estimate the mean unit cost, the 2014 average exchange rate (USD 0.00107 to the Congolese
Franc) was adopted (OANDA n.d.). Health care costs were divided into four main categories:
1) drug costs (parenteral quinine and artesunate, oral therapy), 2) diagnostic costs (blood
smear), 3) administration equipment costs (infusion set, IV solution, syringes), and 4) in-
patient costs (consultation cost, bed occupancy, blood transfusion, and nursing care).
Administration equipment, blood smear and parenteral quinine unit costs were estimated
from the hospital/health centre price lists, as well as in-patient costs. The full dose costs for
both parenteral quinine and artesunate were applied, since the recommendation given in the
study was to avoid re-using the drug once it was opened, and hence partially used ampoules
had to be discarded. Artesunate was used in the 60-mg vial, the WHO pre-qualified
formulation at the time. Costs of oral treatment with AS-AQ/AL were included in the
analysis despite being subsidised by the Global Fund to Fight AIDS, TB and Malaria
(GFATM) in the selected health facilities.

71
Costs of artesunate and of AS-AQ/AL were obtained from the Management Sciences for
Health (MSH) International Drug Price Indicator Guide (MSH, 2014).
Additional treatments and diagnostic costs, other than the parenteral drug and the thick blood
smear, were not included in the analysis. Specific costs associated with co-morbidities, with
the exception of blood transfusions (severe anaemia), were not considered in the analysis
because they would have required a level of clinical monitoring that was not possible in this
study. In two sites (referral hospital Saint Luc and Health Centre Ngeba), a lump sum health
care payment system was in place, thus unit costs were unavailable. The decision was made
to reflect as closely as possible the local practice and to generate nationally relevant data
rather than internationally, fully costed estimates. Hence, the lump sum estimates were taken
for this analysis. However, the two sites were analysed separately to take these differences
into account, since lump sums are likely to underestimate the full cost of treatment, especially
if there is a central subsidy by an external donor, as in the case of these two facilities.
5.4 Results
Clinical assessment
A total of 749 patients were recruited from eight sites, 399 in the quinine group from October
2012 to January 2013 (study phase one), and 350 in the artesunate group from April to July
2013 (study phase two). The quinine group consisted of 248 (62%) children between two and
59 months, and 151 (38%) individuals aged five years and above. The artesunate group
consisted of 215 (61%) children between two and 59 months and 135 (39%) individuals aged
five years and above. The demographic and baseline characteristics were similar for the two
study groups (Table 5-1). All patients tested positive for malaria, either by thick blood smear
or RDT on the day of inclusion. Overall mortality was 2.8% (21/749), with 3.8% for patients
treated with quinine (15/399) and 1.7% for patients treated with artesunate (6/350) (p=0.110).
The majority of deaths (13 of 21, 62%) occurred within the first 24 hours after admission, of
which nine of 15 were in the quinine group (with two dying before receiving the treatment)
and four of six were in the artesunate group (zero before receiving the treatment). Of the
eight deaths that occurred after 24 hours, six occurred in the quinine group and two in the
artesunate group.
72
Prostration was the most frequent manifestation of severe malaria at admission in children
between two to 59 months in the quinine (204/248, 82%) and artesunate groups (171/215,
80%), as well as in individuals five years and above (122/151, 81% and 120/135, 90%).
Respiratory distress and convulsions were also frequent symptoms at admission in both
groups. The total number of patients who received a blood transfusion was 214 (29%), with
128 (32%) and 88 (25%) in the quinine and artesunate groups, respectively. Five per cent of
the patients under the quinine regimen had persistent symptoms at discharge, compared to 3%
under the artesunate regimen (Table 5-2). A decrease in Hb levels at one of the follow-up
visits was a frequent SAE reported during the artesunate regimen (Burri et al. 2014). A
seven-day oral quinine course was the most frequently prescribed oral medication to
complete treatment after the initial injectable quinine regimen (92%), whereas AS-AQ was
the most prescribed oral medication (97%) after injectable artesunate for all ages. Patient
adherence was assessed by the duration of oral treatment and the reported number of tablets
taken. Following injectable quinine and injectable artesunate, 236 (85%) and 308 (99%)
patients fully adhered to the treatment, respectively.
The time to discharge was slightly lower in the artesunate group compared to the quinine
group, with a median of two (90% central range 1 – 9) versus three (1 – 9) days, respectively
(p <0.001). Given that mortality was slightly higher in the quinine group, this would have led
to a shorter hospital stay but the effect would be minimal because of the low case fatality rate.
The interval between admission and start of parenteral treatment was significantly shorter in
the artesunate group compared to the quinine group, two (0 – 15) versus three (0 – 20) hours
(p <0.001). The interval from beginning parenteral treatment initiating oral treatment was
slightly longer in the artesunate group (45 (32 – 56) versus 39 (12 – 67) hours in the quinine
group, p <0.001). Parasite clearance time was 23 (11 – 49) hours for artesunate versus 24 (10
– 82) hours for quinine (p <0.001) (Table 5-3).
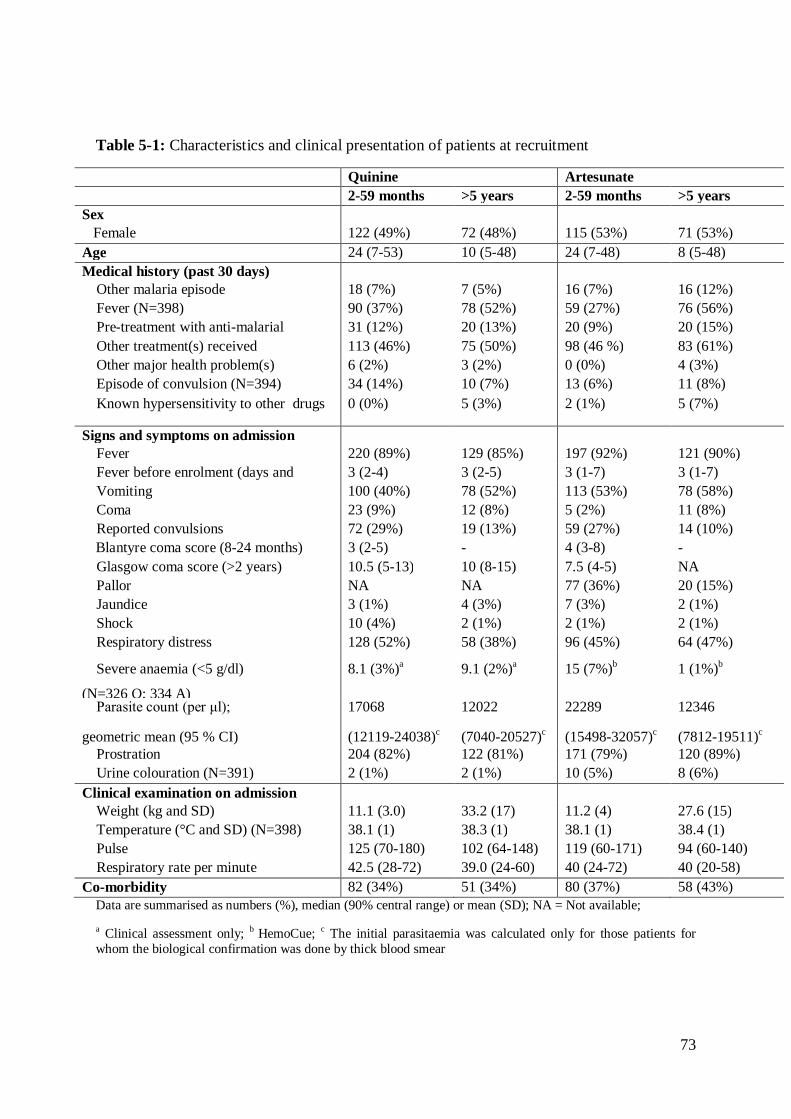
73
Table 5-1: Characteristics and clinical presentation of patients at recruitment
Quinine Artesunate 2-59 months >5 years 2-59 months >5 years Sex Female 122 (49%) 72 (48%) 115 (53%) 71 (53%) Age 24 (7-53) 10 (5-48) 24 (7-48) 8 (5-48) Medical history (past 30 days) Other malaria episode 18 (7%) 7 (5%) 16 (7%) 16 (12%) Fever (N=398) 90 (37%) 78 (52%) 59 (27%) 76 (56%) Pre-treatment with anti-malarial 31 (12%) 20 (13%) 20 (9%) 20 (15%) Other treatment(s) received 113 (46%) 75 (50%) 98 (46 %) 83 (61%) Other major health problem(s) 6 (2%) 3 (2%) 0 (0%) 4 (3%) Episode of convulsion (N=394) 34 (14%) 10 (7%) 13 (6%) 11 (8%)
Known hypersensitivity to other drugs 0 (0%) 5 (3%) 2 (1%) 5 (7%)
Signs and symptoms on admission Fever 220 (89%) 129 (85%) 197 (92%) 121 (90%) Fever before enrolment (days and
range) 3 (2-4) 3 (2-5) 3 (1-7) 3 (1-7)
Vomiting 100 (40%) 78 (52%) 113 (53%) 78 (58%) Coma 23 (9%) 12 (8%) 5 (2%) 11 (8%) Reported convulsions 72 (29%) 19 (13%) 59 (27%) 14 (10%) Blantyre coma score (8-24 months) 3 (2-5) - 4 (3-8) - Glasgow coma score (>2 years) 10.5 (5-13) 10 (8-15) 7.5 (4-5) NA Pallor NA NA 77 (36%) 20 (15%) Jaundice 3 (1%) 4 (3%) 7 (3%) 2 (1%) Shock 10 (4%) 2 (1%) 2 (1%) 2 (1%) Respiratory distress 128 (52%) 58 (38%) 96 (45%) 64 (47%)
Severe anaemia (<5 g/dl)
(N=326 Q; 334 A)
8.1 (3%)a 9.1 (2%)a 15 (7%)b 1 (1%)b
Parasite count (per μl);
geometric mean (95 % CI)
17068
(12119-24038)c
12022
(7040-20527)c
22289
(15498-32057)c
12346
(7812-19511)c Prostration 204 (82%) 122 (81%) 171 (79%) 120 (89%) Urine colouration (N=391) 2 (1%) 2 (1%) 10 (5%) 8 (6%) Clinical examination on admission Weight (kg and SD) 11.1 (3.0) 33.2 (17) 11.2 (4) 27.6 (15) Temperature (°C and SD) (N=398) 38.1 (1) 38.3 (1) 38.1 (1) 38.4 (1) Pulse 125 (70-180) 102 (64-148) 119 (60-171) 94 (60-140) Respiratory rate per minute 42.5 (28-72) 39.0 (24-60) 40 (24-72) 40 (20-58) Co-morbidity 82 (34%) 51 (34%) 80 (37%) 58 (43%)
Data are summarised as numbers (%), median (90% central range) or mean (SD); NA = Not available;
a Clinical assessment only; b HemoCue; c The initial parasitaemia was calculated only for those patients for whom the biological confirmation was done by thick blood smear
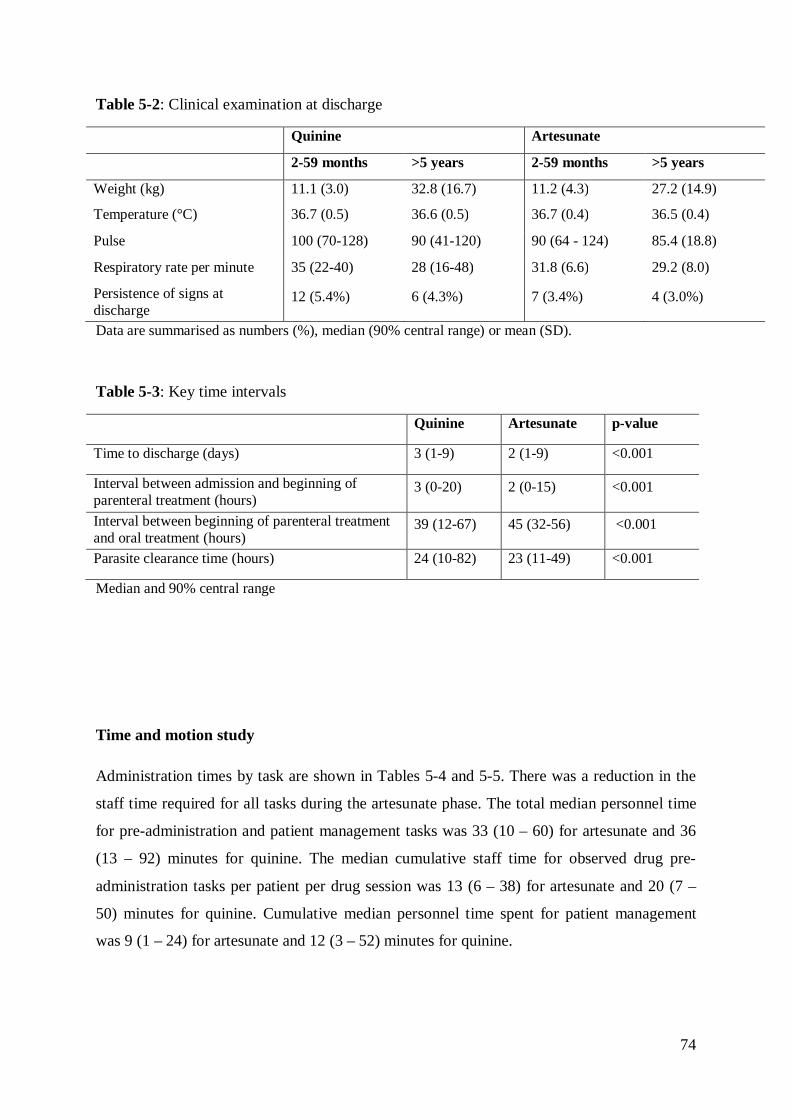
74
Table 5-2: Clinical examination at discharge
Quinine Artesunate
2-59 months >5 years 2-59 months >5 years
Weight (kg) 11.1 (3.0) 32.8 (16.7) 11.2 (4.3) 27.2 (14.9)
Temperature (°C) 36.7 (0.5) 36.6 (0.5) 36.7 (0.4) 36.5 (0.4)
Pulse 100 (70-128) 90 (41-120) 90 (64 - 124) 85.4 (18.8)
Respiratory rate per minute 35 (22-40) 28 (16-48) 31.8 (6.6) 29.2 (8.0)
Persistence of signs at discharge
12 (5.4%) 6 (4.3%) 7 (3.4%) 4 (3.0%)
Data are summarised as numbers (%), median (90% central range) or mean (SD).
Table 5-3: Key time intervals
Quinine Artesunate p-value
Time to discharge (days) 3 (1-9) 2 (1-9) <0.001
Interval between admission and beginning of parenteral treatment (hours)
3 (0-20) 2 (0-15) <0.001
Interval between beginning of parenteral treatment and oral treatment (hours)
39 (12-67) 45 (32-56) <0.001
Parasite clearance time (hours) 24 (10-82) 23 (11-49) <0.001
Median and 90% central range
Time and motion study
Administration times by task are shown in Tables 5-4 and 5-5. There was a reduction in the
staff time required for all tasks during the artesunate phase. The total median personnel time
for pre-administration and patient management tasks was 33 (10 – 60) for artesunate and 36
(13 – 92) minutes for quinine. The median cumulative staff time for observed drug pre-
administration tasks per patient per drug session was 13 (6 – 38) for artesunate and 20 (7 –
50) minutes for quinine. Cumulative median personnel time spent for patient management
was 9 (1 – 24) for artesunate and 12 (3 – 52) minutes for quinine.

75
Table 5-4: Personnel time (in minutes) required to complete pre-administration tasks, by drug type
Quinine (N = 832) Artesunate (N = 795)
Material preparation 6 (2-18) Material preparation 4 (1-10)
Drug preparation 4 (1-14) Reconstitution 3 (1- 8)
Search for the vein 5 (1-14) Dilution 2 (1-10)
Perfusion regulation 4 (1-10) Dose verification 2 (1-6)
- Search for the vein 3 (1-10)
Median and 90% central range
Table 5-5: Overall cumulative personnel time (in minutes)
Quinine Artesunate p-value
Overall personnel pre-administration time 20 (7-50) 13 (6-38) <0.001
Overall personnel patient management time 12 (3-52) 9 (1-24) <0.001
Overall personnel time 36 (13- 92) 33 (10-60) <0.001
Median and 90% central range
Cost analysis
In hospitals and health centres, the mean (SD) total costs per patient treated for severe
malaria with injectable artesunate were USD 51.94 (16.20) and 19.51 (9.58); and USD 60.35
(17.73) and 20.36 (6.80) with injectable quinine. Costing details for individual study sites are
given in Table 5-6.
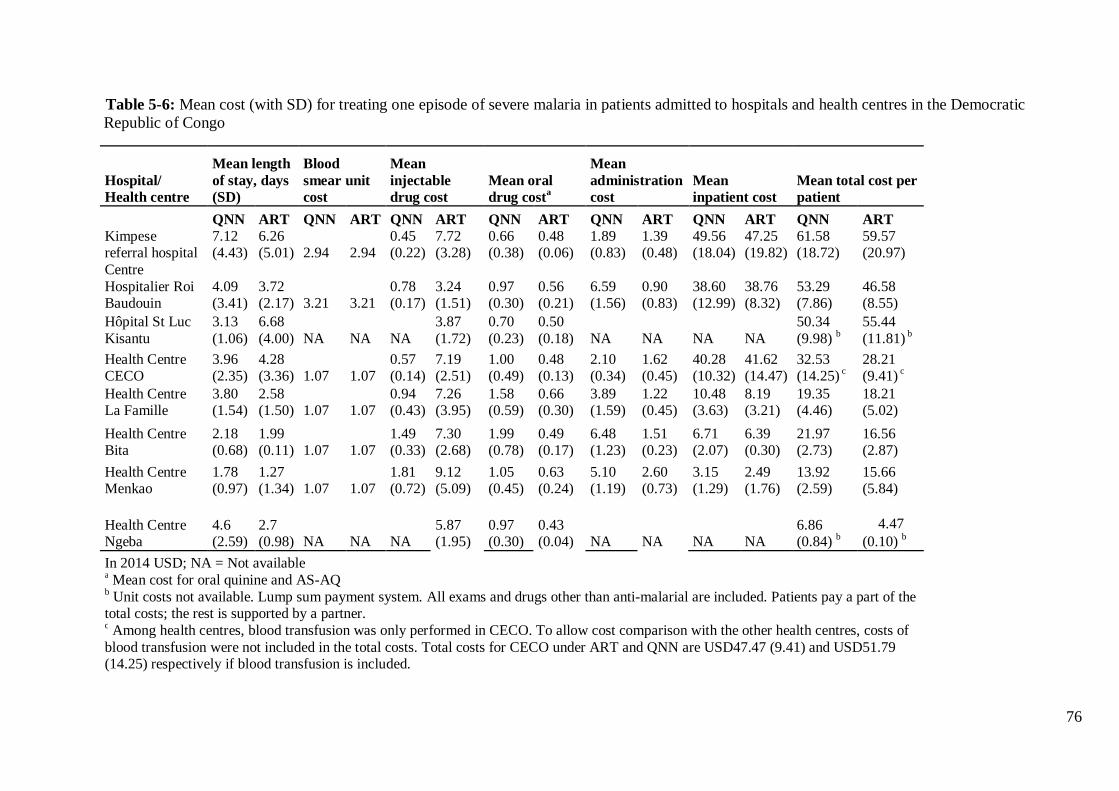
76
Table 5-6: Mean cost (with SD) for treating one episode of severe malaria in patients admitted to hospitals and health centres in the Democratic Republic of Congo
Hospital/ Health centre
Mean length of stay, days (SD)
Blood smear unit cost
Mean injectable drug cost
Mean oral drug costa
Mean administration cost
Mean inpatient cost
Mean total cost per patient
QNN ART QNN ART QNN ART QNN ART QNN ART QNN ART QNN ART
Kimpese referral hospital
7.12 (4.43)
6.26 (5.01) 2.94 2.94
0.45 (0.22)
7.72 (3.28)
0.66 (0.38)
0.48 (0.06)
1.89 (0.83)
1.39 (0.48)
49.56 (18.04)
47.25 (19.82)
61.58 (18.72)
59.57 (20.97)
Centre Hospitalier Roi Baudouin
4.09 (3.41)
3.72 (2.17) 3.21 3.21
0.78 (0.17)
3.24 (1.51)
0.97 (0.30)
0.56 (0.21)
6.59 (1.56)
0.90 (0.83)
38.60 (12.99)
38.76 (8.32)
53.29 (7.86)
46.58 (8.55)
Hôpital St Luc Kisantu
3.13 (1.06)
6.68 (4.00) NA NA NA
3.87 (1.72)
0.70 (0.23)
0.50 (0.18) NA NA NA NA
50.34 (9.98) b
55.44 (11.81) b
Health Centre CECO
3.96 (2.35)
4.28 (3.36) 1.07 1.07
0.57 (0.14)
7.19 (2.51)
1.00 (0.49)
0.48 (0.13)
2.10 (0.34)
1.62 (0.45)
40.28 (10.32)
41.62 (14.47)
32.53 (14.25) c
28.21 (9.41) c
Health Centre La Famille
3.80 (1.54)
2.58 (1.50) 1.07 1.07
0.94 (0.43)
7.26 (3.95)
1.58 (0.59)
0.66 (0.30)
3.89 (1.59)
1.22 (0.45)
10.48 (3.63)
8.19 (3.21)
19.35 (4.46)
18.21 (5.02)
Health Centre Bita
2.18 (0.68)
1.99 (0.11) 1.07 1.07
1.49 (0.33)
7.30 (2.68)
1.99 (0.78)
0.49 (0.17)
6.48 (1.23)
1.51 (0.23)
6.71 (2.07)
6.39 (0.30)
21.97 (2.73)
16.56 (2.87)
Health Centre Menkao
1.78 (0.97)
1.27 (1.34) 1.07 1.07
1.81 (0.72)
9.12 (5.09)
1.05 (0.45)
0.63 (0.24)
5.10 (1.19)
2.60 (0.73)
3.15 (1.29)
2.49 (1.76)
13.92 (2.59)
15.66 (5.84)
Health Centre Ngeba
4.6 (2.59)
2.7 (0.98) NA NA NA
5.87 (1.95)
0.97 (0.30)
0.43 (0.04) NA NA NA NA
6.86 (0.84) b
4.47 (0.10) b
In 2014 USD; NA = Not available a Mean cost for oral quinine and AS-AQ b Unit costs not available. Lump sum payment system. All exams and drugs other than anti-malarial are included. Patients pay a part of the total costs; the rest is supported by a partner. c Among health centres, blood transfusion was only performed in CECO. To allow cost comparison with the other health centres, costs of blood transfusion were not included in the total costs. Total costs for CECO under ART and QNN are USD47.47 (9.41) and USD51.79 (14.25) respectively if blood transfusion is included.

77
5.5 Discussion
This study is the first to quantify key operational parameters in the management of patients
with severe malaria treated with injectable artesunate. Injectable artesunate was superior to
quinine for almost all of the parameters assessed. Furthermore, from the provider’s
perspective, overall costs were lower for injectable artesunate in hospitals and similar in
health centres. The aim of the study was to assess operational aspects rather than safety and
efficacy. However, there was no indication for any of the outcomes obtained from available
clinical charts that patients fared worse with injectable artesunate compared to parenteral
quinine, concurring with available data on the efficacy and safety of the use of injectable
artesunate in the DRC (Dondorp et al. 2010).
A major reason for conducting the study in two phases was the need for comparative
operational data between the new regimen and the old regimen. Because many aspects in
health services are setting-specific, it was thought that the best controls would be the facilities
themselves. The strongest study design would include a randomised concurrent control trial
with enough health facilities to account for inter-facility variability, however, time and
logistical reasons precluded such an approach for the current study. The design outlined here
was the best suited to the Ministry of Health’s current plan for scaling up artesunate. The
operational parameters of treating severe malaria are unlikely to be sensitive to seasonal
effects, and also unlikely to change much in a given facility over time periods equal to that of
the study. Hence, although not randomised, this design allowed a reasonable comparison of
the two regimens in real-world implementation settings. Although injectable quinine has been
the mainstay for treating severe malaria for many years, there are virtually no existing data in
the literature quantifying the operational parameters of interest.
In this study, patients admitted with severe malaria experienced a median delay of three hours
before receiving their initial quinine dose compared to two hours with artesunate (Table 5-3).
This time delay depended on several factors that should be further investigated. In particular,
it could reflect the difficulties of promptly and safely administering quinine via IV. Although
comparable in its preparation, quinine is a difficult drug to administer because of its
unfavourable safety profile; it requires correct dose calculation, taking into account previous
quinine treatment to avoid overdosing and serious consequences for the patient.
In the AQUAMAT trial (Dondorp et al. 2010), the risk of children dying while waiting to
receive quinine was almost four times higher than the risk in children treated with artesunate.
78
This delay adds to the time needed for referral, during which the condition of the patient can
deteriorate (WHO, 2010). In this study, two patients died before receiving quinine compared
to none in the artesunate group. Although this delay is still critical for both regimens, it can
be expected to decrease further for injectable artesunate as skills and confidence are acquired
through repeated administration and preparation by health personnel.
The well-known difficulties in administering quinine may also explain the difference
observed in the time interval between the beginning of the parenteral treatment and the
initiation of oral treatment. Lack of confidence or uncertainty in reconstructing the history of
previous treatments with quinine could potentially limit the number of doses a patient
receives. According to the national DRC directives on the treatment of severe malaria (PNLP
2012), the number of doses of quinine administered should be minimised until the patient can
tolerate an oral medication. Under the artesunate regimen in this study, the WHO’s
recommendations of a minimum of three injections during the first 24 hours, irrespective of
the patient’s ability to tolerate oral medication were strictly followed. This is one possible
explanation for the prolonged time interval to the initiation of oral therapy.
The artesunate regimen achieved parasite clearance faster than the quinine regimen, which
likely accounts for the shorter hospital stay. The reduction in median hospital stay by a day
reduces costs of malaria treatment and minimises socio-economic impacts on patients and
their families. This is especially important for poorer and more vulnerable segments of the
population.
The estimated costs of treating a patient with severe malaria in this study are similar to those
calculated in previous studies (Lubell et al. 2009; Lubell et al. 2011), although lower than
those reported by Kyaw et al., which used a more detailed cost analysis approach (Kyaw et
al. 2014). The costs were highly variable, depending on the level and type of facility (public,
private or missionary). The mean pooled estimate total cost was found to be similar for
artesunate compared to quinine in health centres, USD 19.51 (9.58) and 20.36 (6.80), while
lower in hospitals, USD 51.94 (16.20) to USD 60.35 (17.73). Inpatient costs were the major
driver costs for the difference observed between hospitals and health centres. Less
standardized inpatient costs are established by each hospital and health centre and take into
account a number of parameters, which include cost of labour, and the organisation of the
health service.

79
Since it was not possible to analyse all patient costs, particularly the cost related to supportive
measures and the presence of co-morbidities, the total treatment costs are clearly
underestimated. For the purpose of this study, a new vial of quinine was used for every dose,
but this is not necessarily the case in the real world. As a result, drug costs were likely
overestimated. However, not all sessions of drug preparation and administration were
included due to understaffed health centres and the inability to reliably observe the most
severe cases in need of prompt treatment.
The results show that the overall time spent on pre-administration tasks and on direct post-
treatment patient care was slightly lower in the artesunate compared to the quinine group.
Although statistically significant, this time difference is smaller than expected considering
that artesunate is easier to use. This could be explained by the fact that health personnel had a
limited time to get used to preparing and administering artesunate before starting patient
enrolment in the second phase. Therefore, it could be that the overall difference in the pre-
administration times will increase over time, in favour of artesunate. The overall personnel
time spent on patient care was lower with artesunate administration compared to quinine.
This is likely to have resulted in more time to care for other patients, leading to a positive
effect on the overall quality of care. This was consistent with health care providers’ higher
satisfaction when using artesunate, as described elsewhere (Ntuku et al. 2016).

80
5.6 Conclusions
This study provides for the first time descriptive evidence of the effectiveness and
practicability of using injectable artesunate for treating severe malaria in hospitals and health
centres in the DRC. For most operational and cost parameters, injectable artesunate was
found to be superior to injectable quinine. Combined with its higher efficacy, these findings
support the rapid switchover in the country. These findings also provide some useful
operational and cost data for national authorities and for local health care managers involved
in planning the transition.
Training health personnel is obviously a key factor for a successful transition, including a
change in the attitudes and behaviours of providers.
The MATIAS study has contributed further evidence that injectable artesunate is a better
treatment option than injectable quinine for patients with severe malaria. The findings
suggest that transition to the new drug should be accelerated as quickly as possible. The
Ministry of Health of the DRC is currently scaling up the use of injectable artesunate in the
public sector, with the support of the GFATM and the other partners, which will enable 100%
coverage of in-patient cases within a three-year period.
81
6 Feasibility and acceptability of injectable artesunate for the
treatment of severe malaria in the Democratic Republic of
Congo
Henry Maggi Ntuku1,2,3, Gianfrancesco Ferrari2,3, Christian Burri2,3, Antoinette Kitoto
Tshefu1, Didier Mitembo Kalemwa2,3, Christian Lengeler2,3
1 Kinshasa School of Public Health, Kinshasa, Democratic Republic of the Congo. 2Swiss Tropical & Public Health Institute, Basel, Switzerland. 3University of Basel, Basel, Switzerland.
This paper has been published in the Malaria Journal 2016, 15:18.

82
6.1 Abstract
Background
The Democratic Republic of the Congo (DRC) changed its national policy for the treatment
of severe malaria in both children and adults in 2012 from intravenous quinine to injectable
artesunate. The country is now planning to deploy nationwide injectable artesunate as the
preferred treatment for the management of severe malaria. To support this process, the
feasibility and acceptability of the use of injectable artesunate in the context of the DRC was
assessed, from the perspective of both health care providers and patients/caretakers.
Methods
Questionnaires and observations were used to collect information from health care providers
and patients/caretakers in eight health facilities in the Province of Kinshasa and in the
Province of Bas-Congo.
Results
A total of 31 health care providers and 134 patients/care takers were interviewed. Seventy
five percent (75%) of health care providers found it less difficult to prepare injectable
artesunate compared to quinine. None of them encountered problems during preparation and
administration of injectable artesunate. The large majority of care providers (93%) and
patients/caretakers (93%) answered that injectable artesunate took less time than quinine to
cure the symptoms of the patients. Twenty-six (84%) health care providers reported that the
personnel workload had diminished with the use of injectable artesunate. Seven (22.6%)
health workers reported adverse drug reactions, of which a decrease in the haemoglobin rate
was the most common (71.4%). All care providers and the vast majority of
patients/caretakers (96%, N=128) were either satisfied or very satisfied with injectable
artesunate.
Conclusions
These findings show that the use of injectable artesunate for the treatment of severe malaria is
feasible and acceptable in the context of DRC, with appropriate training of care providers.
Both care providers and patients/caretakers perceived injectable artesunate to be effective and
safe, thus promoting acceptability.

83
6.2 Background
In the Democratic Republic of the Congo (DRC), malaria is one of the leading causes of
death in children under five years of age, with an estimated 9,000,000 cases and 22,000
deaths reported in 2012 (PNLP 2013a). As a result, the DRC is the second country in the
world in terms of burden of malaria (WHO 2013c; PNLP 2013b). For severe malaria, the
case fatality is reaching 10% (Likwela et al. 2012). Severe malaria is obviously a medical
emergency, and reducing its burden is currently the highest priority of malaria control, as
evidenced by the Roll Back malaria (RBM) target of near-zero deaths by 2015 (Roll Back
Malaria Partnership 2011).
For the management of severe malaria cases, comparative clinical trials between quinine and
injectable artesunate have demonstrated that the treatment with artesunate was associated
with a substantial reduction of case fatality in both children and adults (Dondorp et al. 2005;
Dondorp et al. 2010; Sinclair et al. 2012). In addition, intravenous artesunate offers a number
of programmatic advantages over quinine in terms of not requiring rate-controlled infusion or
cardiac monitoring (WHO 2013a). These results led to a change in the WHO guidelines for
the treatment of severe malaria in 2011, recommending intravenous artesunate as the
preferred treatment for severe malaria in children and adults (WHO 2011b). As a result of
this change, an additional 195,000 deaths could be averted every year in Africa (MMV 2012).
Following the new WHO guidelines, the National Malaria Control Programme (NMCP) of
the DRC changed the national policy for the treatment of severe malaria in both children and
adults from intravenous quinine to injectable artesunate in 2012 (PNLP 2012). However, this
policy change requires a number of clinical and operational adaptations, as quinine has been
the treatment of choice for many decades. The national strategic plan set up an
implementation period of three years to scale up injectable artesunate.
The handling of injectable artesunate is reported to be easier compared to quinine, however a
number of operational issues such as dosing and preparation of the drug may hinder its use.
One important element for a successful transition, besides logistical aspects, is ensuring that
there is a high acceptability of the new treatment by the health care providers, as well as by
the patients. Finally, there is also a need to determine the perceived effectiveness and safety
of the new treatment. These factors are a prerequisite for achieving a successful rollout and
therefore high public health impact.
84
Here we investigate the feasibility and acceptability of the use of injectable artesunate in the
context of the DRC, to identify arising issues and propose solutions before the start of the
national rollout.
Although a number of studies have investigated the efficacy of injectable artesunate for the
treatment of severe malaria as well as some issues related to its use (Burri et al. 2014), none
has focused so far on the feasibility of the implementation of the new IV/IM anti-malarial
drug from the perspective of care providers, as well as its acceptability from the perspective
of patients/caretakers.
6.3 Methods
Study sites
This study was conducted as part of the MATIAS study (Treatment of severe malaria – An
operational comparative study for the treatment of severe malaria between quinine and
artesunate in Hospitals and Health Centres of Kinshasa and Bas Congo province). The
MATIAS study was a non-controlled operational comparative study conducted in children
and adults admitted with severe malaria to hospital and health centres (Ferrari et al. 2015).
The study was implemented in eight health facilities (three hospitals and five health centres)
in Greater Kinshasa, the capital of the DRC (Referral Hospital Roi Baudoin, Health Centre
Bita, Health Centre Menkao) and in the Province of Bas Congo (Referral Hospital Saint Luc
Kisantu, Health Centre Ngeba, Referral hospital of Kimpese, Health Centre Ceco, Health
Centre La Famille). Figure 6-1 shows the location of the study sites. Selected health facilities
were representative of typical health facilities in the country including a large public health
hospital; a medium-sized, non-profit, missionary hospital; a medium-sized, government
hospital (Centre Hospitalier Roi Baudouin) and rural health centres.
Kinshasa sites serve urban and semi-rural populations, whereas the Bas-Congo sites serve a
largely rural population. All sites are hyper to holoendemic for malaria and transmission is
perennial with seasonal variation (MAP 2010). At the time the study started, injectable
artesunate had not been deployed to public health facilities and was not available in the
private sector.
The MATIAS study was conducted in two consecutive phases. In the first phase, in the eight
selected study sites, a target number of 350 patients were recruited over three months, from
October 2012 to January 2013, with intravenous quinine as the treatment drug.

85
In the second phase, following the introduction of injectable artesunate, the same target
number of patients were recruited over the three months period, from April to July 2013. A
three-month interval was kept between the two phases in order to train the healthcare
providers from the study sites in the preparation and administration of the new drug.
With regard to the use of injectable artesunate in hospitals, clinicians were responsible for
prescribing the drug, specifying the dose needed and the schedule of dosing and evaluating
patients’ progress while nurses prepared and administered the drug. In health centres, nurses
were responsible for all aspects of drug use.
The MATIAS study included four key components: (1) clinical assessment of patients, (2) a
time and motion study, (3) financial costs, (4) feasibility and acceptability assessments
through providers and patients/caretakers questionnaires. The results of the first three
components are reported elsewhere (Ferrari et al. 2015), while the results of the fourth
component are reported here.
All interviews for the feasibility and acceptability assessment were conducted during the
second phase (artesunate phase) between April and July 2013, since the aim was chiefly to
compare assessments of quinine versus artesunate.
Participants belonged to two groups with separate questionnaires: (1) Health care providers
who prescribed or administered injectable artesunate during the MATIAS study and whose
verbal consent was obtained. A purposive sample of four health care providers per health
facility was interviewed, which represents the mean number of personnel trained in the use of
injectable artesunate per health facility. (2) patients/caretakers of patients who were treated
with injectable artesunate in each study site. A convenience sample of one third of all
patients/caretakers of patients attending follow up visits were interviewed. Patients/caretakers
of patients were eligible for interview if they had personal past experience with quinine
treatment or have taken care of another member of the family in the past treated with quinine
and they must give verbal consent. Patients or caretakers of patients were randomly selected.
Training and implementation of injectable artesunate
In preparation for the first part of the study (quinine treatment), a three-day training on study
procedures was given to all investigators and staff involved in the patient’s clinical
management in each hospital and health centre. The training included an update of
knowledge on malaria diagnosis and management. Before starting the second phase, a two-
day training on the preparation and administration of injectable artesunate was given to all
staff involved in clinical management in the study sites.
86
During these sessions a new training tool kit developed and provided by the Medicines for
Malaria Venture (MMV) product development partnership was used. This kit consisted of a
very detailed user guide; an explicit and straightforward job aid (Figure 6-2), and a practical
training video. Prior to patient recruitment, health care providers were allowed some time to
become familiar with the handling of the new drug under supervision.
Injectable artesunate (Guilin Pharmaceutical Co, Ltd, Shanghai, China) was packed in boxes
each containing one vial of 60 mg of artesunate powder for injection, one ampoule of sodium
bicarbonate and one ampoule of sodium chloride. The following steps were required prior to
drug injection: (1) calculation of the number of vials required based on patient weight, (2)
reconstitution of artesunate solution with sodium bicarbonate solution, (3) dilution of the
solution with sodium chloride.
Artesunate was given intravenously at a dose of 2.4mg/kg bodyweight at 0, 12 and 24 hours,
and then once a day until the patient was able to take oral treatment. In line with the WHO
recommendations (WHO 2013a), parenteral treatment was given for a minimum of 24 hours,
irrespective of the patient’s ability to tolerate oral medication. After completion of the
injectable treatment, the patient was given a full course of the recommended oral artemisinin-
based combination therapy, AS-AQ or AL. Alternatively, parenteral artesunate was given for
a maximum of seven days, until oral treatment could be taken reliably.
Patients were followed up at day 7, day 14, day 21 and day 28 after discharge. Artesunate
was provided free of charge by the manufacturer (Guilin Pharmaceuticals, Shanghai, PDR
China) while the costs of quinine were covered by the study. In each study site, patients were
managed by local clinicians (hospitals) or nurses (health centres), while the research team
carried out a weekly supervision at each study site throughout the duration of the study.
The NMCP provided policy support. All authorizations for drug importation were obtained
from the Ministry of Health through the National Drug Authority. All relevant authorities
were actively involved in the planning of the study and preliminary results of the study were
shared and discussed during stakeholders meetings. Unpublished preliminary results of the
study were used by the NMCP to develop training manuals for healthcare providers and
communication tools in prevision of the deployment of injectable artesunate.

87
Data collection
Two questionnaires were used to collect data. Interviews were conducted by nine trained
interviewers recruited from the local community. Two of them were physicians, four were
nurses and three were social workers. The two physicians were recruited from Kinshasa and
conducted interviews with all study physicians. Two nurses and one social worker were
recruited in Kinshasa and conducted interviews respectively with nurses and
patients/caretakers in Kinshasa sites. Two nurses and two social workers were recruited in
Bas Congo and conducted interviews respectively with nurses and patients/caretakers in Bas
Congo sites. These interviewers were supervised by study field scientists. A three-day
training was given to all interviewers prior to data collection. The training included
familiarization with the study tools and practicing interviews. Basic techniques of probing
and recording responses were also discussed during the training. Interview guides were
developed and pre-tested prior to use.
Interviews with care providers focused on ease of application and drug handling, perceived
safety of the treatment, quality of the patient management, perception of old versus new
treatment on staff work load, and level of satisfaction with the new treatment. The core
questions of the interviews compared injectable artesunate and quinine. While obviously
there could have been a recall bias due to the fact that the interviews were done during the
artesunate phase of the study, about 3-6 months after the quinine phase, this should not have
been too much of an issue since quinine has been used for decades in the DRC, and all health
care providers were very familiar with its use.
Interviews with patients/caretakers took place during the follow up visits and focused on the
perception of the effectiveness and safety of injectable artesunate, especially with regard to
adverse events. Here, recall bias could have been more of an issue since patients were less
familiar with quinine adverse events. In order to minimize this problem, one inclusion
criterion for the interviews of patients/caretakers was a past experience with quinine
treatment, either for themselves or for one member of the family.
According to the interviewee’s preference, interviews were conducted in French, the official
language in DR Congo or in Lingala and Kikongo, the languages spoken in Kinshasa and
Bas–Congo, respectively. Interviews typically lasted between twenty and thirty minutes.
Multiple choice closed-ended questions were followed by open-ended questions to collect
narrative responses. All answers were recorded in French by the interviewers.
88
Ethics
The MATIAS study protocol was reviewed and approved by the ethics committee of the
Kinshasa School of Public Health (University of Kinshasa) and by the ethics commission of
both cantons of Basel, EKBB (Ethikkommission beider Basel) in Switzerland. Informed
verbal consent was obtained from health care providers, patients and caretakers who
participated in the study.
Data processing and analysis
Quantitative data were entered electronically using Epi data 3.1 (Epidata Association;
Odense, Denmark). After standard quality control checks, data were transferred to Stata
version 12 (Stata Corporation; College Station, Texas) for analysis. Categorical variables
were compared using pearson’s Chi square test or fisher’s exact test in case the expected
value of any of the cells of the table was less than 5. A p-value ≤0.05 was considered
statistically significant. Qualitative data were summarized in emerging themes which were
coded and entered using Epi data 3.1. They are presented as proportions of different
variables. Some answers are reported as narratives.
6.4 Results
Health care providers
Key results of interviews with health care providers are summarized in Table 6-1. A total of
31 health care providers were interviewed, whereby medical doctors and nurses accounted for
22.6% (7/31) and 77.4% (24/31) of the interviewed personnel, respectively. The median
number of providers interviewed per health facility was four, ranging from three to five per
facility. The majority of the personnel interviewed (28/31, 90.3%) had more than three years
of working experience, whilst three individuals (9.7%) had one to three years experience.
None of the health care providers interviewed had used injectable artesunate before the
beginning of the study.
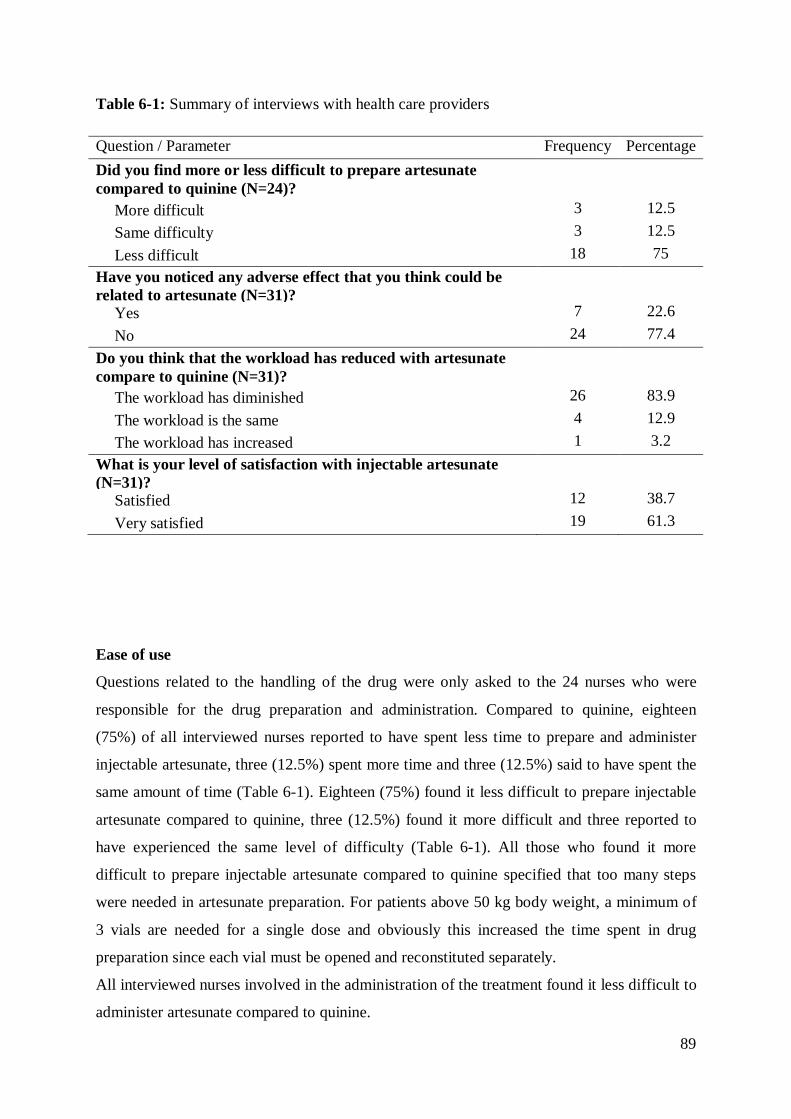
89
Table 6-1: Summary of interviews with health care providers
Question / Parameter Frequency Percentage Did you find more or less difficult to prepare artesunate compared to quinine (N=24)? More difficult 3 12.5 Same difficulty 3 12.5 Less difficult 18 75 Have you noticed any adverse effect that you think could be related to artesunate (N=31)? Yes 7 22.6 No 24 77.4 Do you think that the workload has reduced with artesunate compare to quinine (N=31)? The workload has diminished 26 83.9 The workload is the same 4 12.9 The workload has increased 1 3.2 What is your level of satisfaction with injectable artesunate (N=31)? Satisfied 12 38.7 Very satisfied 19 61.3
Ease of use
Questions related to the handling of the drug were only asked to the 24 nurses who were
responsible for the drug preparation and administration. Compared to quinine, eighteen
(75%) of all interviewed nurses reported to have spent less time to prepare and administer
injectable artesunate, three (12.5%) spent more time and three (12.5%) said to have spent the
same amount of time (Table 6-1). Eighteen (75%) found it less difficult to prepare injectable
artesunate compared to quinine, three (12.5%) found it more difficult and three reported to
have experienced the same level of difficulty (Table 6-1). All those who found it more
difficult to prepare injectable artesunate compared to quinine specified that too many steps
were needed in artesunate preparation. For patients above 50 kg body weight, a minimum of
3 vials are needed for a single dose and obviously this increased the time spent in drug
preparation since each vial must be opened and reconstituted separately.
All interviewed nurses involved in the administration of the treatment found it less difficult to
administer artesunate compared to quinine.

90
The most important reasons cited by the respondents were the rapid means of administration
(62.5%), no accidents related to infusion (45.8%) and the reduced patient monitoring time
(20.8%) (Table 6-1). None of the nurses interviewed encountered problems during drug
preparation and drug administration.
Perceived effectiveness and safety
Regarding the time to observe clinical effects, twenty nine (93.6%) health workers reported
that it took less time compared to quinine, one (3.2%) estimated it took the same time and
one (3.2%) estimated it took more time (Table 6-1). Thirty (96.7%) health care providers
reported to be very satisfied with the capacity of injectable artesunate to cure the symptoms
of their patients compared to quinine, one (3.2%) experienced the same satisfaction level, and
none found injectable artesunate less satisfactory.
Seven (22.6%) health workers reported to have noticed adverse drug reactions: The most
common ones mentioned were a decrease of haemoglobin rate (71.4%), shivering following
the drug injection (42.9%) and loss of weight (14.3%). However, all the seven health care
providers who reported adverse drug reactions answered that they were less frequent than
those observed with quinine (Table 6-1).
Patient management
The majority (96.8%) of health care providers reported to have dedicated less time for patient
monitoring after administration of artesunate compared to quinine. This proportion was not
significantly different according to the type of health facility (hospitals vs health centres;
p=0.388 Fisher’s exact test). Of all health care providers interviewed, twenty six (83.9%)
reported that the personnel workload had diminished with the use of injectable artesunate,
four (12.9%) reported the workload to be the same, while one (3.2%) reported that the
workload had increased (Table 6-1). The most important reasons for reported workload
reductions were reduced patient monitoring time (88.5%), saving of time by health personnel
(80.7%) and shorter treatment duration (15.4%). A reason reported by one health care
provider from Ngeba Health Centre for workload increase was increased patient monitoring
time.
91
Care providers general satisfaction
When health care providers were asked about their level of satisfaction with injectable
artesunate they were either satisfied (38.7%, 12/31) or very satisfied (61.3%, 19/31) with the
new treatment, with nobody giving negative feedback (Table 6-1). Reasons for being
satisfied/very satisfied were lack of adverse events (54.8%), rapid action of the drug (48.4%),
the easy way the drug is prepared and administered (29%), injectable artesunate being more
effective (29%) compared to quinine and workload reduction (25.8%). The level of
satisfaction towards injectable artesunate was not significantly different among type of health
facility (hospitals vs health centres; p=0.452 Fisher’s exact test) and health care providers
(medical doctors vs. nurses; p=0.384 Fisher’s exact test).
A nurse said about injectable artesunate : “ …I am very satisfied, it makes work easier, we
have good time management, patient monitoring has been improved, there are no side effects,
it has reduced mortality rate among children treated, the drug has attracted many patients to
come to our health facility”.
A medical doctor stated: “very satisfied ... it responds well, no side effects, but there’s a risk
of a high cost because it is so precise and easier to use that such a product can only be more
expensive than quinine... Good outcome after treatment.”
Patients or caretakers
Results of interviews with patients/caretakers are summarized in Table 6-2. A total of 134
patients/caretakers were interviewed (124 caretakers and 10 patients aged 12 years or older).
There were more female (73.3%, 96/134) than male (26.7%, 35/134) respondents (p-
value<0.05). Of the 124 caretakers interviewed, seventy six (61.3%) were mothers of
patients, thirty three (26.6%) were fathers, fourteen (11.3%) were other members of the
family and the remaining one (0.8%) was another member of the neighbourhood who
accompanied a two-year old female patient at Ceco Health Centre.
Effectiveness and safety
With regards to the time needed for injectable artesunate to cure the symptoms of the
patients, the large majority of respondents (93.3%, N=125) felt that it took less time
compared to quinine, while eight (6%) respondents said it took the same time and one (0.7%)
more time.

92
Forty-six (34.6%) respondents reported to have noticed adverse events; asthenia (63 %) and
loss of appetite (15.2%) were the most common ones, while eighty-seven (65.4%) did not
report any complication. The proportion of patients/caretakers reporting adverse events was
not significantly different from that of care providers (X2 =1.593, p-value=0.207). Statistical
analysis showed no significant difference in the occurrence of adverse events between
patients less than and more than five years of age (X2 =0.162, p-value=0.687). Of those who
reported to have noticed adverse events, thirty two (69.6%) considered that they were less
than those observed with quinine, while seven (15.2%) and one (2.1%) said respectively they
are the same and more than those observed with quinine. Six (13.1%) did not know. The
point made above on recall bias calls for some caution in the interpretation of these results.
Satisfaction
Regarding general satisfaction towards the ability of injectable artesunate to cure the
symptoms that motivated the patients’ consultation, the vast majority of patients/caretakers
(95.5%, N=128) reported to have been either satisfied or very satisfied (Table 6-2). Six
(4.5%) reported being less satisfied than with quinine, of whom three reported persistent
fever as a main reason for their dissatisfaction, while two (33.3%) reported asthenia and
dizziness. One respondent said he did not know what could be the long-term side effects of
this new drug. Patients/caretakers level of satisfaction was not significantly different among
type of health facility they consulted (p-value=0.46, Fisher’s exact test) and patient’s age (p-
value=0.77 Fisher’s exact test). When asked if they would choose or recommend injectable
artesunate over quinine again next time for themselves or a family member, the majority of
respondents (97.7%) said they would choose injectable artesunate. The most important
reasons for choosing artesunate were rapid action (47%), no or less adverse events (44.5%),
shorter treatment course and a shorter hospital stay (26.5%) (Table 6-2).
A mother said: “This is a short duration treatment, the symptoms disappear quickly. There is
less manipulation compared to quinine, where you have to be in bed for 4 hours of infusion
but with this treatment, just a few minutes of injection. This drug takes less time compared to
quinine and there are no side effects. I think it is better suited to malaria treatment for
children”

93
A young mother said: “Very satisfied - After the first injection, my child was doing fine
already. The fever had dropped quickly. The treatment duration is very short. We stayed for a
short time at the hospital”.
Table 6-2: Summary interview with patients/caretakers
Question / Parameter Frequency Percentage Have you noticed any side effect that you think could be related to artesunate? Yes 46 34.3 No 88 65.7 If you had to make the choice in the future between quinine and artesunate, which one would you choose? (N=121)
Quinine 4 3.3 Artesunate 117 96.7 Most important reasons for choosing injectable artesunate instead of injectable quinine (N=117)
Rapid action 55 35.3 No side effects 38 24.4 Short treatment course 24 15.4 Less side effects 14 9.0 Rapid way of administration 13 8.3 Short hospital stay 7 4.5 More efficacious 5 3.2 What is your level of satisfaction towards injectable artesunate? Dissatisfied 6 4.5 Satisfied 66 49.2 Very satisfied 62 46.3

94
6.5 Discussion
This study was designed to assess the feasibility and acceptability of the implementation of
IV/IM artesunate from the perspective of care providers, as well as its acceptability (versus
quinine treatment) from the perspective of the patients / caretakers. Results clearly show that
use of injectable artesunate for the treatment of severe malaria in the context of the DRC is
both feasible and well accepted. Patients/caretakers were very receptive to the new drug as
they perceived it as being highly effective. Despite a few number of health providers
reporting that several steps were needed in the preparation of artesunate, the handling of the
drug was perceived to be easy. The vast majority of providers reported to have spent less time
in this task. This is consistent with the results of quantitative measures of time and motion
reported by Ferrari et al., which showed that the overall cumulative staff time dedicated to
drug pre-administration tasks was 20 minutes for quinine compared to 13 minutes for
artesunate. This difference is expected to improve in favour of the latter with health personnel
gaining more experience (Ferrari et al. 2015).
Drug formulation had a significant impact on the duration of the preparation and
administration. The drug used in the study was packaged in vials of 60 mg which, when
reconstituted, was equivalent to 6 ml of solution for the intravenous route. For an average 60
kg body weight adult, this equates to prepare three vials and repeating three times all steps of
preparation, resulting in a longer preparation time.
On the other hand, this drug formulation may cause significant drug wastage especially in
small children who need small quantities. As the reconstituted solution is only stable for one
hour, and since an opened vial cannot be reused, it is possible to lose up to more than half of
the vial. In the context of limited resources, it is important that drug manufacturers develop
adapted and easy-to-use forms of injectable artesunate.
Contrary to artesunate, the administration of quinine requires special precautions because of
its potential toxicity, and close monitoring of the patient as the risk of incorrect dosage and
severe side effects is high (Wolf et al. 1992; Taylor & White 2004; AlKadi 2007; WHO
2013a). This leads to a reduced patient monitoring time with the use of injectable artesunate
which may explain the reported reduction of personnel workload which in turn has the
potential to improve the quality of care.
95
The superior efficacy of injectable artesunate compared to intravenous quinine in the
management of severe malaria has been demonstrated in clinical trials (Dondorp et al. 2005;
Dondorp et al. 2010; Sinclair et al. 2012). Because of its small-scale nature based on
purposive sampling, this study cannot draw a conclusion on the effectiveness of injectable
artesunate. However, both health care providers and patients/caretakers perceive artesunate to
be highly effective.
The findings from this study are consistent with what is known so far about the better short-
term safety of artesunate compared to quinine (Sinclair et al. 2012; Sam-wobo et al. 2012).
Patients/caretakers did not report significant adverse event, the commonly reported adverse
events (asthenia and loss of appetite) may be disease induced.
The most common adverse events reported by health workers was a decrease in haemoglobin,
a fact supporting recent findings on the occurrence of delayed anaemia after parenteral
artesunate for severe malaria (Rolling et al. 2013; Rolling et al. 2014; Burri et al. 2014).
However, the training received by health workers before the implementation of artesunate
had an emphasis on the monitoring of adverse events and especially a drop in haemoglobin,
and this may have influenced the frequency of reporting. The results of this study cannot be
used to draw conclusion on the safety of intravenous artesunate, but rather only as supportive
evidence to the acceptability of the new treatment.
The design with a lack of concurrent controls, the relatively small scale of the study and the
purposive sampling constitute a limitation to the generalizability of the findings. The majority
of interview questions were comparative between quinine and artesunate and the time
between interviews and prior experience with quinine treatment was not recorded, this could
have led to a recall bias, especially for interviews with patients/caretakers. Courtesy bias in
respondents’ answers could be possible as the drug cost was free for patients and interviewed
health care providers were involved in the MATIAS project. In order to minimize this,
interviews were conducted by independent interviewers recruited from the local community.
One of the major challenges in switching from quinine to injectable artesunate may be the
reluctance of health care workers to switch to a new treatment (MSF 2011). In this study, the
majority of health care providers were not aware of the latest evidence on safety and efficacy,
and they are very familiar with quinine treatment. Hence, it is important to promote the
benefits of injectable artesunate among health workers and train them well in the use of the
new treatment.

96
The new treatment guidelines should be included as soon as possible in the training curricula
in medical and nursing schools, and public awareness of the new drug should be raised
through effective communication channels.
6.6 Conclusions
The findings from this study showed that the use of injectable artesunate for the management
of severe malaria in hospitals and health centres of the DRC is feasible and acceptable to both
care providers and patients/caretakers. Injectable artesunate was perceived to be very
effective and safe. Training of health personnel is a key factor for a successful
implementation. This study provides for the first time operational evidence to support the roll
out of injectable artesunate in the DRC.
97
7 Long-Lasting Insecticidal Net (LLIN) ownership, use and cost
of implementation after a mass distribution campaign in Kasaï
Occidental Province, Democratic Republic of Congo
Henry Maggi Ntuku1,2,3, Laura Ruckstuhl2,3, Jean-Emmanuel Julo-Réminiac2,3, Solange E
Umesumbu4, Alain Bokota4, Antoinette Kitoto Tshefu1, Christian Lengeler2,3
1Kinshasa School of Public Health, Kinshasa, Democratic Republic of Congo. 2Swiss Tropical and Public Health Institute, Basel, Switzerland. 3University of Basel, Basel, Switzerland. 4National Malaria Control Programme, Democratic Republic of Congo.
This manuscript has been submitted to Malaria Journal

98
7.1 Abstract
Background
Long-Lasting Insecticidal Nets (LLIN) are a highly effective means for preventing malaria
infection and reducing associated morbidity and mortality. Mass free distribution campaigns
have been shown to rapidly increase LLIN ownership and use. Around 3.5 million LLIN
were distributed free of charge in the Kasaï Occidental Province in the Democratic Republic
of Congo (DRC) in September-October 2014, using two different approaches, a fixed
delivery strategy and a door-to-door strategy including hang-up activities.
Methods
Repeated community based cross sectional surveys were conducted two months before and
six months after the mass distribution. Descriptive statistics were used to measure changes in
key malaria household indicators. LLIN ownership and use were compared between delivery
strategies. Univariate and multivariate logistic regression analyses were used to identify
factors associated with LLIN use before and after the mass distribution. A comparative
financial cost analysis between the fixed delivery and door-to-door distribution strategies was
carried out from the provider’s perspective.
Results
Household ownership of at least one LLIN increased from 39.4% pre-campaign to 91.4%
post-campaign and LLIN universal coverage, measured as the proportion of households with
at least one LLIN for every two people increased from 4.1% to 41.1%. Population access to
LLIN within the household increased from 22.2% to 80.7%, while overall LLIN use
increased from 18.0% to 68.3%. Higher LLIN ownership was achieved with the fixed
delivery strategy compared with the door-to-door (92.5% [95% CI: 90.2%-94.4%] versus
85.2% [95% CI:78.5%-90.0%]) while distribution strategy did not have a significant impact
on LLIN use (69.6%[95% CI:63.1%-75.5%] versus 65.7%[95% CI:52.7%-76.7%]). Malaria
prevalence among children aged 6-59 months was 44.8% post-campaign. Living in a
household with sufficient numbers of LLIN to cover all members was the strongest
determinant of LLIN use. The total financial cost per LLIN distributed was 6.58 USD for the
fixed distribution strategy and 6.61 USD for the door-to-door strategy.

99
Conclusions
The mass distribution campaign was effective for rapidly increasing LLIN ownership and
use. These gains need to be sustained for long term reduction in malaria burden. The fixed
delivery strategy achieved a higher LLIN coverage at lower delivery cost compared with the
door-to-door strategy and seems to be a better distribution strategy in the context of the
present study setting.
Keywords Malaria, LLIN ownership, LLIN use, mass distribution campaign, LLIN cost,
delivery strategy, malaria prevalence, Democratic Republic of Congo.
100
7.2 Background
Long-Lasting Insecticidal Nets (LLIN) are a highly effective means of preventing malaria
infection and reducing associated morbidity and mortality, particularly in endemic areas
(Lengeler 2004; Lim et al. 2011). Accross sub-Saharan Africa, the use of LLIN has been
shown to be associated with an average parasite prevalence reduction of 20% (Lim et al.
2011). Sustained high coverage of LLIN and other effective interventions is essential to
achieve and maintain such gains in reduction of malaria burden, and therefore achieve the
joint target of the new action and investment to defeat malaria (AIM) and the global technical
strategy for malaria (WHO 2015a; Roll Back Malaria 2015). Mass free distribution
campaigns have been shown to rapidly increase LLIN ownership and use in several countries
(Bonner et al. 2011; Bennett et al. 2012; Larson et al. 2014). Accross Africa, different
distribution strategies such as fixed or door-to-door delivery have been used with varying
effects on LLIN coverage and use. Furthermore, despite overall LLIN scale up, several other
factors still influence LLIN use including demographic characteristics; individual’s
knowledge and beliefs related to malaria and LLIN; dwelling construction, family size,
sleeping arrangements; LLIN characteristics; environmental factors; community and cultural
characteristics; distribution strategy and household net density (Thwing et al. 2008; Atieli et
al. 2011; MacIntyre et al. 2012; Auta 2012; Bennett et al. 2012; Larson et al. 2014).
The Democratic Republic of Congo (DRC), through its National Malaria Control Programme
(NMCP) is in the midst of unprecedented efforts to rapidly scale up coverage of malaria
interventions. As recommended by the World Health Organisation (WHO) to achieve
universal coverage of LLIN, the NMCP has adopted a combined strategy of: free mass
distribution campaigns every three years and routine distribution through antenatal care visits
and immunisation services (WHO 2014a). While the mass distribution has been shown to be
the best approach to achieve rapid scale up (aiming to achieve at least 80% of people sleeping
under a LLIN), routine distribution is important for maintaining high levels (WHO 2013b)
(PNLP 2013a) .
Since the adoption of free of charge LLIN policy in 2006, over 75 million LLIN have been
distributed across the country, leading to a tremendous increase in ownership and use (PNLP
2013b). For example, the overall proportion of households with at least 1 LLIN increased
from 9% in 2007 to 70% in 2014 (DHS 2007; DHS 2014). However, the scale up of these
interventions has not been achieved across all geographic areas of the DRC.

101
Results of the 2013-2014 Demographic and Health Survey (DHS) showed a strong coverage
gradient between provinces with Orientale and Kasaï Occidental Provinces having the lowest
ownership rate at 47% and 58%, respectively. Furthermore, the lowest LLIN use in children
less than five years of age was reported in Kasaï Occidental at 36% (DHS 2014).
Consequently, as part of a larger effort by many partners to accelerate the progress towards
the goal of increasing coverage and use of LLIN, a mass distribution campaign was organised
in 2014, distributing approximately 3,5 million LLIN in Kasaï Occidental using two different
approaches, a fixed strategy and a door-to-door strategy with hang up activities. The aim of
this research was to measure changes in key malaria household indicators before and after the
LLIN mass distribution campaign, as well as malaria morbidity after mass distribution and to
identify factors associated with LLIN use. This study also compared the two distribution
strategies in terms of LLIN ownership, use and associated cost.
7.3 Methods
Study site
This study was conducted in the Kasaï Occidental Province, located in the centre of the
Southern part of the DRC (Figure 7-1). Kasaï Occidental spans over 170,000 square
kilometres and has an estimated 7.3 million inhabitants. The province has two districts (Lulua
and Kasaï) and one large city in each- Kananga and Tshikapa respectively. On the health
front it is divided into 44 Health Zones (HZ) grouped into 5 Health Districts. The HZ
represents the primary operational unit of the health system in DRC. It usually covers a
population of 100,000–150,000 in rural areas and 200,000–250,000 in urban centres. It
includes a general referral hospital, some health centres and about a dozen lower level health
facilities. Each HZ is further divided into 15 health areas (HA) on average, which represent
the lowest level of the health system. Each HA is clearly delimited and defined by the
Ministry of Health and usually has 10,000–15,000 inhabitants. In Kasaï Occidental Province,
malaria is endemic with stable transmission throughout the year. The DHS 2014 reported an
average malaria prevalence of 45% in children less than 5 years (DHS 2014), one of the
highest in the world. A previous mass distribution campaign in the province was organised in
2011.

102
Figure 7-1: Map showing the location of the study sites
Mass distribution campaign
A free LLIN distribution campaign took place in all HZ of Kasaï Occidental Province in 2014
using two different strategies: a) Fixed delivery strategy; b) door-to-door (hang up) strategy.
- Fixed strategy: This strategy was used to distribute nets in 35 of the 44 HZ in Kasaï
Occidental Province. Specially selected community volunteers were mobilised and trained to
visit each household before the campaign. The volunteers registered the number of residents
per household, issued a numbered coupon to be exchanged for LLIN on distribution day, and
delivered educational messages on malaria and the importance of sleeping under a treated net.
LLIN distribution was done at fixed sites at the ‘health area’ level and each household
presented their coupon in exchange for LLIN. The number of LLIN to be allocated per
household was calculated according to household size as follows: 1–2 persons=1 LLIN; 3–5
persons=2 LLIN; 6-8 persons=3 LLIN; 9 and more persons=4 LLIN.
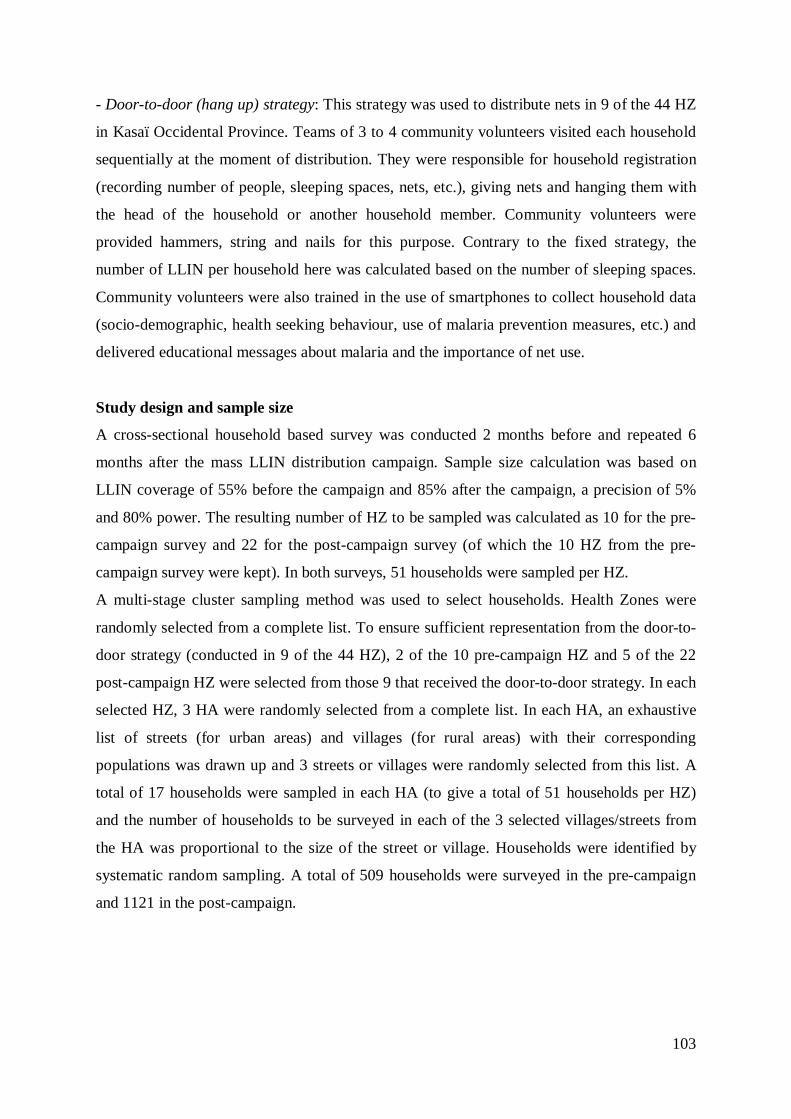
103
- Door-to-door (hang up) strategy: This strategy was used to distribute nets in 9 of the 44 HZ
in Kasaï Occidental Province. Teams of 3 to 4 community volunteers visited each household
sequentially at the moment of distribution. They were responsible for household registration
(recording number of people, sleeping spaces, nets, etc.), giving nets and hanging them with
the head of the household or another household member. Community volunteers were
provided hammers, string and nails for this purpose. Contrary to the fixed strategy, the
number of LLIN per household here was calculated based on the number of sleeping spaces.
Community volunteers were also trained in the use of smartphones to collect household data
(socio-demographic, health seeking behaviour, use of malaria prevention measures, etc.) and
delivered educational messages about malaria and the importance of net use.
Study design and sample size
A cross-sectional household based survey was conducted 2 months before and repeated 6
months after the mass LLIN distribution campaign. Sample size calculation was based on
LLIN coverage of 55% before the campaign and 85% after the campaign, a precision of 5%
and 80% power. The resulting number of HZ to be sampled was calculated as 10 for the pre-
campaign survey and 22 for the post-campaign survey (of which the 10 HZ from the pre-
campaign survey were kept). In both surveys, 51 households were sampled per HZ.
A multi-stage cluster sampling method was used to select households. Health Zones were
randomly selected from a complete list. To ensure sufficient representation from the door-to-
door strategy (conducted in 9 of the 44 HZ), 2 of the 10 pre-campaign HZ and 5 of the 22
post-campaign HZ were selected from those 9 that received the door-to-door strategy. In each
selected HZ, 3 HA were randomly selected from a complete list. In each HA, an exhaustive
list of streets (for urban areas) and villages (for rural areas) with their corresponding
populations was drawn up and 3 streets or villages were randomly selected from this list. A
total of 17 households were sampled in each HA (to give a total of 51 households per HZ)
and the number of households to be surveyed in each of the 3 selected villages/streets from
the HA was proportional to the size of the street or village. Households were identified by
systematic random sampling. A total of 509 households were surveyed in the pre-campaign
and 1121 in the post-campaign.
104
Data collection
Household survey questionnaire
In all selected households the head or another responsible member of the household was
interviewed after written informed consent was obtained. Interviewees were asked questions
on all household members (sex, education level, occupation, whether they slept under net
previous night), on all nets in the household (type, source, location and if it was slept under
the previous night) as well as general information about the house including number of
sleeping spaces and malaria knowledge. LLIN ownership and use were established by
respondent self-report, however data collectors also requested to observe all nets available in
the household at the time of the visit. The survey teams recorded the presence of material
goods in the household such as radios, electricity and various types of livestock, and also
noted types of toilets, types of roof and wall construction. From this, a composite household
wealth index was created using a principal components analysis (PCA) to determine
households’ socioeconomic status (Vyas & Kumaranayake 2006). Longitude and latitude
coordinates of all surveyed households were recorded on-site using the integrated Global
Positioning System (GPS) of the data collection devices. Data were collected using a
standardised questionnaire electronically programmed on tablets (Samsung Tab 3) running
Google Android operating system and equipped with Open Data Kit software (ODK,
University of Washington & Google Foundation). This questionnaire was adapted from the
standard Malaria Indicator Survey household questionnaire from the Roll Back Malaria
(RBM) partnership (WHO PMI UNICEF RBM Measure Evaluation 2013). It was developed
in French with oral translation into local language and dialects, and pre-tested prior to use in
the field. After daily quality control checks by field supervisors, completed data were sent
regularly to the central server housed at the Swiss Tropical and Public Health Institute (Swiss
TPH) for distant access and verification by members of the coordination team.
Blood testing
During the post-survey only, all eligible children aged 6 to 59 months present in surveyed
households were tested for malaria using the SD Bioline three bands P. falciparum/Pan
malaria Rapid Diagnostic Test (RDT) (Standard Diagnostics, Kyonggi, Republic of Korea)
and had haemoglobin levels measured using a blood haemoglobin photometer
(HemoCueHb201+ Ängelholm, Sweden). Children with positive malaria tests were given free
treatment with an artemisinin-based combination therapy (ACT), in particular Artesunate-
Amodiaquine (AS-AQ), the official first-line malaria treatment at the time of the survey in

105
the DRC. For children with signs of complicated malaria or low haemoglobin levels, parents
were advised to visit the nearest health facility.
Collection of cost data
A comparative financial cost analysis between the fixed delivery and door-to-door
distribution strategies was carried out from the provider’s perspective, which was defined as
the cost incurred by implementation agencies. Cost components of each distribution strategy
were identified using the ingredients approach. Costs were collected retrospectively using
financial expenditure records to capture financial costs from the accountant service of the
implementing agencies using a standardised spreadsheet developed by the NMCP. Costs
related to research activities were excluded. The procurement cost of LLIN including
purchase cost, shipment and custom clearance were included in the analysis. For the fixed
delivery strategy, costs were collected in Great British Pound (GBP) and converted into US
Dollars (USD) applying the 2015 average exchange rate of USD 1.5283 to the GBP
(OANDA n.d.). For the door-to-door strategy, costs were collected in USD. For each
distribution strategy the delivery cost per LLIN (i.e. total cost per net delivered) was
calculated. Calculations of 'per LLIN' costs under each distribution strategy were based on
the total number of LLIN recorded as distributed per strategy. Costs are presented in 2015
USD.
Measurements and indicators’ definition
Standard malaria household survey indicators were measured as recommended by the RBM
Monitoring and Evaluation Reference Group (MERG) (WHO PMI UNICEF RBM Measure
Evaluation 2013) as follows: Prevention indicators: 1) Proportion of households with at least
one LLIN; 2) Proportion of households with at least one LLIN for every two people; 3)
Proportion of population with access to an LLIN within their household (calculated as
previously described by Kilian et al (Kilian et al. 2013)); 4) Proportion of population that
slept under an LLIN the previous night; 5) Proportion of children under five years old who
slept under an LLIN the previous night; 6) Proportion of pregnant women who slept under an
LLIN the previous night; 7) Proportion of existing LLIN used the previous night. Case
management indicators: 8) Proportion of children less than five years old with fever in the
last two weeks who had a finger or heel stick; 9) Proportion of children less than five years
old with fever in the last two weeks for whom advice or treatment was sought; 10) Proportion
receiving an ACT (or other appropriate treatment), among children less than five years old
with fever in the last two weeks who received any antimalarial drugs. Morbidity indicators:

106
11) Malaria prevalence, defined as the proportion of children aged 6-59 months with a
positive RDT; 12) Anaemia prevalence, defined as the proportion of children aged 6-59
months with haemoglobin rate <8g/dl.
Data management and analysis
Data were extracted from the ODK aggregate server using the ODK Briefcase in the CSV
format and imported into STATA version 13 (Stata Corporation College Station, TX, USA)
for statistical analysis. Dichotomous outcomes were summarized as proportions with 95%
confident intervals. Continuous outcomes were described using their mean and standard
deviation, or median and 90 % central range if the distribution was skewed. The Pearson chi
square was used to compare proportions. Bivariate associations between the primary outcome
and hypothesized explanatory variables were first done to guide subsequent model building;
odds ratios and 95% confidence intervals were produced using logistic regression. After
testing individual bivariate associations, a backward selection procedure was used to create
an optimal multivariate model while adjusting for potential confounders. To take into account
clustering by HZ and HA, a multi-level mixed effects logistic regression model was used to
assess the association between the outcome and explanatory variables. Results are presented
as adjusted odds ratios with their 95% confidence intervals.
7.4 Results
Households characteristics
Table 7-1 displays the characteristics of all surveyed households. During the pre-campaign
survey, a total of 509 households were visited across 10 HZ including 3,227 people of which
51.5% were female. The median (90% central range) number of persons per household was 6
[2-12]; the median number of children less than five years of age per household was 1 [0-3].
In the post-distribution survey, 1,121 households were sampled of which 868 were from HZ
that received LLIN through the fixed delivery strategy and 253 were from HZ that received
LLIN through the door-to-door strategy. In total, 6,157 people were surveyed, 4,886 in HZ
with fixed strategy and 1,271 in HZ with door-to-door strategy and in both strategies, about
half (50.5%) of the surveyed people were female (fixed: 50%; door-to-door:52.5%). The
median number of persons per household was 5 [2-10] (fixed: 5 [2-10]; door-to-door: 5 [2-9])
and the median number of children less than five years of age per household was 1 [0-3]
(fixed: 1 [0-3]; door-to-door: 1 [0-2]).
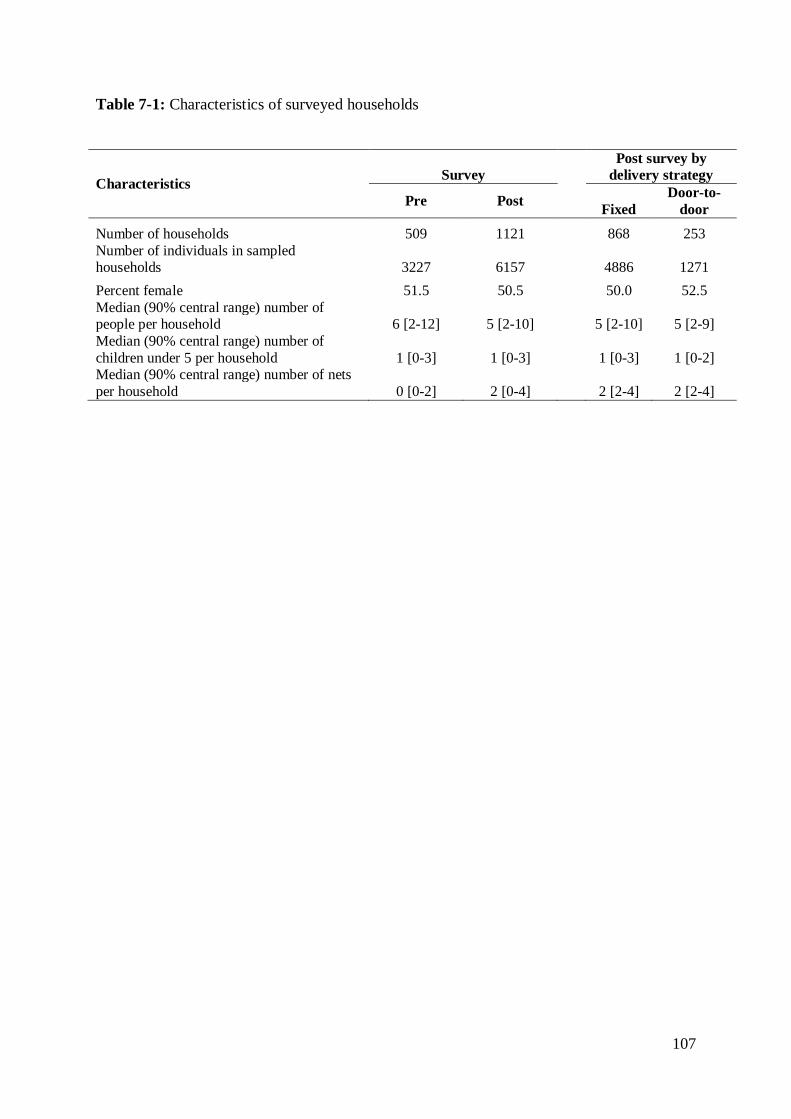
107
Table 7-1: Characteristics of surveyed households
Characteristics Survey Post survey by
delivery strategy
Pre Post Fixed Door-to-
door Number of households 509 1121
868 253
Number of individuals in sampled households 3227 6157
4886 1271
Percent female 51.5 50.5
50.0 52.5 Median (90% central range) number of people per household 6 [2-12] 5 [2-10]
5 [2-10] 5 [2-9]
Median (90% central range) number of children under 5 per household 1 [0-3] 1 [0-3]
1 [0-3] 1 [0-2]
Median (90% central range) number of nets per household 0 [0-2] 2 [0-4] 2 [2-4] 2 [2-4]

108
Households’ LLIN ownership and intra household access to LLIN
Table 7-2 shows key malaria household indicators before and after the campaign. Table 7-3
shows post-distribution indicators by distribution strategy. The proportion of households
owning at least one LLIN increased from 39.4% [95% CI: 32.2%-47.0%] before the
distribution to 91.4% [95% CI: 88.8%-93.4%] after the distribution (Table 7-2). Household
ownership of at least one LLIN after the distribution was significantly higher in HZ with
fixed delivery strategy compared to those with door-to-door strategy with a mean of 92.5%
[95% CI: 90.2%-94.4%] versus 85.2% [95% CI: 78.5%-90.0%] respectively (χ2=5.71
p=0.026) (Table 7-3).
LLIN universal coverage, measured as the proportion of households with at least one LLIN
for every two people increased from 4.1% [95% CI: 2.5%-6.5%] in the pre-campaign to
41.1% [95% CI: 36.1%-46.2%] in the post-campaign (Table 7-2). After the distribution, the
proportion of households owning at least one LLIN for every two people was significantly
higher in HZ with fixed delivery strategy compared to HZ with door-to-door strategy with a
mean of 44.1% [95% CI: 38.7%-49.7%] versus 30.9% [95% CI: 22.7%-40.6%] respectively
(χ2=5.14 p=0.034) (Table 7-3). The average number of LLIN in the surveyed households was
approximately one for every 2.5 people (Fixed: 1 LLIN: 2.4; door-to-door: 1 LLIN: 3).
To assess the performance of each delivery strategy, the proportion of households reached
during the campaign (proportion of households with at least 1 LLIN from the campaign) was
calculated while the proportion of households with sufficient LLIN (1 LLIN for every two
people) was calculated among those households that received at least 1 LLIN from the
campaign to assess the efficiency of each allocation method. The proportion of households
with at least 1 LLIN from the campaign (households reached) was significantly higher in HZ
that received LLIN through fixed delivery strategy compared to those that received LLIN
through the door-to-door strategy with a mean of 91.4% [95% CI: 89.1%-93.7%] versus
79.0% [95% CI: 70.2%-87.8%] respectively (χ2=13.87 p<0.001). Among households
reached, the proportion of those that received enough LLIN (1 LLIN for 2 people) did not
significantly vary by net allocation method (net per person: 50.0% [95% CI: 45.6%-54.5%];
net per sleeping space: 42.7% [95% CI: 29.2%-56.2%]; χ2=1.90 p=0.186).
In households containing more than four people, regardless of the delivery strategy, the mean
number of LLIN received from the campaign was consistently lower than the WHO
recommendation of one LLIN for every two people (figure 7-2).

109
Population access to LLIN within the household increased from 22.2% [95% CI: 17.9%-
27.3%] pre-campaign to 80.7% [95% CI: 76.8%-84.6%] post campaign (Table 7-2). The post
distribution access to a LLIN within the household did not vary by distribution strategy
(fixed: 85.0% [95% CI: 81.1%-88.2%]; door-to-door: 75.8% [95% CI: 65.3%-83.9%];
χ2=2.45 p=0.131) (Table 7-3).
Figure 7-2: Number of LLIN received from the mass distribution campaign by household
LLIN use
Overall LLIN use increased from 18.0% [95% CI: 14.5%-22.2%] in the pre-distribution
survey to 68.3% [95% CI: 62.9%-73.3%] after distribution. The overall use of LLIN was not
statistically different between HZ with different distribution strategies (fixed: 69.60% [95%
CI: 63.1%-75.5%]; door-to-door: 65.7% [95% CI: 52.7%-76.7%]; χ2=0.07 p=0.791) (Table
7-3).
Before the mass distribution campaign, LLIN use was lowest among the poorest wealth
quintile and progressively increased with increasing wealth with a concentration index of
0.12 [95% CI:0.02-0.22]. After the distribution no specific pattern was observed in the LLIN
use with regard to the socio economic status of the household with a concentration index of
0.02 [95% CI:0.00-0.02]. Figure 7-3 presents the Lorenz concentration curve describing the
equity in LLIN use before and after the campaign.
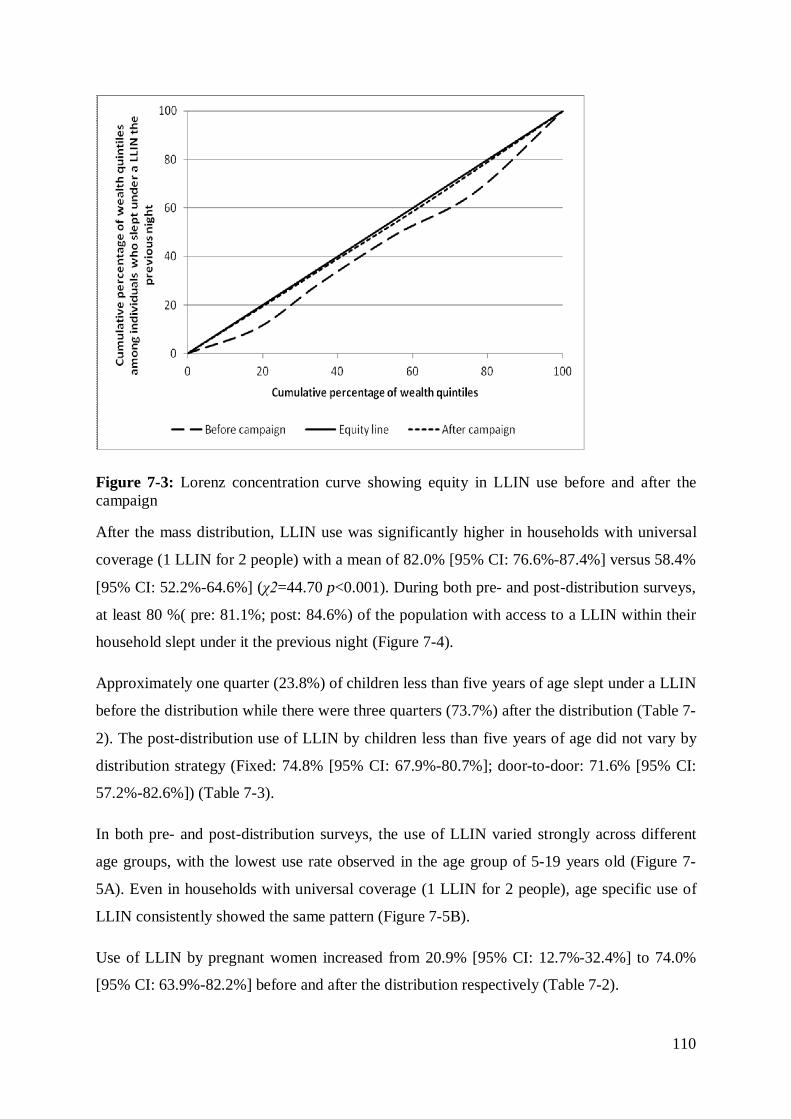
110
Figure 7-3: Lorenz concentration curve showing equity in LLIN use before and after the campaign
After the mass distribution, LLIN use was significantly higher in households with universal
coverage (1 LLIN for 2 people) with a mean of 82.0% [95% CI: 76.6%-87.4%] versus 58.4%
[95% CI: 52.2%-64.6%] (χ2=44.70 p<0.001). During both pre- and post-distribution surveys,
at least 80 %( pre: 81.1%; post: 84.6%) of the population with access to a LLIN within their
household slept under it the previous night (Figure 7-4).
Approximately one quarter (23.8%) of children less than five years of age slept under a LLIN
before the distribution while there were three quarters (73.7%) after the distribution (Table 7-
2). The post-distribution use of LLIN by children less than five years of age did not vary by
distribution strategy (Fixed: 74.8% [95% CI: 67.9%-80.7%]; door-to-door: 71.6% [95% CI:
57.2%-82.6%]) (Table 7-3).
In both pre- and post-distribution surveys, the use of LLIN varied strongly across different
age groups, with the lowest use rate observed in the age group of 5-19 years old (Figure 7-
5A). Even in households with universal coverage (1 LLIN for 2 people), age specific use of
LLIN consistently showed the same pattern (Figure 7-5B).
Use of LLIN by pregnant women increased from 20.9% [95% CI: 12.7%-32.4%] to 74.0%
[95% CI: 63.9%-82.2%] before and after the distribution respectively (Table 7-2).

111
The latter did not vary by distribution strategy (Fixed: 79.6% [95% CI: 64.0%-89.6%]; door-
to-door: 65.0% [95% CI: 34.4%-86.9%]) (Table 7-3).
After the distribution campaign, on average 66.7% [95% CI: 61.5%-71.5%] of existing LLIN
were used the previous night. This proportion was slightly higher in HZ with door-to-door
strategy compared to those with fixed strategy with a mean of 76.9% [95% CI: 68.0%-83.9%]
versus 63.7% [95% CI: 58.3%-68.8%] (χ2=9.01 p=0.007) (Table 3). On average, 2.4 sleepers
shared the same LLIN the previous night. Overall, around 60% of existing LLIN used the
previous night had one or two sleepers, considered as appropriate coverage while the rest had
more than two sleepers.
About 60% of interviewed household members reported to have heard or seen a message on
malaria or LLIN in the last thirty days. The most commonly mentioned sources of messages
were community health workers (46.2%), health centres (33.7%) and radio (32.3%), TV and
other mass media channels were mentioned by about 10 % of respondents. The most
commonly recalled message content were “nets prevent malaria” (66.6%) and “use a net
every night” (67.6%).
LLIN characteristics
During the post-distribution survey, a total of 2,479 LLIN were recorded in surveyed
households; 2,121 (85.6%) of which were observed. Of the 2,121 LLIN observed, 70.6%
[95% CI: 64.7%-76.4%] were hung at the time of the interview. The proportion of LLIN
hung per strategy was significantly higher in HZ with door-to-door strategy compared to the
fixed delivery strategy with a mean of 90.1% [95% CI: 86.0%-94.2%] versus 67.5% [95%
CI: 61.6%-73.3%] respectively (χ2=8.56 p=0.008). Nearly all (98%) of the LLINs observed
in households during the post-distribution survey were marked Permanet® and were obtained
from the mass distribution campaign.
Overall, 60% of households reported to have hung their LLIN the same day or the day
following its reception but this proportion was higher in HZ with door-to-door strategy than
in HZ with fixed delivery strategy (90.1% versus 52.6%). In HZ with fixed strategy, nearly
all households (98.7%) reported their LLIN were hung by a household member, whereas in
HZ with door-to-door strategy, over half of the households (56.5%) reported their LLIN were
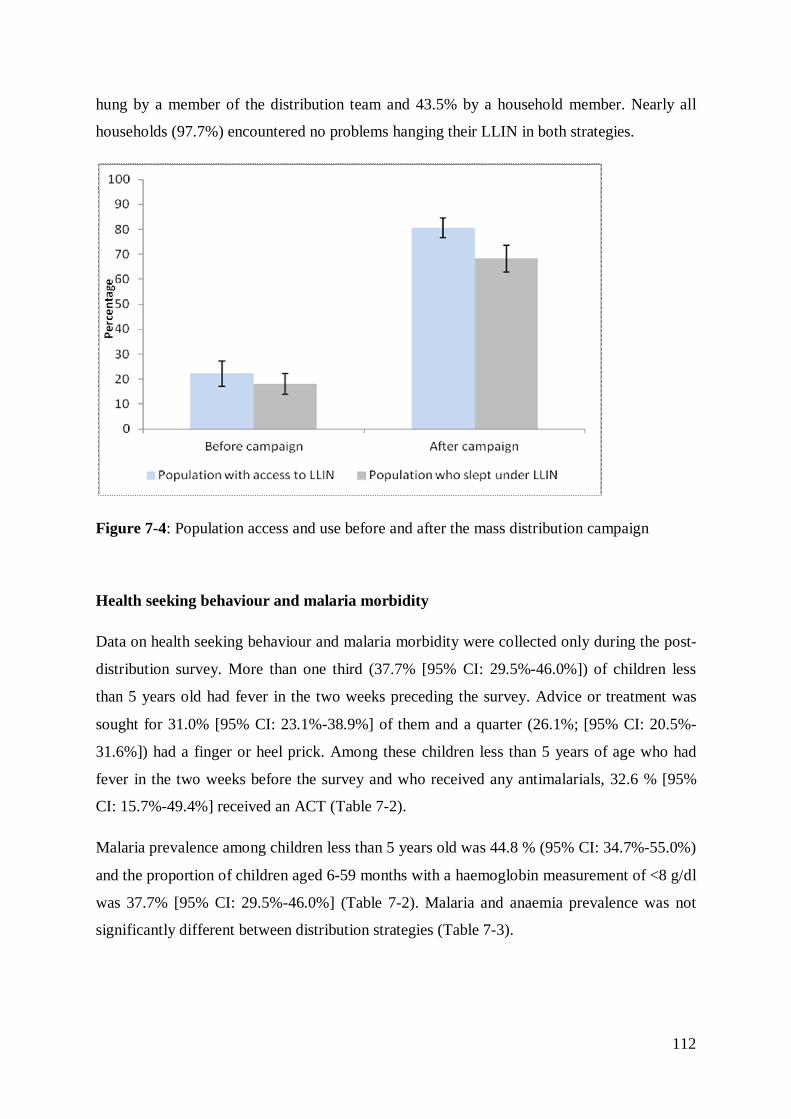
112
hung by a member of the distribution team and 43.5% by a household member. Nearly all
households (97.7%) encountered no problems hanging their LLIN in both strategies.
Figure 7-4: Population access and use before and after the mass distribution campaign
Health seeking behaviour and malaria morbidity
Data on health seeking behaviour and malaria morbidity were collected only during the post-
distribution survey. More than one third (37.7% [95% CI: 29.5%-46.0%]) of children less
than 5 years old had fever in the two weeks preceding the survey. Advice or treatment was
sought for 31.0% [95% CI: 23.1%-38.9%] of them and a quarter (26.1%; [95% CI: 20.5%-
31.6%]) had a finger or heel prick. Among these children less than 5 years of age who had
fever in the two weeks before the survey and who received any antimalarials, 32.6 % [95%
CI: 15.7%-49.4%] received an ACT (Table 7-2).
Malaria prevalence among children less than 5 years old was 44.8 % (95% CI: 34.7%-55.0%)
and the proportion of children aged 6-59 months with a haemoglobin measurement of <8 g/dl
was 37.7% [95% CI: 29.5%-46.0%] (Table 7-2). Malaria and anaemia prevalence was not
significantly different between distribution strategies (Table 7-3).

113
Figure 7-5: Age specific use of LLIN. Before and after the mass distribution campaign (5A). By coverage level after the mass distribution campaign (5B)
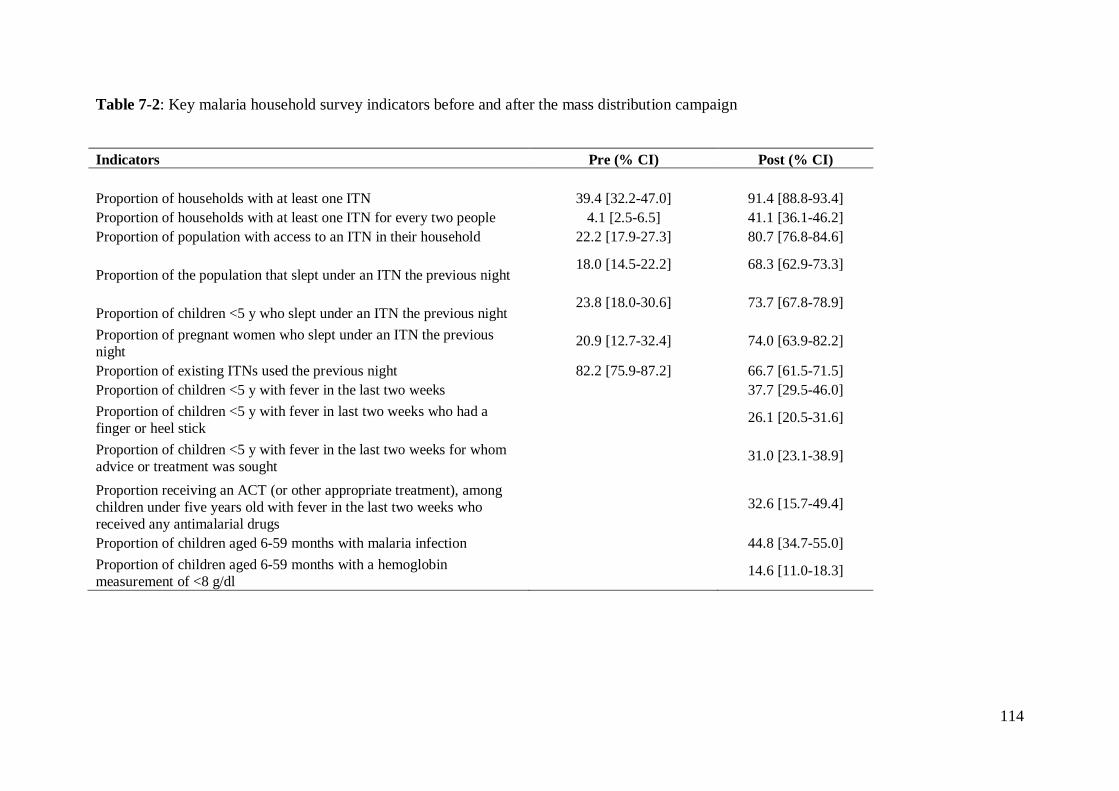
114
Table 7-2: Key malaria household survey indicators before and after the mass distribution campaign
Indicators Pre (% CI) Post (% CI)
Proportion of households with at least one ITN 39.4 [32.2-47.0] 91.4 [88.8-93.4] Proportion of households with at least one ITN for every two people 4.1 [2.5-6.5] 41.1 [36.1-46.2] Proportion of population with access to an ITN in their household 22.2 [17.9-27.3] 80.7 [76.8-84.6]
Proportion of the population that slept under an ITN the previous night 18.0 [14.5-22.2] 68.3 [62.9-73.3]
Proportion of children <5 y who slept under an ITN the previous night 23.8 [18.0-30.6] 73.7 [67.8-78.9]
Proportion of pregnant women who slept under an ITN the previous night
20.9 [12.7-32.4] 74.0 [63.9-82.2]
Proportion of existing ITNs used the previous night 82.2 [75.9-87.2] 66.7 [61.5-71.5] Proportion of children <5 y with fever in the last two weeks
37.7 [29.5-46.0]
Proportion of children <5 y with fever in last two weeks who had a finger or heel stick 26.1 [20.5-31.6]
Proportion of children <5 y with fever in the last two weeks for whom advice or treatment was sought 31.0 [23.1-38.9]
Proportion receiving an ACT (or other appropriate treatment), among children under five years old with fever in the last two weeks who received any antimalarial drugs
32.6 [15.7-49.4]
Proportion of children aged 6-59 months with malaria infection
44.8 [34.7-55.0] Proportion of children aged 6-59 months with a hemoglobin measurement of <8 g/dl
14.6 [11.0-18.3]

115
Table 7-3: Key malaria household survey indicators by distribution strategy
Indicators Fixed (% CI) Door-to-door
(% CI) χ2 p-value
Proportion of households with at least one ITN 92.5 [90.2-94.4] 85.2 [78.5-90.0] 5.71 0.026
Proportion of households with at least one ITN for every two people 44.1 [38.7-49.7] 30.9 [22.7-40.6] 5.14 0.034
Proportion of population with access to an ITN in their household 85.0 [81.1-88.2] 75.8 [65.3-83.9] 2.45 0.131
Proportion of the population that slept under an ITN the previous night 69.6 [63.1-75.5] 65.7 [52.7-76.7] 0.07 0.791
Proportion of children under five years old who slept under an ITN the previous night 74.8 [67.9-80.7] 71.6 [57.2-82.6] 0.12 0.729
Proportion of pregnant women who slept under an ITN the previous night 79.6 [64.0-89.6] 65.0 [34.4-86.9] 1.08 0.310
Proportion of existing ITNs used the previous night 63.7 [58.3-68.8] 76.9 [68.0-83.9] 9.01 0.007 Proportion of Children Aged 6-59 Months with Malaria Infection 37.8 [25.9-51.5] 64.9 [39.6-83.9] 2.78 0.110 Proportion of Children Aged 6-59 Months with a Hemoglobin Measurement of <8 g/dL 13.4 [10.1-17.6] 11.6 [6.6-19.6] 0.29 0.597

116
Determinants of LLIN use
The contribution of different factors associated with LLIN use before and after the
distribution is shown in tables 7-4 and 7-5. During the pre-distribution survey, there was no
evidence of association between use of LLIN and gender, while significant heterogeneities
were observed in LLIN use among age groups. Compared to children less than 5 years of age,
individuals aged 5-19 years were significantly less likely to sleep under a LLIN (OR = 0.26
[95% CI: 0.19, 0.34]) and those aged 30 years and above were significantly more likely to
use a LLIN (OR = 1.40 [95% CI: 1.06, 1.86]). A higher educational level of the head of the
household was associated with increased odds of sleeping under a LLIN (OR = 2.67 [95% CI:
1.15, 6.19]). Individuals living in households whose head was employed were also
significantly more likely to use a LLIN than those of other occupations (OR = 1.81 [95% CI:
1.06, 3.09]). There was no evidence of an association between LLIN use and the number of
persons per sleeping space, the knowledge of malaria transmission or the exposition to a
sensitisation message on malaria/LLIN., The wealthiest socio-economic quintile (compared
with the poorest) was associated with significant increased odds of sleeping under a LLIN
(OR = 2.79 [95% CI: 1.54, 5.07]).
Following the mass distribution, no association was found between gender and the use of
LLIN as before. The age specific use of LLIN showed the same pattern as before the
distribution, with the 5-19 years olds having the lowest odds of LLIN use (OR = 0.39 [95%
CI: 0.33, 0.46]) and the 30 years and above being more likely to use a LLIN (OR = 1.46
[95% CI:1.21, 1.78]) compared with children less than 5 years. As before the distribution,
occupation and educational level of the head of the household were significantly associated
with the use of LLIN. There was no evidence of association between the use of LLIN and the
distribution strategy. Individuals living in households whose head knew the cause of malaria
(OR = 1.39 [95%CI: 1.16, 1.68]) or have heard about malaria or LLIN in the last month (OR
= 1.57 [95%CI: 1.34, 1.84]) were more likely to sleep under a LLIN. The socio-economic
status of the household was not associated with LLIN use. Individuals living in households
owning at least one LLIN for every two people had the highest odds of sleeping under a
LLIN (OR = 3.79 [95%CI: 3.21, 4.49]).
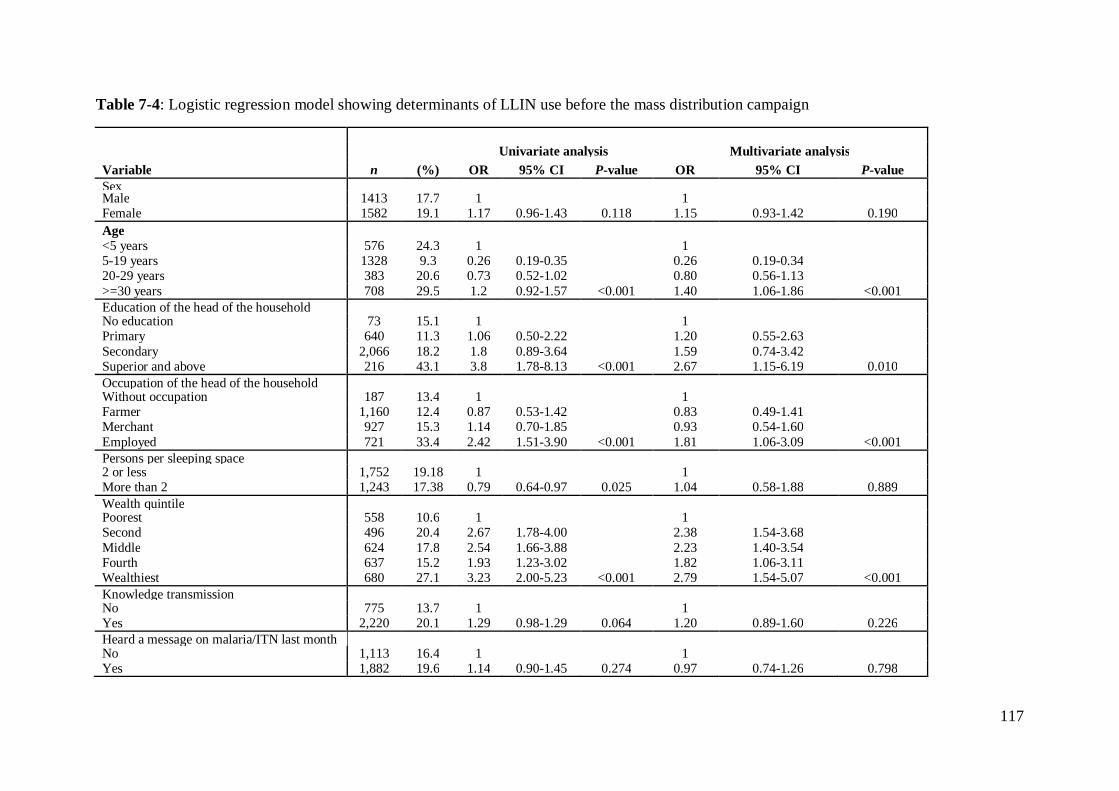
117
Table 7-4: Logistic regression model showing determinants of LLIN use before the mass distribution campaign
Univariate analysis Multivariate analysis Variable n (%) OR 95% CI P-value OR 95% CI P-value Sex
Male 1413 17.7 1
1
Female 1582 19.1 1.17 0.96-1.43 0.118 1.15 0.93-1.42 0.190 Age
<5 years 576 24.3 1
1
5-19 years 1328 9.3 0.26 0.19-0.35
0.26 0.19-0.34
20-29 years 383 20.6 0.73 0.52-1.02
0.80 0.56-1.13 >=30 years 708 29.5 1.2 0.92-1.57 <0.001 1.40 1.06-1.86 <0.001 Education of the head of the household
No education 73 15.1 1
1
Primary 640 11.3 1.06 0.50-2.22
1.20 0.55-2.63
Secondary 2,066 18.2 1.8 0.89-3.64
1.59 0.74-3.42 Superior and above 216 43.1 3.8 1.78-8.13 <0.001 2.67 1.15-6.19 0.010 Occupation of the head of the household
Without occupation 187 13.4 1
1
Farmer 1,160 12.4 0.87 0.53-1.42
0.83 0.49-1.41
Merchant 927 15.3 1.14 0.70-1.85
0.93 0.54-1.60 Employed 721 33.4 2.42 1.51-3.90 <0.001 1.81 1.06-3.09 <0.001 Persons per sleeping space
2 or less 1,752 19.18 1
1
More than 2 1,243 17.38 0.79 0.64-0.97 0.025 1.04 0.58-1.88 0.889 Wealth quintile
Poorest 558 10.6 1
1
Second 496 20.4 2.67 1.78-4.00
2.38 1.54-3.68
Middle 624 17.8 2.54 1.66-3.88
2.23 1.40-3.54 Fourth 637 15.2 1.93 1.23-3.02
1.82 1.06-3.11
Wealthiest 680 27.1 3.23 2.00-5.23 <0.001 2.79 1.54-5.07 <0.001 Knowledge transmission
No 775 13.7 1
1
Yes 2,220 20.1 1.29 0.98-1.29 0.064 1.20 0.89-1.60 0.226 Heard a message on malaria/ITN last month
No 1,113 16.4 1
1
Yes 1,882 19.6 1.14 0.90-1.45 0.274 0.97 0.74-1.26 0.798
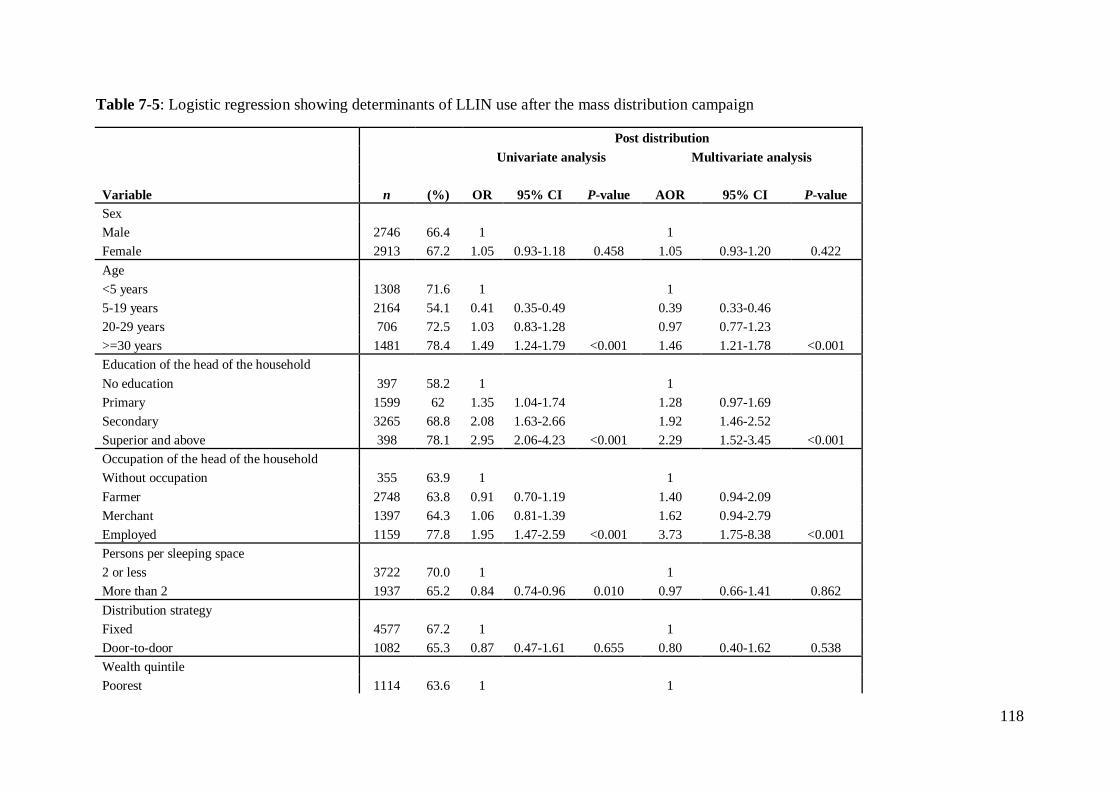
118
Table 7-5: Logistic regression showing determinants of LLIN use after the mass distribution campaign
Post distribution
Univariate analysis Multivariate analysis
Variable n (%) OR 95% CI P-value AOR 95% CI P-value Sex
Male 2746 66.4 1
1
Female 2913 67.2 1.05 0.93-1.18 0.458 1.05 0.93-1.20 0.422 Age
<5 years 1308 71.6 1
1
5-19 years 2164 54.1 0.41 0.35-0.49
0.39 0.33-0.46
20-29 years 706 72.5 1.03 0.83-1.28
0.97 0.77-1.23 >=30 years 1481 78.4 1.49 1.24-1.79 <0.001 1.46 1.21-1.78 <0.001 Education of the head of the household
No education 397 58.2 1
1
Primary 1599 62 1.35 1.04-1.74
1.28 0.97-1.69
Secondary 3265 68.8 2.08 1.63-2.66
1.92 1.46-2.52 Superior and above 398 78.1 2.95 2.06-4.23 <0.001 2.29 1.52-3.45 <0.001 Occupation of the head of the household
Without occupation 355 63.9 1
1
Farmer 2748 63.8 0.91 0.70-1.19
1.40 0.94-2.09
Merchant 1397 64.3 1.06 0.81-1.39
1.62 0.94-2.79 Employed 1159 77.8 1.95 1.47-2.59 <0.001 3.73 1.75-8.38 <0.001 Persons per sleeping space
2 or less 3722 70.0 1
1
More than 2 1937 65.2 0.84 0.74-0.96 0.010 0.97 0.66-1.41 0.862 Distribution strategy
Fixed 4577 67.2 1
1
Door-to-door 1082 65.3 0.87 0.47-1.61 0.655 0.80 0.40-1.62 0.538 Wealth quintile
Poorest 1114 63.6 1
1

119
Second 1081 66.2 1.04 0.84-1.27
0.94 0.71-1.25 Middle 1137 64.6 1.47 1.14-1.88
1.51 0.98-2.33
Fourth 1105 68.3 1.72 1.33-2.23
1.84 0.98-3.37 Wealthiest 1222 70.8 1.49 1.12-2.00 <0.001 1.53 0.67-3.46 0.061 Knowledge transmission No 1,121 62.1 1
1
Yes 4,538 68.0 1.47 1.25-1.73 <0.001 1.39 1.16-1.68 <0.001 Heard a message on malaria/ITN last month
No 2,110 61.4 1
1
Yes 3,549 70.0 1.74 1.51-2.00 <0.001 1.57 1.34-1.84 <0.001 At least 1 LLIN/2 people
No 3,730 58.79 1
1 Yes 1,929 82.27 3.35 2.89-3.88
3.79 3.21-4.49 <0.001
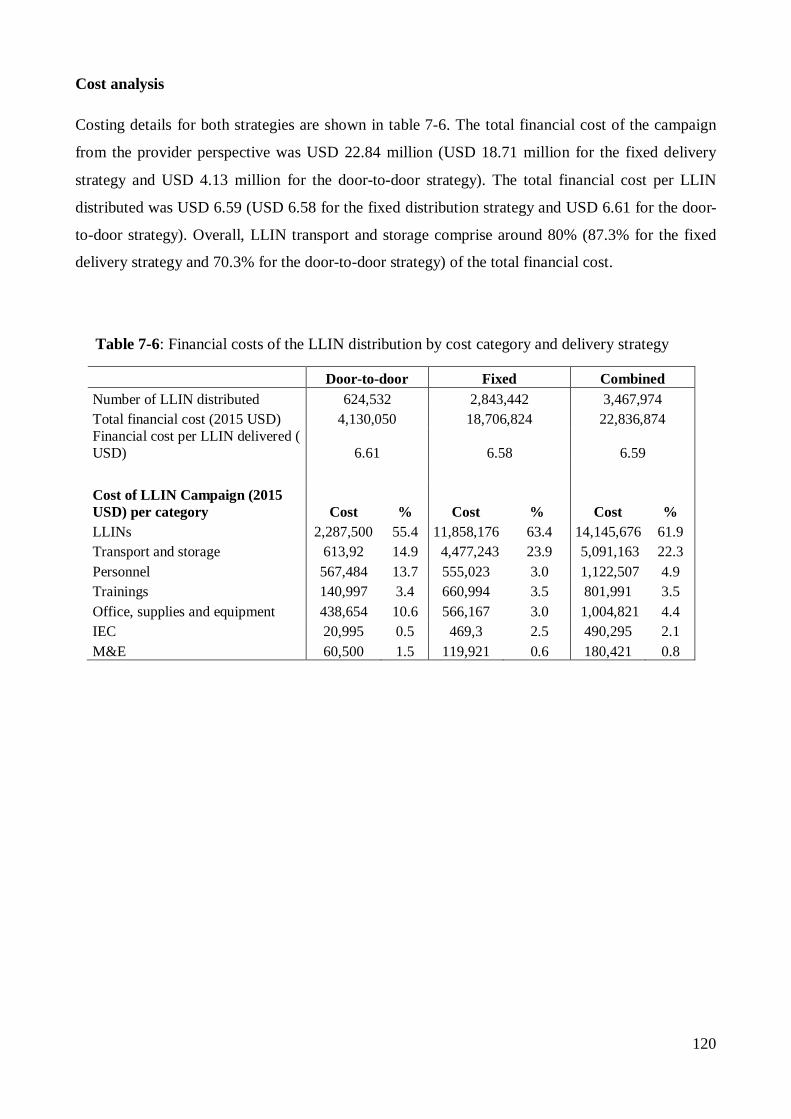
120
Cost analysis
Costing details for both strategies are shown in table 7-6. The total financial cost of the campaign
from the provider perspective was USD 22.84 million (USD 18.71 million for the fixed delivery
strategy and USD 4.13 million for the door-to-door strategy). The total financial cost per LLIN
distributed was USD 6.59 (USD 6.58 for the fixed distribution strategy and USD 6.61 for the door-
to-door strategy). Overall, LLIN transport and storage comprise around 80% (87.3% for the fixed
delivery strategy and 70.3% for the door-to-door strategy) of the total financial cost.
Table 7-6: Financial costs of the LLIN distribution by cost category and delivery strategy
Door-to-door Fixed Combined Number of LLIN distributed 624,532 2,843,442 3,467,974 Total financial cost (2015 USD) 4,130,050 18,706,824 22,836,874 Financial cost per LLIN delivered ( USD) 6.61 6.58 6.59
Cost of LLIN Campaign (2015 USD) per category Cost % Cost % Cost % LLINs 2,287,500 55.4 11,858,176 63.4 14,145,676 61.9 Transport and storage 613,92 14.9 4,477,243 23.9 5,091,163 22.3 Personnel 567,484 13.7 555,023 3.0 1,122,507 4.9 Trainings 140,997 3.4 660,994 3.5 801,991 3.5 Office, supplies and equipment 438,654 10.6 566,167 3.0 1,004,821 4.4 IEC 20,995 0.5 469,3 2.5 490,295 2.1 M&E 60,500 1.5 119,921 0.6 180,421 0.8
121
7.5 Discussion
Concerted efforts to scale up LLIN coverage through a free mass distribution campaign in the Kasaï
Occidental province have rapidly increased ownership and use of LLIN. In terms of coverage, RBM
targets of 80% of households owning at least 1 LLIN and 80% of population having access within
their household have been achieved. Universal coverage (defined as households with at least 1
LLIN for every 2 people) though below the 80% target, has shown a remarkable tenfold increase.
These findings are consistent with what is known about the effectiveness of mass distribution
campaigns to quickly scale-up LLIN coverage in low coverage areas (Bonner et al. 2011; Bennett et
al. 2012; Renggli et al. 2013; Larson et al. 2014). However, there had been a previous mass
distribution campaign in 2011 with high coverage values; hence the level of indicators found in the
pre-distribution survey was surprisingly low.
Following a universal free mass distribution campaign, the fact that less than half of surveyed
households had at least 1 LLIN for every 2 people can be surprising. This highlights a limitation of
the distribution campaign in quantifying the number of LLIN allocated per household, in particular
for households of more than 4 members. A study conducted in Sierra Leone six months after a mass
distribution campaign also showed that when limiting the maximum number of LLIN one
household can receive, households with more than 5 residents were less likely to have sufficient
LLIN to cover all occupants (Bennett et al. 2012).
Despite a dramatic increase in LLIN access and use overall, significant heterogeneities were
observed in LLIN use among age groups, with the lowest use rate observed in the age group of 5-19
years old. The age specific pattern we observed has been reported by other researchers in different
contexts including DRC, (Auta 2012; Loha et al. 2013; Kateera et al. 2015; Ferrari et al. 2016).
Interestingly, in this study, the same pattern was observed even in households possessing sufficient
numbers of LLIN to cover all residents, suggesting a behavioural gap in LLIN use among older
children and adolescents. The lower LLIN use rate obviously put this age group at higher risk of
malaria prevalence as reported in other studies (Nankabirwa et al. 2014; Ferrari et al. 2016).
Findings from this study also showed that both before and after the campaign, at least 80% of those
with access to a LLIN used it the previous night.
122
Nevertheless, as access to LLIN has tremendously increased, it is important that the NMCP focus
on developing behaviour change communications strategy and plan to promote LLIN use in the
general population as well as in specific group such as older children and adolescents.
Contrary to what could be expected, results of this study showed that the fixed delivery strategy
reached a much higher proportion of households compared to the door-to-door strategy. However,
among those households reached, having enough LLIN did not vary by net allocation method. A
multi country comparison of LLIN delivery strategies based on 14 surveys from five African
countries did not find a significant association between delivery strategy and ownership of a net
from the campaign but found a positive association between sleeping space allocation and enough
LLIN in the household (Zegers de Beyl et al. 2016).
Only half of surveyed households in areas where the hang up approach was implemented reported
their LLIN was hung by a member of the distribution team. However, of those that were hung by a
member of the distribution team, a higher proportion were still hung and used the previous night
compared to those not hung by a member of the distribution team as also noted by other researchers
(MacIntyre et al. 2012; Bennett et al. 2012). However this did not necessarily result in higher LLIN
use rates among the population. A cluster randomised controlled trial conducted in Uganda showed
that additional hang up activities following a mass distribution campaign did not provide any
additional impact on net use (Kilian et al. 2015)
As could be expected after a free LLIN mass distribution campaign that targeted the entire
population at risk for malaria, equity in household LLIN coverage and individual use of LLIN has
been improved as demonstrated by the Lorenz curve meeting the equity line as well as the
concentration index shifting from positive to close to zero values. These findings corroborate results
from other mass distribution campaigns showing equitable LLIN ownership and use (Noor et al.
2007; Thwing et al. 2008; Ye et al. 2012; Renggli et al. 2013).
Despite higher coverage and reported use of LLIN six month after a free mass distribution of LLIN,
malaria rates remain high in the province. Although lower in LLIN users compared with non users,
the overall malaria prevalence among children aged 6-59 months found in this study was higher
than the national average of 31% prevalence reported by the DHS (DHS 2014). This high malaria
rate calls for further investigation of possible contributors. As an attempt to identify factors
explaining high malaria rates in northern Ghana, Monroe et al found that under-usage of LLINs at
times when they could confer maximum protection as well as a variety of outdoor night-time
activities, including outdoor sleeping were factors that could potentially contributed to high rates of
malaria in that setting (Monroe et al. 2015).

123
In this study, the prevalence of anaemia was high and consistent with findings of other researchers
(Ferrari et al. 2016), however additional factors common in this setting such as malnutrition (DHS
2014) and sickle cell anaemia (Tshilolo et al. 2009) play a role in the occurrence of this condition.
Access to diagnostic testing and malaria treatment is very low; efforts should be made to increase
availability of RDT and ACT in both public and private sectors.
For both fixed delivery distribution and door-to-door strategies, the average cost per LLIN
distributed was consistent with findings of other researchers (White et al. 2011). As expected, the
highest proportion of cost was attributable to the purchase cost of the LLIN. Compared to the fixed
strategy, the average cost per LLIN distributed was slightly higher in the door-to-door strategy with
the personnel cost being the second highest single cost position after LLIN. This is consistent with
the additional cost associated with hang up activities as reported by other researchers (Smith
Paintain et al. 2014; Kilian et al. 2015).
This study has limitations. Although interviewers were required to observe LLIN owned by
households, most net results reported in this study relies on data reported by respondents, thus they
are prone to recall and information bias. LLIN may be more subject to over-reporting due to social
desirability bias. As RDT were used for malaria diagnostic and parasite antigens (detected by the
test) often persist up to two weeks post-treatment, some children previously treated for malaria
might have tested positive within 14 days after treatment.

124
7.6 Conclusions
This study demonstrates substantial improvements in LLIN coverage, use and equity. Although all
RBM targets were not met, much progress has been made. In addition to antenatal and vaccination
clinic programmes, other LLIN distribution strategies should be explored as part of a keep-up
strategy in order to maintain high and equitable coverage over time. The very low ownership and
use levels observed before the campaign in this study despite a previous mass distribution campaign
in 2011 is a stark reminder of the need for a keep-up mechanism.
These results also suggest a revision of distribution guidelines especially with regard to LLIN
quantification to better cover larger households and those not reached by the mass distribution
campaign. Having sufficient numbers of LLIN to cover all residents in the household was the
strongest determinant of LLIN use. As access to LLIN is increasing, results of this study suggest
that behaviour change strategies should focus on interpersonal interventions to promote LLIN use in
the general population and specific groups such as older children and adolescents. In the context of
the present study setting, a fixed delivery strategy seems to be a better LLIN delivery option, as it
was shown to be associated with higher levels of LLIN coverage and use indicators as well as lower
delivery cost.
125
8 Malaria morbidity in the Democratic Republic of Congo from 2010
to 2014: What is really captured by the surveillance system?
Henry Maggi Ntuku1,2,3, Laura Ruckstuhl2,3, Hyacinthe I Kaseya4, Antoinette Kitoto Tshefu1,
Christian Lengeler2,3
1 Kinshasa School of Public Health, Kinshasa, Democratic Republic of Congo. 2Swiss Tropical and Public Health Institute, Basel, Switzerland. 3University of Basel, Basel, Switzerland. 4National Malaria Control Program, Democratic Republic of Congo
Working paper

126
8.1 Abstract
Background
Despite inherent challenges, health facility-based data remain the only consistent and readily
available source of information on malaria in many endemic areas. In the Democratic Republic
of Congo (DRC), the use of rapid diagnostic tests has been expanded since 2010, leading to a
marked increase in suspected malaria cases receiving a diagnostic test. Together with other
management measures, this should improve the quality of the incidence rates obtained through
the Health Monitoring Information System (HMIS). Based on household surveys data, the
Malaria Atlas Project (MAP) has produced estimates of clinical incidence of malaria for the
years 2000-2015 for all African countries. Here we assess how well the two data sources (routine
versus modelled) correlate.
Methods
Validated HMIS data from 2010 to 2014 were obtained through the National Malaria Control
Programme (NMCP). Data on incidence cases of clinical malaria by province were downloaded
from the MAP website. Trends in surveillance indicators were examined over a 5-year period.
The number of reported confirmed malaria cases was compared to the MAP predicted incidence
counts to determine the relative reporting of the HMIS system.
Results
While the incident cases predicted by the MAP model were progressively decreasing (from 27.7
million cases in 2010 to 20.1 million cases in 2014), the reported confirmed malaria cases
increased from 2.4 million in 2010 to 9.8 million in 2014. As a result, the percentage of
suspected malaria cases receiving a diagnostic test increased from 37.4% in 2010 to 90.1% in
2013. Over this time period the slide and RDT positivity rates have remained almost constant,
with an average of 62.7% and 68.9%, and the reporting completeness rate as well as the total
number of outpatients and the number of suspected cases have not shown marked changes either.
When compared to the MAP predicted incidence cases, the fraction of incidence cases reported
by the HMIS has been progressively increasing from 8.7% in 2010 to 48.7% in 2014.
Conclusions
Due to the expansion of parasitological diagnosis, the number of confirmed malaria cases
reported and hence the fraction of incident cases captured by the HMIS data is increasing over
time. Because of inconsistencies in reporting, it has been difficult to establish trends in malaria
morbidity from nationally aggregated data, but the unchanged test positivity rates suggest
malaria transmission remained high and stable over that time period.

127
8.2 Background
Information on the number and distribution of malaria cases and deaths is fundamental for the
design, implementation and evaluation of malaria control programmes (WHO 2011a). As in many
sub-Saharan African countries, the decision makers in the Democratic Republic of Congo (DRC)
rely on two main sources of data: (1) routinely collected health facility-based data available
through the Health Management Information System (HMIS); and (2) nationally representative
surveys such as the Demographic and Health Surveys (DHS), Multiple Indicators Cluster Surveys
(MICS), and Malaria Indicators Surveys (MIS) (PNLP 2013a). Nationally representative surveys
provide reliable estimates for key malaria indicators that are important for: (1) planning control
interventions, (2) for monitoring trends in population intervention coverage, and (3) for evaluating
impact on malaria burden. They provide as well valuable information for interpreting data from
other sources (Cibulskis et al. 2007). Recent collaborative work by the INFORM project assembled
data from households surveys to produce an epidemiological profile of malaria in the DRC (Figure
8-1 ) (PNLP et al. 2014). However, nationally representative surveys are designed to produce
precise estimates at national and at best at regional level. Using these data to provide sub-regional
level estimates of outcome will therefore lead to low precision in the estimates. Since unsampled
areas get an estimate on the basis of neighbouring sampled areas, the validity of such estimates also
becomes an issue. DRC is the size of Western Europe and has a highly decentralised health system
(Figure 8-2). The operational unit of the health system is the health zone (sub-provincial level).
Given the low total number of parasite prevalence surveys done in the country (1400 time-space
surveys since 1980), the validity and precision of the estimates at the level of the health zone is low.
This, along with the long interval between surveys (usually 3-4 years) and their high cost constitute
a clear limitation of such data sources for monitoring and planning purposes.
HMIS data have the advantage of being collected continuously from every health facility in the
country. When such a system is working well, it can represent continuously with a high time-space
resolution the evolution of malaria cases (Gething et al. 2007; Bennett et al. 2014). However, HMIS
data have usually a number of limitations. Firstly, varying degrees of data quality and completeness
are observed across the HMIS system and therefore trends in morbidity and mortality can vary over
time for reasons that have nothing to do with the epidemiology of disease. Secondly, the reported
cases in a HMIS are influenced by changes in health service utilization, in diagnostic technology, in
medical procedures, and changes of regulations within the HMIS itself.
128
Thirdly, the HMIS only captures those members of the population that seek care at a formal health
facility and represents therefore an incomplete sample of the morbidity and mortality experienced
by communities. As a result of these limitations, a HMIS can underestimate the total burden of
disease by a considerable fraction (Chilundo et al. 2004; Rowe et al. 2009). The World Health
organisation (WHO) estimates that routine health information systems detect only 14% of the
malaria cases estimated to occur globally. Further, case detection rates and the proportion of deaths
reported are lowest in countries with the highest malaria disease burden As a result of this weak
information system, it is not possible to reliably assess malaria trends using the data submitted to
the WHO in 32 highly endemic countries, including DRC (WHO 2013c; WHO 2014b) Despite
these inherent challenges, in many settings the HMIS data remain the only consistent and readily
available source of information on malaria.
Due to an increase in the use of rapid diagnostic tests, there has been a marked increase in the
proportion of suspected malaria cases receiving a malaria diagnostic test. Substantial improvements
have also been observed in treatment seeking rates for malaria (DHS 2007; DHS 2014; UNICEF
2010; WHO 2013c; WHO 2015b; Battle et al. 2016), often thanks to donor-supported programmes.
These trends have the potential to improve the case detection rate of HMIS data and hence the
fraction of the actual community malaria incidence that is captured.
Based on parasite rate household surveys, the Malaria Atlas Project (MAP) has produced modeled
estimates of clinical incidence of Plasmodium falciparum malaria for the years 2000-2015 for all
African countries (Bhatt et al. 2015). Although these estimates come with uncertainties and some
limitations, they constitute probably the best estimates of clinical malaria incident cases at present
for countries with incomplete reporting systems. Even they do not constitute a Gold Standard, these
modelled numbers provide at least a reference value to allow an estimation of how well the HMIS is
reporting incidence rates. This study assesses the malaria incidence rates obtained from the HMIS
data in the DRC from 2010 to 2014, and compares them to the modelled incidence rates from the
MAP project for the same time period.

129
Figure 8-1: Population-adjusted Plasmodium falciparum parasite rate in 2-10 years olds, by region (large figure) and by health zones for three regions (detailed map for Ituri, Nord Kivu and Sud Kivu), 2013.
Source: INFORM Project.
8.3 Methods
Study site
The DRC is one of the most malarious countries in the world. Together with Nigeria, DRC
accounts for about 40% of the total of estimated malaria cases worldwide, and for more than 35% of
the total estimated malaria deaths (WHO 2015b). In total, 97% of the estimated 72 million
inhabitants live in high malaria transmission areas. In 2014, the DHS reported an average malaria
prevalence of 31% in children less than 5 years (DHS 2014).
The health system in DRC has a pyramidal structure with three levels (Figure 8-2): central,
intermediate and peripheral level.
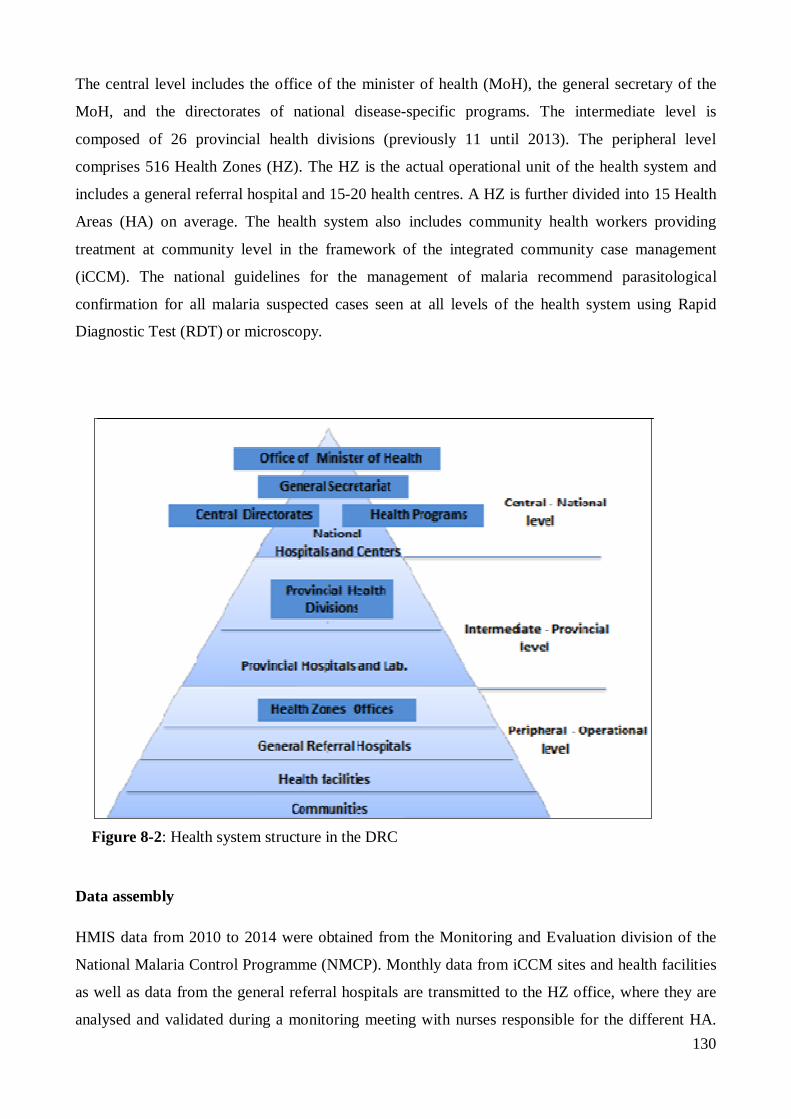
130
The central level includes the office of the minister of health (MoH), the general secretary of the
MoH, and the directorates of national disease-specific programs. The intermediate level is
composed of 26 provincial health divisions (previously 11 until 2013). The peripheral level
comprises 516 Health Zones (HZ). The HZ is the actual operational unit of the health system and
includes a general referral hospital and 15-20 health centres. A HZ is further divided into 15 Health
Areas (HA) on average. The health system also includes community health workers providing
treatment at community level in the framework of the integrated community case management
(iCCM). The national guidelines for the management of malaria recommend parasitological
confirmation for all malaria suspected cases seen at all levels of the health system using Rapid
Diagnostic Test (RDT) or microscopy.
Figure 8-2: Health system structure in the DRC
Data assembly
HMIS data from 2010 to 2014 were obtained from the Monitoring and Evaluation division of the
National Malaria Control Programme (NMCP). Monthly data from iCCM sites and health facilities
as well as data from the general referral hospitals are transmitted to the HZ office, where they are
analysed and validated during a monitoring meeting with nurses responsible for the different HA.
131
The data are then transmitted to the provincial level, which compile, analyse, validate, and transmit
the consolidated data to the central level, where they are further consolidated, verified, analysed and
validated. Aggregated data at country level are then used to produce the NMCP annual report and
these data are transmitted to the WHO. While the entire system is progressively being made
electronic by the scaling up of the District Health Information Software 2 (DHIS2), many HZ
continue to use paper forms for the collection of routine malaria data. The data are then entered at
provincial level.
Data on modelled incident cases of clinical malaria were downloaded from the MAP website
(http://www.map.ox.ac.uk). These data are available for use on an open access basis. For the DRC,
the modelled clinical incident cases of Plasmodium falciparum malaria are derived from a
cartographic method based on parasite rate surveys, including the DHS 2014. Firstly, parasite
prevalence data from 1995 to 2014 were assembled within a spatiotemporal Bayesian model, taking
into account environmental and sociodemographic covariates, as well as data on use of insecticide
treated nets (ITN) and access to treatment. The model predicted P. falciparum prevalence at a
resolution of 5x5km2. Secondly, an ensemble model was developed to predict malaria incidences as
a function of parasite prevalence, and then applied to obtain estimates of malaria incidence cases at
5x5km2. Data for each 5x5km2 grid were thenaggregated to obtain national and regional estimates
of malaria cases (Bhatt et al. 2015). Data on predicted malaria clinical incidence are available as
annual incidence counts (total number of malaria cases) and annual incidence rates (cases per 1000
people per annum), for both country and provincial levels.
Analysis
National HMIS case data were obtained in XLS format from the NMCP and converted into STATA
version 13 (Stata Corporation College Station, TX, USA) for analysis at both national and
provincial levels. Overall trends at national and provincial level were produced over a 5-year period
for the following key surveillance indicators: (1) number of confirmed malaria cases per 1000
population per year; (2) percentage of suspected malaria cases receiving a diagnostic test; (3)
malaria test positivity rate (RDT and slide positivity rate) and (4) completeness of reporting (i.e
number of monthly reports received out of the total expected). Incidence rates were calculated using
as denominator population data from the National Health Development Plan. Unfortunately, these
data are based on the 1984 census to which a yearly growth rate of 3% is applied (PNDS 2011-
2016), and the numbers are likely to be subject to some (unknown) error.

132
To assess variation by geographical area, the incidence of reported confirmed malaria cases and test
positivity rates were mapped at provincial level using quantum GIS version 2.0 (Quantum GIS
Development Team, Open Source Geospatial Foundation).
Finally, the number of reported confirmed malaria cases was compared to the predicted incidence
count to determine the representative fraction of HMIS data. Trends in this fraction were examined
over the same time period.
Given large numbers of reported cases and hence large numerators and denominators, confidence
intervals were very small; therefore they are not shown in the text.
8.4 Results
HMIS dataset were collected from the NMCP for the period 2010 to 2014. For each year, data were
available for all 11 provinces; 2014 data were also presented for the 26 new provinces. Available
data included, amongst other, the total population, the number of suspected cases, the number of
microscopy slides performed with the number of positive slides, the number of RDTs performed
with the number of positive RDTs, and the report completeness.
Completeness of reporting
Over the period considered, the completeness of reporting has been fluctuating with the highest
value (92%) reported in 2010 and the lowest value (83.9%) reported in 2014 (Table 8-1).
The provinces of Equateur, Kasai Occidental and Katanga have reported the lowest rates of
reporting completeness for the year 2014, with respectively 57%; 72% and 79%. Moreover, during
the past five years, the provinces of Equateur and Katanga have reported some of the lowest rates of
reporting completeness with 73% in 2013 and 2012 for the first and 67% in 2012 and 55% in 2011
for the second. The provinces of Bas Congo and Nord Kivu have reported consistently over 90%
during the five-year period.
133
Reported suspected cases
From 2010 to 2014, the total number of outpatients did not show any particular trend. The same
was found for the number of suspected malaria cases reported nationally, which ranged between
129 and 147 cases per 1000 population, with the highest value observed in 2013 and the lowest
observed in 2014 (Table 8-1). Higher numbers of suspected malaria cases per 1000 population were
reported in provinces with higher reporting completeness rate. The province of Bas Congo, with the
highest reporting completeness (average 97% over the period considered), reported the highest
number of suspected cases, showing a peak of 266 cases per 1000 population in 2013 (Figures 8-3).
Percentage of suspected malaria cases receiving a diagnostic test
Overall, the proportion of suspected malaria cases receiving a diagnostic test has been progressively
increasing. From 37.4% in 2010, this percentage increased to 69.4% in 2011; 76.9% in 2012; 90.1%
in 2013 and it was reported to be 147.6% in 2014 (Table 8-1). The observed increase in percentage
of suspected malaria cases tested was seen across all provinces. When split by the types of
diagnostic test used, the results showed that while the proportion of suspected cases tested by
microscopy has remained almost constant throughout the study period with a slight decline during
the past 3 years (36.8% in 2010; 41.0% in 2011; 43.5% in 2012; 36.4% in 2013 and 35.7% in
2014), the proportion of cases tested by RDT has progressively increased from 0.005% in 2010 to
53.7% in 2013 and 111.9% in 2014. A possible explanation of this proportion of more than 100%
might be a misclassification of patients resulting in fewer reported suspected cases compared to the
number of tests performed. At provincial level, the data showed the same patterns with constant or
decreasing percentage of cases tested by microscopy, and increasing percentages of cases tested by
RDT. The province of Equateur showed one of the lowest testing rates, increasing from 16.9% in
2010 to only 51.8% in 2013. For almost all provinces, the percentage of suspected cases tested by
RDT in 2014 was above 90%, except Maniema (83%) and Kasai Oriental (82%). The lowest
percentage of cases tested by microscopy was reported in Maniema Province (from 19% in 2010 to
10% in 2014), while the province of Bas Congo reported the highest percentage of cases tested by
microscopy: 80% in 2010 and 2011; 87% in 2012; 88% in 2013 and 67% in 2014.

134
Table 8-1: Summary of malaria surveillance indicators at national level form 2010 to 2014
NATIONAL 2010 2011 2012 2013 2014 Population 64,420,000 66,352,600 68,343,178 70,393,473 72,505,278 Reporting completeness (%) 94 86 87 88 84 OPD 24,631,423 26,189,657 24,225,892 27,167,148 27,370,003 Suspected cases 9,252,959 9,442,144 9,128,398 10,408,506 9,378,589 Suspected /1000 population 143.6 142.3 133.6 147.9 129.4 Tested/Suspected (%) 37.4 69.4 76.9 90.1 147.6 Slide positivity rate (%) 64.6 63.9 61.4 63.3 60.2 RDT positivity rate (%) 78.3 63.9 64.2 67.3 70.8 Confirmed cases 2,417,780 4,561,981 4,791,598 6,715,223 9,823,673 Incidence rate/1000 population 37.5 68.8 70.1 95.4 135.5 MAP predicted number of cases 27,732,836 25,687,991 22,446,366 21,083,796 20,170,486 Fraction captured (%)* 8.7 17.8 21.3 31.9 48.7
Malaria test positivity rate
Neither the slide positivity rate nor the RDT positivity rate has shown marked changes over time
during the period considered. The slide positivity rate has remained almost constant, with an
average of 62.7% (64.6% in 2010; 63.9% in 2011; 61.4% in 2012; 63.3% in 2013 and 60.2% in
2014). The RDT positivity rate has shown a slight increase of 7 points from 2011 to 2014. The
average RDT positivity rate was 68.9% (78.3% in 2010; 63.9% in 2011; 64.2% in 2012; 67.3% in
2013 and 70.8% in 2014) (Table 8-1).
The provinces of Nord Kivu and Sud Kivu in the eastern part of the country reported the lowest
slide positivity rates, with respectively an average of 50.0% (46.2% in 2010; 53.1% in 2011; 51.6%
in 2012; 51.7% in 2013 and 47.6% in 2014) and 42.6% (44.7% in 2010; 45.5% in 2011; 42.1% in
2012; 40.4% in 2013 and 40.2% in 2014). The highest slide positivity rates were reported in the
provinces of Bas Congo and Katanga with respectively an average of 69.2% (67.6% in 2010; 69.4%
in 2011; 69.1% in 2012; 68.7% in 2013 and 70.9% in 2014) and 68.6% (71.6% in 2010; 68.5% in
2011; 67.7% in 2012; 64.2% in 2013 and 71.1% in 2014) (Figure 8-5A).

135
The provinces of Nord Kivu and Sud Kivu also reported the lowest RDT positivity rates with
respectively an average of 45.0% (46.1% in 2011; 45.5% in 2012; 43.4% in 2013) and 38.6 %(
29.6% in 2011; 37.8% in 2012; 48.6% in 2013). The highest RDT positivity rates were reported in
the provinces of Katanga and Orientale, with respectively an average of 77.1% (86.6% in 2010;
75.5% in 2011; 75.8% in 2012; 78.3% in 2013 and 69.1 in 2014) and 75.6% (73.8% in 2010; 72.8%
in 2011; 70.9% in 2012; 73.2% in 2013 and 87.6% in 2014) (Figure 8-5B).
When compared at national and provincial levels, the RDT positivity rates were consistently higher
than the slide positivity rates over time, except for the provinces of Kinshasa and Nord Kivu (Figure
8-4). The greatest differences were observed in the provinces of Orientale, Equateur and Maniema.
In most provinces, the slide positivity rate curves seem flatter than the RDT positivity rates curves.
Reported confirmed malaria cases
Overall, the number of reported confirmed malaria cases has been increasing over time. The
reported malaria incidence rate has shown a 100 percent increase from 37.5 per 1000 population in
2010 to 135.5 per 1000 population in 2014. The biggest increases have been observed from 2010 to
2012, with a 30 percent increase, and from 2013 to 2014 with an increase of 40 percent (Table 8-1,
Figure 8-3). Obviously, much of this increase is linked to the much higher testing rates.
For the year 2014, the highest confirmed malaria incidence rates have been reported in the
provinces of Bas Congo with 319 cases per 1000 population and Kasai Oriental with 258 cases per
1000 population (Figure 8-3), whereas the lowest confirmed incidence rates have been reported in
the provinces of Katanga with 118 cases per 1000 population and Equateur with 124 cases per 1000
population (Figure 8-3).
Except for the province of Bandundu, where an apparent decrease in confirmed malaria incidence
was reported between 2011 and 2013 (82.7 per 1000 in 2011; 78.9 per 1000 in 2012 and 64.4 per
1000 in 2013) followed by an increase in 2014 (175.5 per 1000), in all provinces the data showed
the same patterns as the national level: reported confirmed malaria incidence progressively
increased over the period considered. The ascending curve was interrupted by a small drop in 2012
in four provinces (Bas Congo, Nord Kivu, Equateur and Kasai Oriental) and in 2013 in two
provinces (Kinshasa and Maniema).
136
Figure 8-3: Total all-cause outpatients incidence, total suspected and confirmed malaria case incidence, per 1000 population, by province and year, 2010-2014, DR Congo

137
Figure 8-4: RDT and slide positivity rates, by province and year, 2010-2014, DR Congo

138
Relative fraction of HMIS data
The number of reported confirmed malaria cases was compared to the predicted incidence counts
estimated by the MAP project, to determine the fraction of all malaria cases reported by the HMIS.
The MAP predicted numbers of malaria cases for the period 2010 to 2014 were 27.7 million cases
in 2010, 25.7 million cases in 2011, 22.4 million cases in 2012, 21.1 million case in 2013 and 20.1
million cases in 2014 (Table 8-1)
Over the period considered, trends in malaria incidence using the two different sources of data
showed opposite patterns. While the MAP predicted incidence of cases progressively declined from
27.7 million predicted cases in 2010 to 20.1 million predicted cases in 2014 (mainly as a result of
the predicted effect of key interventions such as LLIN), the reported confirmed HMIS number of
malaria cases increased over time (from 2.4 million cases in 2010 to 9.8 million cases in 2014(Table
8-1). Obviously, as more cases were tested, the number of confirmed cases increased. The same
pattern was observed across all provinces (data not shown).
When compared to the MAP predicted incident cases, the reported confirmed cases by the HMIS
data in 2014 represented 48.7%. This fraction has been progressively increasing since 2010: it was
only 8.7% in 2010, 17.8% in 2011, 21.3% in 2012, 31.9% in 2013 and 48.7% in 2014. The biggest
increase in the fraction reported by the HMIS was observed from 2013 to 2014, with a 17 points
increase (Table 8-1).
The same pattern of increasing representative fraction was observed in all provinces. The lowest
representative fractions were observed in the provinces of Province Orientale (1.8% in 2010; 5.6%
in 2011; 8.5% in 2012; 14.9% in 2012 and 29.2% in 2014) and Katanga (9.8% in 2010; 8.9% in
2011; 13.3% in 2012; 23.2% in 2013 and 38.3% in 2014). In the majority of provinces the number
of confirmed malaria cases reported has markedly increased in the last year (2014), with a
representative fraction of about 90% in two provinces; Kinshasa (93.3%) and Bandundu (90.4%). In
four provinces, there were more confirmed malaria cases reported in the HMIS than those predicted
by the MAP, leading a representative fraction over 100%; Bas Congo (126%), Nord Kivu (209.3%),
Kasai Oriental (100.6%) and Sud kivu (176.1%).

139
Figure 8-5 A and B: A: Average slide positivity rate, B: average RDT positivity rate. 2010-2014, DR Congo

140
8.5 Discussion
The two principal objectives of malaria surveillance systems are to provide programme managers
with accurate and timely spatio-temporal information on malaria incidence trends to (1) track the
epidemiological situation, and (2) guide interventions. Due to known biases and confounders in
HMIS data, different methodological approaches have been used to improve the use of routine
health system data for rigorous programme evaluations (Graves et al. 2008; Rowe et al. 2009;
Bennett et al. 2014) . Using a simple analysis of HMIS datasets, results of this study showed that
over the period considered, the number of confirmed malaria cases as well as the percentage of
suspected malaria cases receiving a diagnostic test, as well asthe representative fraction of HMIS
were increasing. At the same time the malaria test positivity rates remained almost constant at a
very high level (62% for microscopy and 68% for RDT).
The number of confirmed malaria cases reported by the surveillance system is obviously highly
sensitive to changes in a number of operational factors such as reporting rates, diagnostic practices
and health facility utilization rates. The period considered in this study coincided with changes in
diagnostic practices, especially the introduction of RDTs in 2010. This translated directly in an
increasing proportion of suspected cases receiving a diagnostic test, hence leading to increasing
numbers of reported confirmed malaria cases.
With the introduction of RDT, it could be expected that the proportion of suspected cases tested
with microscopy would be decreasing, but this proportion remained almost constant. This, along
with the fact that the proportion of suspected cases receiving a diagnostic test was over 100% in
some provinces, might suggest the use of both RDT and microscopy for malaria diagnostic in many
health facilities. Economic incentives work in favor of doing blood slides (paid for by patients) in
addition to RDTs (provided for free to health facilities and hence in principle also free to the
patient).
In contrast to trends in confirmed malaria cases, the malaria test positivity rate is less sensitive to
changes in reporting rates, diagnostic practices and health facility utilization rates, and may
therefore provide more reliable information on trends in malaria burden. In this study, both slide
and RDT positivity rates have remained stable at high values over the study period. The stable and
high test positivity rates despite scaling up of control measures are rather surprising. For example,
during the same period, the household ownership of at least 1 ITN increased from 51% in 2010 to
70% in 2013-2014 (UNICEF 2010; DHS 2014).

141
In other settings the malaria test positivity rate has been used to estimate changes in malaria
incidence (Jensen et al. 2009; Karema et al. 2012; Bi et al. 2012; Assele et al. 2015) following the
scaling up of malaria interventions. It has been shown in recent work to be a valuable surveillance
indicator especially in high transmission settings(Boyce et al. 2016). Although the test positivity
rates are not immune to distortions due to bias and/or confounding (Francis et al. 2012), the
consistency and stability observed here in both RDT and slide positivity rates are less likely to be
explained solely by the poor quality of data. If true, these estimates suggest that the DR Congo
remains one of the most endemic settings in the world.
While the routine surveillance system cannot be expected to detect all malaria cases in the
community, it should be expected to reflect at least the relative changes in incidence over time, and
between areas. Based on parasite prevalence data from nationally representative household surveys
(DHS 2014), the current malaria stratification used for planning interventions in the new malaria
strategic plan 2016-2020 (PNLP 2016) defines essentially two zones in the DRC: (1) the pre-
elimination zone in the province of North Kivu (prevalence <5%) and (2) highly endemic zones in
the rest of the country (prevalence 6-45%). However, the number of HMIS confirmed malaria cases
per 1000 population reported in 2014 does not reflect the malaria distribution in the country on the
basis of prevalence data. The highest malaria incidence rates were reported in the province of Bas
Congo in the western part of the country, and the lowest values in the provinces of Katanga and
Equateur - where some of the highest parasite prevalence rates were reported by the DHS. So this is
clearly pointing towards under-reporting of cases by routine statistics.
By contrast, the test positivity rates followed the malaria distribution in the country rather well.
Both RDT and slide positivity rates were consistent with the two zones defined by parasite
prevalence data, with the Eastern part (Nord Kivu and Sud Kivu) having the lowest rates (<=50%)
and the rest of the country having higher rates (>=50%).
The higher RDT positivity rates compared to microscopy positivity rates are consistent with reports
from other researchers in similar transmission setting (Francis et al. 2012). A further analysis of the
DRC DHS 2013-2014 suggested that RDTs, in particular HRP-2 based RDTs (the ones most used
in DRC) generate frequent false-positive results which are likely due to the persistence of HRP-2 in
the circulation after parasites had been cleared (DHS 2014).
142
With the progressive increase in the number of confirmed malaria cases reported by the HMIS data
and the progressive decrease in the number of malaria cases predicted by the MAP, the fraction of
incidence captured by the HMIS data is increasing. This is likely to be due primarily to the
improvement in diagnostic practices with the introduction of RDTs. But the fact that in some
provinces the total number of reported confirmed cases is higher than the total number of predicted
cases points towards a low quality in HMIS reporting, hence also contributing to the observed trend.
Furthermore, for a country of the size of DRC with a very low number of parasite prevalence
surveys available, it would be appropriate to hypothesize that the small sample size and the low
spatiotemporal density of prevalence surveys might have been contributing to uncertainty in outputs
and hence a low precision in MAP estimates.
This study took a rather simple analysis approach and did not include trends in other factors that
could influence trends in malaria cases seen at health facilities, such as health services utilisation
rates and rainfall.
143
8.6 Conclusions
This study showed that due to the expansion of parasitological diagnosis, the number of confirmed
malaria cases reported and hence the fraction of incident cases captured by the HMIS data has been
increasing over time. Because of inconsistencies in reporting, it has been difficult to establish trends
in malaria morbidity from nationally aggregated data. The test positivity rates suggest malaria
transmission remained high and stable over time, despite a substantial increase in coverage of
control interventions. Hence, health facility based data do not seem to reflect adequately the malaria
distribution in the country at present, and the HMIS has not yet reached its full potential in
monitoring disease trends. Improving the routine data system to provide robust, geographically
detailed and timely data remains crucial for supporting the current malaria control efforts.

144
9 General discussion and conclusions
The present thesis aims to provide further evidence on the epidemiology of malaria and key control
strategies in the DRC, in order to improve malaria control activities. This section synthetically
discusses the main research findings presented in different chapters of this thesis, with implications
for malaria control in Kinshasa, implementation of injectable artesunate, LLIN distribution and
malaria surveillance at national level. Finally, we make recommendations for future research.
In Chapters 3 and 4, we updated the malaria risk stratification in Kinshasa and identified factors
contributing to the estimated distribution patterns. Our findings showed that compared to previous
studies (Ngimbi et al. 1982; Mulumba et al. 1990; Kazadi et al. 2004), the overall malaria
prevalence has decreased and the risk was higher in the peri-urban areas of recent occupation. At
the same time, the penetration of control measures showed the opposite pattern: lower LLIN
coverage in the peri-urban areas and higher coverage in the centre of the city. This risk map
constitutes a strong basis for the planning of malaria control interventions in Greater Kinshasa, a
mega-city of more than 10 million people.
The analysis of drivers of P. falciparum infection in both children less than five years and
individuals older than five years highlighted the variation of the effect of age and reported history of
fever by the level of endemicity. In low endemicity strata (but not in high endemicity strata), a shift
in the peak of malaria prevalence towards older age groups was observed, while a history of fever in
the last two weeks increased the risk of malaria in all age groups regardless of level of endemicity.
Individual use of LLIN was associated with a reduced risk of malaria infection among children less
than five years. As expected, the risk of malaria was lower among children less than five years in
the wealthiest socio economic status group.
In Chapter 5, we assessed the feasibility of the use of injectable artesunate for the management of
severe malaria in hospitals and health centres of the DRC, in replacement of quinine. We also
assessed the cost of implementation in order to provide the basis for practical recommendations for
its rapid national deployment. We also assessed the perceived feasibility and acceptability of the
implementation of the new drug from the perspective of both health care providers and patients
(Chapter 6). Our findings showed that injectable artesunate can be successfully handled by health
care providers in DRC, and is associated with a reduced cost compared to quinine. There’s also a
high acceptability by both health care providers and patients. These findings support the rapid
switch to injectable artesunate in the country.
145
Following a LLIN mass distribution campaign in the province of Kasai Occidental using two
different approaches (a fixed delivery strategy and a door-to-door strategy including hang-up
activities), we evaluated the impact on household LLIN ownership and individual use, and
examined factors associated with LLIN use. We also compared the two delivery strategies with
regard to the LLIN coverage achieved and the cost of implementation (Chapter 7). Results showed
that the mass distribution campaign was effective at achieving high LLIN ownership and use.
Having sufficient numbers of LLIN to cover all residents in the household was the strongest
determinant of LLIN use. Compared with the door-to-door strategy, the fixed delivery strategy
achieved a higher LLIN coverage at a lower delivery cost. These findings provide importance
guidance for future LLIN distributions in DRC.
In Chapter 8, we examined changes in the fraction of malaria community incidence (as predicted by
the MAP model) captured by the reported routine health facility data from 2010 to 2014. Our
findings showed that while the number of malaria cases predicted by the MAP model was
progressively decreasing over time, the number of confirmed malaria cases reported by the routine
system was increasing.Thus, the fraction of the actual community malaria incidence captured by the
routine system was increasing. This was due mostly to the expansion of parasitological diagnosis
with RDTs. Over the same period, both RDT and slide positivity rates have remained constant at
high levels, suggesting high and stable malaria transmission in the country.
9.1 Implications for malaria control in Kinshasa
Results presented in Chapter 3 demonstrated the heterogeneity of malaria transmission in the city of
Kinshasa, as reported in other urban settings across Africa (Matthys et al. 2006; Keiser et al. 2004;
De Silva et al. 2012). Since malaria transmission in Kinshasa is focal, the implementation of control
strategies needs to reflect this and take into account the specific context of each area, and all factors
contributing to transmission. Because of differing levels of urbanisation and the uneven malaria
distribution and service offers, the new strategic plan 2016-2020 defines the city of Kinshasa as a
control stratum in its own right (PNLP 2016). In addition to the key interventions already
implemented, “new” interventions should include environmental management, IRS and larval
control. Although larviciding has proven to be cost-effective for urban malaria control (Maheu-
Giroux & Castro 2014), its implementation requires a thorough update on vector distribution and
behaviours. For memory, the last entomological studies in Kinshasa date back to the end of the
1980s (Coene 1993). Such entomological studies would also help understand factors that contribute
to residual transmission, defined as transmission that occurs despite high coverage with LLIN or

146
IRS (Killeen 2014; Msellemu et al. 2016). These factors include earlier biting behaviour of A.
gambiae or A. funestus (Cooke et al. 2015; Wamae et al. 2015) or human activity during peak biting
hours (Monroe et al. 2015).
The observed shift in the peak of malaria prevalence towards the older age groups in low
endemicity areas, combined with the low rate of LLIN use reported in that age group is of particular
concern. As discussed in Chapter 3, a small fraction of asymptomatic carriers can maintain
transmission during low transmission season (Trape et al. 2002; Smith et al. 2005; Clark et al.
2008). Further research is needed to understand the contribution of this age group to the overall
malaria transmission, and identify appropriate measures to better target this population.
The low intervention coverage observed in peri-urban areas of Kinshasa might have changed since
our survey. As of this writing, the NMCP with support from Population Services International (PSI)
has completed a universal mass distribution campaign in Kinshasa in early 2014, with a particular
focus on peripheral HZ. This campaign has reached high LLIN ownership (PSI, unpublished
report). But as shown in Chapters 3 and 7, net attrition rates are high and begin a few months after
distribution campaigns. Without effective keep-up mechanisms, the high coverage levels cannot be
maintained and will return in 1-2 years to the levels we measured.
Mapping the distribution of malaria risk should be a dynamic process of evidence generation,
constantly updated to guide and monitor progress towards strategic plan targets (Snow et al. 1996;
Kleinschmidt et al. 2001). The next step would be to update the risk map once additional data are
available. Including environmental covariates could improve the precision of the estimates.
9.2 Implications for the implementation of injectable artesunate
The DRC is one of the countries with the highest burden of severe cases of malaria. As a result, it is
also the country where the second highest number of additional lives could be saved by the
introduction of injectable artesunate. The results presented in Chapters 5 and 6 support the rapid
nationwide scale-up of the new drug. As usual, different operational and systemic challenges need
to be considered for achieving a successful rollout and a high public health impact of the new drug.
Ensuring availability of injectable artesunate is undoubtedly the key factor that will lead to the
expected impact in saving lives of children. To this effect, the Ministry of Health of the DRC has
received the support of the Global Fund to fight Aids, Tuberculosis and Malaria (GFATM) and of
147
other partners in the need quantification and procurement processes. As a result, it is currently
scaling up the use of injectable artesunate in the public sector, aiming for 100% coverage of in-
patient cases within a three-year period. Frequent stock-outs represent a major constraint in
managing malaria and other diseases in the DRC. In our study, we could not investigate issues of
drug stock-out since injectable artesunate vials were donated by Guillin Pharmaceuticals for study
purposes and were consistently available. By contrast, the End-Use Verification survey (EUV)
conducted by PMI in 2014 found 40% of health facilities with stockouts of antimalarials drugs and
commodities for three days or more in the past three months (USAID/SIAPS 2014). Strengthening
the supply chain will therefore be critical for a successful implementation.
The private sector plays an important role in delivering malaria treatments in DRC, accounting for
97% of all antimalarials distributed in Kinshasa in 2013 for example (ACT watch Group and ASF
2014). Findings presented in Chapter 3 showed that private facilities were the most common
providers of treatment among those who sought care, covering 65.4% of the cases. Increasing
access to injectable artesunate will therefore require a strong implication of the private sector.
Although findings from Chapter 6 indicate a high level of acceptability of the new drug by health
care providers in study sites, health care providers’ reluctance to change may hinder the nationwide
implementation of injectable artesunate. It is important to promote the benefits of the new drug
among health workers through effective communication channels and train them in the practical
aspects of its use. In our study, the large majority of health care providers perceived the handling of
injectable artesunate to be easy, and the new simplified three-dose intra-muscular regimen (once
daily) has the potential to make the handling even simpler and more appropriate for remote health
facilities (Kremsner et al. 2016).
Healthcare professionals should also be made aware of the possibility of delayed haemolytic
anaemia for up to one month post treatment (Zoller et al. 2011; Cramer et al. 2011; Rolling et al.
2014; Burri et al. 2014; Kremsner et al. 2016). A sub-study conducted within the MATIAS study to
assess the potential risk of delayed anaemia (Burri et al. 2014) and evidence from other researchers
(Rolling et al. 2014) showed that all reported cases of delayed anaemia have been successfully
managed, and the therapeutic benefits of injectable artesunate outweighed the risk of post-treatment
complications. The detection of such post-discharge complications in a setting of low access to
health care is challenging and points more generally to the absence of a functioning
pharmacovigilance system. The current proposition to assess haematological parameters and
serological markers of haemolysis on days 0, 3, 7, 14, 21, 28 post-treatment is clearly unrealistic
given the low access to health facilities and laboratory capacities.

148
Possibly, clear instructions to caregivers to return for consultation if some danger signs become
apparent (such as excessive pallor) could represent a more realistic approach to this issue.
Moreover, it is important to strengthen generally the pharmacovigilance system, to better detect
adverse events related to the use of artesunate. Hence, areas for further research could be the
identification of predictors of post-treatment haemolysis to prevent its occurrence, and danger signs
that could be identified by caretakers.
Finally, local quinine production represents an important challenge to speed up the introduction of
injectable malaria treatment nationwide. A local Congolese manufacturer produces quinine since
1942, and this represents the principal economic activity of the company. The switch from quinine
to injectable artesunate may have been seen as a threat to the viability of the company, and this
factor needs also to be taken into account.
9.3 Implications for LLIN distributions
Distribution of LLIN is a key component of malaria control in the DRC. Since the adoption of a
free-of-charge LLIN policy in 2006, over 75 million LLIN have been distributed across the country.
The campaign round organised in 2014 was the second after the first round started in 2011. The
results of the evaluation presented in chapter 7 highlighted a number of issues that need to be
addressed for future LLIN distributions.
The low ownership and use levels observed before the campaign in this study area despite a
previous mass distribution campaign in 2011 not only suggest an average physical lifespan of nets
of less than 3 years (Hakizimana et al. 2014; Wills et al. 2013; Gnanguenon et al. 2014; Mutuku et
al. 2013), but also revealed the limitations of the current routine distribution channels (ANC and
immunisation) to maintain high LLIN coverage between mass campaigns. These findings constitute
a stark reminder of the need for additional keep-up strategies (Networks 2014). The DRC has now
revised distribution guidelines to organise mass campaigns every two years, and has adopted school
and community channels for continuous distribution. The first pilot school distribution has been
completed in the province of Kasai Occidental. However, more work is needed to estimate the
appropriate timing of the continuous distribution in order to prevent oversupply or failure to reach
targeted coverage levels. There’s also a need to carry out LLIN quantification properly and most
regularly update the costing of continuous distribution channels.
In a given setting, the durability of LLIN is influenced by household behaviour and living
conditions (Kilian et al. 2015). By simply improving the way the nets are handled within
149
households, substantial gains can be made in median net lifespan (Helinski et al. 2015; Koenker et
al. 2015). Behaviour change communication (BCC) messages on net care should be integrated into
existing BCC programmes accompanying LLIN distributions. Our findings suggest that such BCC
activities should prioritise interpersonal channels. Interpersonal communication could also promote
proper LLIN use in targeted groups such as adolescents, who have currently the lowest use rates.
Universal coverage, as defined by the proportion of households with at least one LLIN for every
two people (WHO PMI UNICEF RBM Measure Evaluation 2013), remains the goal of LLIN
distribution programmes. It is determined by the number of households reached and the number of
LLIN delivered per household during the campaign. Completeness of household registration is the
strongest determinant of the proportion of households receiving at least one LLIN from a given
campaign (Zegers de Beyl et al. 2016). In addition, the net allocation strategy determines the
households’ likelihood of having enough LLINs for all residents. Results presented in Chapter 6
showed that among households that received at least one LLIN from the campaign, less than half
received enough LLIN for all its residents. Since having enough LLIN to cover all residents in the
household was the strongest determinant of LLIN use, net allocation strategies should be improved
in term of respecting strictly the criteria required for reaching universal coverage: 1 LLIN for 2
people, with rounding up in case of an odd number of household members. Finally there should be
no capping of the total number of nets per household.
As reported by other researchers (Smith Paintain et al. 2014; Kilian et al. 2015), the door-to-door
delivery strategy with hang-up activities in the Kasai Occidental was associated with higher cost per
LLIN delivered compared to the fixed point delivery strategy, and yet there was no difference in
LLIN use. The main reason for this difference could be that distribution teams are less likely to
reach the most remote inhabitants, while such populations are likely to come to a fixed distribution
point. Therefore, in the context of the DRC, a fixed point delivery strategy with effective BCC
activities and enough allocated nets should be sufficient to lead to high rates of LLIN ownership
and use.
9.4 Implications for malaria surveillance
Results presented in Chapter 8 suggest that the malaria surveillance system in DRC does not fully
play its role of identifying locations in which the incidence of malaria cases is the greatest, and for
tracking changes in these incidence rates. Although the study was not designed to analyse the
quality of health facility data, our findings have highlighted some of the issues that make it difficult,
at the current stage, to use routine data for the planning, implementation and evaluation of malaria
control programme.
150
The expansion of parasitological diagnosis with RDTs represents a golden opportunity for malaria
surveillance to be based on better quality data (confirmed rather than suspected cases) at all levels
of the health system. The increasing number of reported confirmed cases between 2010 and 2014
most likely reflects changes in diagnostic coverage rather than a real change in the incidence of
malaria cases. Shortcomings in data recording and reporting still results in low quality of reported
data, even though progress has clearly been made.
The lack of correspondence between the number of suspected cases and the number of confirmed
cases points towards problems in the registration of cases. In most of the health facilities,
information on patients are recorded in an outpatient register while results of malaria tests are
recorded in a separate laboratory register. The reconciliation of the two data sources is problematic,
and therefore misclassification of patients and double testing (using both RDT and blood slide) will
lead to inconsistencies, as discussed in Chapter 8. Training and regular supervision visits need to be
reinforced to improve data recording. A simple fool-proof system for reconciling patients’ statistics
between the clinical ledgers and the laboratory books should be designed and implemented. The
implementation of the DHIS2 system has the potential to improve substantially data recording,
since automatic consistency checks can be integrated into the software, and the timeliness of
reporting should improve. Efforts to improve the completeness of reporting should also consider
integrating private health facilities into the surveillance system.
While improving routine data systems to provide robust, geographically detailed and timely data
remains one of the basic tools for supporting improved malaria control efforts, small-scale sentinel
surveillance with enhanced supervision and rapid reporting mechanisms can be a viable alternative
to, and an important complement of HMIS data (Cibulskis et al. 2007; Yukich et al. 2014). With the
support from its partner, the NMCP is currently revitalising the network of existing sentinel sites to
provide high quality and timely malaria surveillance data beyond the scope of the routine
surveillance system.
9.5 Overall conclusions and outlook
This thesis has provided a wealth of new quality evidence on the epidemiology of malaria and the
implementation of key control interventions in the DRC. Currently the second malaria-endemic
country in the world, the DRC urgently needs to increase both its routine data surveillance system
and increase its applied (operational) research portfolio. This will lead to improved programme
management and to a sustained flow of resources for control activities through two key
151
mechanisms: (1) efficient implementation of the best possible interventions in an optimized
combination, and (2) justifying politically the high cost of malaria control activities thanks to
documenting continuously and with a high quality level the substantial positive health impact that
malaria control interventions deliver. We plead therefore for more applied research activities in the
country to reduce lastingly the unacceptable high burden of malaria in Congolese citizens.
152
10 References
ACT watch Group and ASF. 2014. “ACTwatch Study Reference Document:The DRC Outlet Survey 2013.”
Washington D.C.
Afrane, Yaw Asare, Eveline Klinkenberg, Pay Drechsel, Kofi Owusu-Daaku, Rolf Garms, and Thomas
Kruppa. 2004. “Does Irrigated Urban Agriculture Influence the Transmission of Malaria in the City of
Kumasi, Ghana?” Acta Tropica 89 (2): 125–34.
AlKadi, Hussien O. 2007. “Antimalarial Drug Toxicity: A Review.” Chemotherapy 53 (6): 385–91.
Allan, Richard, Laura O’Reilly, Valery Gilbos, and Albert Kilian. 2012. “An Observational Study of
Material Durability of Three World Health Organization-Recommended Long-Lasting Insecticidal Nets
in Eastern Chad.” American Journal of Tropical Medicine and Hygiene 87 (3): 407–11.
Alves, Fabiana P, Rui R Durlacher, Maria J Menezes, Henrique Krieger, Luiz H Pereira Silva, and Erney P
Camargo. 2002. “High Prevalence of Asymptomatic Plasmodium Vivax and Plasmodium Falciparum
Infections in Native Amazonian Populations.” The American Journal of Tropical Medicine and
Hygiene 66 (6): 641–48.
Assele, Vanessa, Gildas Ella Ndoh, Dieudonné Nkoghe, and Thierry Fandeur. 2015. “No Evidence of
Decline in Malaria Burden from 2006 to 2013 in a Rural Province of Gabon: Implications for Public
Health Policy.” BMC Public Health 15 (1): 81.
Atieli, Harrysone E, Guofa Zhou, Yaw Afrane, Ming-Chieh Lee, Isaac Mwanzo, Andrew K Githeko, and
Guiyun Yan. 2011. “Insecticide-Treated Net (ITN) Ownership, Usage, and Malaria Transmission in the
Highlands of Western Kenya.” Parasites & Vectors 4 (1): 113.
Auta, Asa. 2012. “Demographic Factors Associated with Insecticide Treated Net Use among Nigerian
Women and Children.” North American Journal of Medical Sciences 4 (1): 40–44.
Ayele, Dawit G, Temesgen T Zewotir, and Henry G Mwambi. 2012. “Prevalence and Risk Factors of
Malaria in Ethiopia.” Malaria Journal 11: 195.
Balarajan, Yarlini, Usha Ramakrishnan, Emre Ozaltin, Anuraj H Shankar, and S V Subramanian. 2011.
“Anaemia in Low-Income and Middle-Income Countries.” Lancet (London, England) 378 (9809):
2123–35.
Basilua Kanza, Jean Pierre, Elmostafa El Fahime, Sanaa Alaoui, El Mokhtar Essassi, Basil Brooke, André
Nkebolo Malafu, and Francis Watsenga Tezzo. 2013. “Pyrethroid, DDT and Malathion Resistance in
153
the Malaria Vector Anopheles Gambiae from the Democratic Republic of Congo.” Transactions of the
Royal Society of Tropical Medicine and Hygiene 107 (1): 8–14. Battle, Katherine E, Donal Bisanzio,
Harry S Gibson, Samir Bhatt, Ewan Cameron, Daniel J Weiss, Bonnie Mappin, et al. 2016. “Treatment-
Seeking Rates in Malaria Endemic Countries.” Malar J 15 (1): 20.
Bennett, Adam, Samuel Juana Smith, Sahr Yambasu, Amara Jambai, Wondimagegnehu Alemu, Augustin
Kabano, and Thomas P. Eisele. 2012. “Household Possession and Use of Insecticide-Treated Mosquito
Nets in Sierra Leone 6 Months after a National Mass-Distribution Campaign.” PLoS ONE 7 (5).
Bennett, Adam, Joshua Yukich, John M Miller, Penelope Vounatsou, Busiku Hamainza, Mercy M Ingwe,
Hawela B Moonga, et al. 2014. “A Methodological Framework for the Improved Use of Routine Health
System Data to Evaluate National Malaria Control Programs: Evidence from Zambia.” Population
Health Metrics 12 (1): 30.
Bhatt, S, D J Weiss, E Cameron, D Bisanzio, B Mappin, U Dalrymple, K E Battle, et al. 2015. “The Effect of
Malaria Control on Plasmodium Falciparum in Africa between 2000 and 2015.” Nature 526 (7572):
207–11.
Bi, Yan, Wenbiao Hu, Huaxin Liu, Yujiang Xiao, Yuming Guo, Shimei Chen, Laifa Zhao, and Shilu Tong.
2012. “Can Slide Positivity Rates Predict Malaria Transmission?” Malaria Journal 11 (1): 117.
Binka, F N, F Indome, and T Smith. 1998. “Impact of Spatial Distribution of Permethrin-Impregnated Bed
Nets on Child Mortality in Rural Northern Ghana.” The American Journal of Tropical Medicine and
Hygiene 59 (1): 80–85.
Binka, F N, A Kubaje, M Adjuik, L A Williams, C Lengeler, G H Maude, G E Armah, B Kajihara, J H
Adiamah, and P G Smith. 1996. “Impact of Permethrin Impregnated Bednets on Child Mortality in
Kassena-Nankana District, Ghana: A Randomized Controlled Trial.” Trop Med Int Health 1 (2): 147–
54.
Bobanga, Thierry, Wycliff Ayieko, Mimie Zanga, Solange Umesumbu, Ange Landela, Olivier Fataki, Alain
Serge Mandoko, Jacques Tshibamba, and Lambert Nyabola. 2013. “Field Efficacy and Acceptability of
PermaNet® 3.0 and OlysetNet® in Kinshasa, Democratic Republic of the Congo.” Journal of Vector
Borne Disease 50 (September): 206–14.
Bonner, Kimberly, Alex Mwita, Peter D Mcelroy, Susan Omari, Ally Mzava, Christian Lengeler, Naomi
Kaspar, et al. 2011. “Design , Implementation and Evaluation of a National Campaign to Distribute
Nine Million Free LLINs to Children under Five Years of Age in Tanzania.” Malaria Journal 10 (1):
73.
Bowen, Hannah L. 2013. “Impact of a Mass Media Campaign on Bed Net Use in Cameroon.” Malaria
Journal 12 (1): 36.

154
Boyce, Ross M, Raquel Reyes, Michael Matte, Moses Ntaro, Edgar Mulogo, Feng-Chang Lin, and Mark J
Siedner. 2016. “Practical Implications of the Non-Linear Relationship between the Test Positivity Rate
and Malaria Incidence.” PloS One 11 (3): e0152410.
Bruce-Chwatt, L J. 1985. Essential Malariology 2. British Medical Journal. New York: Johh Wiley and
sons.
Burri, C., G. Ferrari, H. M. Ntuku, a. T. Kitoto, S. Duparc, P. Hugo, D. K. Mitembo, and C. Lengeler. 2014.
“Delayed Anemia After Treatment with Injectable Artesunate in the Democratic Republic of the
Congo: A Manageable Issue.” American Journal of Tropical Medicine and Hygiene 91 (4): 821–23.
Caldas de Castro, Marcia, Yoichi Yamagata, Deo Mtasiwa, Marcel Tanner, Jurg Utzinger, Jennifer Keiser,
and Burton H Singer. 2004. “Integrated Urban Malaria Control: A Case Study in Dar Es Salaam,
Tanzania.” The American Journal of Tropical Medicine and Hygiene 71 (2 Suppl): 103–17.
CDC. 2013. “Published Reports of Delayed Hemolytic Anemia after Treatment with Artesunate for Severe
Malaria--Worldwide, 2010-2012. MMWR Morb Mortal Wkly Rep 62: 5-8.”
Centers for Disease Control and Prevention (CDC). 2013. “Published Reports of Delayed Hemolytic Anemia
after Treatment with Artesunate for Severe Malaria--Worldwide, 2010-2012.” MMWR. Morbidity and
Mortality Weekly Report 62 (1): 5–8.
Chilundo, Baltazar, Johanne Sundby, and Margunn Aanestad. 2004. “Analysing the Quality of Routine
Malaria Data in Mozambique.” Malaria Journal 3 (1): 3.
Cibulskis, Richard E., David Bell, Eva Maria Christophel, Jeffrey Hii, Charles Delacollette, Nathan
Bakyaita, and Maru W. Aregawi. 2007. “Estimating Trends in the Burden of Malaria at Country
Level.” American Journal of Tropical Medicine and Hygiene 77 (SUPPL. 6): 133–37.
Clark, Tamara D., Bryan Greenhouse, Denise Njama‐Meya, Bridget Nzarubara, Catherine Maiteki‐Sebuguzi,
Sarah G. Staedke, Edmund Seto, Moses R. Kamya, Philip J. Rosenthal, and Grant Dorsey. 2008.
“Factors Determining the Heterogeneity of Malaria Incidence in Children in Kampala, Uganda.” The
Journal of Infectious Diseases 198 (3). Oxford University Press: 393–400.
Coene, J. 1993. “Malaria in Urban and Rural Kinshasa: The Entomological Input.” Medical and Veterinary
Entomology 7 (2): 127–37.
Coetzee, M, P Van Wyk, M Booman, L L Koekemoer, and R H Hunt. 2006. “Insecticide Resistance in
Malaria Vector Mosquitoes in a Gold Mining Town in Ghana.” Entomologie Médicale 99 (5): 400–403.
Cooke, Mary K, Sam C Kahindi, Robin M Oriango, Chrispin Owaga, Elizabeth Ayoma, Danspaid Mabuka,
Dennis Nyangau, et al. 2015. “‘A Bite before Bed’: Exposure to Malaria Vectors Outside the Times of
Net Use in the Highlands of Western Kenya.” Malaria Journal 14: 259. .
155
Cox Singh, Janet, Timothy M E Davis, Kim Sung Lee, Sunita S G Shamsul, Asmad Matusop, Shanmuga
Ratnam, Hasan A Rahman, David J Conway, and Balbir Singh. 2008. “Plasmodium Knowlesi Malaria
in Humans Is Widely Distributed and Potentially Life Threatening.” Clinical Infectious Diseases 46
(2): 165–71.
Cramer, Jakob P, Rogelio López-Vélez, Gerd D Burchard, Martin P Grobusch, and Peter J de Vries. 2011.
“Treatment of Imported Severe Malaria with Artesunate instead of Quinine--More Evidence Needed?”
Malaria Journal 10: 256.
Culleton, Richard, Mathieu Ndounga, Fadile Yildiz Zeyrek, Cevayir Coban, Prisca Nadine Casimiro, Satoru
Takeo, Takafumi Tsuboi, Anjali Yadava, Richard Carter, and Kazuyuki Tanabe. 2009. “Evidence for
the Transmission of Plasmodium Vivax in the Republic of the Congo, West Central Africa.” The
Journal of Infectious Diseases 200 (9). : 1465–69.
D’Alessandro, U., B. Olaleye, P. Langerock, M. K. Aikins, M. C. Thomson, M. K. Cham, B. M. Greenwood,
et al. 1995. “Mortality and Morbidity from Malaria in Gambian Children after Introduction of an
Impregnated Bednet Programme.” The Lancet 345 (8948): 479–83.
D’Ascenzo, Fabiana. 2010. “La Territorialità Urbana a Kinshasa. Università Degli Studi Di Padova.”
De Beaudrap, Pierre, Carolyn Nabasumba, Francesco Grandesso, Eleanor Turyakira, Birgit Schramm, Yap
Boum, and Jean-François Etard. 2011. “Heterogeneous Decrease in Malaria Prevalence in Children
over a Six-Year Period in South-Western Uganda.” Malaria Journal 10: 132.
de Maximy, Rick, Mick Pain, and Jon Flouriot. 1975. “Atlas de Kinshasa, Kinshasa, Institut Géographique
Du Zarïe (IGZ), Bureau d’Études d’Aménagement Du Territoire.”
De Silva, Prathiba M., John M. Marshall, Prathiba M. De Silva, and John M. Marshall. 2012. “Factors
Contributing to Urban Malaria Transmission in Sub-Saharan Africa: A Systematic Review.” Journal of
Tropical Medicine 2012: 1–10.
“Democratic Republic of the Congo Demographic and Health Survey (DRC-DHS II).” 2013.
Dhorda, Mehul, Dan Nyehangane, Laurent Rénia, Patrice Piola, Philippe J Guerin, and Georges Snounou.
2011. “Transmission of Plasmodium Vivax in South-Western Uganda: Report of Three Cases in
Pregnant Women.” PloS One 6 (5): e19801.
DHS. 2007. “Democratic Republic of the Congo; Demographic and Health Survey 2007.”
DHS. 2014. “Democratic Republic of Congo Demographic and Health Survey 2014.”
Dondorp, Arjen M, Caterina I Fanello, Ilse C E Hendriksen, Ermelinda Gomes, Amir Seni, Kajal D
Chhaganlal, Kalifa Bojang, et al. 2010a. “Artesunate versus Quinine in the Treatment of Severe
Falciparum Malaria in African Children (AQUAMAT): An Open-Label, Randomised Trial.” Lancet
156
376 (9753): 1647–57.
Dondorp, Arjen, François Nosten, Kasia Stepniewska, Nick Day, and Nick White. 2005. “Artesunate versus
Quinine for Treatment of Severe Falciparum Malaria: A Randomised Trial.” Lancet 366 (9487): 717–
25.
Ferrari, Giovanfrancesco, Henry M T Ntuku, Amanda Ross, Sandro Schmidlin, Didier M Kalemwa,
Antoinette K Tshefu, and Christian Lengeler. 2016. “Identifying Risk Factors for Plasmodium Infection
and Anaemia in Kinshasa, Democratic Republic of Congo.” Malaria Journal 15: 362.
Ferrari, Giovanfrancesco, Henry M. Ntuku, Christian Burri, Antoinette K. Tshefu, Stephan Duparc, Pierre
Hugo, Didier K. Mitembo, et al. 2015. “An Operational Comparative Study of Quinine and Artesunate
for the Treatment of Severe Malaria in Hospitals and Health Centres in the Democratic Republic of
Congo: The MATIAS Study.” Malaria Journal 14 (1): 226.
Ferrari, Giovanfrancesco, Henry M. Ntuku, Sandro Schmidlin, Eric Diboulo, Antoinette K. Tshefu, and
Christian Lengeler. 2016. “A Malaria Risk Map of Kinshasa, Democratic Republic of Congo.” Malaria
Journal 15 (1): 27.
Francis, Damon, Anne Gasasira, Ruth Kigozi, Simon Kigozi, Sussann Nasr, Moses R Kamya, and Grant
Dorsey. 2012. “Health Facility-Based Malaria Surveillance : The Effects of Age , Area of Residence
and Diagnostics on Test Positivity Rates.” Malaria Journal 11 (1): 1.
Gahutu, Jean-Bosco, Christian Steininger, Cyprien Shyirambere, Irene Zeile, Neniling Cwinya-Ay, Ina
Danquah, Christoph H Larsen, et al. 2011. “Prevalence and Risk Factors of Malaria among Children in
Southern Highland Rwanda.” Malaria Journal 10: 134
Gautret, P, F Legros, P Koulmann, M.H Rodier, and J.-L Jacquemin. 2001. “Imported Plasmodium Vivax
Malaria in France: Geographical Origin and Report of an Atypical Case Acquired in Central or Western
Africa.” Acta Tropica. Vol. 78.
Gething, Peter W, Abdisalan M Noor, Catherine A Goodman, Priscilla W Gikandi, Simon I Hay, Shahnaaz
K Sharif, Peter M Atkinson, and Robert W Snow. 2007. “Information for Decision Making from
Imperfect National Data: Tracking Major Changes in Health Care Use in Kenya Using Geostatistics.”
BMC Medicine 5 (1): 37.
Gnanguenon, Virgile, Roseric Azondekon, Frederic Oke-Agbo, Raymond Beach, and Martin Akogbeto.
2014. “Durability Assessment Results Suggest a Serviceable Life of Two, rather than Three, Years for
the Current Long-Lasting Insecticidal (Mosquito) Net (LLIN) Intervention in Benin.” BMC Infectious
Diseases 14: 69.
Grabowsky, Mark, Theresa Nobiya, and Joel Selanikio. 2007. “Sustained High Coverage of Insecticide-
Treated Bednets through Combined Catch-up and Keep-up Strategies.” Tropical Medicine &

157
International Health 12 (7): 815–22.
Graves, Patricia M., Daniel E. Osgood, Madeleine C. Thomson, Kiros Sereke, Afwerki Araia, Mehari
Zerom, Pietro Ceccato, et al. 2008. “Effectiveness of Malaria Control during Changing Climate
Conditions in Eritrea, 1998-2003.” Tropical Medicine & International Health 13 (2): 218–28.
Greenberg, A E, M Ntumbanzondo, N Ntula, L Mawa, J Howell, and F Davachi. 1989. “Hospital-Based
Surveillance of Malaria-Related Paediatric Morbidity and Mortality in Kinshasa, Zaire.” Bulletin of the
World Health Organization 67 (2): 189–96.
Guerra, Carlos A, Rosalind E Howes, Anand P Patil, Peter W Gething, Thomas P Van Boeckel, William H
Temperley, Caroline W Kabaria, et al. 2010. “The International Limits and Population at Risk of
Plasmodium Vivax Transmission in 2009.” PLoS Neglected Tropical Diseases 4 (8): e774.
Hakizimana, Emmanuel, Beatus Cyubahiro, Alphonse Rukundo, Allan Kabayiza, Alphonse Mutabazi,
Raymond Beach, Roopal Patel, Jon E Tongren, and Corine Karema. 2014. “Monitoring Long-Lasting
Insecticidal Net (LLIN) Durability to Validate Net Serviceable Life Assumptions, in Rwanda.” Malaria
Journal 13: 344.
Hall, A, M C Latham, D W Crompton, L S Stephenson, and J C Wolgemuth. 1982. “Intestinal Parasitic
Infections of Men in Four Regions of Rural Kenya.” Transactions of the Royal Society of Tropical
Medicine and Hygiene 76 (6): 728–33.
Harris, Ivor, Wesley W Sharrock, Lisa M Bain, Karen-Ann Gray, Albino Bobogare, Leonard Boaz, Ken
Lilley, et al. 2010. “A Large Proportion of Asymptomatic Plasmodium Infections with Low and Sub-
Microscopic Parasite Densities in the Low Transmission Setting of Temotu Province, Solomon Islands:
Challenges for Malaria Diagnostics in an Elimination Setting.” Malaria Journal 9: 254.
Hawley, William A., Penelope A. Phillips-Howard, Feiko O. Ter Kuile, Dianne J. Terlouw, John M. Vulule,
Maurice Ombok, Bernard L. Nahlen, et al. 2003. “Community-Wide Effects of Permethrin-Treated Bed
Nets on Child Mortality and Malaria Morbidity in Western Kenya.” American Journal of Tropical
Medicine and Hygiene 68 (4 SUPPL.): 121–27.
Hay, S I, D J Rogers, J F Toomer, and R W Snow. 2000. “Annual Plasmodium Falciparum Entomological
Inoculation Rates (EIR) across Africa: Literature Survey, Internet Access and Review.” Transactions of
the Royal Society of Tropical Medicine and Hygiene 94 (2): 113–27.
Hay, Simon I, Carlos A Guerra, Andrew J Tatem, Peter M Atkinson, and Robert W Snow. 2005.
“Urbanization, Malaria Transmission and Disease Burden in Africa.” Nature Reviews. Microbiology 3
(1): 81–90.
Hay, Simon I., Marianne E. Sinka, Robi M. Okara, Caroline W. Kabaria, Philip M. Mbithi, Carolynn C.
Tago, David Benz, et al. 2010. “Developing Global Maps of the Dominant Anopheles Vectors of

158
Human Malaria.” PLoS Medicine 7 (2): 1–6.
Helinski, Michelle H, Geoffrey Namara, Hannah Koenker, Albert Kilian, Gabrielle Hunter, Angela Acosta,
Leah Scandurra, et al. 2015. “Impact of a Behaviour Change Communication Programme on Net
Durability in Eastern Uganda.” Malaria Journal 14: 366.
Hemingway, Janet, Hilary Ranson, Alan Magill, Jan Kolaczinski, Christen Fornadel, John Gimnig, Maureen
Coetzee, et al. 2016. “Averting a Malaria Disaster: Will Insecticide Resistance Derail Malaria
Control?” The Lancet 387 (10029): 1785–88.
Jensen, Trevor P, Hasifa Bukirwa, Denise Njama-Meya, Damon Francis, Moses R Kamya, Philip J
Rosenthal, and Grant Dorsey. 2009. “Use of the Slide Positivity Rate to Estimate Changes in Malaria
Incidence in a Cohort of Ugandan Children.” Malaria Journal 8: 213.
Karch, S, N Asidi, Z M Manzambi, and J J Salaun. 1992. “[The Anopheles Fauna and the Transmission of
Human Malaria in Kinshasa (Zaire)].” Bulletin de La Société de Pathologie Exotique (1990) 85 (4):
304–9.
Karch, S, and J Mouchet. 1992. “[Anopheles Paludis: Important Vector of Malaria in Zaire].” Bulletin de La
Société de Pathologie Exotique (1990) 85 (5): 388–89.
Karema, Corine, Maru W Aregawi, Alphonse Rukundo, Alain Kabayiza, Monique Mulindahabi, Ibrahima S
Fall, Khoti Gausi, et al. 2012. “Trends in Malaria Cases, Hospital Admissions and Deaths Following
Scale-up of Anti-Malarial Interventions, 2000-2010, Rwanda.” Malaria Journal 11 (1): 236.
Kateera, Fredrick, Chantal M Ingabire, Emmanuel Hakizimana, Alexis Rulisa, Parfait Karinda, Martin P
Grobusch, Leon Mutesa, Michèle van Vugt, and Petra F Mens. 2015. “Long-Lasting Insecticidal Net
Source, Ownership and Use in the Context of Universal Coverage: A Household Survey in Eastern
Rwanda.” Malar J 14 (1): 390.
Kazadi, Walter, John D. Sexton, Makengo Bigonsa, Bompela W’Okanga, and Matezo Way. 2004. “Malaria
in Primary School Children and Infants in Kinshasa, Democratic Republic of the Congo: Surveys from
the 1980s and 2000.” American Journal of Tropical Medicine and Hygiene 71 (2 SUPPL.): 97–102.
Keiser, Jennifer, Jurg Utzinger, Marcia Caldas de Castro, Thomas A Smith, Marcel Tanner, and Burton H
Singer. 2004. “Urbanization in Sub-Saharan Africa and Implication for Malaria Control.” The
American Journal of Tropical Medicine and Hygiene 71 (2 Suppl): 118–27.
Kilian, Albert, Connie Balayo, Mitra Feldman, Hannah Koenker, Kojo Lokko, Ruth A. Ashton, Jane Bruce,
Matthew Lynch, and Marc Boulay. 2015. “The Effect of Single or Repeated Home Visits on the
Hanging and Use of Insecticide-Treated Mosquito Nets Following a Mass Distribution Campaign - A
Cluster Randomized, Controlled Trial.” PLoS ONE 10 (3): 1–21.
159
Kilian, Albert, Wilson Byamukama, Olivier Pigeon, Francis Atieli, Stephan Duchon, and Chi Phan. 2008.
“Long-Term Field Performance of a Polyester-Based Long-Lasting Insecticidal Mosquito Net in Rural
Uganda.” Malaria Journal 7: 49.
Kilian, Albert, Wilson Byamukama, Olivier Pigeon, John Gimnig, Francis Atieli, Lizette Koekemoer, and
Natacha Protopopoff. 2011. “Evidence for a Useful Life of More than Three Years for a Polyester-
Based Long-Lasting Insecticidal Mosquito Net in Western Uganda.” Malaria Journal 10 (1): 299.
Kilian, Albert, Hannah Koenker, Emmanuel Obi, Richmond A Selby, Megan Fotheringham, and Matthew
Lynch. 2015. “Field Durability of the Same Type of Long-Lasting Insecticidal Net Varies between
Regions in Nigeria due to Differences in Household Behaviour and Living Conditions.” Malaria
Journal 14: 123.
Kilian, Albert, Hannah Koenker, and Lucy Paintain. 2013. “Estimating Population Access to Insecticide-
Treated Nets from Administrative Data: Correction Factor Is Needed.” Malaria Journal 12 (1): 259.
Killeen, Gerry F. 2014. “Characterizing, Controlling and Eliminating Residual Malaria Transmission.”
Malaria Journal 13: 330.
Killeen, Gerry F., Tom A. Smith, Heather M. Ferguson, Hassan Mshinda, Salim Abdulla, Christian Lengeler,
and Steven P. Kachur. 2007. “Preventing Childhood Malaria in Africa by Protecting Adults from
Mosquitoes with Insecticide-Treated Nets.” PLoS Medicine 4 (7): 1246–58.
Kleinschmidt, Immo, Judy Omumbo, Olivier Briet, Nick van de Giesen, Nafomon Sogoba, Nathan
Kumasenu Mensah, Pieter Windmeijer, Mahaman Moussa, and Thomas Teuscher. 2001. “An Empirical
Malaria Distribution Map for West Africa.” Tropical Medicine and International Health 6 (10): 779–
86.
Klinkenberg, Eveline, Pj McCall, Michael D Wilson, Felix P Amerasinghe, and Martin J Donnelly. 2008.
“Impact of Urban Agriculture on Malaria Vectors in Accra, Ghana.” Malaria Journal 7: 151.
Koenker, Hannah, Albert Kilian, Gabrielle Hunter, Angela Acosta, Leah Scandurra, Babafunke Fagbemi,
Emmanuel O Onyefunafoa, Megan Fotheringham, and Matthew Lynch. 2015. “Impact of a Behaviour
Change Intervention on Long-Lasting Insecticidal Net Care and Repair Behaviour and Net Condition in
Nasarawa State, Nigeria.” Malaria Journal 14: 18.
Korenromp, Eline L., Joanna R. M. Armstrong-Schellenberg, Brian G. Williams, Bernard L. Nahlen, and
Robert W. Snow. 2004. “Impact of Malaria Control on Childhood Anaemia in Africa - a Quantitative
Review.” Tropical Medicine and International Health 9 (10).: 1050–65.
Korenromp, Eline L., John Miller, Richard E. Cibulskis, M. Kabir Cham, David Alnwick, and Christopher
Dye. 2003. “Monitoring Mosquito Net Coverage for Malaria Control in Africa: Possession vs. Use by
Children under 5 Years.” Tropical Medicine and International Health 8 (8): 693–703.

160
Kottek, Markus, Jürgen Grieser, Christoph Beck, Bruno Rudolf, and Franz Rubel. 2006. “World Map of the
Köppen-Geiger Climate Classification Updated.” Eschweizerbartxxx Meteorologische Zeitschrift 15
(3): 259–63.
Kremsner, Peter G, Akim A Adegnika, Aurore B Hounkpatin, Jeannot F Zinsou, Terrie E Taylor, Yamikani
Chimalizeni, Alice Liomba, et al. 2016a. “Intramuscular Artesunate for Severe Malaria in African
Children: A Multicenter Randomized Controlled Trial.” PLoS Medicine 13 (1): e1001938.
Kyaw, Shwe Sin, Tom Drake, Ronatrai Ruangveerayuth, Wirongrong Chierakul, Nicholas J White, Paul N
Newton, and Yoel Lubell. 2014. “Cost of Treating Inpatient Falciparum Malaria on the Thai-Myanmar
Border.” Malaria Journal 13: 416.
Larson, Peter S, Noboru Minakawa, Gabriel O Dida, Sammy M Njenga, Edward L Ionides, and Mark L
Wilson. 2014. “Insecticide-Treated Net Use before and after Mass Distribution in a Fishing Community
along Lake Victoria, Kenya: Successes and Unavoidable Pitfalls.” Malaria Journal 13 (1): 466.
Lengeler, C. 2004. “Insecticide-Treated Bed Nets and Curtains for Preventing Malaria.” The Cochrane
Database of Systematic Reviews, no. 2: CD000363.
Likwela, J Losimba, P Donnen, and M Wilmet Dramaix. 2012. “Clinical Aspects and Outcome of Suspected
Severe Pediatric Malaria.” Médecine et Maladies Infectieuses 42: 315–20.
Lim, Stephen S., Nancy Fullman, Andrew Stokes, Nirmala Ravishankar, Felix Masiye, Christopher J L
Murray, and Emmanuela Gakidou. 2011. “Net Benefits: A Multicountry Analysis of Observational
Data Examining Associations between Insecticide-Treated Mosquito Nets and Health Outcomes.” PLoS
Medicine 8 (9).
Loha, Eskindir, Kebede Tefera, and Bernt Lindtjørn. 2013. “Freely Distributed Bed-Net Use among Chano
Mille Residents, South Ethiopia: A Longitudinal Study.” Malaria Journal 12 (1): 23.
Lubell, Y., S. Yeung, A. M. Dondorp, N. P. Day, F. Nosten, E. Tjitra, Md. Abul Faiz, et al. 2009. “Cost-
Effectiveness of Artesunate for the Treatment of Severe Malaria.” Tropical Medicine & International
Health 14 (3): 332–37.
Lubell, Yoel, Arthorn Riewpaiboon, Arjen M Dondorp, Lorenz von Seidlein, Olugbenga a Mokuolu,
Margaret Nansumba, Samwel Gesase, et al. 2011. “Cost-Effectiveness of Parenteral Artesunate for
Treating Children with Severe Malaria in Sub-Saharan Africa.” Bulletin of the World Health
Organization 89: 504–12.
Machault, Vanessa, Libasse Gadiaga, Cécile Vignolles, Fanny Jarjaval, Samia Bouzid, Cheikh Sokhna, Jean-
Pierre Lacaux, Jean-François Trape, Christophe Rogier, and Frédéric Pagès. 2009. “Highly Focused
Anopheline Breeding Sites and Malaria Transmission in Dakar.” Malaria Journal 8: 138.

161
MacIntyre, Kate, Megan Littrell, Joseph Keating, Busiku Hamainza, John Miller, and Thomas P. Eisele.
2012. “Determinants of Hanging and Use of ITNs in the Context of near Universal Coverage in
Zambia.” Health Policy and Planning 27 (4): 316–25.
Maheu-Giroux, Mathieu, and Marcia C Castro. 2014. “Cost-Effectiveness of Larviciding for Urban Malaria
Control in Tanzania.” Malaria Journal 13: 477.
“Malaria Atlas Project, Democratic Republic of Congo, Malaria Risk.” 2010.
Marsh, K, D Forster, C Waruiru, I Mwangi, M Winstanley, V Marsh, C Newton, P Winstanley, P Warn, and
N Peshu. 1995. “Indicators of Life-Threatening Malaria in African Children.” The New England
Journal of Medicine 332 (21): 1399–1404.
Massue, Dennis J., Sarah J. Moore, Zawadi D. Mageni, Jason D. Moore, John Bradley, Olivier Pigeon,
Erasto J. Maziba, et al. 2016. “Durability of Olyset Campaign Nets Distributed between 2009 and 2011
in Eight Districts of Tanzania.” Malaria Journal 15 (1): 176.
Matangila, Junior R, Joachim Yorokpa Doua, Sylvie Linsuke, Joule Madinga, Raquel Inocêncio da Luz,
Jean-Pierre Van Geertruyden, and Pascal Lutumba. 2014. “Malaria, Schistosomiasis and Soil
Transmitted Helminth Burden and Their Correlation with Anemia in Children Attending Primary
Schools in Kinshasa, Democratic Republic of Congo.” PloS One 9 (11). Public Library of Science:
e110789.
Mathanga, Don P, Carl H Campbell, Jodi Vanden Eng, Adam Wolkon, Rachel N Bronzan, Grace J Malenga,
Doreen Ali, and Meghna Desai. 2010. “Comparison of Anaemia and Parasitaemia as Indicators of
Malaria Control in Household and EPI-Health Facility Surveys in Malawi.” Malaria Journal 9: 107.
Matthys, Barbara, Penelope Vounatsou, Giovanna Raso, Andres B Tschannen, Emmanuel Gbede Becket,
Laura Gosoniu, Gueladio Cissé, Marcel Tanner, Eliézer K N’goran, and Jürg Utzinger. 2006. “Urban
Farming and Malaria Risk Factors in a Medium-Sized Town in Cote d’Ivoire.” The American Journal
of Tropical Medicine and Hygiene 75 (6): 1223–31.
Messina, Jane P, Steve M Taylor, Steven R Meshnick, Andrew M Linke, Antoinette K Tshefu, Benjamin
Atua, Kashamuka Mwandagalirwa, and Michael Emch. 2011. “Population, Behavioural and
Environmental Drivers of Malaria Prevalence in the Democratic Republic of Congo.” Malaria Journal
10: 161.
Ministère de la Santé publique 2011. “Plan National de Développement Sanitaire PNDS 2011-2015.”
Monroe, April, Obed Asamoah, Yukyan Lam, Hannah Koenker, Paul Psychas, Matthew Lynch, Emily
Ricotta, Sureyya Hornston, Amanda Berman, and Steven a Harvey. 2015. “Outdoor-Sleeping and Other

162
Night-Time Activities in Northern Ghana: Implications for Residual Transmission and Malaria
Prevention.” Malaria Journal 14 (1): 35.
Mouchet, J, P Carnevale, M Coosemans, C Ravaonjanahary, A Richard, and V Robert. 1993. “Typologie Du
Paludisme En Afrique.” Cahiers Santé 3: 320–38.
Msellemu, Daniel, Hagai I Namango, Victoria M Mwakalinga, Alex J Ntamatungiro, Yeromin Mlacha,
Zacharia J Mtema, Samson Kiware, et al. 2016. “The Epidemiology of Residual Plasmodium
Falciparum Malaria Transmission and Infection Burden in an African City with High Coverage of
Multiple Vector Control Measures.” Malaria Journal 15 (1): 288.
MSF. 2011. “Making the Switch. Ensuring Access to Improved Tretment for Severe Malaria in Africa.”
Geneva.
Mulumba, M P, M Wery, N N Ngimbi, K Paluku, P Van der Stuyft, and A De Muynck. 1990. “Le Paludisme
de L’enfant À Kinshasa(Zaire) Influence Des Saisons, de L'age, de L'environnement et Du Standing
Familial.” Med Trop 50.
Mutuku, Francis M, Maureen Khambira, Donal Bisanzio, Peter Mungai, Isaac Mwanzo, Eric M Muchiri,
Charles H King, and Uriel Kitron. 2013. “Physical Condition and Maintenance of Mosquito Bed Nets
in Kwale County, Coastal Kenya.” Malaria Journal 12.: 46.
Nankabirwa, Joaniter, Simon J. Brooker, Sian E. Clarke, Deepika Fernando, Caroline W. Gitonga, David
Schellenberg, and Brian Greenwood. 2014. “Malaria in School-Age Children in Africa: An
Increasingly Important Challenge.” Tropical Medicine and International Health 19 (11): 1294–1309.
Networks. 2014. “Evaluationdu Système de Distribution Des Moustiquaires Imprégnées D’insecticide À
Longue Durée D'action (MILD) En RépubliqueDémocratique Du Congobasée Sur Une Étude de Cas
Dans Les Provinces Du Bas-Congo et de Katanga.”
Ngimbi, N P, A Beckers, and M Wery. 1982. “Survey of the Epidemiological Status of Malaria in Kinshasa
(Republic of Zaire) in 1980.” Annales de La Société Belge de Médecine Tropicale 62 (2): 121–37.
Nicastri, Emanuele, Nazario Bevilacqua, Monica Sañé Schepisi, Maria G Paglia, Silvia Meschi, Shaali M
Ame, Jape A Mohamed, et al. 2009. “Accuracy of Malaria Diagnosis by Microscopy , Rapid
Diagnostic Test , and PCR Methods and Evidence of Antimalarial Overprescription in Non-Severe
Febrile Patients in Two Tanzanian Hospitals” 80 (5): 712–17.
Noor, Abdisalan M., Abdinasir A. Amin, Willis S. Akhwale, and Robert W. Snow. 2007. “Increasing
Coverage and Decreasing Inequity in Insecticide-Treated Bed Net Use among Rural Kenyan Children.”
PLoS Medicine 4 (8): 1341–48.
Ntuku, Henry M T, Gianfrancesco Ferrari, Christian Burri, Antoinette K Tshefu, Didier M Kalemwa, and
163
Christian Lengeler. 2016. “Feasibility and Acceptability of Injectable Artesunate for the Treatment of
Severe Malaria in the Democratic Republic of Congo.” Malaria Journal 15: 18.
OANDA. 2016. “Currency Converter.” Accessed February 2. http://www.oanda.com/currency/historical-
rates/.
Onyamboko, M A, C I Fanello, K Wongsaen, J Tarning, P Y Cheah, K A Tshefu, A M Dondorp, F Nosten,
N J White, and N P J Day. 2014. “Randomized Comparison of the Efficacies and Tolerabilities of
Three Artemisinin-Based Combination Treatments for Children with Acute Plasmodium Falciparum
Malaria in the Democratic Republic of the Congo.” Antimicrobial Agents and Chemotherapy 58 (9):
5528–36.
Phillips-Howard, Penelop A., Bernard L. Nahlen, Margarette S. Kolczak, Allen W. Hightower, Feiko O. Ter
Kuile, Jane A. Alaii, John E. Gimnig, et al. 2003. “Efficacy of Permetrine-Treated Bed Nets in the
Prevention of Mortality in Young Children in an Area of High Perennial Malaria Transmission in
Western Kenya.” Am J Trop Med Hyg 68 (90040): 23–29.
PNLP. 2012. “Directives Nationales de Traitement Du Paludisme En République Démocratique Du Congo
(Draft), Ministère de La Santé, Kinshasa.”
PNLP. 2013a. “Plan Stratégique National de Lutte Contre Le Paludisme 2013-2015.” Kinshasa.
PNLP. 2013b. “Rapport Annuel D’activités 2012.”
PNLP. 2016. “Plan Stratégique National de Lutte Contre Le Paludisme 2016-2020.” Kinshasa.
PNLP, SWISSTPH, KSPH, INRB, and INFORM. 2014. “ An Epidemiological Profile of Malaria in the
Democratic Republic of Congo, A report prepared for the Ministry of Health, Democratic
Republic of Congo, the Roll Back Malaria Partnership and the Department for International
Development” UK, March 2014
Pond, Bob S. 2013. “Malaria Indicator Surveys Demonstrate a Markedly Lower Prevalence of Malaria in
Large Cities of Sub-Saharan Africa.” Malaria Journal 12: 313.
Premji, Z, Y Hamisi, C Shiff, J Minjas, P Lubega, and C Makwaya. 1995. “Anaemia and Plasmodium
Falciparum Infections among Young Children in an Holoendemic Area, Bagamoyo, Tanzania.” Acta
Tropica 59 (1): 55–64.
Premji, Z, P Lubega, Y Hamisi, E Mchopa, J Minjas, W Checkley, and C Shiff. 1995. “Changes in Malaria
Associated Morbidity in Children Using Insecticide Treated Mosquito Nets in the Bagamoyo District of
Coastal Tanzania.” Tropical Medicine and Parasitology : Official Organ of Deutsche
Tropenmedizinische Gesellschaft and of Deutsche Gesellschaft Für Technische Zusammenarbeit (GTZ)
46 (3): 147–53.

164
Pulkki-Brännström, AM, Claudia Wolff, Niklas Brännström, and Jolene Skordis-Worrall. 2012. “Cost and
Cost Effectiveness of Long-Lasting Insecticide-Treated Bed Nets - a Model-Based Analysis.” Cost
Effectiveness and Rosource Allocation 10: 5.
Ranson, Hilary, Raphael N’Guessan, Jonathan Lines, Nicolas Moiroux, Zinga Nkuni, and Vincent Corbel.
2011. “Pyrethroid Resistance in African Anopheline Mosquitoes: What Are the Implications for
Malaria Control?” Trends in Parasitology 27 (2): 91–98.
RBM. 2000a. “Economic Costs of Malaria.” http://www.rollbackmalaria.org/files/files/toolbox/RBM
Economic Costs of Malaria.pdf.
RBM. 2000b. “The Abuja Declaration on Roll Back Malaria in Africa and the Plan of Action.”
http://apps.who.int/iris/bitstream/10665/67816/1/WHO_CDS_RBM_2003.46.pdf.
Renggli, Sabine, Renata Mandike, Karen Kramer, Faith Patrick, Nick J Brown, Peter D McElroy,
Wilhelmina Rimisho, et al. 2013. “Design, Implementation and Evaluation of a National Campaign to
Deliver 18 Million Free Long-Lasting Insecticidal Nets to Uncovered Sleeping Spaces in Tanzania.”
Malaria Journal 12 (1): 85.
Reyburn, Hugh, Redempta Mbatia, Chris Drakeley, Jane Bruce, Ilona Carneiro, Raimos Olomi, Jonathan
Cox, et al. 2005. “Association of Transmission Intensity and Age with Clinical Manifestations and
Case Fatality of Severe Plasmodium Falciparum Malaria.” The Journal of the American Medical
Association 293 (12): 1461–70.
Rickard, D G, R N Dudovitz, M D Wong, H C Jen, R D Osborn, H E Fernandez, and C I Donkor. 2011.
“Closing the Gap between Insec- Ticide Treated Net Ownership and Use for Prevention of Malaria.”
Prog Community Health Partnership 5: 123–31.
Robert, Vincent, Kate Macintyre, Joseph Keating, Jean-Francois Trape, Jean-Bernard Duchemin, McWilson
Warren, and John C Beier. 2003. “Malaria Transmission in Urban Sub-Saharan Africa.” The American
Journal of Tropical Medicine and Hygiene 68 (2): 169–76.
Roll Back Malaria. 2014. “Malaria Situation and Response, Democratic Republic of the Congo.”
Roll Back Malaria. 2015. “Action and Investment to Defeat Malaria (RMB-AIM) 2016-2030.” Geneva.
Roll Back Malaria Partnership. 2011. “Refined / Updated GMAP Objectives , Targets , Milestones and
Priorities Beyond 2011.” Geneva.
Rolling, Thierry, Tsiri Agbenyega, Saadou Issifou, Ayola Akim Adegnika, Justice Sylverken, Dorothee
Spahlinger, Daniel Ansong, et al. 2014. “Delayed Hemolysis after Treatment with Parenteral
Artesunate in African Children with Severe Malaria - A Double-Center Prospective Study.” Journal of
Infectious Diseases 209: 1921–28.

165
Rolling, Thierry, Dominic Wichmann, Stefan Schmiedel, Gerd D Burchard, Stefan Kluge, and Jakob P
Cramer. 2013. “Artesunate versus Quinine in the Treatment of Severe Imported Malaria : Comparative
Analysis of Adverse Events Focussing on Delayed Haemolysis.” Malaria Journal 12 (1): 1.
Rosenberg, Ronald. 2007. “Plasmodium Vivax in Africa: Hidden in Plain Sight?” Trends in Parasitology 23
(5): 193–96.
Rowe, Alexander K, S Patrick Kachur, Steven S Yoon, Matthew Lynch, Laurence Slutsker, and Richard W
Steketee. 2009. “Caution Is Required When Using Health Facility-Based Data to Evaluate the Health
Impact of Malaria Control Efforts in Africa.” Malaria Journal 8: 209.
Ryan, Jeffrey R, José A Stoute, Joseph Amon, Raymond F Dunton, Ramadhan Mtalib, Joseph Koros, Boaz
Owour, et al. 2006. “Evidence for Transmission of Plasmodium Vivax among a Duffy Antigen
Negative Population in Western Kenya.” The American Journal of Tropical Medicine and Hygiene 75
(4): 575–81.
Sachs, Jefferey, and Pia Malaney. 2002. “The Economic and Social Burden of Malaria.” Nature 415 (6872):
680–85. doi:10.1038/415680a.
Sam-wobo, Sammy Olufemi, Oludare Alani Agbeyangi, Uwemedimo Friday Ekpo, Oluseyi Adeboye
Akinloye, Chiedu F. Mafiana, and Monsuru Adebayo Adeleke. 2012. “Rectal Artesunates, Their
Utilization, and Parental Perception in the Management of Malaria in Children from Abeokuta,
Southwestern Nigeria.” Vector-Borne and Zoonotic Diseases 12 (2): 151–55.
“Saving More Lives with Artesunate Injectable. Injectable Artesunate Stakeholders’ Meeting Report.” 2012.
http://www.mmv.org/sites/default/files/uploads/docs/publications/Injectable Artesunate Stakeholders
Meeting Report.pdf.
Sinclair, D, S Donegan, R Isba, Lalloo Dg, David Sinclair, Sarah Donegan, Rachel Isba, and David G Lalloo.
2012. “Artesunate versus Quinine for Treating Severe Malaria.” Cochrane Database of Systematic
Reviews, no. 6.
Sinka, Marianne E, Michael J Bangs, Sylvie Manguin, Yasmin Rubio-Palis, Theeraphap Chareonviriyaphap,
Maureen Coetzee, Charles M Mbogo, et al. 2012. “A Global Map of Dominant Malaria Vectors.”
Parasites & Vectors 5 (1): 69.
Smith Paintain, Lucy, Elizabeth Awini, Sheila Addei, Vida Kukula, Christian Nikoi, Doris Sarpong, Alfred
Kwesi Manyei, et al. 2014. “Evaluation of a Universal Long-Lasting Insecticidal Net (LLIN)
Distribution Campaign in Ghana: Cost Effectiveness of Distribution and Hang-up Activities.” Malar J
13 (1): 71.
Smith, D L, J Dushoff, R W Snow, and S I Hay. 2005. “The Entomological Inoculation Rate and
Plasmodium Falciparum Infection in African Children.” Nature 438 (7067): 492–95.

166
Snow, Robert W, and Kevin Marsh. 2002. “The Consequences of Reducing Transmission of Plasmodium
Falciparum in Africa.” Advances in Parasitology 52: 235–64.
Snow, Robert W, Kevin Marsh, and D le Sueur. 1996. “The Need for Maps of Transmission Intensity to
Guide Malaria Control in Africa.” Parasitology Today 12: 455–57.
Soares Magalhães, Ricardo J, and Archie C A Clements. 2011. “Spatial Heterogeneity of Haemoglobin
Concentration in Preschool-Age Children in Sub-Saharan Africa.” Bulletin of the World Health
Organization 89 (6). World Health Organization: 459–68.
Staedke, Sarah G, E Willis Nottingham, Jonathan Cox, Moses R Kamya, Philip J Rosenthal, and Grant
Dorsey. 2003. “Short Report: Proximity to Mosquito Breeding Sites as a Risk Factor for Clinical
Malaria Episodes in an Urban Cohort of Ugandan Children.” The American Journal of Tropical
Medicine and Hygiene 69 (3): 244–46
Stoler, Justin, John R Weeks, Arthur Getis, and Allan G Hill. 2009. “Distance Threshold for the Effect of
Urban Agriculture on Elevated Self-Reported Malaria Prevalence in Accra, Ghana.” The American
Journal of Tropical Medicine and Hygiene 80 (4): 547–54.
Taylor, Steve M., Jane P. Messina, Carla C. Hand, Jonathan J. Juliano, Jeremie Muwonga, Antoinette K.
Tshefu, Benjamin Atua, Michael Emch, and Steven R. Meshnick. 2011. “Molecular Malaria
Epidemiology: Mapping and Burden Estimates for the Democratic Republic of the Congo, 2007.” PLoS
ONE 6 (1).
Taylor, WR, and NJ White. 2004. “Antimalarial Drug Toxicity: A Review.” Drug Safety 27 (1): 25–61.
Ter Kuile, Feiko O., Dianne J. Terlouw, Penelope A. Phillips-Howard, William A. Hawley, Jennifer F.
Friedman, Margarette S. Kolczak, Simon K. Kariuki, et al. 2003. “Impact of Permethrin-Treated Bed
Nets on Malaria and All-Cause Morbidity in Young Children in an Area of Intense Perennial Malaria
Transmission in Western Kenya: Cross-Sectional Survey.” American Journal of Tropical Medicine and
Hygiene 68 (4 SUPPL.): 100–107.
Thawani, Neeta, Manisha A Kulkarni, and Salim Sohani. 2009. “Factors Associated with Coverage and
Usage of Long-Lasting Insecticidal Nets in Madagascar.” J Trop Med 2009: 451719.
Thwing, Julie, Natasha Hochberg, Jodi Vanden Eng, Sanouna Issifi, M. James Eliades, Etienne Minkoulou,
Adam Wolkon, et al. 2008. “Insecticide-Treated Net Ownership and Usage in Niger after a Nationwide
Integrated Campaign.” Tropical Medicine and International Health 13 (6): 827–34.
Trape, J F. 1987. “Malaria and Urbanization in Central Africa: The Example of Brazzaville. Part IV.
Parasitological and Serological Surveys in Urban and Surrounding Rural Areas.” Transactions of the
Royal Society of Tropical Medicine and Hygiene 81 Suppl 2: 26–33.

167
Trape, Jean François, Gilles Pison, André Spiegel, Catherine Enel, and Christophe Rogier. 2002.
“Combating Malaria in Africa.” Trends in Parasitology 18 (5): 224–30.
Tshilolo, L, L M Aissi, D Lukusa, C Kinsiama, S Wembonyama, B Gulbis, and F Vertongen. 2009.
“Neonatal Screening for Sickle Cell Anaemia in the Democratic Republic of the Congo: Experience
from a Pioneer Project on 31 204 Newborns.” Journal of Clinical Pathology 62 (1): 35–38.
UNDP. 2014. “Human Development Report 2014 Sustaining Human Progress: Reducing Vulnerabilities and
Building Resilience.” New York.
UNICEF. 2010. “Multiple Indicators Cluster Survey.” Kinshasa.
USAID/SIAPS. 2014. “SIAPS Quarterly Report.”
Vyas, Seema, and Lilani Kumaranayake. 2006. “Constructing Socio-Economic Status Indices: How to Use
Principal Components Analysis.” Health Policy and Planning 21 (6): 459–68.
Wamae, P.M., A.K. Githeko, G.O. Otieno, E.W. Kabiru, and S.O. Duombia. 2015. “Early Biting of the
Anopheles Gambiae S.s. and Its Challenges to Vector Control Using Insecticide Treated Nets in
Western Kenya Highlands.” Acta Tropica 150: 136–42.
Wang, Shr-Jie, Christian Lengeler, Thomas A Smith, Penelope Vounatsou, Martin Akogbeto, and Marcel
Tanner. 2006. “Rapid Urban Malaria Appraisal (RUMA) IV: Epidemiology of Urban Malaria in
Cotonou (Benin).” Malaria Journal 5: 45
Wang, Shr-Jie, Christian Lengeler, Thomas A Smith, Penelope Vounatsou, Guéladio Cissé, Diadie A Diallo,
Martin Akogbeto, Deo Mtasiwa, Awash Teklehaimanot, and Marcel Tanner. 2005. “Rapid Urban
Malaria Appraisal (RUMA) in Sub-Saharan Africa.” Malaria Journal 4: 40.
Warrell, David Alan, and Herbert Michael Gilles. 2002. Essential Malariology. 4th ed. London, UK.: Arnold
White, Michael T, Lesong Conteh, Richard Cibulskis, and Azra C Ghani. 2011. “Costs and Cost-
Effectiveness of Malaria Control Interventions - a Systematic Review.” Malaria Journal 10 (1): 337.
WHO. 2011a. “Disease Surveillance for Malaria Control An Operational Manual.” Geneva.
WHO. 2011b. “Guidelines for Treatment of Malaria, Second Edition.”
WHO. 2011c. “World Malaria Report 2011.” Vol. WHO/HTM/GM. Geneva. doi:ISBN 978 92 4 1564403.
WHO. 2012a. “Global Plan for Insecticide Resistance Management in Malaria Vectors.” Geneva. WHO.
WHO. 2012b. “World Malaria Report 2012.”
WHO. 2013a. Management of Severe Malaria. A Practical Handbook.

168
WHO. 2013b. “Methods for Maintaining Coverage with Long-Lasting Insecticidal Nets (LLINs).” Geneva.
WHO. 2013c. “World Malaria Report 2013.” Geneva.
WHO. 2014a. “Recommendations for Achieving Universal Coverage with Long-Lasting Insecticidal Nets in
Malaria Control.” World Health Organisation. Geneva.
WHO. 2014b. “World Malaria Report 2014.” Geneva. doi:10.1016/S0140-6736(05)66420-3.
WHO. 2015a. “Global Technical Strategy for Malaria 2016-2030.” WHO Geneva. Geneva.
http://apps.who.int/iris/bitstream/10665/176712/1/9789241564991_eng.pdf?ua=1.
WHO. 2015b. “World Malaria Report 2015.” Geneva.
WHO PMI UNICEF RBM Measure Evaluation. 2013. “Household Survey Indicators for Malaria Control.”
Geneva.
Willey, Barbara, Lucy Smith Paintain, Lindsay Mangham, Josip Car, and Joanna Armstrong Schellenberg.
2012. “Strategies for Delivering Insecticide-Treated Nets at Scale for Malaria Control: A Systematic
Review.” Bulletin of the World Health Organization 90 (9): 672–84.
Wills, Aprielle B, Stephen C Smith, Gedeon Y Anshebo, Patricia M Graves, Tekola Endeshaw, Estifanos B
Shargie, Mesele Damte, et al. 2013. “Physical Durability of PermaNet 2.0 Long-Lasting Insecticidal
Nets over Three to 32 Months of Use in Ethiopia.” Malaria Journal 12: 242.
Winskill, Peter, Mark Rowland, George Mtove, Robert C Malima, and Matthew J Kirby. 2011. “Malaria
Risk Factors in North-East Tanzania.” Malaria Journal 10: 98.
Wolf, Laurent Renard, Erick Jean Otten, and MP Spadafora. 1992. “Cinchonism: Two Case Reports and
Review of Acute Quinine Toxicity and Treatment.” J Emerg Med. 10: 295–301.
Woolhouse, M E. 1998. “Patterns in Parasite Epidemiology: The Peak Shift.” Parasitology Today (Personal
Ed.) 14 (10): 428–34.
World Bank. 2016. “World Development Indicators. Gross National Income per Capita 2015.” New York.
Wu, Lindsey, Lotus L. van den Hoogen, Hannah Slater, Patrick G. T. Walker, Azra C. Ghani, Chris J.
Drakeley, and Lucy C. Okell. 2015. “Comparison of Diagnostics for the Detection of Asymptomatic
Plasmodium Falciparum Infections to Inform Control and Elimination Strategies.” Nature 528 (7580):
S86–93.
Yadouléton, Anges, Raphael N’guessan, Hyacinthe Allagbé, Alex Asidi, Michel Boko, Razack Osse, Gil
Padonou, Gazard Kindé, and Martin Akogbéto. 2010. “The Impact of the Expansion of Urban
Vegetable Farming on Malaria Transmission in Major Cities of Benin.” Parasites & Vectors 3: 118.

169
Ye, Yazoume, Elizabeth Patton, Albert Kilian, Samantha Dovey, and Erin Eckert. 2012. “Can Universal
Insecticide-Treated Net Campaigns Achieve Equity in Coverage and Use ? The Case of Northern
Nigeria.” Malaria Journal 11 (1): 32.
Yukich, Joshua O, Jessica Butts, Melody Miles, Yemane Berhane, Honelgn Nahusenay, Joseph L Malone,
Gunawardena Dissanayake, et al. 2014. “A Description of Malaria Sentinel Surveillance: A Case Study
in Oromia Regional State, Ethiopia.” Malaria Journal 13 (1): 88.
Zegers de Beyl, Celine, Hannah Koenker, Angela Acosta, Emmanuel Obi Onyefunafoa, Emmanuel Adegbe,
Anna McCartney-Melstad, Richmond Ato Selby, and Albert Kilian. 2016. “Multi-Country Comparison
of Delivery Strategies for Mass Campaigns to Achieve Universal Coverage with Insecticide-Treated
Nets: What Works Best?” Malaria Journal 15 (1): 58.
Zoller, Thomas, Thomas Junghanss, Annette Kapaun, Ida Gjorup, Joachim Richter, Mats Hugo-Persson,
Kristine Mørch, et al. 2011. “Intravenous Artesunate for Severe Malaria in Travelers, Europe.”
Emerging Infectious Diseases 17 (5): 771–77.


