ECONOMIC EVALUATION OF ROTAVIRUS VACCINATION FOR MALAYSIA
THARANI LOGANATHAN
FACULTY OF MEDICINE UNIVERSITY OF MALAYA
KUALA LUMPUR
2016
Univers
ity of
Mala
ya
ECONOMIC EVALUATION OF ROTAVIRUS
VACCINATION FOR MALAYSIA
THARANI LOGANATHAN
THESIS SUBMITTED IN PARTIAL FULFILMENT
OF THE REQUIREMENTS FOR THE DEGREE OF
DOCTOR OF PUBLIC HEALTH
FACULTY OF MEDICINE
UNIVERSITY OF MALAYA
KUALA LUMPUR
2016
Univers
ity of
Mala
ya

UNIVERSITY OF MALAYA
ORIGINAL LITERARY WORK DECLARATION
Name of Candidate: THARANI LOGANATHAN
Matric No: MHC130011
Name of Degree: DOCTOR OF PUBLIC HEALTH
Title of Thesis:
ECONOMIC EVALUATION OF ROTAVIRUS VACCINATION FOR MALAYSIA
Field of Study: HEALTH ECONOMICS
I do solemnly and sincerely declare that:
(1) I am the sole author/writer of this Work;
(2) This Work is original;
(3) Any use of any work in which copyright exists was done by way of fair dealing
and for permitted purposes and any excerpt or extract from, or reference to or
reproduction of any copyright work has been disclosed expressly and
sufficiently and the title of the Work and its authorship have been
acknowledged in this Work;
(4) I do not have any actual knowledge nor do I ought reasonably to know that the
making of this work constitutes an infringement of any copyright work;
(5) I hereby assign all and every rights in the copyright to this Work to the
University of Malaya (“UM”), who henceforth shall be owner of the copyright
in this Work and that any reproduction or use in any form or by any means
whatsoever is prohibited without the written consent of UM having been first
had and obtained;
(6) I am fully aware that if in the course of making this Work I have infringed any
copyright whether intentionally or otherwise, I may be subject to legal action
or any other action as may be determined by UM.
Candidate’s Signature Date:
Subscribed and solemnly declared before,
Witness’s Signature Date:
Name:
Designation:
Univers
ity of
Mala
ya
iii
ABSTRACT
Rotavirus infection is an important cause of severe diarrhoea among children under-five
years worldwide. Two rotavirus vaccines are available worldwide, that are safe,
efficacious and recommended by the World Health Organization for inclusion into
national immunisation programmes. Although widely regarded as cost-effective
interventions, rotavirus vaccines are expensive. Vaccine introduction has been slow in
middle-income countries like Malaysia, with low rotavirus mortality. Hence, an economic
evaluation is necessary to inform evidence-based policy making surrounding the
inclusion of rotavirus vaccines into the Malaysian national immunisation programme. In
this thesis, a conceptual framework was developed for the economic evaluation of
rotavirus vaccines in Malaysia. The burden of rotavirus was estimated, followed by the
assessment cost-effectiveness, affordability and the benefits of rotavirus vaccines in
providing financial risk protection and enhancing equity in Malaysia. The health and
economic burden of rotavirus gastroenteritis in Malaysia was estimated using multiple
local data sources. Cost-effectiveness of rotavirus vaccines was evaluated from the
healthcare provider and societal perspectives, using an age-structured, multi-cohort
model. A budget impact analysis was conducted to assess the affordability of a universal
rotavirus vaccination programme to the Ministry of Health, Malaysia. As Malaysia has
not determined a threshold for cost-effectiveness of interventions, this thesis explores
vaccine price and affordability, at various cost-effectiveness thresholds suggested for
Malaysia. A two-year prospective, hospital-based rotavirus study conducted at two public
hospitals in Malaysia provided patient-level data for the exploration of illness-related
healthcare expenditure and its impact on household income. On identifying income-
related inequities in out-of-pocket healthcare payments for rotavirus gastroenteritis, an
extended cost-effectiveness analysis was conducted to evaluate the distributional benefits
of universal rotavirus vaccination in averting illness and providing financial risk
Univers
ity of
Mala
ya

iv
protection in Malaysia. This thesis found that rotavirus gastroenteritis results in a
substantial health and economic burden in Malaysia, much of which was previously
overlooked. Both rotavirus vaccines are likely to be cost-effective and affordable to the
Ministry of Health, Malaysia, at prices negotiated in line with international tenders. Out-
of-pocket healthcare expenditure for rotavirus especially impacts poor households.
Universal vaccination would reduce rotavirus episodes and costs among all income
groups, while the poor would particularly benefit in terms financial risk protection. The
economic evaluation of rotavirus vaccines in this thesis is the first conducted in Malaysia.
The evidence gathered here strongly suggests that rotavirus vaccines are a worthy
investment for the government of Malaysia. The framework proposed in this thesis for
economic evaluations of rotavirus vaccines in Malaysia, may be used for evaluations of
other vaccination programmes in Malaysia, or other middle-income countries.
Univers
ity of
Mala
ya

v
ABSTRAK
Jangkitan kuman rotavirus adalah punca utama cirit-birit di kalangan kanak-kanak
dibawah umur lima tahun di seluruh dunia. Terdapat dua vaksin rotavirus yang selamat,
berkesan dan telah disyorkan oleh The World Health Organization untuk dimasukkan
dalam program imunisasi kebangsaan di seluruh dunia. Walaupun vaksin rotavirus
dianggap secara meluas sebagai intervensi yang kos efektif, namun vaksin rotavirus
adalah mahal. Didapati bahawa vaksin rotavirus lambat dimasukkan ke dalam program
imunisasi kebangsaan, terutamanya di negara yang berpendapatan sederhana seperti
Malaysia, dengan kadar kematian akibat cirit-birit rotavirus yang rendah. Oleh itu,
penilaian ekonomi amatlah diperlukan bagi memaklumkan polisi tentang penyertaan
vaksin rotavirus ke dalam program imunisasi kebangsaan di Malaysia. Dalam tesis ini,
satu rangka kerja konsep telah dimajukan bagi penilaian ekonomi vaksin rotavirus di
Malaysia. Beban cirit-birit disebabkan oleh jangkitan rotavirus dianggarkan bagi
Malaysia, diikuti dengan penilaian keberkesanan kos vaksin rotavirus, kemampuan bajet,
serta manfaat vaksin dari segi memberi perlindungan risiko kewangan dan mengurangkan
ketidakadilan dalam perbelanjaan kesihatan di Malaysia. Beban dari segi bilangan kes
dan kos cirit-birit rotavirus di Malaysia dianggarkan menggunakan pelbagai sumber data
tempatan. Keberkesanan kos vaksin rotavirus telah dinilai dari perspektif pihak kesihatan
dan juga dari perspektif masyarakat di Malaysia, dengan menggunakan model ekonomi
kohort berstruktur umur. Analisa impak bajet dijalankan untuk menilai kemampuan
kewangan Kementerian Kesihatan Malaysia bagi menaja program immunisasi rotavirus
secara kebangsaan. Oleh disebabkan Malaysia belum lagi menetapkan ambang nilai bagi
menentukan intervensi yang kos efektif, tesis ini menganggarkan harga vaksin dan
kemampuan bajet, dengan menggunakan beberapa had kos efektif yang pernah
dicadangkan untuk Malaysia. Data dari penyelidikan cirit-birit rotavirus yang telah
dijalankan di dua hospital kerajaan di Malaysia telah dianalisa untuk mengetahui
Univers
ity of
Mala
ya

vi
perbelanjaan kesihatan bagi cirit-birit rotavirus dan kesan perbelanjaan ini terhadap
pendapatan isi rumah. Seterusnya, analisa extended cost-effectiveness analysis telah
dijalankan untuk mengkaji manfaat program vaksin rotavirus dalam mengurangkan beban
penyakit dan memberi perlindungan risiko kewangan bagi semua pendudak di Malaysia,
tanpa mengira pendapatan. Tesis ini telah mendapati bahawa beban rotavirus di Malaysia
adalah lebih tinggi daripada yang dijangka sebelum ini. Kedua-dua vaksin rotavirus
adalah kos efektif dan dalam kemampuan bajet Kementerian Kesihatan Malaysia, bila
harga vaksin adalah selari dengan harga yang didapati oleh negara lain melalui tender
antarabangsa. Didapati bahawa perbelanjaan kesihatan bagi cirit-birit rotavirus, lebih
memberi kesan mudarat kepada orang miskin. Vaksin rotavirus dijangka memberi
manfaat kepada semua rakyat dari segi pengurangan beban penyakit dan kos cirit-birit,
namun golongan yang termiskin akan lebih bermanfaat dari segi perlindungan risiko
kewangan. Penilaian ekonomi vaksin rotavirus dalam tesis ini adalah yang pertama
dijalankan untuk Malaysia. Keputusan penilaian ini mengesyorkan bahawa vaksin
rotavirus adalah pelaburan yang wajar bagi Kerajaan Malaysia. Rangka kerja yang
dicadangkan dalam tesis ini untuk penilaian ekonomi vaksin rotavirus di Malaysia boleh
digunakan untuk program kesihatan awam yang lain di Malaysia, dan juga di negara-
negara yang lain yang setanding.
Univers
ity of
Mala
ya

vii
ACKNOWLEDGEMENTS
My journey towards the achieving a doctorate degree has been memorable. In the
pursuit of this degree, I have learnt an immeasurable number of lessons and experienced
things that were previously inconceivable. Many challenges were faced on route and
obstacles overcome, through sheer hard work and perseverance. I would like to
acknowledge and thank those whom provided support, encouragement and guidance, to
smoothen my path towards success.
I would like to express gratitude to my parents, who emphasised education above all
else. My father, who believed that one higher degree was never enough, and my mother,
who has been a lifelong inspiration. I would like to thank my brother for his unwavering
support. My nieces Shakti, Nanthini and Anjali, deserve a special mention, as they
provide much needed grounding.
My journey has been supported by my supervisors Associate Professor Dr. Ng Chiu-
Wan, Professor Dr. Lee Way-Seah and Dr Mark Jit, who provided guidance and
assistance throughout this journey. I would like to thank my collaborators, Dr Stéphane
Verguet and Dr Raymond Hutubessy, for their valuable contributions towards guiding
my research and the eventual publication of this work. I would like to thank Professor Dr.
Ruth Kiew, who shared generous advice, as well as good company, throughout my
research odyssey.
Univers
ity of
Mala
ya

viii
TABLE OF CONTENTS
ABSTRACT ............................................................................................................... III
ABSTRAK ................................................................................................................. V
ACKNOWLEDGEMENTS ........................................................................................ VII
TABLE OF CONTENTS .......................................................................................... VIII
LIST OF FIGURES ................................................................................................... XIV
LIST OF TABLES ...................................................................................................... XV
LIST OF ABBREVIATIONS ................................................................................. XVII
CHAPTER 1: GENERAL INTRODUCTION ............................................................. 1
1.1 Introduction.............................................................................................................. 1
1.2 Study motivation ...................................................................................................... 2
1.3 Study objectives ....................................................................................................... 7
1.4 Significance of this study......................................................................................... 8
1.5 Layout of this thesis ............................................................................................... 10
CHAPTER 2: CONTEXTUAL BACKGROUND FOR THE ECONOMIC
EVALUATION OF ROTAVIRUS VACCINATION ....................... 12
2.1 Introduction............................................................................................................ 12
2.2 Epidemiology and burden of rotavirus .................................................................. 13
2.2.1 Global burden of rotavirus gastroenteritis ................................................... 13
2.2.2 Burden of rotavirus gastroenteritis in Malaysia .......................................... 14
2.2.3 Rotavirus epidemiology ............................................................................... 16
2.2.3.1 Clinical picture ............................................................................ 16
2.2.3.2 Viral transmission ....................................................................... 17
2.2.3.3 Natural history of viral infection ................................................. 17
2.3 Rotavirus vaccines ................................................................................................. 18
2.3.1 Development of rotavirus vaccines ............................................................. 18
2.3.1.1 RotaShield® ................................................................................ 18
2.3.1.2 Rotarix® and RotaTeq® ............................................................. 19
Univers
ity of
Mala
ya

ix
2.3.1.3 New rotavirus vaccines ............................................................... 20
2.3.2 Safety and efficacy of rotavirus vaccines .................................................... 20
2.3.3 WHO recommendation for rotavirus vaccines ............................................ 22
2.3.4 Rotavirus vaccine introduction worldwide .................................................. 23
2.3.5 Impact of rotavirus vaccines ........................................................................ 25
2.3.6 Cost of new vaccines ................................................................................... 25
2.3.7 Dilemma of middle-income countries ......................................................... 26
2.4 The Malaysian context ........................................................................................... 27
2.4.1 Country background .................................................................................... 27
2.4.2 The healthcare system in Malaysia .............................................................. 28
2.4.3 The Malaysian national immunisation programme ..................................... 30
2.5 Summary ................................................................................................................ 34
CHAPTER 3: ECONOMIC EVALUATION OF VACCINES: THEORY AND
CONCEPTS .......................................................................................... 36
3.1 Introduction............................................................................................................ 36
3.2 Economic theories informing resource allocation for vaccination programmes ... 37
3.2.1 Argument for the public finance of vaccination programmes ..................... 37
3.2.2 Efficiency .................................................................................................... 40
3.2.3 Equity .................................................................................................... 43
3.3 Evidence based framework for vaccine introduction ............................................ 46
3.4 Criteria for the evaluation of vaccination programmes ......................................... 47
3.4.1 Health and economic burden ....................................................................... 48
3.4.2 Safety, efficacy and quality ......................................................................... 48
3.4.3 Cost-effectiveness ........................................................................................ 49
3.4.4 Affordability ................................................................................................ 50
3.4.5 Equity and financial risk protection ............................................................. 50
3.4.6 Other considerations .................................................................................... 52
3.5 The conceptual framework for economic evaluation of rotavirus vaccination in
Malaysia ................................................................................................................. 52
3.6 Summary ................................................................................................................ 55
Univers
ity of
Mala
ya

x
THE HIDDEN HEALTH AND ECONOMIC BURDEN OF
ROTAVIRUS GASTROENTERITIS IN MALAYSIA: AN
ESTIMATION USING MULTIPLE DATA SOURCES .................. 56
4.1 Introduction............................................................................................................ 56
4.2 Materials and methods ........................................................................................... 57
4.2.1 Study overview ............................................................................................ 57
4.2.2 Estimating the health burden of rotavirus gastroenteritis ............................ 59
4.2.2.1 Hospitalisations ........................................................................... 59
4.2.2.2 Outpatient visits .......................................................................... 63
4.2.2.3 Home-treated episodes ................................................................ 70
4.2.2.4 Deaths .......................................................................................... 71
4.2.2.5 Proportion of acute gastroenteritis attributable to rotavirus ........ 74
4.2.3 Estimating the economic burden of rotavirus gastroenteritis ...................... 76
4.2.3.1 Direct medical costs .................................................................... 76
4.2.3.2 Direct non-medical costs ............................................................. 88
4.2.3.3 Indirect costs ............................................................................... 89
4.3 Results ................................................................................................................... 90
4.3.1 Health burden .............................................................................................. 90
4.3.1.1 Incidence of acute gastroenteritis ................................................ 90
4.3.1.2 Proportion attributable to rotavirus among children
hospitalised for acute gastroenteritis ........................................... 93
4.3.1.3 Incidence of rotavirus gastroenteritis .......................................... 99
4.3.2 Economic burden ......................................................................................... 99
4.4 Discussion ............................................................................................................ 105
4.5 Conclusion ........................................................................................................... 112
CHAPTER 5: THE COST-EFFECTIVENESS AND AFFORDABILITY OF
ROTAVIRUS VACCINATION IN MALAYSIA ............................ 113
5.1 Introduction.......................................................................................................... 113
5.2 Materials and methods ......................................................................................... 114
5.2.1 Study overview .......................................................................................... 114
5.2.2 Economic models used for cost-effectiveness analysis ............................. 120
5.2.2.1 Mathematical models ................................................................ 120
Univers
ity of
Mala
ya

xi
5.2.2.2 Choice of economic model........................................................ 121
5.2.3 Economic assumptions and parameters used in the model ........................ 122
5.2.3.1 Population demographics .......................................................... 122
5.2.3.2 Rotavirus incidence ................................................................... 122
5.2.3.3 Quality-adjusted life-years ........................................................ 123
5.2.3.4 Cost of illness ............................................................................ 126
5.2.3.5 Vaccine coverage ...................................................................... 127
5.2.3.6 Costs of the vaccination programme ......................................... 127
5.2.3.7 Vaccine efficacy ........................................................................ 131
5.2.4 Sensitivity analysis .................................................................................... 137
5.2.4.1 Incidence ................................................................................... 137
5.2.4.2 Costs .......................................................................................... 137
5.2.4.3 Vaccine efficacy ........................................................................ 138
5.2.4.4 Quality-adjusted life-years ........................................................ 139
5.2.4.5 Discount rate ............................................................................. 139
5.2.5 Threshold analysis ..................................................................................... 140
5.2.5.1 WHO-CHOICE threshold ......................................................... 141
5.2.5.2 Societal willingness to pay threshold ........................................ 143
5.2.5.3 Marginal productivity threshold ................................................ 145
5.2.6 Budget impact analysis .............................................................................. 146
5.3 Results ................................................................................................................. 149
5.3.1 Base-case analysis ..................................................................................... 149
5.3.2 Sensitivity analysis .................................................................................... 154
5.3.3 Threshold analysis ..................................................................................... 156
5.3.4 Budget impact analysis .............................................................................. 157
5.4 Discussion ............................................................................................................ 159
5.5 Conclusion ........................................................................................................... 167
CHAPTER 6: HOUSEHOLD CATASTROPHIC HEALTHCARE
EXPENDITURE AND IMPOVERISHMENT DUE TO
ROTAVIRUS GASTROENTERITIS REQUIRING
HOSPITALISATION IN MALAYSIA ............................................ 168
6.1 Introduction.......................................................................................................... 168
6.2 Materials and methods ......................................................................................... 169
6.2.1 Study overview .......................................................................................... 169
Univers
ity of
Mala
ya

xii
6.2.2 Study settings ............................................................................................. 171
6.2.3 Data collection ........................................................................................... 171
6.2.4 Description of terms .................................................................................. 172
6.2.4.1 Direct medical costs .................................................................. 172
6.2.4.2 Direct non-medical costs ........................................................... 173
6.2.4.3 Indirect costs ............................................................................. 174
6.2.4.4 Catastrophic healthcare expenditure ......................................... 174
6.2.4.5 Poverty impact .......................................................................... 178
6.2.4.6 Income-related inequity in healthcare payments....................... 182
6.2.5 Statistical Analysis .................................................................................... 184
6.2.5.1 Handling of missing values of household income .................... 186
6.3 Results ................................................................................................................. 189
6.3.1 General findings ........................................................................................ 189
6.3.2 Direct and indirect costs ............................................................................ 191
6.3.3 Catastrophic healthcare expenditure .......................................................... 195
6.3.4 Poverty impact of illness-related payments ............................................... 199
6.3.5 Income-related inequity in healthcare payments ....................................... 201
6.4 Discussion ............................................................................................................ 202
6.5 Conclusion ........................................................................................................... 208
CHAPTER 7: ENHANCING EQUITY AND FINANCIAL RISK
PROTECTION WITH ROTAVIRUS VACCINATION IN
MALAYSIA ........................................................................................ 209
7.1 Introduction.......................................................................................................... 209
7.2 Materials and methods ......................................................................................... 210
7.2.1 Study overview .......................................................................................... 210
7.2.2 Rationale for the extended cost-effectiveness analysis ............................. 213
7.2.2.1 Financial risk protection ............................................................ 213
7.2.2.2 Extended cost-effectiveness analysis ........................................ 214
7.2.3 Data sources ............................................................................................... 217
7.2.3.1 The National Health and Morbidity Survey 2011 ..................... 217
7.2.3.2 Hospital-based rotavirus study .................................................. 219
7.2.4 Parameters in the model ............................................................................ 221
7.2.4.1 Vaccine characteristics .............................................................. 221
Univers
ity of
Mala
ya
xiii
7.2.4.2 Rotavirus incidence ................................................................... 221
7.2.4.3 Direct medical costs .................................................................. 224
7.2.4.4 Catastrophic expenditure ........................................................... 226
7.2.4.5 Impoverishment......................................................................... 226
7.2.5 Analytical methods .................................................................................... 227
7.2.5.1 Estimating the standard deviation for out-of-pocket direct
medical costs by income quintile .............................................. 229
7.2.6 Scenario analysis ....................................................................................... 230
7.2.6.1 RotaTeq® .................................................................................. 230
7.2.6.2 Herd immunity .......................................................................... 230
7.2.6.3 Direct non-medical costs ........................................................... 230
7.2.6.4 Indirect costs ............................................................................. 231
7.3 Results ................................................................................................................. 232
7.3.1 General findings ........................................................................................ 232
7.3.2 Base-case analysis ..................................................................................... 233
7.3.3 Scenario analysis ....................................................................................... 236
7.4 Discussion ............................................................................................................ 239
7.5 Conclusions ......................................................................................................... 243
CHAPTER 8: CONCLUSION AND RECOMMENDATIONS ............................. 244
8.1 Introduction.......................................................................................................... 244
8.2 Research significance .......................................................................................... 245
8.2.1 Policy lessons for Malaysia ....................................................................... 245
8.2.2 Policy lessons for other countries .............................................................. 250
8.3 Direction for future research ................................................................................ 253
8.4 Conclusion ........................................................................................................... 255
REFERENCES ............................................................................................................ 256
LIST OF PUBLICATIONS AND PRESENTATIONS ........................................... 286
Univers
ity of
Mala
ya

xiv
LIST OF FIGURES
Figure 1.1: Outline of the thesis chapters .................................................................... 10
Figure 2.1: National rotavirus vaccine introductions by WHO regions ...................... 24
Figure 3.1: Conceptual framework for the economic evaluation of rotavirus vaccines
in Malaysia ................................................................................................ 54
Figure 4.1: Conceptual framework for estimating the health and economic burden of
rotavirus gastroenteritis in Malaysia ......................................................... 58
Figure 4.2: PRISMA flow diagram on the systematic review of hospital-based
rotavirus studies in Malaysia ..................................................................... 94
Figure 4.3: Meta-analysis of hospital-based rotavirus studies in Malaysia ................. 98
Figure 5.1: Tornado graph showing sensitivity analysis and effects on incremental
cost-effectiveness ratio ............................................................................ 155
Figure 6.1: Mean out-of-pocket costs for acute gastroenteritis requiring hospitalisation
by income quintiles at UMMC, Kuala Lumpur and HSNZ, Kuala
Terengganu .............................................................................................. 197
Figure 6.2: Households with catastrophic healthcare payments due to acute
gastroenteritis requiring hospitalisation by income quintiles at UMMC,
Kuala Lumpur and HSNZ, Kuala Terengganu ....................................... 198
Figure 6.3: Concentration curves of out-of-pocket healthcare expenditure due to acute
gastroenteritis requiring hospitalisation. ................................................. 201
Figure 7.1: Average out-of-pocket direct medical costs for rotavirus gastroenteritis by
income quintiles in Malaysia .................................................................. 234
Univers
ity of
Mala
ya
xv
LIST OF TABLES
Table 2.1: National immunisation schedule, Ministry of Health, Malaysia ............... 33
Table 4.1: Annual diarrhoeal discharges for children under-five years in Malaysia,
reported from 2008 to 2013 ....................................................................... 61
Table 4.2: Estimation of total diarrhoeal hospitalisations for children under-five years
in Malaysia ................................................................................................ 62
Table 4.3: Estimation of diarrhoeal outpatient visits to public facilities for children
under-five years in Malaysia ..................................................................... 67
Table 4.4: Estimation of diarrhoeal outpatient visits to private clinics for children
under-five years in Malaysia ..................................................................... 69
Table 4.5: Estimation of diarrhoeal mortality in children under-five years in
Malaysia, 2013 .......................................................................................... 73
Table 4.6: Estimation of unit costs at tertiary-level public hospitals in Malaysia ..... 80
Table 4.7: Estimation of unit cost in healthcare facilities in Malaysia, 2013 ............ 85
Table 4.8: Health burden of rotavirus gastroenteritis among children under-five years
in Malaysia, 2013. ..................................................................................... 92
Table 4.9: Summary of the hospital-based rotavirus studies selected for meta-
analysis ...................................................................................................... 96
Table 4.10: Estimation of direct medical costs for rotavirus gastroenteritis among
children under-five years in Malaysia, 2013 ........................................... 101
Table 4.11: Estimation of direct non-medical costs for rotavirus gastroenteritis among
children under-five years in Malaysia, 2013 ........................................... 102
Table 4.12: Estimation indirect costs for rotavirus gastroenteritis among children
under-five years in Malaysia, 2013 ......................................................... 103
Table 4.13: Economic burden of rotavirus gastroenteritis among children under-five
years in Malaysia, 2013 ........................................................................... 104
Table 5.1: Parameters used in the model .................................................................. 117
Table 5.2: Assumptions in the base-case and alternative scenarios ......................... 119
Table 5.3: Cost-effectiveness analysis studies with measured additional
administrative costs ................................................................................. 130
Table 5.4: Estimates of vaccine efficacy used in the base-case and the worst-case
scenario analysis ...................................................................................... 134
Table 5.5: Outcomes of rotavirus vaccination compared with no vaccination under
base-case assumptions ............................................................................. 151
Table 5.6: Incremental cost-effectiveness ratios of Rotarix® and RotaTeq®
vaccination programmes at PAHO and market price .............................. 153
Univers
ity of
Mala
ya

xvi
Table 5.7: Threshold analysis and budget impact analysis of rotavirus vaccines in
Malaysia .................................................................................................. 158
Table 6.1: Missing values for total household income at UMMC, Kuala Lumpur and
HSNZ, Kuala Terengganu ....................................................................... 186
Table 6.2: Characteristics of children hospitalised for acute gastroenteritis and tested
for rotavirus at UMMC, Kuala Lumpur and HSNZ, Kuala Terengganu 190
Table 6.3: Costs incurred by households for children hospitalised for acute
gastroenteritis and tested for rotavirus at UMMC, Kuala Lumpur and
HSNZ, Kuala Terengganu ....................................................................... 193
Table 6.4: Poverty impact of illness-related payments for acute gastroenteritis
requiring hospitalisation at UMMC, Kuala Lumpur and HSNZ, Kuala
Terengganu .............................................................................................. 200
Table 7.1: Parameters included in the base-case ...................................................... 212
Table 7.2: Comparison of income quintiles between the National Health and
Morbidity Survey 2011 and the hospital-based rotavirus study datasets 220
Table 7.3: Distribution of annual rotavirus episodes by income quintile in
Malaysia .................................................................................................. 223
Table 7.4: Out-of-pocket direct medical costs per-episode of rotavirus gastroenteritis
by income quintile in Malaysia ............................................................... 225
Table 7.5: Outcomes of rotavirus vaccination compared with no vaccination by
income quintile in Malaysia .................................................................... 235
Table 7.6: Scenario analysis comparing the impact of both rotavirus vaccines and
herd immunity on outcome measures...................................................... 237
Table 7.7: Scenario analysis considering the impact of vaccination on household
costs for rotavirus gastroenteritis ............................................................ 238
Univers
ity of
Mala
ya

xvii
LIST OF ABBREVIATIONS
BCG : Bacillus Calmette-Guérin
CHERG : Child Health Epidemiology Reference group
CI : Confidence Interval
DALYs : Disability-adjusted life years
DTaP : Diphtheria, tetanus and acellular pertussis
DTP : Diphtheria-Tetanus-Pertussis
EB : Enumeration Block
ECEA : Extended Cost-Effectiveness Analysis
EPI : Expanded Programme on Immunisation
EQ-5D : EuroQoL 5D
FDA : Food and Drug Agency
GDP : Gross Domestic Product
GNI : Gross National Income
HAS : Hospital Sultanah Bahiyah, Alor Setar
Hib : Haemophilus influenzae type b
HITAP : Health Intervention and Technology Assessment Program
HM : Hospital Melaka
HPV : Human Papilloma Virus
HRQoL : Health Related Quality of Life
HSB : Hospital Sungai Buloh
HSNZ : Hospital Sultanah Nur Zahirah
HT : Hospital Sultan Haji Ahmad Shah, Temerloh
HUI 2 : Health Utility Index Mark 2
ICD-10 : International Classification of Disease, 10th Revision
ICER : Incremental Cost-effectiveness Ratio
IMCI : Integrated Management of Childhood Illness
IPV : Inactivated poliomyelitis vaccine
JE : Japanese encephalitis
LQ : Living Quarter
MAR : Missing At Random
MCAR : Missing At Completely At Random
MMR : Measles-Mumps-Rubella
MOH : Ministry of Health
Univers
ity of
Mala
ya
xviii
MR : Measles-Rubella
MSF : Médecins Sans Frontières
NHS : National Health Service
NHMS : National Health and Morbidity Survey
NICE : National Institute for Health and Care Excellence
NITAG : National Immunisation Technical Advisory Groups
OOP : Out-of-Pocket
OPV : Oral Polio Vaccine
OR : Odds Ratio
PAHO : Pan-American Health Association
PLI : Poverty line income
PPP : Purchasing power parity
QALYs : Quality-adjusted life years
RM : Ringgit Malaysia
SAGE : Strategic Advisory Group of Experts on Immunisations
SD : Standard deviation
SDGs : Sustainable Development Goals
TT : Tetanus Toxoid
UHC : Universal Health Coverage
UMMC : University of Malaya Medical Centre
UN : United Nations
UNDP : United Nations Development Programme
UNICEF : United Nations Children’s Fund
US : United States
US$ : United States Dollars
VSL : Value of Statistical Life
WASH : Water, Sanitation and Hygiene
WHO : World Health Organization
WHO-
CHOICE
: World Health Organization-CHOosing Interventions which are
Cost-Effective
WHO-cMYP : WHO-comprehensive Multi-Year Plan for Immunization
WTP : Willingness-to-pay
Univers
ity of
Mala
ya

1
CHAPTER 1: GENERAL INTRODUCTION
1.1 Introduction
Rotavirus diarrhoea is an important cause of diarrhoeal mortality and morbidity
worldwide (Parashar et al., 2009). In Malaysia rotavirus mortality is low, with 15 deaths
attributable to rotavirus estimated in 2008 (Tate et al., 2012). Rotavirus morbidity in
Malaysia is substantial. In 2005, it was estimated that by the age of five years, one in 37
children will visit a clinic, one in 61 children will be hospitalised, and one in 15,000
children will die due to rotavirus gastroenteritis in Malaysia (Hsu et al., 2005).Two
rotavirus vaccines are available, that are recommended by the World Health Organization
(WHO) for universal vaccination in all countries worldwide (Strategic Advisory Group
of Experts, 2009). Nevertheless, partly due to high vaccine prices and the likely
underestimation of the true burden, rotavirus vaccines are not part of the national
immunisation programme in Malaysia. Consequently, an economic evaluation is
necessary to inform evidence-based decision-making on the public finance of rotavirus
vaccines in Malaysia.
A fundamental concern in economics is the scarcity of healthcare resources relative to
population needs. Health systems choose interventions with the aim of maximising
population health within the constraints of limited budgets. Of importance however is not
just the overall improvement of health, but ensuring that the distribution of benefits and
costs are fair. The way costs and benefits are distributed reflect values of justice or
fairness, important in society. Conventional economic evaluations focus on the narrow
benefits of vaccination, namely in averting disease and healthcare costs, which
undervalues the potential broader economic benefits of vaccines to individuals,
households and society.
In this thesis, economic arguments are developed to inform policy on the inclusion of
rotavirus vaccines into the Malaysian national immunisation programme. A framework
Univers
ity of
Mala
ya

2
is developed for the economic evaluation of rotavirus vaccines, in aid of evidence-
informed decision-making on vaccine introduction in Malaysia. The health and economic
burden of rotavirus gastroenteritis in Malaysia is comprehensively estimated, including
deaths and episodes treated publicly, privately and at home. The cost-effectiveness,
affordability and the broader economic benefits of rotavirus vaccination in providing
financial risk protection across income groups are explored.
The chapter begins with Section 1.2, which explains the motivation behind this study
and is followed by Section 1.3, which lists the study objectives. Next is Section 1.4, in
which the public health significance of the study is discussed. The chapter concludes with
Section 1.5, which presents the layout of this thesis.
1.2 Study motivation
Rotavirus infection is the most common cause of severe diarrhoea worldwide
(Parashar et al., 2009). Rotavirus diarrhoea accounts for 453,000 deaths in children
younger than five years of age, which is equivalent to 37 per cent of all diarrhoeal deaths,
or five per cent of all deaths in children under the age of five years worldwide (Tate et
al., 2012). The majority of rotavirus diarrhoeal deaths occur in low-income countries with
inadequate access to healthcare. In high- and middle-income countries, mortality due to
rotavirus diarrhoea is low, but the associated morbidity is high.
Rotavirus is highly infective and transmissible. As improvements in water, hygiene
and sanitation does not reduce the incidence of rotavirus diarrhoea, rotavirus vaccines are
the only effective preventive measure available. Since 2006, two oral rotavirus vaccines
have been available internationally. Safety, efficacy and effectiveness of these vaccines
have been proven in large clinical trials and post-licensure studies (Ruiz-Palacios et al.,
2006; Vesikari et al., 2006). In 2009, the WHO recommended that all countries include
rotavirus vaccines into national primary immunisation schedules (Strategic Advisory
Group of Experts, 2009).
Univers
ity of
Mala
ya

3
Although, rotavirus vaccines are widely known to be cost-effective interventions in
low- and middle-income countries (Atherly, Lewis, Tate, Parashar, & Rheingans, 2012),
rotavirus vaccines are more expensive compared to traditional vaccines included in the
Expanded Programme for Immunisation (EPI). (Madsen, Ustrup, Fischer, Bygbjerg, &
Konradsen, 2012). Thus, the decision for public finance of rotavirus vaccines is not
immediately clear in middle-income countries with low rotavirus mortality, including
Malaysia.
Rotavirus vaccination has a tremendous impact in the prevention of diarrhoeal deaths,
especially in low-income countries. Low-income countries also have access to subsidised
vaccine prices and innovative financing mechanisms, which promote the introduction of
rotavirus vaccines. In high-income countries despite low rotavirus mortality, vaccination
reduces the economic burden of rotavirus diarrhoea, in terms of caregiver wage loss and
healthcare costs. Despite high vaccine prices in these countries, reduction in morbidity is
an important consideration towards universal vaccination.
Malaysia, like most middle-income countries, is not eligible for external aid for
vaccination programmes. Rotavirus mortality is low in Malaysia. The one previous
estimate of rotavirus burden in Malaysia suggested substantial morbidity. However, this
previous study focused mainly on rotavirus episodes treated at the public sector (Hsu et
al., 2005), potentially underestimating the burden in Malaysia, where significant private
sector provision of services occurs. In addition, this previous study did not consider
rotavirus episodes not seeking formal treatment, underestimating caregiver productivity
loss. Although, safe and effective vaccines are available, evidence of cost-effectiveness
or ‘value for money’ is necessary to inform policy on vaccine introduction. Affordability
of vaccination programmes are of practical concern to budget holders. The perception
that rotavirus vaccines are expensive, is a barrier for its adoption in middle-income
countries (E. A. S. Nelson, de Quadros, Santosham, Parashar, & Steele, 2013). For these
Univers
ity of
Mala
ya

4
reasons, economic evaluations are necessary to inform on the public finance of a rotavirus
vaccines in middle-income countries, like Malaysia.
The basic economic problem faced by healthcare systems is the allocation of scarce
resources1 with the aim of maximising population health. Healthcare budgets are finite,
and are largely dependent on the national economy. Especially during times of economic
downturn, budgets are rationalised to provide the most health benefits. In the wake of the
1997 Asian Financial Crisis, the public health budget in Malaysia was cut by twelve per
cent, leading the Ministry of Health (MOH), Malaysia to reprioritise services to maximise
utilisation of resources and productivity (Suleiman, Lye, Yon, Teoh, & Alias, 1998).
Due to a variety of internal and external factors, the value of the Malaysian Ringgit
(RM) plummeted by 26 per cent from January to October 2015 (Bank Negara Malaysia,
2015). The rapidly, decreasing value of the ringgit suggests imminent healthcare
rationing. In the 2016 Malaysian National Budget, the operational budget for the MOH,
Malaysia was decreased by one per cent from the previous year, or RM 21,431 billion as
compared to RM 21, 714 billion in 2015 (Ministry of Finance Malaysia, 2015). Although
the Prime Minister announced a recalibrated National Budget for 2016 on January 28th
20162, there was no official statement on the revision of the MOH annual budget3
(Ministry of Finance Malaysia, 2016).
In the context of constrained budgets, policy-makers have to make choices between
competing programmes or interventions. This is especially important as choosing a new
programme may displace existing programmes or limit the implementation of other
necessary programmes.
1 While scarce resources usually refers to financial budgets, healthcare resources are specific to health systems and also include
health personnel (labour), clinics or hospitals (capital), and other supplies like medications, needles and syringes. 2 The 2016 National Budget was restructured due to reduced national revenue from a prolonged slump in oil prices and a need to
reduce national fiscal deficits. 3 The Health Minister made a statement expecting a ten percent budget cut in 2016, of about RM 250 to 300 million, in response
to the Prime Minister’s announcement of the unexpected amendment of the 2016 National Budget (Zahiid, 2016). This press statement
was made on the 13th of January 2016, prior to the announcement of the revised 2016 National Budget on the 28th of January 2016
(Aziz, 2016).
Univers
ity of
Mala
ya

5
Cost-effectiveness analysis informs on the efficient allocation of scarce resources
towards improving population health. Traditionally, economic evaluations of vaccination
programmes consider the narrow benefits of vaccination, namely health gains and averted
costs to healthcare providers. This grossly undervalues the broader economic impact of
vaccination, which includes concerns on health equity4 and protecting the ill against the
financial consequences of healthcare payments5 (T. Bärnighausen et al., 2014; Bloom,
Canning, & Weston, 2005; Jit et al., 2015; P. C. Smith, 2013).
Malaysia is widely credited as having achieved universal health coverage (UHC),
through a public healthcare system that ensures access to needed care for all citizens, with
minimal or no user fees (Savedoff & Smith, 2011). However, the existence of a parallel
private healthcare system offering quality healthcare, exposes households to large out-of-
pocket (OOP) healthcare expenditure (Jaafar, Noh, Muttalib, Othman, & Healy, 2013).
OOP payments for healthcare, or payments made directly at the point of receipt of
care, may have detrimental impact on household welfare by displacing spending for
essentials like food, education and shelter. OOP healthcare payments are a regressive
form of health financing, impacting the poor more than the rich6 (World Health
Organization, 2000). Financial risk protection is a fundamental goal of health systems
(World Health Organization, 2000, 2010), and can be defined as access to healthcare
without incurring financial hardship as a result of paying for them7 (Saksena, Hsu, &
Evans, 2014).
Expenses paid OOP for rotavirus diarrhoea may not be large in magnitude, but may be
large as a proportion of household income. A 2007 study at a public hospital in Malaysia
4 Equity concerns fairness in the distribution of health, healthcare or healthcare spending over individuals or groups of individuals
in society. 5 Broader economic values of health can be briefly divided into productivity related gains (including lost days of work for illness
and lifetime improvement in productivity), community and health system externalities (including improvements in equity and financial
risk protection) and impact to the broader economy (impact on public sector budget and macroeconomic impact ) (T. Bärnighausen et al., 2014; Jit et al., 2015)
6 There are inequities or unfairness in healthcare payments paid OOP. Even if the magnitude of healthcare payment is the same,
the financial implications of these payments on rich and poor households are different. The poor have less savings and ability to cope with unexpected healthcare expenditure. OOP healthcare payments may deter the poor from accessing needed healthcare.
7 Providing financial risk protection removes the financial barriers or hardship faced by the sick having to pay for healthcare.
Financial risks of ill health include incurring healthcare payments that results in impoverishment or financial catastrophe.
Univers
ity of
Mala
ya

6
found that on average OOP expenses for an episode of rotavirus diarrhoea was RM 766
(in 2013 RM), or 26 per cent of average monthly income of households surveyed (Chai
& Lee, 2009). A universal rotavirus vaccination programme has the potential to reduce
expenditure and provide financial risk protection against illness-related expenditure for
all income groups. However, as the magnitude and distribution of these OOP healthcare
expenses for diarrhoeal illness have not been described in Malaysia, and thus the potential
benefits of rotavirus vaccines in alleviating this burden is not yet clear.
Currently, economic evidence is not a formal part of decision-making for the public
finance of vaccines in Malaysia. In September 2009, the MOH announced the
introduction Human Papillomavirus (HPV) vaccine to the Malaysian national
immunisation programme8, prior to publication of the results of cost-effectiveness
analysis (Ezat & Aljunid, 2010). Presumably due to a lack of local evidence, a MOH
technical review on the safety, efficacy and cost-effectiveness of HPV vaccines was based
on published international evidence from 1990 to 2006 (Ministry of Health Malaysia,
2011a). However, in anticipation of the future need for economic evaluations and to
encourage the generation of economic evidence, the MOH, Malaysia published a
methodological guideline on economic evaluation of pharmaceuticals in 2012 (Ministry
of Health Malaysia, 2012e).
Decision-making on public finance of vaccines should be transparent, evidence-based
and consider multiple criteria. In order to prioritise healthcare interventions, first the
public health importance of the disease should be established. The intervention must be
proven to be safe, effective and of quality for adoption. Economic criteria of interest
include cost-effectiveness, affordability and the ability of vaccination programmes to
provide financial risk protection and improve equity. Decision-making should ideally be
8 The HPV vaccine introduced universally to all school girls aged 13 years in Malaysia in 2010, was the most recent vaccine to
be introduced into the Malaysian National Immunisation programme.
Univers
ity of
Mala
ya
7
evidence-informed and consider multiple criteria, weighed against social value
judgements.
1.3 Study objectives
In this thesis, economic arguments are gathered in aid of evidence-based policy
making, with regards to the possible inclusion of the rotavirus vaccine into the Malaysian
national immunisation programme. First, the contextual background motivating the
economic evaluation of rotavirus vaccines in Malaysia is described, establishing the
public health need and barriers for public finance. Next, the theoretical and conceptual
basis for the allocation of scarce healthcare resources are reviewed and discussed.
Following which a conceptual framework is developed for the economic assessment of
rotavirus vaccines in Malaysia.
In view of establishing the importance of rotavirus gastroenteritis, and the subsequent
evaluation of cost-effectiveness of vaccination, the health and economic burden of
rotavirus gastroenteritis are comprehensively estimated in Malaysia. Rotavirus mortality
and morbidity, are estimated in terms of episodes receiving outpatient and inpatient
treatment, at public and private healthcare facilities, as well as those treated at home, and
the economic costs of these episodes to the healthcare provider and society.
The cost-effectiveness and affordability of rotavirus vaccines are evaluated. A range
of vaccine prices are suggested to aid policy-makers with vaccine price negotiations. In
this thesis, patient-level data on OOP expenses for rotavirus gastroenteritis is examined
to investigate the financial burden of healthcare payments on households and to explore
the possible income-related inequities in distribution of healthcare payments. On
identification of possible unfairness in distribution of healthcare payments, the benefits
of publicly-financed rotavirus vaccines, in terms of providing financial risk protection
and improving equity, are assessed. Finally, the economic evidence gathered are
Univers
ity of
Mala
ya
8
rationally discussed to inform policy and decision-making on the publicly-finance of
rotavirus vaccination in Malaysia.
Therefore the specific objectives of this study are:
1. To develop a conceptual framework for the assessment of universal rotavirus
vaccination in Malaysia.
2. To estimate the health and economic burden of rotavirus gastroenteritis to the
healthcare provider and society in Malaysia.
3. To assess if public finance of universal rotavirus vaccination is cost effective and
affordable to the Ministry of Health, Malaysia.
4. To explore the potential distributional effects of out-of-pocket expenditure for
rotavirus gastroenteritis on households in Malaysia.
5. To explore the potential distributional benefits of universal rotavirus vaccination in
providing financial risk protection to households in Malaysia.
6. To use the economic evidences derived from this study to rationally discuss the
possible inclusion of rotavirus vaccines into the Malaysian national immunisation
programme.
1.4 Significance of this study
This thesis seeks to establish the public health importance of rotavirus gastroenteritis
and the need for public finance of rotavirus vaccines. The burden of rotavirus
gastroenteritis is comprehensively estimated in Malaysia, considering all episodes of
rotavirus including those seeking care at public and private healthcare sectors and those
treated at home. This is particularly important as Malaysia has a mixed public and private
healthcare system. In Malaysia, the public health system is financed mainly from general
taxation, at minimal cost to the user. Private healthcare however is financed largely by
OOP payments. Previous estimations of rotavirus burden in Malaysia concentrated on
those seeking care at the public sector, and this under-estimates the wider societal costs
Univers
ity of
Mala
ya

9
of rotavirus diarrhoea. Comprehensive estimation of rotavirus burden allows for further
evaluation of cost-effectiveness and affordability of vaccines.
Cost-effectiveness is a relative measure. At present, the MOH, Malaysia has not set a
threshold for cost-effectiveness in Malaysia, making the determination of cost-
effectiveness subjective. The WHO cost-effectiveness thresholds though widely used,
were suggested for regional decision-making and have limited value in informing national
resource allocation (Eichler, Kong, Gerth, Mavros, & Jönsson, 2004; Newall, Jit, &
Hutubessy, 2014). Research groups worldwide have suggested several cost-effectiveness
thresholds motivated by fundamental economic theories on resource allocation in the
context of scarcity. These are the valuation of health on the basis of productivity or
average income (human capital approach), the determination of health needs and its value
by consumers of healthcare (consumer sovereignty) and the economic concept of valuing
the benefits of the next best healthcare intervention foregone (opportunity costs). In this
thesis, the cost-effectiveness and affordability of implementing a universal rotavirus
immunisation programme are explored at various cost-effectiveness thresholds. Cost-
effective prices are suggested to aid national negotiations for vaccine tenders.
In this thesis, prospective patient-level data was analysed to inform on possible
income-related inequities of healthcare expenditure for rotavirus in Malaysia. This
motivated the exploration of the benefits of universal rotavirus vaccination in providing
financial risk protection across income groups in Malaysia.
This is the first complete economic evaluation of rotavirus vaccines in Malaysia. This
thesis is contains a comprehensive estimation of the health and economic burden of
rotavirus in Malaysia, and is the first to assess the cost-effectiveness and affordability of
universal rotavirus vaccination in Malaysia. This is the first study to explore the
distributional benefits of rotavirus vaccines in alleviating health events, while providing
financial risk protection against illness-related expenditure in Malaysia. The framework
Univers
ity of
Mala
ya

10
developed during the course of this study may be useful for the economic evaluation of
other public health interventions, both in Malaysia and other middle-income countries.
1.5 Layout of this thesis
This thesis is reported in eight chapters in order to answer the delineated objectives.
Thesis chapters are summarised in Figure 1.1:
Figure 1.1: Outline of the thesis chapters
.
Univers
ity of
Mala
ya

11
Chapter 1 This chapter introduces the research topic and objectives, while
highlighting the study motivations and significance.
Chapter 2 This chapter describes the contextual background for the introduction of
universal rotavirus vaccination in Malaysia, by establishing the public health need for
rotavirus vaccines and the perceived barriers towards public finance of rotavirus vaccines.
Chapter 3 This chapter reviews the economic theories in the allocation of scarce
resources, and proposes a conceptual framework for the economic evaluation of rotavirus
vaccines in Malaysia.
Chapter 4 This chapter presents a comprehensive estimation of the health and
economic burden of rotavirus gastroenteritis in Malaysia using multiple data sources.
Chapter 5 This chapter presents the evaluation of cost-effectiveness and affordability
of rotavirus vaccines in Malaysia.
Chapter 6 This chapter explores the financial burden of healthcare expenditure on
households for rotavirus gastroenteritis and investigates the possibility of income-related
inequities in healthcare payments.
Chapter 7 In this chapter, the potential distributional benefits of universal rotavirus
vaccination in alleviating rotavirus episodes, illness-related expenses and providing
financial risk protection are explored.
Chapter 8 In this final chapter, the economic evidence gathered are rationally
discussed, in order to make a recommendations towards rotavirus vaccine introduction in
the Malaysian national immunisation programme. Univers
ity of
Mala
ya

12
CHAPTER 2: CONTEXTUAL BACKGROUND FOR THE ECONOMIC
EVALUATION OF ROTAVIRUS VACCINATION
2.1 Introduction
Worldwide, diarrhoea is the second commonest cause of death in children under-five
years of age, resulting in 0.8 million deaths or ten per cent of all deaths in 2010 (Liu et
al., 2012). Rotavirus diarrhoea is a major cause of severe diarrhoea, responsible for more
than a third of all diarrhoeal deaths, prior to the introduction of rotavirus vaccines (Tate
et al., 2012). Two rotavirus vaccines are recommended for universal vaccination based
on evidence of vaccine efficacy in all regions of the world (Strategic Advisory Group of
Experts, 2009).
Malaysia is an upper middle-income country with a mixed public-private healthcare
system. Public healthcare is financed by general taxation and is highly subsidised at point
of contact, while the private sector is financed mainly by OOP payments that are not
subsidised. Malaysia has a well-established national immunisation programme, with high
coverage of childhood vaccines (Jaafar et al., 2013). Although rotavirus vaccines are
recommended by the MOH, Malaysia, these ‘optional’ vaccines are not publicly-funded.
Economic evaluation of rotavirus vaccines is necessary to inform universal vaccine
introduction in Malaysia.
This chapter examines the global and national context that motivates the economic
evaluation of rotavirus vaccines in Malaysia. The chapter begins with Section 2.2, which
establishes the need for rotavirus vaccines by reviewing the existing evidence on pre-
vaccination burden of rotavirus gastroenteritis, globally and in Malaysia. This is followed
by a review of the epidemiology of rotavirus infection. Next Section 2.3, introduces the
rotavirus vaccines and establishes the basis for the WHO recommendation for universal
rotavirus vaccine introduction. Subsequently, this section identifies vaccine pricing
Univers
ity of
Mala
ya

13
mechanisms as a barrier towards the introduction of new vaccines to middle-income
countries, necessitating economic evaluations of vaccination programmes. This is
followed by Section 2.4, which provides a critical overview of Malaysia, the country and
its healthcare system, with specific emphasis on its national immunisation programme.
The chapter concludes with Section 2.5, which provides a chapter summary.
2.2 Epidemiology and burden of rotavirus
2.2.1 Global burden of rotavirus gastroenteritis
Rotavirus is an important cause of diarrhoeal mortality and morbidity worldwide.
Rotavirus is the most common aetiological agent responsible for acute gastroenteritis in
children globally. By the age of five years, almost every child worldwide will have had
an episode of rotavirus gastroenteritis. By the age of five years, one in five children will
visit a clinic, one in 65 children will be hospitalised, and approximately one in 293
children worldwide will die from rotavirus gastroenteritis (Parashar, Hummelman,
Bresee, Miller, & Glass, 2003). A systematic review by J. Bilcke et al. (2009), conducted
of prospective, community-based rotavirus studies, estimated a global incidence of 0.24
[95 per cent confidence interval (CI), 0.17 to 0.34] symptomatic rotavirus infections per
person-year of observation for children below two years of age.
The WHO estimated that in 2008, rotavirus gastroenteritis resulted in 453,000 deaths
among children under-five years worldwide. Rotavirus attributed 37 per cent of all
diarrhoeal deaths and five per cent of all deaths in children under the age of five years.
More than half of all rotavirus-related diarrhoeal deaths occurred in five countries
worldwide; The Democratic Republic of Congo, Ethiopia, India, Nigeria and Pakistan
(Tate et al., 2012).
Although the incidence of rotavirus gastroenteritis is similar worldwide, mortality
rates vary considerably between countries. Almost 90 per cent of all rotavirus-related
deaths occur in low-income countries. Diarrhoeal mortality is associated with poor access
Univers
ity of
Mala
ya

14
to health care and less than optimal management of severe diarrhoea. The underlying
nutritional status of the child also influences survival (Parashar et al., 2009).
In high- and middle-income countries9, even though rotavirus mortality is low, the
incidence of rotavirus gastroenteritis remains high, despite good hygiene and sanitation.
Rotavirus gastroenteritis causes considerable economic burden to healthcare systems and
households, in terms of expenditure related to seeking healthcare and loss of wages
(Meloni et al., 2011).
2.2.2 Burden of rotavirus gastroenteritis in Malaysia
Malaysia is an upper middle-income country, with an established healthcare system.
As universal access to healthcare and appropriate management of diarrhoea is readily
available in Malaysia, rotavirus mortality is low. However, diarrhoea attributable to
rotavirus results in considerable morbidity in Malaysia (Hsu et al., 2005).
In a systematic review of the burden of rotavirus gastroenteritis and distribution of
rotavirus strains in Asia, Kawai et al. (2012) estimated that the rotavirus mortality rate in
Malaysia was less than 0.5 per 100,000 children under-five years. The WHO estimated
that in 2008, there were 15 diarrhoeal deaths attributable to rotavirus among children
younger than five years in Malaysia (Tate et al., 2012).
Hsu et al. (2005) published an estimate of the burden of rotavirus gastroenteritis in
Malaysia, using national data from the MOH, Malaysia and the Department of Statistics,
Malaysia. Data on hospitalisations, clinic visits and deaths for acute gastroenteritis among
children under-five years from 1998 to 2000 were obtained. Rotavirus detection rates
from a two-centre hospital-based surveillance and a community-based study (Yap et al.,
1992), was used to estimate number of hospitalisations, clinic visits and deaths
9 The World Bank categorised countries according to the Gross National Income (GNI) per capita, calculated using the World
Bank’s Atlas Method. In 2016, low-income countries were defined as those with GNI per capita of United States Dollars (US$) 1,045
or below; middle-income countries are defined as those with GNI per capita of between US$ 1,045 and US$12,736; and high-income economies are those with GNI per capita of US$ 12,736 and above. Middle-income countries are separated into lower and upper
middle-income at a GNI per capita of US$ 4,125 (http://data.worldbank.org/about/country-and-lending-groups).
Univers
ity of
Mala
ya
15
attributable to rotavirus. Hsu et al. (2005) estimated that by the age of five years, one in
thirty seven children will visit a clinic, one in sixty one children will be hospitalised, and
one in fifteen thousand children will die due to rotavirus gastroenteritis in Malaysia.
While this is the only estimate of the health burden of rotavirus in Malaysia, the Hsu et
al. (2005) estimate concentrated on admissions and clinic visits to public facilities, not
considering home-treated episodes and inadequately considering privately treated
episodes.
Lee, Poo, and Nagaraj (2007) estimated that on average, an episode of rotavirus
gastroenteritis costs the healthcare provider RM 1,203 per hospitalised child (in 2013
RM). This study estimated annual costs of providing inpatient care for rotavirus
gastroenteritis of RM 10.3 million to the healthcare provider in Malaysia, in 2013 RM.
Chai and Lee (2009) estimated that on average direct medical costs paid OOP was RM
766 per child hospitalised for rotavirus gastroenteritis, and this expense constituted
twenty-six per cent of average monthly income of households’ surveyed.
Both these estimates of economic burden of rotavirus gastroenteritis were based on
primary data collected at one tertiary-level, public hospital in the capital of city of Kuala
Lumpur10, Thus, the obtained costs may not be reflective of the healthcare costs in
Malaysia (Chai & Lee, 2009; Lee et al., 2007). In addition, the Lee et al. (2007) estimate
only considered the economic burden of inpatient episodes treated at public hospitals,
omitting costs of outpatient-, privately- or home-treated episodes. Also the Lee et al.
(2007) estimate was from the healthcare providers’ perspective, and did not consider
direct non-medical and indirect costs.
10Studies were conducted at University of Malaya Medical Centre (UMMC) a tertiary-level, teaching hospital located in the
capital city of Kuala Lumpur. This public hospital is administered by the Ministry of Education and has a higher fee structure compared
to public hospitals under the Ministry of Health, Malaysia.
Univers
ity of
Mala
ya

16
As such, these previous studies may have underestimated the overall burden of
rotavirus in Malaysia, which includes rotavirus episodes treated publicly, privately and
at home, and the economic burden of these events to the healthcare provider and society.
2.2.3 Rotavirus epidemiology
2.2.3.1 Clinical picture
Rotavirus is the most common cause of severe, dehydrating diarrhoea in children
(Parashar et al., 2003). The rotavirus virus destroys mature enterocytes located on the tips
of the villi of the small intestine, limiting the absorptive capacity of the intestine and
resulting in diarrhoea. The peak incidence for rotavirus infection is between six and 24
months of age11. (World Health Organization, 2013d).
After ingesting the virus, there is a two to four day symptom-free incubation period,
during which the patient is infectious. Rotavirus infection has a wide clinical spectrum of
illness, varying from an asymptomatic infection, to a mild gastroenteritis with transient,
loose stools, or a moderate or severe gastroenteritis with fever, vomiting and dehydrating
diarrhoea, that may result in death (World Health Organization, 2013d). Children under-
two years of age are more likely to suffer from severe dehydrating diarrhoea, while adults
and older children experience milder symptoms (Velázquez et al., 1996). Clinical
symptoms usually last from four to eight days (Ward, Jiang, Farkas, & Bass, 2006).
Rotavirus gastroenteritis has no specific treatment. Diarrhoea and dehydration caused
by rotavirus are treated symptomatically. Mild dehydration may be treated with oral
rehydrating salts, while moderate and severe dehydration may require hospitalisation for
intravenous rehydration (World Health Organization, 2013d).
11 Children in low-income countries are subject to more severe infection at younger ages. In low-income countries, the first, severe
infection occurs between the ages of six to nine months. In high-income countries, the age of the first infection may be delayed until
two years of age.
Univers
ity of
Mala
ya
17
2.2.3.2 Viral transmission
Rotavirus is highly infectious, with only a low infectious dose needed for transmission.
An infected child can excrete up to a 100 billion viral particles per gram of stool, but as
little as ten viral particles may result in rotavirus infection. Also, rotavirus viral particles
may survive for weeks on surfaces (P. Dennehy, 2000).
Although the exact mode of transmission is yet unknown, rotavirus is directly
transmissible through touch and the oral-faecal route, and indirectly transmissible
through contact with contaminated fomites. Humans are the only reservoir for
transmission of rotavirus infection (P. Dennehy, 2000; C. Singer et al., 2010).
Improvements in hygiene and sanitation does not reduce the incidence of rotavirus
gastroenteritis. Hand washing and surface disinfection does not reduce viral transmission,
neither does the availability of clean water and sanitation. Incidence of rotavirus
gastroenteritis is similar in both high- and low-income countries. The universality of the
rotavirus incidence in high- and low-income countries, irrespective of standards of
sanitation and hygiene, is testament to the high transmissibility of the virus (Parashar et
al., 2003; World Health Organization, 2013d).
2.2.3.3 Natural history of viral infection
The first rotavirus infection occurring between the ages of three months and two years,
is the most severe. Each child is subject to multiple infections of rotavirus, with each
subsequent infection milder than the previous. Each natural infection results in an
antibody response that provides increasing immunity and protection against subsequent
infections.
By the age of five years, every child worldwide would have had a rotavirus infection.
Since, children are subject to multiple rotavirus infections and each infection provides
increasing immunity against subsequent severe illness, rotavirus infections are rare after
the age of five years (Bernstein, 2009).
Univers
ity of
Mala
ya

18
Antibody response towards a natural infection is heterotypic, and provides protection
against multiple serotypes. Asymptomatic infections appear to provide similar protection
against severe illness as symptomatic infections. Rotavirus vaccines were developed to
mimic the natural immunity provided by the first, severe rotavirus infections (Velázquez,
2009; Velázquez et al., 1996).
2.3 Rotavirus vaccines
2.3.1 Development of rotavirus vaccines
In line with the fourth Millennium Development Goal, there have been concerted
global efforts to reduce under-five mortality by two-thirds between 1990 and 2015. The
development of rotavirus vaccines, as well as the United Nations Children’s Fund’s
(UNICEF) strategies to improve standards of water, sanitation and hygiene (WASH) and
the WHO’s Integrated Management of Childhood Illness (IMCI), are part of international
efforts to reduce diarrheal deaths (United Nations Children’s Fund, 2005; World Health
Organization and UNICEF, 2013).
As improvements in water supply, hygiene and sanitation do not reduce rotavirus
transmission, vaccination is the ideal preventive measure against rotavirus infection.
Interest in the development of a rotavirus vaccine first started in the 1970s, soon after the
virus was discovered (Bishop, Davidson, Holmes, & Ruck, 1973).
2.3.1.1 RotaShield®
The first rotavirus vaccine RotaShield® (Wyeth-Lederly, USA), a human rhesus
reassortant, live-attenuated, orally administered vaccine, was licensed by the United
States’ Food and Drug Agency in 1998. Within a year of licensure, RotaShield® was
withdrawn from the United States market due to an increased risk of intussusception. The
risk of intussusception attributable to RotaShield® was one in ten thousand (Murphy,
Smith, Gargiullo, & Schwartz, 2003).
Univers
ity of
Mala
ya

19
Intussusception is a potentially fatal intestinal obstruction, caused by the ‘telescoping’
of the intestine. Its clinical features include vomiting, abdominal pain, bloody stool and
a palpable abdominal mass (Murphy et al., 2003). Although the risk of intussusception
attributable to RotaShield® was small, the harm caused was sufficient to warrant vaccine
withdrawal, despite its potential benefits worldwide (Murphy et al., 2003).
2.3.1.2 Rotarix® and RotaTeq®
Since 2006, two second generation live-attenuated, orally administered rotavirus
vaccines have been marketed internationally. These are the monovalent Rotarix®
(GlaxoSmithKline, Rixensart, Belgium) and the pentavalent RotaTeq® (Merck & Co.
Inc., USA) (World Health Organization, 2013d).
Rotarix® is a monovalent human rotavirus vaccine. Although the vaccine contains
only the common circulating, wild-type G 1 P [8] serotype, it protects against other G-
types. The Rotarix® vaccine is recommended to be given in two oral doses, in the first
six months of life. The first dose is recommended to be administered from six weeks of
life, with a minimum interval of six weeks between the first and second dose (C. Singer
et al., 2010; World Health Organization, 2013d).
RotaTeq® contains five human-bovine reassortant viruses. It contains a bovine (WC
3 strain) and an attenuated human virus which encodes either the VP 4 protein (P 8) or
the VP 7 protein (G 1, G 2, G 3, G 4). RotaTeq® is recommended to be given in three
oral doses, within the first six months of life. A minimum interval of at least four weeks
between doses is recommended. The first dose should be given between the six and
twelve weeks of life. (Jiang, Jiang, Tate, Parashar, & Patel, 2010; C. Singer et al., 2010;
World Health Organization, 2013d).
Univers
ity of
Mala
ya
20
2.3.1.3 New rotavirus vaccines
Recently, China, Vietnam and India have developed, and locally-manufactured
rotavirus vaccines. These vaccines are currently licensed for use only within these
countries (Yen et al., 2014).
The Indian manufactured, orally administered Rotavac® vaccine (Bharat Biotech
International Limited) has successfully completed phase III safety and efficacy trials
(Bhandari et al., 2014), and is licensed for use in India from 2014. Bharat Biotech
International Limited is currently seeking WHO prequalification for Rotavac®, so it may
be available globally in the near future (Medecins Sans Frontieres, 2015).
The Lanzhou Lamb Rotavirus Vaccine (Lanzhou Institute of Biological Products) has
been available in the private market in China since the year 2000. Rotavin-M® is
manufactured by Polyvac, Vietnam and has been licensed for use in Vietnam since 2007
(World Health Organization, 2013d; Yen et al., 2014).
These new rotavirus vaccines are potentially more affordable than current vaccines.
Bharat Biotech International Limited has made the commitment to offer Rotavac® at the
price of US$ 1 per-dose (Medecins Sans Frontieres, 2015). However, as none of these
vaccines are currently available internationally, they are not the focus of this thesis.
2.3.2 Safety and efficacy of rotavirus vaccines
Randomised controlled trials evaluating the safety and efficacy12 of Rotarix® and
RotaTeq® have been conducted in all regions of the world. The initial important trials
conducted in Europe and the Americas proved the vaccines to be safe and efficacious
(Ruiz-Palacios et al., 2006; Vesikari et al., 2006). In 2006, the WHO recommended the
use of rotavirus vaccines in these regions (World Health Organization, 2007). Subsequent
to vaccine efficacy results from clinical trials conducted in countries in Africa and Asia
12 Vaccine efficacy is the extent with which the vaccine reduces disease incidence in the vaccinated as compared to the
unvaccinated, within the ideal conditions of a clinical trial. Vaccine safety is a measure of the ability of vaccines to perform without
untoward adverse effects. (Houweling, Verweij, & Ruitenberg, 2010).
Univers
ity of
Mala
ya

21
(Armah et al., 2010; Zaman et al., 2010), the WHO expanded their recommendation of
rotavirus vaccines to all countries worldwide (World Health Organization, 2013d).
Oral rotavirus vaccines are found to be safe and have sustained efficacy against severe
rotavirus gastroenteritis and all cause gastroenteritis13. A 2011 Cochrane review of 41
clinical trials with a collective sample size of 186,263, found that both rotavirus vaccines
were effective at reducing rotavirus diarrhoea (severe cases and cases of any severity)
and all-cause gastroenteritis. In the first two years of life, Rotarix® and RotaTeq®
prevented about 80 per cent of severe cases of rotavirus diarrhoea in low-mortality
countries14, and at least 40 per cent in high-mortality countries15. Rotarix® reduced severe
cases of diarrhoea from all-causes by 35 to 40 per cent in low-mortality countries, and 15
to 30 per cent in high-mortality countries. Vaccination with RotaTeq® reduced severe
cases of all-cause diarrhoea by 73 per cent to 96 per cent in low-mortality countries, and
15 per cent in high-mortality countries (Soares‐Weiser et al., 2012).
Pre-licensure clinical trials for both Rotarix® and RotaTeq®, have shown that the risk
of intussusception does not differ between the vaccine and placebo arms. Although a
small, increased risk of intussusception of one to two excess cases of intussusception per
100,000 vaccinated infants was detected in trials conducted in Mexico (Rotarix®) and
Australia (RotaTeq® and Rotarix®), this risk is five to ten times lower than that attributed
to RotaShield® and is therefore considered negligible. The benefits of rotavirus
vaccination in preventing hospitalisation and death outweighs this small risk of
intussusception (Soares-Weiser et al., 2011; Soares‐Weiser et al., 2012; World Health
Organization, 2013d).
13 All-cause gastroenteritis includes any diarrhoea episode irrespective of causative agent or diagnosis. For example diarrhoea
may be due to viral or bacterial infections, or exposure to toxins or allergens (Soares‐Weiser et al., 2012) . 14 In this Cochrane review, countries were defined according to WHO mortality strata. Countries are defined as low-mortality
countries in WHO strata A and B (very low or low child mortality, and low adult mortality); and high-mortality countries in WHO
strata D and E (high child mortality, and high or very high adult mortality) (Soares‐Weiser et al., 2012). 15 Oral vaccines like rotavirus vaccines have lower efficacy rates in low-income countries, which have higher rotavirus mortality.
Postulated reasons for lower efficacy rates in these settings include co-infection with gut bacteria, malnutrition reducing absorption of oral vaccines and interference of immunogenicity due to maternal antibodies in breast-fed infants (World Health Organization,
2007).
Univers
ity of
Mala
ya

22
2.3.3 WHO recommendation for rotavirus vaccines
The safety and efficacy of both rotavirus vaccines have been proven in large phase III
trials worldwide, in all regions of the world (Jiang et al., 2010; Strategic Advisory Group
of Experts, 2009). While it was found that oral rotavirus vaccines had lower efficacy rates
in high mortality, low-income countries in Asia and Africa, the potential impact of
vaccines in preventing deaths and severe episodes in these settings are higher than in low
mortality countries (Strategic Advisory Group of Experts, 2009).
In 2009, WHO’s Strategic Advisory Group of Experts on Immunisations (SAGE)
recommended the inclusion of rotavirus vaccines for infants into all national
immunisation programmes, with a stronger recommendation for countries where
diarrhoeal deaths account for more than ten per cent of mortality among children under-
five years of age (Strategic Advisory Group of Experts, 2009).
The SAGE recommendation for universal rotavirus vaccination is part of a
comprehensive strategy for the prevention and control of childhood diarrhoea. These
measures include the provision of clean water, improvement of hygiene and sanitation,
ensuring the appropriate management of dehydration with oral rehydration salts and
intravenous rehydration, and zinc supplementation (Strategic Advisory Group of Experts,
2009; World Health Organization, 2013d)
The SAGE also concluded that since the estimates of vaccine efficacy correlate
inversely with rotavirus disease incidence, the efficacy and effectiveness data from a
rotavirus vaccine study can be used in populations within the same mortality stratum. The
mortality strata as defined by SAGE, is categorised according to a country’s under-five
mortality rate: high mortality (highest mortality quartile), intermediate mortality (next
quartile) and low mortality (lowest two quartiles) (Strategic Advisory Group of Experts,
2009).
Univers
ity of
Mala
ya
23
2.3.4 Rotavirus vaccine introduction worldwide
As of the first of January 2015, 80 countries worldwide have introduced the rotavirus
vaccines into their countries national immunisation programmes, including 37 Gavi-
eligible16 introductions and 25 introductions to non Gavi-eligible, middle-income
countries (Figure 2.1). Among Asian countries, only the Philippines and recently
Thailand have introduced the vaccines on a limited basis or pilot basis (PATH, 2016).
16 Gavi, the Vaccine Alliance (formerly known as the ‘Global Alliance for Vaccines and Immunisations’) is a public-private
global health partnership launched in the year 2000 to fund vaccines for children in the world’s poorest countries. Its mission is: “to
save children’s lives and protect people’s health by increasing access to immunisation in the world’s poorest countries.” (Gavi, 2015)
Univers
ity of
Mala
ya

24
Figure 2.1: National rotavirus vaccine introductions by WHO regions
Source: (PATH, 2016)Univ
ersity
of M
alaya

25
2.3.5 Impact of rotavirus vaccines
Randomised controlled trials prove vaccine efficacy in the ideal settings of clinical
trials. Post licensure surveillance studies inform on vaccine effectiveness, or the ‘real
world’ impact of vaccines17.
Post licensure surveillance from high- and middle-income countries have shown
substantial reductions in rotavirus diarrhoeal admissions (49 to 89 per cent), all-cause
diarrhoeal admissions (17 to 55 per cent) and reduction in all-cause diarrhoeal deaths in
Brazil (22 per cent) and Mexico (35 per cent) (Lopman et al., 2012; Patel, Glass, Desai,
Tate, & Parashar, 2012; Manish M Patel et al., 2011; Yen et al., 2014).
Herd immunity is indicated by rotavirus vaccine effectiveness greater than expected
from the level of vaccine coverage (Tate et al., 2011). Herd immunity is the population-
level effects of immunisation, where unvaccinated individuals are indirectly protected
from infection by the presence of those immune to the disease. When a sufficiently large
proportion of the population are vaccinated, infectious disease transmission is blocked as
contact between the infectious and susceptibles are reduced (Fine, 1993).
Herd immunity confers protection against rotavirus infection among the unvaccinated,
including those ineligible for vaccination, either due to age restrictions or
contraindications (Patel et al., 2012; Yen et al., 2014). A systematic review of rotavirus
vaccine impact studies found a median herd effect of 22 per cent (19 to 25 per cent)
among rotavirus specific diarrhoeal outcomes and a median herd effect of 25 per cent (11
to 30 per cent) among all-cause diarrhoeal outcomes (Pollard et al., 2015).
2.3.6 Cost of new vaccines
The rotavirus vaccines are more expensive than the traditional vaccines in the
Expanded Programme for Immunisation (EPI). The high prices of the new rotavirus
17 Impact of vaccination programme are also influenced by the countries’ immunisation system: the cold chain system, vaccine
delivery, immunisation schedule, vaccine coverage and others.
Univers
ity of
Mala
ya

26
vaccines are a barrier to their introduction into a publicly-funded, national immunisation
programme, especially in low and middle-income countries (Madsen et al., 2012).
Following the market withdrawal of the first rotavirus vaccine, RotaShield® for a
small but important risk of intussusception, the new vaccines underwent the largest safety
trials in history. Rotarix® and RotaTeq® both underwent large pre-licensure trials, with
samples size of 60,000 to 70,000 infants each, powered to detect the risk of
intussusception. The conduct of these large clinical trials made rotavirus vaccines
particularly expensive.
At the time of licensing in 2006, Rotarix® and RotaTeq® had cost about 132 times
and 90 times more than traditional EPI vaccines (Madsen et al., 2012). Using the lowest
available vaccine prices, the Médecins Sans Frontières (MSF) estimated the minimum
cost to vaccinate a single child against twelve diseases in 201418 ranged from US$ 32 to
US$ 46 (RM 101 to RM 145), or 68 times the cost of vaccinating a child against six
diseases in 200119 (Medecins Sans Frontieres, 2015).
2.3.7 Dilemma of middle-income countries
The uptake of rotavirus vaccines in middle-income countries are particularly slow
compared to low- and high-income countries. Middle-income countries, like Malaysia,
are not eligible for subsidised vaccine pricing from the Gavi, The Vaccine Alliance20 or
UNICEF (Kaddar, Schmitt, Makinen, & Milstien, 2013). In Asia, despite WHO
recommendation for rotavirus vaccine introduction, only the Philippines and of recent
Thailand have introduced the vaccine on a limited or regional basis (PATH, 2016).
Tiered-pricing mechanisms are endorsed by vaccine manufacturers and bodies like
Gavi, the Vaccine Alliance, in order to allow profits from the sale of vaccines to high-
18 Vaccines recommended by the WHO in 2014, protect against twelve diseases (tuberculosis, measles, rubella, diphtheria,
tetanus, pertussis, hepatitis B, haemophilus influenzae type b, polio, pneumococcal diseases, rotavirus and human papillomavirus) (World Health Organization, 2015b).
19 The EPI vaccines recommended by the WHO in 2001 protect against six diseases (tuberculosis, measles, diphtheria, pertussis,
and poliomyelitis) (World Health Organization, 2013c). 20 Gavi, the Vaccine Alliance supports the world’s poorest countries. National incomes determine eligibility for new vaccine
support. Countries with gross national income (GNI) per capita below than US$ 1,580, are eligible for Gavi support (Gavi, 2015).
Univers
ity of
Mala
ya
27
and middle-income countries to make vaccination affordable for low-income countries
(Medecins Sans Frontieres, 2015). High- and middle-income countries are offered higher
vaccine prices in order to subsidise vaccine prices for low-income countries
(GlaxoSmithKline, 2014). Eligible low-income countries receive Gavi, the Vaccine
Alliance support for vaccines purchased at substantially lower prices (PATH, 2015).
While high-income countries may not have difficulty funding expensive vaccines,
high vaccine prices are likely to be a barrier for new vaccine introduction in middle-
income countries. Pricing opacity or the lack of transparency in pricing of vaccines
offered to different countries, hinders governments from effectively negotiating for more
affordable prices (Medecins Sans Frontieres, 2015; E. A. S. Nelson et al., 2013; Rappuoli,
2015).
2.4 The Malaysian context
2.4.1 Country background
Malaysia is a country in South East Asia with a total land mass of 330,803 square
kilometres (Department of Statistics Malaysia, 2010a). Peninsular Malaysia in the west,
is separated from East Malaysia, located in the island of Borneo, by the South China Sea.
Peninsular Malaysia is bordered by Thailand to the north and Singapore to the south. East
Malaysia shares land borders with Brunei and Indonesia in the island of Borneo. Malaysia
is a federation of thirteen states and three federal territories.
Malaysia has a relatively young population of 29.7 million in 2013, with about 26 per
cent below 15 years of age and nine per cent aged five years and below (United Nations,
2013). The birth cohort in Malaysia in 2012 was 508,774 live births (Department of
Statistics Malaysia, 2012b). Malaysia has experienced rapid urbanisation, with 71 per
cent of the population living in urban areas in 2013. The multi-ethnic population of
Malaysia comprises of three main races, namely the Malays (67 per cent), Chinese (25
per cent) and the Indians (7 per cent) (Department of Statistics Malaysia, 2010b).
Univers
ity of
Mala
ya

28
Malaysia is an upper middle-income country with a gross national income (GNI) per
capita of current US$ 10,400 (RM 33,000) in 2013 (World Bank, 2014b). Malaysia is
ranked sixty-second on the United Nations Development Programme’s Human
Development Index21 with a life expectancy at birth of 74.7 years in 2014 (United Nations
Development Programme, 2015). The under-five mortality rate in Malaysia was
estimated at 8.5 deaths per 1,000 live births in 2013 (World Health Organization, 2013a).
2.4.2 The healthcare system in Malaysia
Malaysia has a dual public and private healthcare provider system. The main provider
of public sector healthcare is the MOH (83 per cent), with contributions by federal
agencies (eight per cent), the Ministry of Higher Education (six per cent), and others like
the Ministry of Defence and local government. The public sector is funded mainly by
general taxation, with minimal user fees. While, the private sector is funded largely by
out-of-pocket payments (79 per cent), with limited contributions from private insurance
(14 per cent) and employment benefit schemes (Ministry of Health Malaysia, 2012c).
In 2012, the total health expenditure for Malaysia was estimated at RM 42,256 million
or 4.5 per cent of the gross domestic product (GDP), of which the public sector
contribution was 53 per cent. In 2012, the MOH, Malaysia had the highest contribution
of health expenditure amounting to RM 18,593 million or 44 per cent share of total health
expenditure. This was followed by private out-of-pocket payments and private insurance
which amounted to 37 per cent and seven per cent of the total health expenditure,
respectively. In 2012, the per-capita spending on health was RM 1,432 (Ministry of
Health Malaysia, 2012c).
In 2013, the MOH had 141 hospitals providing 39,728 beds nationwide, as well as
1,039 health clinics and 1,821 community clinics. The eight non-MOH, public sector
21 The Human Development Index is a composite index measuring the average achievement of a country in three basic dimensions
of human development: long, healthy life, knowledge and a decent standard of living (http://hdr.undp.org/en)
Univers
ity of
Mala
ya

29
hospitals provided 3,709 beds. Also, there were 214 registered private hospitals with
14,033 official beds, and 6,801 licensed private clinics. The public sector provides 76 per
cent of hospital beds and 36 per cent of outpatient clinics, while the private sector
provides 24 per cent of hospital beds and 70 per cent of outpatient clinics. In 2013, there
were 46,916 medical doctors, 89,167 nurses and 12,517 assistant medical officers
nationwide, with a health provider to patient ratio of one in 633, one in 333 and one in
2,374 respectively (Ministry of Health Malaysia, 2014b).
As the major public sector healthcare provider, the MOH, Malaysia plays a social role
by providing affordable, quality healthcare for all citizens at minimal user fees. The main
thrust of the service is to provide universal health coverage (UHC), in terms of access to
affordable and quality health services for all citizens, especially the rural, poor and
marginalised. The MOH provides preventive, curative and rehabilitative services, while
also being responsible for policy-making, regulation, research and development. The
mission of the MOH is one of partnership and patient empowerment, leading to an
individual’s appreciation of the value of health and personal responsibility towards
attaining and sustaining their full health potential. (Ministry of Health Malaysia, 2008).
The MOH, Malaysia is centrally funded and administered, while service provision is
administered at the district and state levels. The MOH, Malaysia ensures access to care,
through an extensive national network of clinics and hospitals. The primary healthcare
infrastructure has a rural focus, with a referral system that connects primary care clinics,
as a gatekeeper to primary-, secondary- and tertiary-level hospital care, at district, state,
regional and general hospitals (Jaafar et al., 2013).
Primary health care facilities are provided mainly by static facilities, like health and
community clinics, and also by mobile clinics and other outreach services. The current
two-tier health system ensures that a health clinic covers a population of 15,000 to 20,000
Univers
ity of
Mala
ya

30
people, while a community clinic covers 2,000 to 4,000 people22. A comprehensive range
of services are offered at the primary health care facilities, including maternal and child
health services, outpatient or curative care, dental services, laboratory services,
communicable disease control, health promotion and others (Jaafar et al., 2013).
With economic growth and growth in personal affluence, the private sector expansion
has accelerated in Malaysia. As the private sector is financed mainly by fee-for-service,
it is driven by market forces. Healthcare services provided by the private sector are mainly
curative and diagnostic, and are located mainly in urban areas. Private healthcare in
Malaysia can be broadly divided into outpatient clinics, run by single or groups of general
practitioners, and hospitals, of varying size and sophistication (Chee & Barraclough,
2007; Jaafar et al., 2013).
2.4.3 The Malaysian national immunisation programme
The EPI programme was launched by the WHO in 1977, following the successful
eradication of small pox through a global immunisation campaign. The aims of the EPI
to reduce the morbidity and mortality of preventable infectious diseases by providing
universal access to immunisation for children worldwide, were thought to be essential to
achieving the ‘Global Strategy for Health for All by the year 2000’ (World Health
Organization, 1981). The first six diseases targeted by the EPI were polio, diphtheria,
tetanus, tuberculosis, pertussis and measles (World Health Organization, 2013c).
Currently, the WHO recommends twelve vaccines for routine immunisation of children.
These include the Bacille Calmette-Guérin (BCG), hepatitis B, polio, diphtheria-tetanus-
pertussis (DTP), Haemophilus influenzae type b (Hib), pneumococcal conjugate,
rotavirus, measles, rubella, and HPV vaccines (World Health Organization, 2015b).
22 The two-tier primary healthcare system was established in the 1970’s and consists of health and community clinics.
Health clinics serve a population of up to 20,000 people, and are staffed by medical officers, dentists, pharmacists, assistant medical
officers, and public health nurses. Services provided at health clinics include outpatient care, maternal and child health services, and
dental care. Community clinics are smaller and serve a population of up to 2,000 people. Community clinics are staffed by community nurses and midwives, and mainly provide maternal and child health services (Jaafar et al., 2013).
Univers
ity of
Mala
ya
31
In Malaysia, the national immunisation programme was first established in 1958 with
the introduction of the DTP vaccine. Subsequently, the BCG vaccine was introduced in
1961, oral poliovirus vaccine (OPV) in 1972, tetanus toxoid (TT) in 1974, measles
vaccine in 1984, rubella vaccine in 1988, Hepatitis B vaccine in 1989, and Hib and the
measles-mumps-rubella (MMR) vaccines in 2002 (Ministry of Health Malaysia, 2004;
Roesel & Banerjee, 2008).
The current Malaysian immunisation schedule includes a pentavalent combination
vaccine containing diphteria, tetanus, acellular pertussis, inactivated polio virus and
Haemophilus influenzae type b (DTaP/IPV/Hib), BCG, Hepatitis B, MMR, measles,
tetanus, Japanese encephalitis and HPV vaccines. Measles and Japanese encephalitis
vaccines are administered to high risk areas, on a regional basis (Imam, Phak, & Thomas,
2013; Ministry of Health Malaysia, 2016) (Table 2.1).
Vaccination is provided free of charge at birth at public hospitals, and during infancy
at community and health clinics, throughout the country. A school-based health
programme administered by the MOH, provides free vaccinations to pupils at public
schools. (Roesel & Banerjee, 2008)
The Malaysian national immunisation programme is well established and successful.
In 2013, national vaccine coverage was 99 per cent for BCG, 97 per cent for the third
dose of DTaP/IPV/Hib, 95 per cent for MMR and 96 per cent for Hepatitis B. The most
recent vaccine introduced was the HPV vaccine in 2010, and this is administered to
schoolgirls aged 13 years. Even though HPV vaccination is not mandatory, in 2013 the
third dose of HPV vaccine had a 94 per cent coverage in Malaysia (Ministry of Health
Malaysia, 2014b).
In Malaysia, vaccines in the national immunisation programme are publicly-funded
and compulsory. Although vaccination is available for free at government health clinics,
parents may choose to vaccinate their children at private clinics. ‘Optional’ vaccines like
Univers
ity of
Mala
ya

32
the rotavirus, pneumococcal and varicella vaccines are recommended by the MOH, but
are not publicly-funded. These ‘optional’ vaccines are available for purchase from private
clinics or hospitals.
Rotavirus vaccines are costly at private practice, with the 2014 recommended retail
price for Rotarix® and RotaTeq® being RM 122 per-dose and RM 74 per-dose,
respectively (Ministry of Health Malaysia, 2014a). Since rotavirus vaccines are
expensive, vaccine acceptance at private practice was found to be strongly influenced by
the parents’ ability to receive insurance reimbursement for vaccine payments (Kannan
Kutty, Pathmanathan, & Salleh, 2010).
Univers
ity of
Mala
ya

33
Table 2.1: National immunisation schedule, Ministry of Health, Malaysia
B*, Booster doses; B†, Booster dose given at age 4 years; *pentavalent vaccine contains DTaP, IPV and Hib; BCG, Bacille Calmette-Guerin; DTaP, Diphteria, Tetanus, acellular
pertussis; DT, Diphteria; T, Tetanus; IPV, Inactivated Polio Vaccine; Hib, Hemophilus influenzae type B; MMR, Measles, Mumps, Rubella; JE, Japanese Encephalitis; HPV,
Human Papilloma Virus.
Source: (Imam et al., 2013; Ministry of Health Malaysia, 2016)
0 1 2 3 5 6 9 10 12 18 7 13 15
BCG 1if no
scar
Hep B 1 2 3
DTaP/DT* 1 2 3 DT B* B*
IPV* 1 2 3 B* IPV
Hib* 1 2 3 B*
Measles Sabah
MMR 1 2
JE (Sarawak) 1 2 B†
HPV2
doses
Immunisation
Age (Months) Age (years)
Univers
ity of
Mala
ya

34
2.5 Summary
Rotavirus is an important cause of diarrhoea morbidity and mortality worldwide. By
age five, nearly every child worldwide will have had at least one episode of rotavirus
gastroenteritis (Parashar et al., 2003). Rotavirus diarrhoeal incidence does not reduce with
improvements in hygiene and sanitation, as evident by the similar disease incidence in
both low- and high-income countries (Tate et al., 2012; Ward et al., 2006). Rotavirus
mortality varies considerably between countries, with almost ninety per cent of all
rotavirus-related deaths occurring in low-income countries (Parashar et al., 2009).
Since 2007, two live attenuated, oral rotavirus vaccines are available internationally.
The safety and efficacy of these vaccines were proven in large clinical trials and post-
licensure studies. In 2009, the WHO’s SAGE recommended that all countries include
rotavirus vaccines into national primary immunisation schedules, as a part of
comprehensive diarrhoeal control strategies (Strategic Advisory Group of Experts, 2009;
World Health Organization, 2013d).
However, partially due to high vaccine prices, rotavirus vaccines adoption has been
particularly slow in middle-income countries, like Malaysia, with low rotavirus mortality
and without access to subsidised pricing (Madsen et al., 2012; E. A. S. Nelson et al.,
2013).
Malaysia is an upper middle-income country, with a mixed public-private healthcare
system. Mainly through a tax-financed public health system, the nation has achieved good
health status as demonstrated by a life expectancy at birth of 75 years (United Nations
Development Programme, 2015), and a low under-five mortality rate of nine deaths per
1,000 live births in 2013 (World Health Organization, 2013a). Private healthcare in
Malaysia is funded mainly by out-of-pocket payments, and with services concentrated in
urban areas. Although rotavirus vaccination are recommended by the MOH, Malaysia,
Univers
ity of
Mala
ya

35
these vaccines are ‘optional’ and are not publicly financed. Rotavirus vaccines are
available for purchase at private health facilities at retail prices.
Currently, a formal, evidence-informed decision-making platform for vaccine
introduction is lacking in Malaysia. In the next chapter, the economic theories behind the
allocation of scarce resources, specifically those relevant to the public finance of
vaccination programmes, are reviewed and discussed. Subsequently, a framework is
developed for the economic evaluation of rotavirus vaccines in Malaysia.
Univers
ity of
Mala
ya

36
CHAPTER 3: ECONOMIC EVALUATION OF VACCINES:
THEORY AND CONCEPTS
3.1 Introduction
Among all public health programmes, it is beyond doubt that vaccines are a cheap and
effective intervention for the prevention of infectious diseases (World Bank, 1993).
Nonetheless, new vaccines are expensive, increasing the need for economic evaluations
to inform policy on the public finance of vaccines. In Malaysia, an evidence-informed,
decision-making framework for vaccine introduction into the national immunisation
programme is at present lacking.
Traditional economic evaluation of vaccines emphasise principles of utilitarianism, or
maximising the health benefits received from a fixed expense (Persad, Wertheimer, &
Emanuel, 2009), failing to consider the equitable distribution of benefits and burdens in
society (Culyer & Newhouse, 2000). Of practical concern to budget holders is the
financial consequences of introducing a new programme, or its budget impact; which is
also not traditionally included in economic evaluations (Garattini & van de Vooren,
2011).
A multi-criteria approach for decision analysis is recommended for systematic and
transparent priority setting (Baltussen & Niessen, 2006). While the factors influencing
healthcare decision-making are multiple and complex, decisions are often made in an ad-
hoc manner without optimal use of evidence. For the accountable use of resources,
healthcare decision-making should be based on pre-specified and evidence-informed
criteria (Hutubessy, Henao, Namgyal, Moorthy, & Hombach, 2011).
In this chapter, a framework is proposed for the economic evaluation of rotavirus
vaccines in aid of decision-making around the vaccine introduction into the Malaysian
national immunisation programme.
Univers
ity of
Mala
ya

37
The chapter begins with Section 3.2, which examines the economic theories informing
the allocation of scarce resources, specific to vaccination programmes. This is followed
by Section 3.3, which reviews different approaches used for decision-making on vaccine
introduction. Next is Section 3.4, which discusses the criteria relevant for the evaluation
of vaccination programmes. This is followed by Section 3.5, in which a framework is
proposed for the economic evaluation of rotavirus vaccines in Malaysia. The chapter
concludes with Section 3.6, which summarises the chapter.
3.2 Economic theories informing resource allocation for vaccination
programmes
3.2.1 Argument for the public finance of vaccination programmes
Adam Smith theorised in the 1776 ‘An Inquiry into the Nature and Causes of the
Wealth of Nations’ utility (as cited in Slothuus, 2000, p. 2 to 4), that individuals act in
rational self-interest towards self-benefit, however the ‘invisible hand’ of the free market
allocates resources efficiently to maximise utility.
Adam Smith’s ‘invisible hand’ can be seen as a metaphor for the unintended social
benefits of individual actions. The idea of free market trade, channelling individual self-
interest and market competition into social benefits, is the central justification behind the
laissez-faire fundamentals of neo-classical economics23.
According to neo-classical economic theory, free markets are the most efficient
allocator of goods and services. Neo-classical economic thought was founded on the
notion of ‘consumer sovereignty’, in which an individual acts in self-interest, making
rational decisions to maximise individual utility. This idea has its origins in the market
economy, where individuals choose between tradeable goods and services (Slothuus,
2000).
23Free market economies are markets which are free to function with minimum government intervention or regulation
(protectionism, government provision of services or subsidy).
Univers
ity of
Mala
ya

38
However, health24 is not a market commodity that can be traded. Health is not
exchangeable, as trade-offs in health outcomes between the sick and healthy are
impossible (McGuire, Henderson, & Mooney, 1988). Unlike health, healthcare is a
tradeable market commodity. However, the uncertainties in healthcare make it unique
compared to other goods and services.
As described by Arrow (1963), the uncertainties involved in healthcare, among others,
make the market for healthcare imperfect. Market failure in healthcare are due to several
unique characteristics of health and healthcare: (1) uncertainties about future health and
healthcare needs, (2) information asymmetry, (3) demand for healthcare is a derived
demand for health, (4) externalities, and (5) monopoly.
Uncertainty in healthcare is the unpredictability of illness, the availability and
effectiveness of treatment, and its outcomes; making individual decisions on the
consumption of healthcare difficult. This difficulty is compounded by the fact that
consumers of healthcare will never have as much knowledge or understanding of illness
as healthcare practitioners. This information asymmetry limits the ‘agency’ of patients in
the consumption of healthcare, leaving healthcare practitioners with the unwarranted
responsibility of making healthcare decisions (Arrow, 1963).
Grossman (1972) in his seminal treatise ‘On the Concept of Health Capital and the
Demand for Health’, theorised that the demand for healthcare, unlike that of other goods
and services, is a derived demand for health. Individuals do not desire healthcare for its
own sake25, but for the utility or benefit received in improving health. The Grossman
model of healthcare demand is exemplified in the demand for therapeutic drugs, as these
interventions are consumed purposefully for the treatment or cure of disease.
24 The Constitution of the WHO defines health in a broad and positive manner: ‘Health is a state of complete physical, mental
and social well-being and not merely the absence of disease or infirmity’ (World Health Organization, 1946). This broad definition of
health goes beyond the biomedical spectrum of wellness and illness. 25 Healthcare on its own may be painful or unpleasant, and not desired for its own sake.
Univers
ity of
Mala
ya
39
However, vaccines are different from therapeutic drugs in several ways. Vaccines are
unique as the population-wide benefits of vaccination, makes them a public good
(Beutels, Scuffham, & MacIntyre, 2008). When a critical proportion of the population are
vaccinated, the entire population are protected from infection, including the unvaccinated
(Fine, 1993). Herd immunity is a positive externality, not of interest to individuals, but
which governments strive to achieve (Milstien, Batson, & Wertheimer, 2005).
In addition, vaccines are preventive interventions, administered to the healthy to
prevent future illness26. Unlike therapeutic drugs, the benefits of vaccination are not
immediately experienced by individuals. Vaccines though given to the healthy, may result
in adverse events, although this risk is usually minor. Individual perception on the benefits
and harms of vaccination, influences and likely reduces private demand for vaccines.
(Beutels et al., 2008). Therefore, unlike the market for therapeutic drugs, which depends
on an individual’s willingness-to-pay, the market for vaccines depends on the
governments’ willingness-to-pay (Milstien et al., 2005).
Vaccines are innovative healthcare products that require considerable time and money
invested towards research and development. Few multinational companies dominate the
market and these monopolies limit available products. The resulting lack of competition,
as well as procurement strategies and purchasing conditions unique to vaccines (see
Chapter 2, Subsection 2.3.7, page 26), keep vaccine prices high (Beutels et al., 2008;
Medecins Sans Frontieres, 2015; Milstien et al., 2005).
The imperfect market for healthcare and the population-wide, preventive benefits of
vaccines in particular, are a few arguments for the public finance and provision of
vaccines.
26 Vaccines provide primary prevention, which is prevention of disease before its occurrence. This is in contrast to therapeutic
drugs, which provide either (1) secondary prevention, by treating early disease and preventing disease progression or (2) tertiary
prevention, by treating established disease to prevent onset of complications.
Univers
ity of
Mala
ya

40
There are two concepts fundamental to economics: scarcity and choice. In any given
economy, there will never be enough resources to meet all the needs and demands of
people. Particularly in healthcare, resources are limited. Given that there are many
competing programmes for investment, choices have to be made. Two broad goals of
resource allocation are to ensure efficiency (to maximise health benefits from limited
resources) and equity (to ensure fairness in distribution of the benefits and burdens of
healthcare) (McGuire et al., 1988; Murray & Frenk, 2000; Musgrove, 1999).
3.2.2 Efficiency
Vaccines offer a direct protective effect against infection when given to individuals,
but more importantly, when administered universally, vaccines have an additional social
benefit of providing herd immunity (Beutels et al., 2008). Due to the population-wide
benefits of vaccination, public policy for vaccination are often rooted in utilitarian
philosophy.
Utilitarianism is a normative ethical philosophy based on the moral imperative that the
best possible action is the action that maximises utility27. Utilitarianism emerged as a
concept in the 18th century, with the views of Jeremy Benthem and John Stuart Mill
(Driver, 2014). Utilitarianism judges policy by its consequences, which in the context of
healthcare is health maximisation: ‘the greatest good for the greatest number’ (Persad et
al., 2009).
A broad definition of efficiency is the allocation of scarce resources in such a way that
maximises returns of its aims (Knapp, 1984). Efficiency is a measure determining the
‘value for money’ of healthcare interventions. Three concepts commonly discussed with
efficiency are technical, productive and allocative efficiency. Technical efficiency is
determined by physical production, and is achieved when production is organised to
minimise the inputs required to produce a given output. Productive efficiency, or also
27 Utility is an economic term referring to the satisfaction or welfare experienced by an individual as a consequence of consuming
a good or service (http://www.investopedia.com/terms/u/utility.asp).
Univers
ity of
Mala
ya

41
called cost-effectiveness efficiency, allows for direct comparison between alternative
interventions. Productive efficiency is determined by both physical production and input
prices, and is achieved when production is organised to minimise the cost of producing a
given output. While both technical and productive efficiency is concerned with supply-
side efficiency, allocative efficiency incorporates the demand-side. Allocative efficiency
is concerned with the way resources are produced and distributed within a society28.
(Culyer & Newhouse, 2000; Palmer & Torgerson, 1999).
In health economics, the optimum allocation of resources originates within the
framework of welfare economics29, which is rooted in the principles of utilitarianism.
Welfare economics considers the well-being of all individuals in society as a whole. A
main tenet of welfare economics is utility maximisation, in which rational individuals
make choices to maximise their utilities. The resultant overall welfare of society is the
sum total of individual utilities (Raftery, 1998). Within this framework, decisions made
on public programmes have consequences for society as a whole.
Welfare economics make use of Pareto value judgements in resource allocation. Pareto
optimum is a position in which it is impossible to allocate resources to improve an
individual’s welfare without impairing the welfare of at least one other person. Pareto
efficiency is the ideal position in which a programme benefits at least one person without
causing anyone to be worse off. Welfare economics references free market allocation of
resources as Pareto optimal, meaning achieving allocative efficiency (Culyer &
Newhouse, 2000, pp. 60-62).
Healthcare is unique among commodities in its reliance on non-market allocation.
Evaluation of healthcare interventions, policies and programmes in terms of efficiency is
necessary to inform on resource allocation decisions. Two different evaluation methods
28 Within the framework of welfare economics, allocative efficiency is consistent with achieving Pareto optimal state, in which it
is not possible to make at least one person better-off without making anyone worse-off (Culyer & Newhouse, 2000) 29 Four tenets of neo-classical welfare economics are utility maximisation, consumer sovereignty, consequentialism and welfarism
(Culyer & Newhouse, 2000).
Univers
ity of
Mala
ya

42
are derived from two main normative economic frameworks: neo-classical welfare
economics and extra-welfarism (Culyer & Newhouse, 2000).
The extra-welfarist approach is an adaptation of neo-classical welfare economics, and
is more commonly used among health economists. While welfare economics aims to
maximise utility, the extra-welfarism aims to maximise health, which is the outcome
central to health policy. Welfare economic theory provides the foundation for cost-benefit
analysis, while the extra-welfarist approach is the basis for cost-effectiveness or cost-
utility analysis30. (Culyer & Newhouse, 2000, p. 96; Raftery, 1998).
The concept of opportunity costs is essential to health economics. As healthcare
resources are scarce as compared to needs, the investment in one programme implies
disinvestment in another. The opportunity costs or the ‘shadow price’ of investing in a
particular programme is best measured by the health benefits foregone from the next best
alternative programme displaced (Culyer & Newhouse, 2000, p. 97 to 98; Palmer &
Raftery, 1999).
Welfare economics, places importance in ‘consumer sovereignty’ or the individual’s
valuation of their own utility. This is the theoretical basis for the money-metric
measurement of benefits, or the consumer’s ‘willingness-to-pay’ for improvement in
health status and ‘willingness-to-accept’ for loss of health. Some of the limitations of this
approach are the aforementioned uncertainties and imperfect information in health and
healthcare, curbing individual agency in healthcare (Culyer & Newhouse, 2000, p. 60 to
62).
The human capital approach is a rival approach for the valuation of human life within
the welfare economic framework. According to the human capital approach, the economic
value of additional years of life is the value of economic production associated with those
30 Cost-benefit analysis compares both costs and benefits in monetary terms. Due to the controversies in valuing human life in
monetary terms, the extra-welfarist approach values outcomes in non-monetary terms. In cost-effectiveness analysis and cost-utility analysis, costs are measured in monetary units but outcomes are measured in non-monetary, health-related terms, like natural units of
outcome for cost-effectiveness analysis and in quality-adjusted life years (QALYs) for cost-utility analysis (Culyer & Newhouse,
2000, p. 96; Raftery, 1998).
Univers
ity of
Mala
ya
43
years. This economic value can be translated to additional earnings or income for extra
life gained. The main controversy surrounding the valuation of health gain based on
economic production, is the bias towards those working in the market sector (wage
earners), as compared to those in the non-market sector (non-wage earners) or those not
part of the work force (elderly or children) (Culyer & Newhouse, 2000, p. 98 to 99).
Utilitarian principles of health policy aim to maximise average population health. A
critique of utilitarianism in public policy, is that it sacrifices the needs of the individual
for the betterment of the collective. John Rawls criticised of the aggregation of utility
pursued by utilitarianism as ignoring the interests of individuals: "Utilitarianism does not
take seriously the distinction between persons" (Rawls, 1971, p. 21). Amartya Sen in his
1973 treatise ‘On Economic Inequality’ (as cited in Pereira, 1993, p. 17), famously
criticised utilitarian principles for not considering the interpersonal distribution of sum
benefits: “... maximising the sum of individual utilities is supremely unconcerned with
the interpersonal distribution of that sum”.
Aggregate measures of societal benefits, such as quality-adjusted life years (QALYs),
are concerned with net improvements, masking variations in the distribution of benefits.
Thus, using results of a cost-effectiveness analysis alone to decide resource allocation
ignores other ethical concerns, namely of distributive justice or ‘justice as fairness’
(Dawson, 2011; Field & Caplan, 2012).
3.2.3 Equity
Equity is synonymous with fairness, which is grounded in the ethical principle of
distributive justice. According to Whitehead (1992), equity has moral and ethical
dimensions. Inequities in health are differences which are not only unnecessary and
avoidable, but also deemed unfair and unjust. Equity in health implies that everyone
should have a fair opportunity to achieve their full potential in health, and no one should
be unfairly disadvantaged.
Univers
ity of
Mala
ya

44
Braveman and Gruskin (2003) defined equity in health as the absence of systematic
disparities in health, or its social determinants31, between more or less advantaged social
groups. The implication being that differences in health status, if due to disparities in
wealth or social conditions, is unfair and unjust.
Although equitable distribution of health and healthcare resources are acknowledged
as a moral imperative, there is little consensus on the theories and principles for just
distribution (Culyer, 2001). Veatch in his 1981 publication ‘A Theory of Medical Ethics’
(as cited in McGuire et al., 1988, p. 46), identified four theories of distributive justice: (1)
the entitlement theory (individuals are entitled to what they acquired justly)32, (2)
utilitarianism (maximising total benefits), (3) maximin (favouring the worst-off)33 and
egality (treating people equally). These theories of distributive justice are normative, and
the choice of theory to inform health policy is based on societal norms and value
judgements.
Most ideas for the fair allocation of available resources are based on egalitarian
principles (Culyer & Newhouse, 2000). Egalitarian views of distributive justice calls for
equality, either in individual net benefits; or the distribution of resources. While equality
in health seems like a faultless ideal, this is an unrealistic goal for health systems. As
described by Grossman (1972), healthcare is only one of many determinants in the
production of health34. Unequal health status may be due to unavoidable physical or other
differences, and is consequently not unfair (Whitehead, 1992).
31 As explained by Sir Michael Marmot, social determinants of health are the conditions in which an individual is born, grows,
lives, works and ages and the wider social, political and economic systems that shape these conditions (Marmot, Friel, Bell, Houweling, & Taylor, 2008).
32 Robert Nozick in his 1974 treatise ‘Anarchy, State and Utopia’ (as cited in Pereira, 1993, p. 13 to 14),theorised that an individual
is entitled to possess private property that is justly acquired, either through inheritance or earnings. Within this libertarian view of justice, subsidisation or redistribution based on needs would be an injustice. Free market determination of the price of healthcare,
would mean that access to care is dependent on ability to pay, adversely impacting the poor. 33 According to the John Rawls’s Maximin principle, when distributing social goods, a just society seeks to maximise the welfare
of the least well-off person in that society. Rawls hypothesised that behind the ‘veil of ignorance’, individuals opt for a much fairer
society, with extensive freedom and fair opportunity, without extremes of unfairness in terms of wealth or social positioning (Pereira,
1993, p. 18 to 19). 34 According to Grossman (1972), we inherit an initial stock of health, which depreciates with age, and can be increased through
investment. Investment in health is made not just with the consumption of healthcare, but also through consumption of leisure activities
and other goods and services.
Univers
ity of
Mala
ya
45
The philosopher Ronald Dworkin (1981) argued that egalitarian principles, calls for
equality in distribution of resources irrespective of needs, and not towards the end point
of equality in welfare (as cited in Pereira, 1993, p. 10 to 11). In the case of healthcare,
egalitarian views of distributive justice implies equal distribution of healthcare resources
and not equal health status.
Equity in healthcare can be approached from two aspects, fairness in the distribution
of benefits (health or healthcare) and fairness in financing of healthcare (distribution of
the costs of healthcare). Of relevance in this thesis is the fairness in financing, or
distribution of healthcare costs.
There are distinct differences in the concepts of equity and equality, in relation to
fairness. While equity is synonymous with fairness, equality implies equal distribution of
benefits or costs, which is not necessarily fair. In terms of healthcare financing, equal
healthcare payments across all income groups may be unfair. Out-of-pocket payments, or
payments for healthcare made at the point of access of care, have different welfare
implications for the rich and the poor. The rich have better ability to cope with unexpected
expenses, as they are more likely to access coping mechanisms like savings and loans
(Alam & Mahal, 2014; Kruk, Goldmann, & Galea, 2009). Healthcare payments may deter
the poor from seeking needed care, worsening inequities in the access of care.
Distributive justice, according to Aristotle is in giving ‘each his due’. Within this
Aristotelian understanding, equity can be distinguished into two groups; that of horizontal
and vertical equity. In the context of financial contribution to healthcare, horizontal equity
relates to ‘equal contributions from households having an equal ability to pay’, while
vertical equity means ‘higher contributions from households with a higher ability to pay’
(Culyer, 2001). Fairness in financing of healthcare is concerned with vertical equity. The
emphasis on households of different income levels making payments according to ability
Univers
ity of
Mala
ya

46
to pay, is part of the concept of ‘progressivity’ in healthcare financing35 (Culyer &
Newhouse, 2000).
3.3 Evidence based framework for vaccine introduction
Economic evaluations are routinely used in many countries, to inform decision-making
on vaccine introduction. Commonly, cost-effectiveness is the sole criteria used for
decision-making (ISPOR, 2015). In a consensus statement from the European Vaccine
Economics Community, experts attested to the usefulness of economic evaluations with
a broader focus, including assessment of affordability and equity. The experts examined
three approaches for decision-making on vaccine introduction. These were the pure
threshold approach (in which cost-effectiveness is the deciding criteria), the multi-criteria
decision analysis (which incorporates cost-effectiveness with multiple weighted criteria)
and the use of informal judgement (multiple criteria including cost-effectiveness
considered through the lens of value judgements) (Ultsch et al., 2015).
A cost-effectiveness is a relative measure, usually with thresholds set as a reference
measure to inform allocation decisions (Eichler et al., 2004). Several countries like the
United Kingdom, Australia, Thailand and Canada have defined cost-effectiveness
thresholds. Other countries, like Malaysia, have not fixed a formal cost-effectiveness
threshold for decision-making (ISPOR, 2015). Cost-effectiveness thresholds make
decision rules straightforward and transparent36. However, the use of threshold measures
does not consider other relevant criteria like disease severity, burden, affordability or
equity.
Priority setting in healthcare, particularly for vaccines requires multiple criteria.
Erickson, De Wals, and Farand (2005) proposed a multi-criteria analytical framework for
35 Progressivity in healthcare financing implies that the richer person contributes a greater proportion of income towards healthcare
payments. Where else in a regressive health financing system, the poor pay proportionately more for healthcare than the rich. A
proportional system implies that healthcare payments account for the same proportion of income for everyone, irrespective of income. 36 Efficiency is expressed by the incremental cost-effectiveness ratio (ICER), which compares the differences in costs with health
gains between alternative interventions. An intervention may be considered cost-effective if the ICER falls below a defined cost-
effectiveness threshold.
Univers
ity of
Mala
ya
47
systematic evaluation of new vaccination programmes in Canada. The comprehensive list
of criteria proposed included disease characteristics and burden, vaccine characteristics,
immunisation strategies, social and economic costs and benefits, feasibility, acceptability,
and the legal, political and ethical considerations.
The use of multiple criteria for decision-making is complex and requires weightage of
each criterion37 (Ultsch et al., 2015). Kimman et al. (2006) suggested a checklist-based
approach for assessing all necessary evidence for vaccine introduction. The National
Immunisation Programme Review Committee of the Health Council of the Netherlands
proposed a hierarchal decision-making framework around introduction of a publicly-
funded vaccine. This proposed framework is hierarchical because an affirmative answer
is assumed for each criteria before moving to the next criteria (Houweling et al., 2010).
Piso and Wild (2009) proposed a step-wise approach, allowing a sequential assessment
of relevant criteria towards vaccine introduction.
Despite formalising decision-making on vaccine introduction into rational
frameworks, most agree that prioritisation should be rooted in social value judgements.
Social values and norms however are not quantifiable, and require informal judgement.
However, considering social values judgements, encourages public acceptance of
vaccination programmes, while ensuring that the best possible protection is given to the
whole population (Field & Caplan, 2012; Houweling et al., 2010; Kimman et al., 2006).
3.4 Criteria for the evaluation of vaccination programmes
In this section, some of the criteria relevant for decision-making on rotavirus vaccine
introduction into national immunisation programmes are considered.
37 For example, providing equitable services may not be efficient. Ensuring that services target the poor, rural communities, may
prove to be expensive and not an efficient use of resources.
Univers
ity of
Mala
ya

48
3.4.1 Health and economic burden
The first step in priority setting towards vaccine introduction, is to establish the
importance of the infectious disease and the need for intervention. In the past, vaccines
have targeted diseases that have resulted in high mortality or severe disability, for
example small-pox, polio and diphtheria. New vaccines target childhood illness like
chicken pox or rotavirus gastroenteritis, that are less deadly but are nevertheless
significant, in terms of healthcare utilisation and loss of caregiver productivity
(Houweling et al., 2010).
It is important to have accurate estimates on the national health and economic burden
of rotavirus, for disease prioritisation. The seriousness of the health burden can be
quantified in terms of deaths and illness incidence according to healthcare utilisation. The
economic burden includes direct and indirect costs from the healthcare provider and
societal perspective. Since public health measures like improvement in water, hygiene
and sanitation does not reduce rotavirus transmission, an effective rotavirus vaccine is an
important preventive measure. Estimation of the pre-vaccination burden will indicate the
potential burden averted by implementing the universal vaccination programme.
3.4.2 Safety, efficacy and quality
Vaccine safety is a measure of the ability of vaccines to perform without untoward
adverse effects. The concept of safety in vaccination has long been upheld with stringent
standards. The ethical principle considered in vaccination is the Latin caveat - ‘primum
noncere’ or ‘first, do no harm’. This fundamental principle of non-maleficence, is taught
to all healthcare professionals and is part of the Hippocratic Oath. In accordance to the
principle of non-maleficence, the ethical principle of beneficence is a positive
requirement to contribute towards the welfare of others, while avoiding causing harm
(Field & Caplan, 2012).
Univers
ity of
Mala
ya

49
Vaccines are biological agents given to healthy individuals, most of whom are
children, to provoke a protective immune response against illness. Standards of vaccine
safety are therefore rigorous and much higher than those that need to be met by
manufacturers of therapeutic medicines. Any potential adverse events associated with
vaccination should be weighed against and found not to diminish the public health
benefits of vaccination (Dawson, 2011; Field & Caplan, 2012; Houweling et al., 2010).
As discussed in Chapter 2 (Subsection 2.3.2, page 20), the safety, efficacy and quality
of rotavirus vaccines were proven in large pre-licensure clinical trials and post-licensure
surveillance studies.
3.4.3 Cost-effectiveness
Safety, efficacy and quality are the three traditional hurdles pharmaceutical companies
have to overcome before the licensing of drugs or vaccines. Cost-effectiveness can now
be considered the fourth hurdle (Erickson et al., 2005; Houweling et al., 2010).
Decision-makers increasingly rely on cost-effectiveness analysis to inform on the
efficient allocation of scarce healthcare resources. A cost-effectiveness analysis in an
economic evaluation is designed to assess value for money. Efficiency is expressed by
the incremental cost-effectiveness ratio (ICER), which compares the differences in costs
with health gains between alternative interventions.
The WHO recommends that cost-effectiveness be considered as a criteria in the
evaluation of new vaccine introduction into national immunisation programmes
(Hutubessy et al., 2011; World Health Organization, 2005b, 2014a). However, cost-
effectiveness should not be the sole criteria in medical decision-making. Cost-
effectiveness informs on productive efficiency, which is choosing the option that
produces the most benefit for the least cost. A cost-effectiveness analysis does not inform
on affordability or equity. The rotavirus vaccine may be found to be cost effective, but
the high costs entailed may make public finance of vaccination programmes unaffordable.
Univers
ity of
Mala
ya

50
The primary goal of health systems is health maximisation, or reducing the morbidity
and mortality from disease. Decisions made purely on the basis of a cost-effectiveness,
run the risk of choosing vaccines on the basis of costs and not prioritising public health
interventions that effectively reduce human suffering, death, or disability (Black, 2013).
3.4.4 Affordability
New vaccines, particularly rotavirus vaccines, are expensive compared to traditional
vaccines in the EPI (Madsen et al., 2012).
Policy makers need to relate the financial costs with the national health budget, to
better anticipate and plan for future expenses. A budget impact analysis is complementary
to cost-effectiveness analysis, in providing additional information on the allocation of
limited healthcare resources. The budget impact analysis is conducted to inform the
budget holder on the affordability of investment in vaccination programmes and the
ability to remain within the annual budget.
Costs in a budget impact analysis are financial costs to the budget holder, while a cost-
effectiveness analysis considers economic costs from a societal perspective. While
reduction in productivity loss are of interest to society, they are of little consequence to
budget holders, as productivity savings from vaccination are not passed on to the health
service (Garattini & van de Vooren, 2011; Trueman, Drummond, & Hutton, 2001).
3.4.5 Equity and financial risk protection
Vaccines have long been regarded as cheap and effective interventions towards
improving health (World Bank, 1993). However traditional evaluations of vaccines focus
on health gains and savings to the health system, underestimating the broader benefits of
vaccination, which includes improving equity and providing financial risk protection (T.
Bärnighausen et al., 2014; Bloom et al., 2005; Deogaonkar, Hutubessy, van der Putten,
Evers, & Jit, 2012).
Univers
ity of
Mala
ya

51
In this thesis, it is proposed that economic evaluations of vaccines move away from
the narrow perspective of health systems and explicitly consider the perspective of
households, with equity and financial risk protection as additional criteria towards
vaccine introduction
Towards achieving universal health coverage (UHC), health systems are obliged to
provide access to healthcare services, while ensuring equitable distribution of benefits
and burdens in society, and financial risk protection against the impoverishing impact of
healthcare payments (World Health Organization, 2005a).
Reliance on out-of-pocket (OOP) healthcare payments, or direct payments for
healthcare at the point of receipt of care, results in financial hardship among millions of
people worldwide (Kruk et al., 2009; Ke Xu et al., 2007). Unanticipated illness-related
expenditure above a certain threshold of household income may have an adverse impact
on household living standards, and may be considered catastrophic (O'Donnell &
Wagstaff, 2008; Ke Xu et al., 2010). Illness-related payments may force households into
poverty or deepen the extent of poverty (Van Doorslaer et al., 2006).
Financial risk protection, an essential component in achieving UHC, can be defined as
access to quality healthcare as needed without incurring financial hardship (Saksena et
al., 2014). Governments are responsible to provide financial risk protection so that people
are not deterred from utilising healthcare services, nor are they at risk of financial
catastrophe or medical impoverishment (World Health Organization, 2010). Universal
vaccination as an effective preventive measure against infectious disease may play a role
in enhancing UHC, by averting illness and illness-related costs, thus providing financial
risk protection to all.
Univers
ity of
Mala
ya

52
3.4.6 Other considerations
Traditional economic evaluations fail to fully consider practical aspects of programme
implementation, including the political, legal, institutional and social context in which
decision-making takes place (Hauck, Smith, & Goddard, 2004).
Other considerations for implementation of vaccination programmes include the
urgent priority of the disease and the demand for vaccines, either from the public or
clinicians. This is particularly relevant during times of infectious disease outbreak, when
vaccination may be the only reliable measure for disease prevention.
Public acceptance of vaccines and the opinion of politicians, media and special interest
groups, influence decision-making and programme implementation. Social value
judgements and ethics are important when introducing vaccination programmes,
particularly to safeguard public interests and to ensure policy acceptance.
Although, these non-economic aspects may be considered by policy makers in view of
vaccine introduction, assessing these factors is beyond the scope of this thesis.
3.5 The conceptual framework for economic evaluation of rotavirus
vaccination in Malaysia
In this thesis, a conceptual framework is proposed for the economic evaluation of
rotavirus vaccines in Malaysia. This framework considers the economic theories behind
the allocation of scarce resources, and the economic criteria relevant to inform policy on
public finance of rotavirus vaccines. While the conceptual framework proposed in this
thesis was developed specifically to discuss the public finance of rotavirus vaccines in
Malaysia, it may be used to inform decision-making on other vaccines and in different
settings.
In the case of rotavirus vaccines, there are two available vaccines that have been
proven safe, efficacious and of quality. Large phase III clinical trials conducted in all
regions of the world have proven the safety and efficacy of rotavirus vaccines (Ruiz-
Univers
ity of
Mala
ya
53
Palacios et al., 2006; Vesikari et al., 2006). These trials informed the WHO SAGE
recommendations for inclusion of rotavirus vaccines into all national immunisation
programmes (Strategic Advisory Group of Experts, 2009; World Health Organization,
2013d). However, in view of the high cost of rotavirus vaccines, economic evidences are
needed to inform decision-making around vaccine introduction into national
immunisation programmes.
In this thesis, the health and economic burden of rotavirus gastroenteritis are estimated,
followed by the assessment of cost-effectiveness, affordability and the distributional
benefits of rotavirus vaccines in providing financial risk protection to households in
Malaysia. Rather than relying on a single criteria alone, information on disease burden,
cost-effectiveness and affordability of the vaccine, distributional benefits of vaccines in
providing financial risk protection and other criteria are gathered to collectively inform
decision-making. The economic arguments are then discussed with consideration to the
underlying societal values and norms in Malaysia. (Figure 3.1)
Univers
ity of
Mala
ya
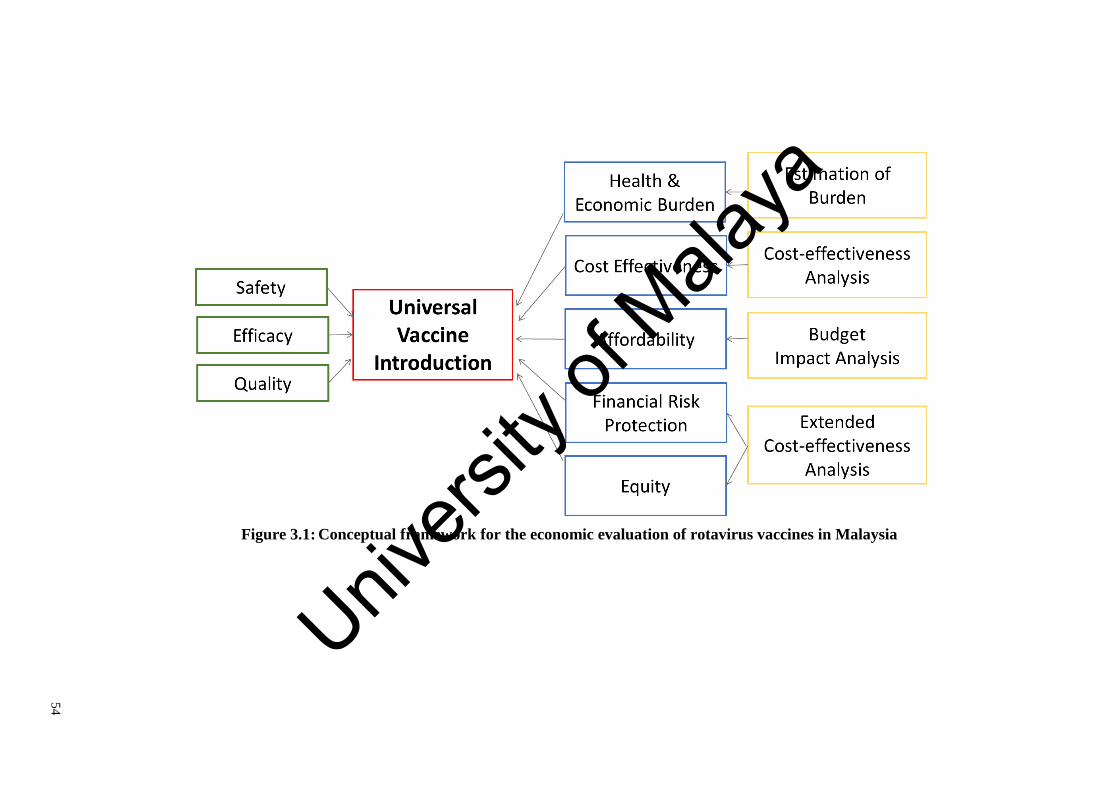
54
Figure 3.1: Conceptual framework for the economic evaluation of rotavirus vaccines in Malaysia
Univers
ity of
Mala
ya
55
3.6 Summary
Vaccines are biological agents given to the healthy to provide protective immunity
against infection. The nature of vaccines as a public good and the resultant market failure
for vaccines, necessitate government intervention in the public finance and provision of
vaccines.
Health systems aim to maximise of population health within the constraints of scarce
resources. The efficient allocation of resources in vaccination is often evaluated using
cost-effectiveness analysis. Although cost-effectiveness is often the sole economic
criteria used, there are multiple criteria relevant to prioritisation in universal vaccine
introduction, including equity, affordability and financial risk protection. Fairness in the
financing of healthcare has moral and ethical dimensions important to society. While the
affordability of a programme is of practical concern to budget holders, governments are
responsible to ensure that all people have access to quality health services as needed,
without the financial consequences of having to pay for healthcare (World Health
Organization, 2010).
In this chapter, a conceptual framework was developed for the economic evaluation
of rotavirus vaccines in Malaysia. Using this framework, the burden of rotavirus is
estimated, together with the evaluation of cost-effectiveness, affordability and the non-
health benefits of rotavirus vaccines in providing financial risk protection and enhancing
equity in Malaysia. This framework is proposed for use for evidence-informed decision-
making on the introduction of universal rotavirus vaccines in Malaysia.
In the next chapter, the health and economic burden of rotavirus is comprehensively
estimated, with due consideration given to the complexity of the mixed public-private
healthcare system in Malaysia.
Univers
ity of
Mala
ya

56
THE HIDDEN HEALTH AND ECONOMIC BURDEN OF
ROTAVIRUS GASTROENTERITIS IN MALAYSIA:
AN ESTIMATION USING MULTIPLE DATA SOURCES
4.1 Introduction
Worldwide, rotavirus gastroenteritis causes substantial mortality and morbidity. The
WHO recommends two rotavirus vaccines for universal vaccination in all countries
(World Health Organization, 2007). However, rotavirus vaccines are expensive,
particularly for middle-income countries like Malaysia, which are not eligible for multi-
national pooled purchasing schemes, such as those initiated by Gavi, the Vaccine Alliance
(E. A. S. Nelson et al., 2013). Consequently, rotavirus vaccine introductions in middle-
income countries have lagged behind those of high- and low-income countries (Dykstra,
Glassman, Kenny, & Sandefur, 2015; PATH, 2016).
The problem is exacerbated by a poor understanding of the true burden of rotavirus
gastroenteritis in middle-income countries. In these settings, diarrhoeal mortality is low
but the burden of cases presenting to healthcare is potentially high. However, the
healthcare burden is difficult to estimate in countries like Malaysia, as much of healthcare
is supplied by the private sector38 (Jaafar et al., 2013). Previous estimations of rotavirus
burden in Malaysia have focused on diarrhoea treated at public facilities; inadequately
considering privately-treated episodes and not considering home-treated episodes (Chai
& Lee, 2009; Hsu et al., 2005; Lee et al., 2007). This substantially underestimates the
overall burden of rotavirus in the country. Hence, a comprehensive estimate of disease
burden is essential for decision-making around the introduction of a new vaccine, both in
Malaysia and in other countries.
38 Malaysia has a mixed public-private healthcare system, with the private sector providing 24 per cent of hospital beds and 70
per cent of outpatient clinics in the country (Ministry of Health Malaysia, 2014b).
Univers
ity of
Mala
ya
57
This chapter aims to estimate the health and economic burden of rotavirus
gastroenteritis in Malaysia. This includes the estimation of rotavirus deaths,
hospitalisations and outpatient visits to public and private facilities, home-treated
episodes and the economic burden of these events to the healthcare provider and society.
The chapter begins with Section 4.2, which describes the data sources, analytical
methods and assumptions used in the estimation of the health and economic burden of
rotavirus in Malaysia. Next, Section 4.3 presents the results of this estimation. This is
followed by Section 4.4, which discusses study findings, limitations and its policy
relevance. The chapter ends with Section 4.5, which provides the chapter conclusions.
4.2 Materials and methods
4.2.1 Study overview
In Malaysia, the diagnosis of rotavirus is not required for the management of
diarrhoeal illness or the certification of diarrhoeal death. As such the burden of rotavirus
gastroenteritis is not immediately clear, and must be estimated from the incidence of acute
gastroenteritis in Malaysia.
To estimate rotavirus incidence, the incidence of acute gastroenteritis is multiplied
with the proportion of gastroenteritis episodes attributable to rotavirus. This method for
estimating the incidence of rotavirus gastroenteritis was described by Parashar et al.
(2003) in the 2003 estimation of global rotavirus burden, and is widely used
internationally (World Health Organization, 2002a). (Figure 4.1)
In this chapter, incidence of rotavirus deaths, episodes seeking formal care, which
includes hospitalisations and outpatient visits to both public and private facilities, and
episodes not seeking formal care or home-treated episodes, were estimated for Malaysia.
Subsection 4.2.2 details the data sources and methods used for estimating rotavirus health
burden in Malaysia.
Univers
ity of
Mala
ya

58
The economic burden of rotavirus gastroenteritis was estimated from the healthcare
provider and societal perspectives. From the healthcare provider’s perspective, direct
medical costs were estimated for hospitalisations and outpatient clinic visits. Costs from
the societal perspective included direct medical, direct non-medical and indirect costs,
for rotavirus deaths, episodes seeking formal care, as well as episodes treated at home.
Subsection 4.2.3 details the data sources and analysis used for estimating the economic
burden of rotavirus gastroenteritis in Malaysia.
The base year for analysis was 2013. All costs were inflated to 2013 Ringgit Malaysia
(RM) using GDP deflators (Department of Statistics Malaysia, 2012a, 2013a, 2013b).
The World Bank exchange rate for 2013 of US$ 1 to RM 3.15 was used in this analysis
(World Bank, 2014a).
Figure 4.1 shows the conceptual framework for the estimation of the health and
economic burden of rotavirus gastroenteritis in Malaysia.
Figure 4.1: Conceptual framework for estimating the health and economic
burden of rotavirus gastroenteritis in Malaysia
Univers
ity of
Mala
ya

59
4.2.2 Estimating the health burden of rotavirus gastroenteritis
4.2.2.1 Hospitalisations
(a) Data source
Since 1999, electronic records on hospital discharges from public hospitals and more
recently from private hospitals are captured on an annual basis in a national database, by
the Centre for Health Informatics, at the MOH, Malaysia. Public hospital discharges are
collected from MOH hospitals only. Other public hospitals, like academic teaching
hospitals and army hospitals, do not report hospital discharges to the national database.
Although private hospitals are required to provide annual hospital discharges to the
MOH, Malaysia as a condition for licensing, reporting is not enforced. Thus, at present
only about half of licensed private hospitals provide annual returns to MOH. However,
data reporting by private hospitals has improved substantially within the last five years,
due to sustained efforts by the MOH. (Table 4.1)
(b) Data analysis
Data on children under-five years discharged from public and private hospitals in
Malaysia, with the International Classification of Disease, tenth revision (ICD-10)
aetiological codes for diarrhoea, were extracted from the national database for the years
2008 to 201339. The ICD-10 codes for diarrhoeal illness are: undetermined aetiology
[diarrhoea of presumed infectious aetiology (A09) and diarrhoea of presumed non-
infectious aetiology (K52.9)]; bacterial (A00 and A02 - A05.9, but excluding A02.2);
parasitic (A06.0 - A07.9, but excluding A06.4 - A06.7); viral (A08.0 – A08.5).
The data collection mechanism for public hospital discharges migrated from individual
submissions to a web-based submission system in 2012, resulting in the post-2012 data
being incomplete. Hence, 2011 was chosen as the reference year for public hospital
39 Data for these years were the most recent available.
Univers
ity of
Mala
ya

60
discharges. For private hospital discharges, the most recent available data from 2013 was
used for this study40.
To estimate discharges from all facilities in Malaysia, including those that were not
reported to the national database, reported hospital discharges were multiplied with the
number of beds from existing public and private healthcare facilities nationwide, and
divided by the number beds of facilities reporting hospital discharges. By adjusting for
non-response from hospitals using hospital beds, both the number and size of all hospitals
in Malaysia were considered. The number of public and private hospitals, and operational
beds in Malaysia was obtained from the Centre for Health Informatics at MOH, Malaysia.
Table 4.1 details diarrhoeal discharges for children under-five years reported to the
MOH, Malaysia from public and private hospitals in Malaysia, over a for a six year period
from 2008 to 2013.
Table 4.2 details the estimation of total diarrhoeal hospitalisations for children under-
five years to public and private hospitals in Malaysia.
40 The data collection mechanism for private hospitals remain unchanged, as a hard-copy or paper-based submissions.
Univers
ity of
Mala
ya

61
Table 4.1: Annual diarrhoeal discharges for children under-five years in Malaysia, reported from 2008 to 2013
Year
2008 2009 2010 2011 2012 2013
Public hospitals
All discharges a 326,621 340,640 351,316 365,931 312,743 300,827
Diarrhoeal discharges b
(%)
21,851
(6.7%)
24,545
(7.2%)
23,828
(6.8%)
23,450
(6.4%)
17,887
(5.7%)
19,259
(6.4%)
Private hospitals
All discharges a 1,360 1,620 130,769 138,783 151,754 153,717
Diarrhoeal discharges b
(%)
137
(10.1%)
16
(1.0%)
14,546
(11.1%)
17,278
(12.4%)
20,232
(13.3%)
15,886
(10.3%)
Note:
a Total hospital discharges for children under-five years reported annually to a national database at the Centre of Health Informatics, Ministry of Health, Malaysia.
b Diarrhoeal discharges for children under-five years was extracted from the database using ICD-10 diagnostic codes. [Subsection 4.2.2.1(b), page 59]
Univers
ity of
Mala
ya

62
Table 4.2: Estimation of total diarrhoeal hospitalisations for children under-five years in Malaysia
Row Item Source Public hospitals Private hospitals
(1) Diarrheal discharges reported MOH a 23,450 15,886
(2) No. of reporting hospitals MOH b 96 107
(3) No. of hospital beds in reporting hospitals MOH b 18,694 12,572
(4) Total hospitals in Malaysia MOH c 142 209
(5) Total hospital beds in Malaysia MOH c 41,639 14,033
(6) Total diarrhoeal hospitalisations in Malaysia (1) x (5)/ (3) d 52,233 17,732
Note: MOH, Ministry of Health, Malaysia.
a Discharges reported to the national database at the Centre of Health Informatics, Ministry of Health, Malaysia. Diarrhoeal discharges at public hospitals for 2011, and at private
hospitals for 2013, were used for the estimation. [Subsection 4.2.2.1(b), page 59 ];
b Number hospitals reporting discharges to the Centre of Health Informatics, Ministry of Health, Malaysia and their operational beds;
c Total number of hospitals and operational beds in Malaysia, was obtained from the Centre of Health Informatics, Ministry of Health, Malaysia;
d Reported diarrhoeal discharges were adjusted to account for all hospitals including those not reporting discharges to MOH, Malaysia. Reported hospital discharges were multiplied
with the number of beds from all existing hospitals nationwide, and divided by the number beds of hospitals reporting discharges [Subsection 4.2.2.1(b), page 59 ]. Univers
ity of
Mala
ya

63
4.2.2.2 Outpatient visits
(a) Data source
i Data on outpatient visits from the Ministry of Health, Malaysia
Aggregated data on outpatient visits to MOH facilities is compiled annually by the
Centre of Health Informatics at MOH, Malaysia. This information is routinely collected
and tallied at each MOH facility and then reported monthly in an aggregated form to
district and state health departments. Monthly returns on outpatient visits are entered into
PER-PL206 return formats and reported electronically in an aggregated form, while the
original patient-level data remains at each local facility (Ministry of Health Malaysia,
2012d). As such, the individual patient data were not available for analysis in this thesis.
The data on outpatient visits was aggregated by age group, facility type, and diagnostic
groups. Data was stratified by age groups: under-ten years, ten to 19 years, 20 to 59 years,
and more than 60 years. Outpatient visits were available for MOH public hospitals
(emergency departments, general outpatient departments, and specialist clinics) and
public health clinics41. Outpatient visits for acute diarrhoea were classified using ICD-10
diagnostic codes for Intestinal Infectious Disease (A00-09).
ii National Health and Morbidity Survey
The National Health and Morbidity Surveys (NHMS) are a series of nationwide
household health surveys conducted by the Institute for Public Health, MOH, Malaysia.
These surveys were carried out at regular intervals to assess community health status and
disease patterns, health needs, household health expenditure and health-seeking
behaviour of the Malaysian population. These nationwide surveys were conducted to
41 Primary care services are general outpatient services provided without an appointment, on a walk-in basis. These services are
available at MOH public health clinics and hospitals. At public health clinics, primary care services may be provided by medical
assistants at smaller clinics, or also by medical officers and family medicine specialists at larger health centres. At public hospitals,
general outpatient services are provided at the outpatient and emergency departments, and at satellite and specialist clinics. At smaller towns, outpatient departments provide general walk-in outpatient care services. However, at bigger cities like Kuala Lumpur, satellite
clinics were established at various locations in the city to provide additional outpatient services, while aiming to decongest services
at the busy hospital. The emergency department at hospitals, while primarily providing acute care, also provide general outpatient service to non-acute walk-in patients. Similarly, some specialist clinics inevitably provide general outpatient service (Noor Ghani &
Yadav, 2008).
Univers
ity of
Mala
ya
64
provide supplementary information to better enable the MOH, Malaysia to review health
priorities, programme strategies and activities, to plan and allocate resources.
Initially the NHMS were conducted at ten year intervals (1986, 1996 and 2006).
Subsequently, more frequent surveys were conducted at five year intervals (2011 and
2015).
The first NHMS conducted in 1986 (NHMS 1986), surveyed the population in
Peninsular Malaysia only, and had a response rate ranging from 92 to 100 per cent. The
second NHMS conducted ten years later in 1996 (NHMS 1996), surveyed Peninsular
Malaysia, as well as Sabah and Sarawak, to provide information on health and disease
morbidity for the entire nation. The NHMS 1996 had a response rate of 87 per cent.
The third NHMS conducted in 2006 (NHMS 2006), was a nation-wide, nationally
representative, cross-sectional, household health survey, which aimed to provide
community-based information to the MOH on load of illness, health utilisation patterns,
household consumption costs for health care, specific health related behaviours and
morbidity. NHMS 2006 included a module designed to determine the incidence, severity,
impact on productivity and health-seeking behaviour of the community in relation to
acute diarrhoeal illness. This nationwide survey was selected for use in this thesis, as it
was the most recent survey to specifically evaluate acute diarrhoeal illness in Malaysia.
Subsequent surveys had dropped the module evaluating acute diarrhoeal illness in
Malaysia.
The NHMS 2006 was designed to provide data at both national and state levels, on the
population living in private households in Malaysia. The sampling frame for the 2006
survey was informed by the Department of Statistics, Malaysia. In this survey, a two-
stage, stratified random sampling was conducted, using sampling proportionate to the
population size, to select Enumeration Blocks (EBs) and Living Quarters (LQs). EBs
were contiguous geographical areas with identified boundaries, each of which had an
Univers
ity of
Mala
ya
65
average of 100 LQs. The EBs formed the sampling frame for the survey. At the first stage
of sampling, the primary sampling unit was the EBs, while at the second stage, the
secondary sampling unit was LQs. Each LQ had approximately 4.4 individuals, all of
whom were included in the survey. Sample size was determined by the previous
prevalence rate for health problems in Malaysia, response rate for the NHMS 1996, a
margin of error of 1.2 and a design effect of two.
This nationwide health survey sampled households with a total of 59,938 individuals.
All eligible household members in the LQs42 were selected as respondents and were
interviewed using structured questionnaires. Parents were interviewed as proxy for
children 12 years and younger. The structured, pretested and piloted survey questionnaire
was administered via a face-to-face interview by trained interviewers comprising of
public health nurses from the MOH and part-time recruits.
There were a total of 56,710 eligible respondents for the module on acute diarrhoeal
illness, representing 21,095,810 people on weighted counts, with a response rate of 98.3
per cent. Children under-five years comprised of 5,912 individuals, or 10.6 per cent of
those interviewed.
The survey defined acute diarrheal illness as having three or more episodes of loose
stools within a two week period prior to the interview. The overall incidence of self-
reported acute diarrhoeal illness within a two week recall period was 5.0 per cent (95 per
cent CI: 4.8 to 5.2), with incidence of 4.5 per cent (95 per cent CI: 3.9 to 5.1) in children
under-five years of age (Ministry of Health Malaysia, 2006).
Age-stratified health utilisation patterns for children with self-reported acute
diarrhoea, obtained from the NHMS 2006, was used in this thesis for the estimation of
diarrhoeal outpatient visits in children under-five years in Malaysia (Ministry of Health
Malaysia, 2006).
42 An eligible respondent was defined as a permanent resident, who was present at the LQ at the first visit for data collection, and
had been residing at that particular LQ for at least four weeks. Written consent was obtained from eligible respondents.
Univers
ity of
Mala
ya

66
(b) Data analysis
For this current study, annual diarrhoeal outpatient visits for children under-ten years
to MOH public facilities for 2012 was obtained from the Centre of Health Informatics,
MOH, Malaysia. The data on annual diarrhoeal outpatient visits was aggregated by age
groups. While, outpatient visits for children under-five years is relevant for this thesis,
this data was unavailable from the MOH, Malaysia. The aggregated nature of the data did
not allow extraction of outpatient treated diarrhoeal episodes among children under-five
years.
As such, age specific health service utilisation patterns from NHMS 2006 was used to
estimate diarrhoeal outpatient visits to public facilities for children under-five years in
Malaysia.
Diarrhoeal outpatient visits for children under-five years was estimated by multiplying
the reported number of diarrhoeal outpatient visits for children under-ten years to MOH
outpatient facilities for 2012 (Ministry of Health Malaysia, 2012d), with the age specific
ratio of diarrhoeal outpatient visits from the NHMS 2006 (the number of children under-
five years with acute diarrhoeal illness seeking care at public facilities, divided by the
number of children under-ten years with acute diarrhoeal illness seeking care at public
facilities) (Ministry of Health Malaysia, 2006, p. 68).43
This estimation of diarrhoeal outpatient visits to public facilities for children under-
five years in Malaysia is shown in Table 4.3.
43 The NHMS 2006 found that among children under-five years with self-reported diarrhoeal illness, only 1.4 per cent sought
outpatient care at army hospitals and none sought outpatient care at university hospitals (Ministry of Health Malaysia, 2006, p. 68).
As such, diarrhoeal outpatient visits to non-MOH public clinics were assumed to be negligible in this thesis.
Univers
ity of
Mala
ya
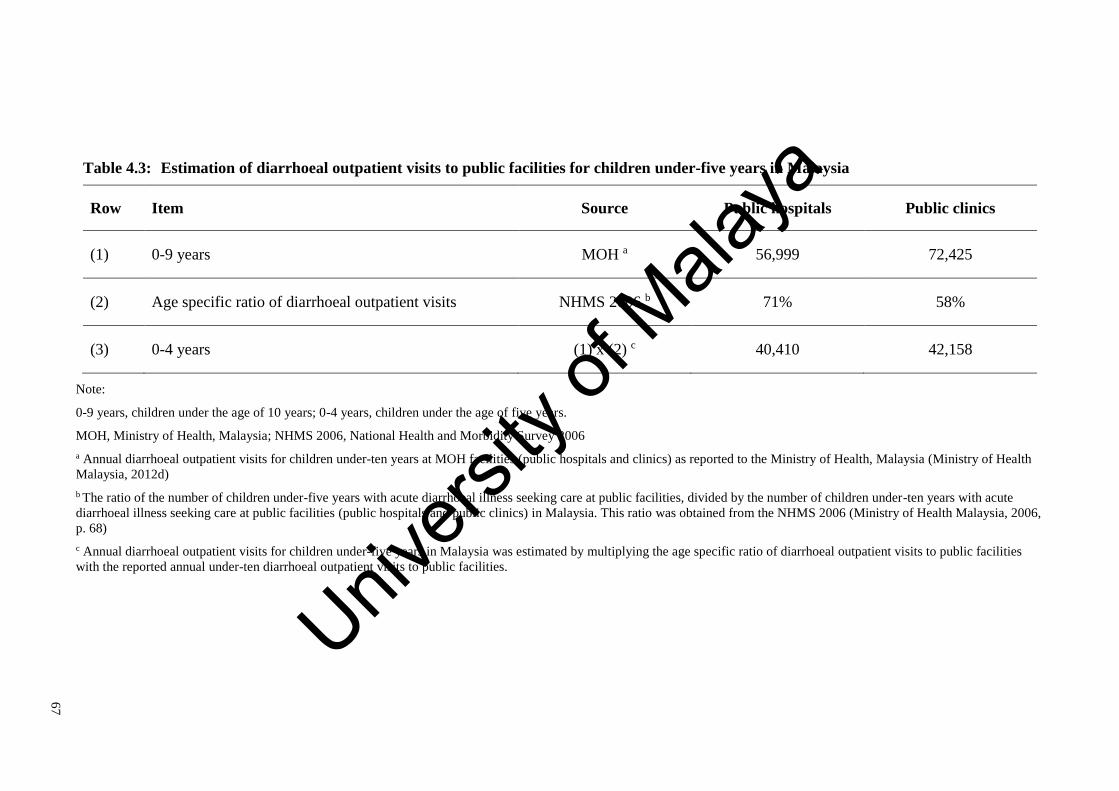
67
Table 4.3: Estimation of diarrhoeal outpatient visits to public facilities for children under-five years in Malaysia
Row Item Source Public hospitals Public clinics
(1) 0-9 years MOH a 56,999 72,425
(2) Age specific ratio of diarrhoeal outpatient visits NHMS 2006 b 71% 58%
(3) 0-4 years (1) x (2) c 40,410 42,158
Note:
0-9 years, children under the age of 10 years; 0-4 years, children under the age of five years.
MOH, Ministry of Health, Malaysia; NHMS 2006, National Health and Morbidity Survey 2006
a Annual diarrhoeal outpatient visits for children under-ten years at MOH facilities (public hospitals and clinics) as reported to the Ministry of Health, Malaysia (Ministry of Health
Malaysia, 2012d)
b The ratio of the number of children under-five years with acute diarrhoeal illness seeking care at public facilities, divided by the number of children under-ten years with acute
diarrhoeal illness seeking care at public facilities (public hospitals and public clinics) in Malaysia. This ratio was obtained from the NHMS 2006 (Ministry of Health Malaysia, 2006,
p. 68)
c Annual diarrhoeal outpatient visits for children under-five years in Malaysia was estimated by multiplying the age specific ratio of diarrhoeal outpatient visits to public facilities
with the reported annual under-ten diarrhoeal outpatient visits to public facilities.
Univers
ity of
Mala
ya

68
As the Centre of Health Informatics at MOH, Malaysia does not collect data on
outpatient visits to private facilities, health utilisation patterns from NHMS 2006 were
used to estimate the number of diarrhoeal outpatient visits to private clinics in Malaysia.
The NHMS 2006 presents information on the place which care was first sought for
acute diarrhoeal illness for children under-five years44. These can be broadly categorised
into public hospitals (20 per cent), public clinics (26 per cent), private hospitals (three per
cent), private clinics (49 per cent), and others (one per cent) (Ministry of Health Malaysia,
2006, p. 68).
Up to this point, this thesis estimates 152,523 diarrhoeal episodes in Malaysia, for
under-five diarrhoeal hospitalisations (to public and private hospitals) and outpatient
visits to public facilities (public hospitals and clinics). To estimate the number of
diarrhoeal outpatient visits to private clinics in Malaysia, the estimate of 152,523
diarrhoeal episodes was multiplied with the proportion of diarrhoeal episodes among
children under-five years receiving outpatient treatment at private clinics from NHMS
2006 (49 per cent), and then divided by the proportion of diarrhoeal episodes among
children under-five years receiving inpatient treatment (at public and private hospitals)
and outpatient treatment at public facilities in Malaysia, obtained from NHMS 2006 (49
per cent)45 (Ministry of Health Malaysia, 2006, p. 68).
This estimation diarrhoeal outpatient visits to private clinics for children under-five
years in Malaysia, is shown in Table 4.4.
44 Places that care was first sought for acute diarrhoeal illness, as listed in NHMS 2006 included: government general hospital,
government district hospital, government health clinic, government mobile clinic, university hospital, army hospital, private hospital,
private clinic, estate hospital, estate clinic, traditional practitioner, pharmacy or Chinese medicine shop, non-governmental
organisation clinics, religious leaders or spiritual healers, drug sellers, direct selling, village midwife, village headmen, friend, relative and others (Ministry of Health Malaysia, 2006, p. 68).
45 The denominator from NHMS 2006 of 49 per cent, consisted of the proportion of diarrhoeal episodes among children under-
five years receiving inpatient treatment at public hospitals (20 per cent) and private hospitals (three per cent), and outpatient treatment at public clinics (26 per cent). This figure corresponds to the estimate in this thesis up to this point (inpatient visits to public and
private facilities, and outpatient visits to public facilities).
Univers
ity of
Mala
ya
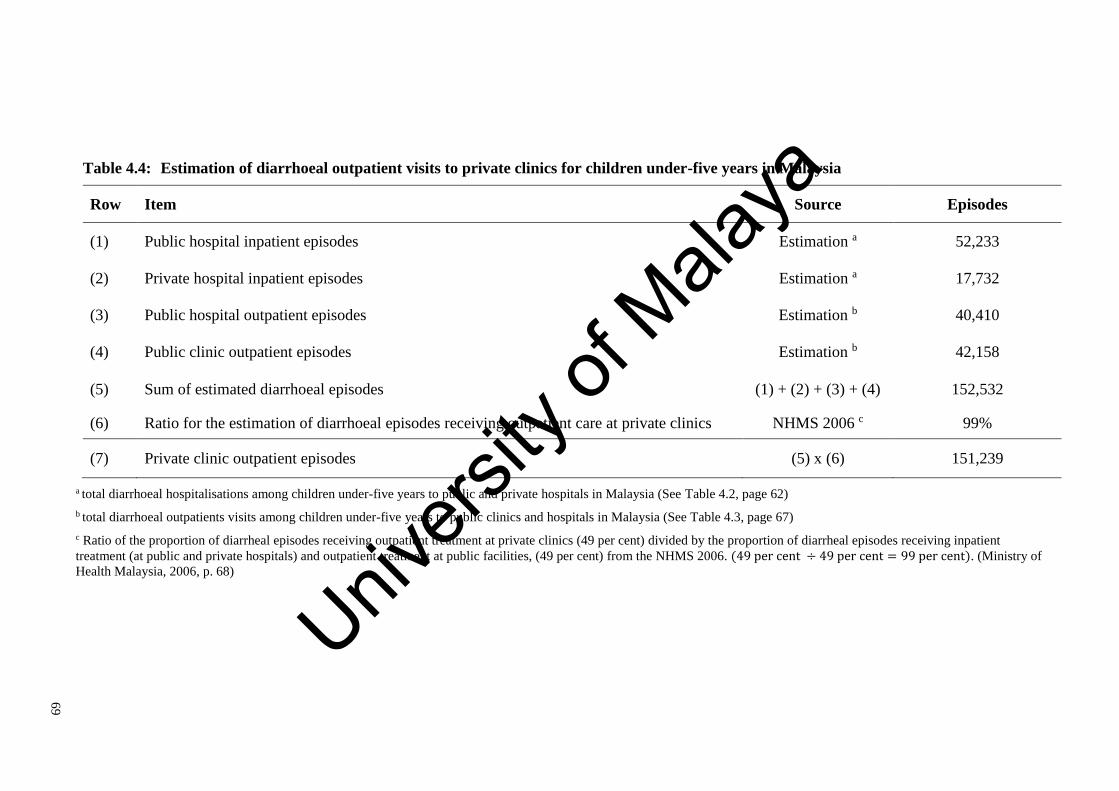
69
Table 4.4: Estimation of diarrhoeal outpatient visits to private clinics for children under-five years in Malaysia
Row Item Source Episodes
(1) Public hospital inpatient episodes Estimation a 52,233
(2) Private hospital inpatient episodes Estimation a 17,732
(3) Public hospital outpatient episodes Estimation b 40,410
(4) Public clinic outpatient episodes Estimation b 42,158
(5) Sum of estimated diarrhoeal episodes (1) + (2) + (3) + (4) 152,532
(6) Ratio for the estimation of diarrhoeal episodes receiving outpatient care at private clinics NHMS 2006 c 99%
(7) Private clinic outpatient episodes (5) x (6) 151,239
a total diarrhoeal hospitalisations among children under-five years to public and private hospitals in Malaysia (See Table 4.2, page 62)
b total diarrhoeal outpatients visits among children under-five years to public clinics and hospitals in Malaysia (See Table 4.3, page 67)
c Ratio of the proportion of diarrheal episodes receiving outpatient treatment at private clinics (49 per cent) divided by the proportion of diarrheal episodes receiving inpatient
treatment (at public and private hospitals) and outpatient treatment at public facilities, (49 per cent) from the NHMS 2006. (49 per cent ÷ 49 per cent = 99 per cent). (Ministry of
Health Malaysia, 2006, p. 68)
Univers
ity of
Mala
ya
70
4.2.2.3 Home-treated episodes
Home-treated diarrhoeal episodes were defined in this thesis, as diarrhoea for which
formal treatment was either not sought or sought at facilities other than clinics and
hospitals, like traditional healers, traditional Chinese medicine shops or pharmacists.
(a) Data source
The study by Yap et al., conducted over a 12 month period in 1989, is the only
community-based rotavirus surveillance conducted in Malaysia (Yap et al., 1992). This
study was conducted with appropriate and rigorous methodology with the aim of
detecting the proportion of diarrhoea attributable to rotavirus at a community setting
(World Health Organization, 2002a). While the WHO generic protocol describes the
methodology for the conduct of community-based rotavirus surveillance, this kind of
community-based rotavirus study has not been conducted in many countries. This is
presumably because community-based studies are resource intensive, involving frequent
home visits, detailed history taking and stool sampling. In this thesis, this community-
based rotavirus study provided the proportion of children with acute diarrhoea not seeking
medical treatment for diarrhoea, and the rotavirus detection proportion for diarrhoeal
episodes treated at outpatient and home settings [further details in Subsection 4.2.2.5(a),
page 74].
The study by Yap et al. prospectively followed 156 children under-five years from 116
households, from the urban and suburban areas around Kuala Lumpur and Selangor, for
one year. Stool was inspected on a daily basis by parents to examine for loose consistency.
Parents were instructed to identify loose stool and obtain samples for analysis. Health
workers conducted three home visits weekly, while medical doctors visited households
monthly. Home visits were conducted to inquire on the occurrence of illness and to obtain
stool samples. Stool was tested for rotavirus using an enzyme-linked immune absorbent
test (ELISA) method and also a polyacrymide gel electrophoresis (PAGE) method with
Univers
ity of
Mala
ya
71
silver staining, both of which had similar sensitivity and specificity to the WHO ELISA
tests at the time of the study (Yap et al., 1992).
During the 12 month study period, there were 60 episodes of diarrhoea reported from
34 of the 156 children. Stool samples were collected from 25 of the 34 children with
diarrhoea. Of the 25 stool samples tested, three were positive for rotavirus (12 per cent).
Six (18 per cent) of the 34 children with diarrhoea sought outpatient treatment, while one
rotavirus positive child was hospitalised. Twenty-seven (79 per cent) children with acute
diarrhoea did not seek medical treatment (Yap et al., 1992).
(b) Data analysis
The only community-based rotavirus surveillance study in Malaysia found that 79 per
cent of all children under-five years of age, with diarrhoeal symptoms did not seek
treatment for diarrhoea (Yap et al., 1992). The ratio of acute diarrhoeal illness not seeking
care (79 per cent) divided by those seeking care (21 per cent) from this community-based
rotavirus study, was multiplied with the estimated number of acute gastroenteritis
episodes seeking care (diarrhoeal hospitalisations and outpatient visits), to estimate the
incidence of home-treated acute gastroenteritis in Malaysia.
4.2.2.4 Deaths
(a) Data source
Diarrhoea specific mortality data for children under-five years was acquired from the
Department of Statistics, Malaysia, for the years 2000 to 2008. These were the most
recent available years for which mortality data was available. Prior to the year 2000, all
mortality data was coded using ICD-9 codes.
Univers
ity of
Mala
ya

72
In Malaysia, not all deaths are verified by medical professionals for the issuance of a
death certificates46. Thus, diarrhoeal deaths were defined here as deaths that were
medically certified with ICD-10 diagnostic codes for diarrhoeal deaths [as described in
Subsection 4.2.2.1(b), page 59] and those that were certified by lay personnel as having
died of diarrhoea.
(b) Data analysis
In view of estimating the diarrhoeal deaths for children under-five years in 2013, a
Runs test was used to test for randomness of the annual under-five years diarrhoeal
mortality rate from 2000 to 200847 (Bradley, 1968). The null hypothesis of the Run’s test
is that the data sequence is produced in a random manner. As the resulting test statistic of
-1.04 was less than the critical value of 1.96 (p-value of 0.15 was greater than 0.05), the
null hypothesis was not rejected. This demonstrates that the mortality data varied at
random around a constant mean at a 0.05 significance level, with a constant variance and
no trend component.
As such, the mean acute diarrhoeal mortality rate for children under-five years from
2000 to 2008 of 11.96 diarrhoeal deaths per 100,000 live births (95 per cent CI: 9.18 to
14.74), was used to estimate 61 diarrhoeal deaths in children under-five years for 201348.
Table 4.5 shows the estimation of diarrhoeal mortality in 2013 among children under-
five years in Malaysia.
46All deaths in Malaysia must be registered with the National Registration Department through the Police Department before
burial permits are issued. However, not all registered deaths are medically certified. Most non-medically certified deaths occur at
home. Certification of death by lay persons without medical training (like police officers, village headmen, or other informants) uses
descriptive codes based on illness symptoms prior to death (Faudzi et al., 2011). Adnan et al.(2012), found that from 1995 to 2010,
medically certified deaths in Malaysia ranged from between 45 per cent to 57 per cent .The MOH, Malaysia has in place a under-five
mortality reporting system to report all under-five deaths including those from the private sector and deaths outside hospitals. All under-five deaths are required to be investigated for substandard care or preventable cause of death. Verbal autopsies are
recommended for non-hospital deaths, to identify probable cause of death, thus enabling ICD10 coding (Ministry of Health Malaysia,
2013). 47To obtain annual under-five diarrhoeal mortality rates for the years 2000 to 2008, annual diarrhoea deaths in children under-
five years were divided by annual live births. 48Sixty one diarrhoeal deaths for 2013, was estimated by multiplying the average under-five mortality rate from 2000 to 2008
(11.96 per 100,000 live births) with the birth cohort for 2012 of 508,774 live births (Department of Statistics Malaysia, 2012b, p. 9)
and divided by 100,000.
Univers
ity of
Mala
ya

73
Table 4.5: Estimation of diarrhoeal mortality in children under-five years in Malaysia, 2013
Item 2000 2001 2002 2003 2004 2005 2006 2007 2008 2013 a
Uncertified diarrhoeal deaths b 24 26 34 27 28 19 16 11 13
Certified diarrhoeal deaths b 12 27 33 34 54 59 32 26 47
Total diarrhoeal deaths b 36 53 67 61 82 78 48 37 60 61
Total under-five deaths b 4,872 4,424 4,252 4,158 4,044 4,010 3,652 3,741 3,887
Percentage of under-five deaths
due to diarrhoea 0.7% 1.2% 1.6% 1.5% 2.0% 1.9% 1.3% 1.0% 1.5%
Annual live births c 549,543 515,985 484,037 480,083 477,768 469,204 465,112 472,048 487,346 508,774
Under-five mortality rate
(per-1000 live births) 8.9 8.6 8.8 8.7 8.5 8.5 7.9 7.9 8.0
Under-five mortality rate for
acute gastroenteritis
(per-100,000 live births) 6.6 10.3 13.8 12.7 17.2 16.6 10.3 7.8 12.3 11.96
Note:
a Total diarrhoeal deaths for children under-five years in 2013 (61 deaths), was estimated by multiplying the average under-five mortality rate for acute gastroenteritis from 2000 to
2008 (11.96 per 100,000 live births), with the annual birth cohort for 2012 (508,774 live births) (Department of Statistics Malaysia, 2012b, p. 9)
b Deaths for children under-five years from 2000 to 2008, were obtained from the Department of Statistics, Malaysia.
c Annual live births in Malaysia from 2000 to 2008, were obtained from the Department of Statistics, Malaysia. Univers
ity of
Mala
ya
74
4.2.2.5 Proportion of acute gastroenteritis attributable to rotavirus
(a) Overview
To estimate incidence of rotavirus gastroenteritis, the proportion of diarrhoea
attributable to rotavirus is multiplied with the incidence of acute gastroenteritis (Figure
4.1). The rotavirus detection proportions are different according to different health
settings; with higher rates detected in diarrhoeal hospitalisations, followed by outpatient
treated and home-treated diarrhoea (Parashar et al., 2003). Hospital-based and
community-based surveillance are recommended to obtain rotavirus detection
proportions in a country (World Health Organization, 2002a).
In this thesis, a systematic review and meta-analysis was conducted with the aim of
obtaining the proportion of diarrhoea attributable to rotavirus in children under-five years
hospitalised in Malaysia. Prospective, hospital-based rotavirus surveillance studies were
selected to fulfil criteria based on the WHO Generic Protocol for hospital-based rotavirus
surveillance (World Health Organization, 2002a).
Rotavirus detection proportion for diarrhoeal deaths was assumed to be the same as
that of rotavirus-related hospitalisations, as hospitalisations and deaths both result from
severe illness (Parashar et al., 2009; Parashar et al., 2003; Tate et al., 2012).
The community-based rotavirus surveillance study by Yap et al. provided rotavirus
detection proportions for diarrhoea treated at outpatient settings (18 per cent) and home-
treated (12 per cent) (Yap et al., 1992).
(b) World Health Organization generic protocol for rotavirus surveillance
The WHO generic protocol for rotavirus surveillance was developed by the WHO
Department of Vaccines and Biologicals in 2002, in anticipation of the availability of
rotavirus vaccines. This protocol provides standardised methodology to allow countries
to estimate the burden of rotavirus in the population.
Univers
ity of
Mala
ya

75
The WHO protocol recommends prospective hospital-based surveillance for the
estimation of incidence of severe rotavirus gastroenteritis. Severe rotavirus diarrhoea
resulting in hospitalisations and death, are the main targets of rotavirus vaccines. Also,
rotavirus hospitalisations incur a sizable economic burden to healthcare providers.
The WHO protocol recommends a duration of at least two complete years of
surveillance to account for both seasonal and annual variation in rotavirus incidence49.
As rotavirus diarrhoea rarely occurs after the age of five years, the generic protocol
recommends that rotavirus surveillance be conducted in children under the age of five
years50. The WHO protocol recommends that stool is tested for rotavirus using an enzyme
immunoassay test (World Health Organization, 2002a).
(c) Systematic review of prospective hospital-based rotavirus studies in Malaysia
A systematic search was conducted to select studies conducted in Malaysia based on
the WHO recommendations for hospital-based rotavirus surveillance. Criteria for
eligibility were as follows: (1) a prospective, hospital-based study, (2) of at least two
years duration, (3) study conducted in Malaysia, (4) on children under-five years and (5)
stool tested for rotavirus with an enzyme immunoassay test.
The literature was searched systematically to locate published articles in three major
databases (PubMed, Scopus and Web of Science). Search terms used were ‘rotavirus’
AND (‘gastroenteritis’ OR ‘diarrhoea’ OR ‘diarrhea’) AND Malaysia. The search was
limited to English language publications but with no specific range of publication dates.
Citation search of identified articles and expert consultation was conducted to locate
further papers.
After removal of duplicates, the titles and abstracts were screened to identify
prospective, hospital-based rotavirus studies. Subsequently, full text articles were read to
49 Rotavirus diarrhoea is a seasonal infection. As such, surveillance of at least a year is necessary to ensure rotavirus detection
rates are not affected by seasonal variations. While, a minimum of two complete years will account for possible annual differences in rotavirus incidence.
50 Inclusion of older children would result in an underestimation of rotavirus incidence.
Univers
ity of
Mala
ya
76
identify studies that met the eligibility criteria to be included in the meta-analysis.
Information was extracted on study period, duration and location, population age group
and laboratory methods. For each study setting, the number of acute gastroenteritis cases,
specimens tested, positive samples and rotavirus detection proportion were recorded.
A DerSimonian and Laird random effects model was used to pool outcomes from each
individual study site, to calculate the mean and 95 per cent confidence interval for the
rotavirus detection proportion among acute gastroenteritis related hospitalisations in
children under-five years (DerSimonian & Laird, 1986). The random effects model was
used to account for the inherent variability in different study settings and timings. Meta-
analysis was performed using Microsoft Excel 2013, with methods described by
Neyeloff, Fuchs, and Moreira (2012).
4.2.3 Estimating the economic burden of rotavirus gastroenteritis
4.2.3.1 Direct medical costs
(a) Overview
The estimation of the economic burden of rotavirus gastroenteritis in Malaysia
requires unit costs for inpatient and outpatient care, at both public and private health
facilities. Since unit costs are not readily available in Malaysia, top-down costing
methods, similar to those used for the estimation of the economic burden of dengue in
Malaysia, were used in this study (D. S. Shepard, Hodgkin, & Anthony, 2000; D. S.
Shepard et al., 2012; Suaya et al., 2009).
Multiple data sources were combined for this current estimation of unit costs. The
following subsections detail the data sources and analysis used for the estimation of direct
medical costs for rotavirus gastroenteritis in Malaysia.
Univers
ity of
Mala
ya

77
(b) Data Source
i WHO-CHOICE project
The WHO-CHOICE project was initiated in 1998 to assist countries in making rational
choices on healthcare resource allocations, based on evidence generated by cost-
effectiveness analyses (World Health Organization, 2014c).
The WHO-CHOICE project allows for the estimation of unit costs of inpatient and
outpatient care by 191 member states, through data collected from 49 countries (Adam,
Evans, & Murray, 2003; World Health Organization, 2011). Presumably due to the lack
of suitable data, Malaysia had not been included in the list of countries contributing data.
Using econometric modeling, the WHO-CHOICE project predicts unit costs for countries
in which data was not available. In the case of Malaysia, especially since Malaysian data
was not obtained for the WHO-CHOICE project, it is preferable to use local data for
costing.
WHO-CHOICE provides estimates of unit costs by facility-type based on ownership
(public or private) and location (urban or rural areas).The facility-types used in the WHO-
CHOICE project refers to differences in service characteristics, including differences in
case-mix, technical capacity and skills available in facilities (World Health Organization,
2011).
Definitions of facility-types used in WHO-CHOICE can be obtained from Barnum and
Kutzin, ‘Public hospitals in developing countries: resource use, cost, financing’ 1993.
Definition of facility-types are as follows:
(1) Health centres with outpatient services only (no beds)
(2) Health centres with beds
(3) Primary-level hospitals: Hospitals intended for treating simple cases
(e.g. ‘district hospitals’)
Univers
ity of
Mala
ya
78
(4) Secondary-level hospitals: Hospitals intended primarily for treating referral cases
(e.g. ‘specialist hospital’)
(5) Tertiary-level hospitals: Hospitals intended primarily for treating referral cases,
with a teaching component (e.g. ‘teaching hospital’)
(Barnum & Kutzin, 1993; World Health Organization, 2011, 2014c)
ii Unit costs at public clinics
An unpublished 1995 costing study by Lim K.J., on the provision of outpatient services
at eleven MOH public clinics in Kedah, provided average costs per-visit of RM 11.8 in
2013 RM (K. J. Lim, 1995; D. S. Shepard et al., 2012). These eleven clinics were similar
to ‘health facilities with no beds’, as described in WHO-CHOICE (Barnum & Kutzin,
1993; World Health Organization, 2014c). Information on costs was collected for
personnel, supplies, utilities, maintenance and training, and was derived mainly from the
operating budget of the clinics involved.
iii Unit costs at primary-level hospitals
A study by Sabrina A.R. examined the financial performance of six primary-level
hospitals around Malaysia for the year 2001. This study provided estimates of average
outpatient costs of RM 136 per-visit (ranging from RM 32 to RM 245 per-visit) for
primary-level hospitals in 2013 RM. (Table 4.7)
All of the six selected hospitals in this study were 93 bedded facilities with basic
medical and surgical services provided by doctors without specialist qualifications. These
hospitals were considered as belonging to the category of ‘primary-level hospitals without
specialists’ from WHO-CHOICE (Sabrina, 2006).
iv Unit costs at tertiary-level hospitals
In this thesis, top-down costing of five urban, tertiary-level public hospitals in
Malaysia was conducted to estimate average unit costs for inpatient and outpatient care
Univers
ity of
Mala
ya

79
at tertiary-level hospitals. The hospitals selected for costing were University of Malaya
Medical Centre (UMMC), Hospital Sungai Buloh (HSB), Hospital Sultanah Bahiyah,
Alor Setar (HAS), Hospital Melaka (HM) and Hospital Sultan Haji Ahmad Shah,
Temerloh (HT).
The UMMC is a tertiary-level, teaching hospital administered by the Ministry of
Education. The operating expenditure and workload of UMMC was obtained from the
2012 hospital annual report and updated to include salaries of academic clinicians.
Academic clinicians are employed by the university, and as such their salaries are not
included in the hospital’s operating expenditure. The assumption was made that academic
clinicians spent 60 per cent of their time on clinical service, while the remaining time was
spent on academic and research duties. The cost of an outpatient visit was assumed at a
fifth of the cost of an inpatient day at tertiary-level hospitals. These assumptions were
previously used in studies costing medical services at UMMC (D. S. Shepard et al., 2012;
Suaya et al., 2009).
Hospital websites were searched to obtain annual reports of tertiary-level MOH
hospitals (Ministry of Health Malaysia, 2015). Also, hand-search for annual reports was
done at the MOH library at Putrajaya. The lack of standardisation of annual reports and
the unavailability of information on admission rates, clinic attendances, bed occupancy
rate, and hospital expenditure, limited the selection to four tertiary-level MOH hospitals.
Table 4.6 details the estimation of unit costs for per-bed day and per-visit for UMMC
and four tertiary-level MOH hospital in Malaysia.
The average costs obtained from UMMC and four tertiary-level MOH hospitals was
estimated at RM 1,073 per-bed day and RM 215 per-visit. Average costs at UMMC and
four tertiary-level MOH hospitals were used as estimates for unit costs at tertiary-level
hospitals in this study (Table 4.7).
Univers
ity of
Mala
ya

80
Table 4.6: Estimation of unit costs at tertiary-level public hospitals in Malaysia
Row Item Source UMMC,
2012
HSB,
2013
HAS,
2012
HM,
2013
HT,
2012
(1) Admissions Hospital Report a 53,825 45,372 72,703 74,468 39,849
(2) Number of registered beds Hospital Report a 979 620 870 1,091 500
(3) Occupancy rate Hospital Report a 78% 82% 95% 85% 91%
(4) Occupied beds (2) x (3) 759 507 826 923 457
(5) Annual bed days (4) x 365 276,935 185,000 301,609 336,970 166,659
(6) Outpatient clinic visits Hospital Report a 800,426 191,077 142,011 305,098 73,347
(7) Emergency visits Hospital Report a 110,246 150,865 275,009 137,852 69,081
(8) Total outpatient visits (6) + (7) 910,672 341,942 417,020 442,950 142,428
(9) Relative cost: visit/inpatient day Shepard et al. 0.2 0.2 0.2 0.2 0.2
(10) Ambulatory bed-day equivalents (8) x (9) 182,134 68,388 83,404 88,590 28,486
(11) Total bed-day equivalents (5) + (10) 459,069 253,389 385,013 425,560 195,145
(12) Operating expenditure, RM Hospital Report a 480,416,375 316,371,637 387,737,008 341,906,332 229,830,084
(13) Estimated salaries of academic
clinicians devoted to service
Estimated b 37,037,595 - - - -
Univers
ity of
Mala
ya

81
Table 4.6: Estimation of unit costs at tertiary-level public hospitals in Malaysia (continued)
Row Item Source UMMC,
2012
HSB,
2013
HAS,
2012
HM,
2013
HT,
2012
(14) Revised operating expenditures, RM (12) + (13) 517,453,970 316,371,637 387,737,008 341,906,332 229,830,084
(15) Cost per bed-day equivalent c, RM (14)/(11) 1,127 1,249 1,007 803 1,178
(16) Cost per outpatient visit c, RM (15) x (9) 225 250 201 161 236
Note:
All costs are expressed in 2013 Ringgit Malaysia
UMMC, University of Malaya Medical Centre; HSB, Hospital Sungai Buloh; HAS, Hospital Sultanah Bahiyah, Alor Setar; HM, Hospital Melaka; HT, Hospital Sultan Haji Ahmad
Shah, Temerloh;
a Data from the 2012 UMMC Annual Report, 2013 HSB Annual Report, 2012 HAS Annual Report, 2013 HM Annual Report and the 2012 HT Annual Report;
b Estimated from the distribution of academic clinicians by department and their salary grades at the Faculty of Medicine, University of Malaya. Information on salary schemes for
academic staff was obtained from the Department of Human Resources, University of Malaya.
c The average costs obtained from UMMC and four tertiary-level MOH hospitals, were used as estimates for unit costs at tertiary-level hospitals in this study. Average costs at
tertiary-level hospitals was estimated at RM 1073 per-bed day and RM 215 per-visit. (Table 4.7)
Univers
ity of
Mala
ya

82
(c) Data analysis
i Costing of hospital bed-days
In this current study, costing methods were informed by a 2012 study estimating the
economic burden of dengue in Malaysia (D. S. Shepard et al., 2012). In 2010, a dengue
workshop gathered experts from the public and private health sectors and academia to
discuss issues arising due to insufficient data in the estimation of dengue disease burden
in Malaysia (D. Shepard et al., 2011). Two main conclusions from this expert workshop
were used in the present study.
Firstly, the workshop participants had agreed that the description of tertiary-level or
teaching hospitals, as provided by WHO-CHOICE, could refer to the state hospitals,
national referral centres or teaching hospitals in the public sector in Malaysia, including
UMMC. The Malaysian district hospitals could be categorised as either primary-level or
secondary-level hospitals, depending on services provided. In the case of smaller district
hospitals without specialists or with few basic specialties, the participants agreed that they
should be categorised as primary-level hospitals. These would include the six district
hospitals in the 2001 costing study (Sabrina, 2006). The remaining district hospitals could
be considered as secondary-level hospitals.
Secondly, inpatient care at each hospital-type was assumed to be proportional to the
number of beds in these facilities. The expert panel in the dengue study, agreed that
tertiary-level beds made up 50 per cent of all hospital beds in the country. The
corresponding figures for secondary- and primary-level hospital beds were 30 per cent
and 20 per cent respectively. (D. S. Shepard et al., 2012).
In this thesis, inpatient care for diarrhoea at each hospital type was assumed to be
proportional to the number of beds in these facilities. Distribution of hospitals by number
Univers
ity of
Mala
ya
83
of beds was derived from the expert workshop in the dengue study51 (D. S. Shepard et al.,
2012).
In this thesis, cost estimates by facility-types from WHO-CHOICE (primary-level,
secondary-level and teaching hospitals) was used to derive cost-ratios for the estimation
of unit costs for inpatient bed-days at public hospitals. (Barnum & Kutzin, 1993; World
Health Organization, 2011). Cost-ratios are the ratio of unit costs for primary- and
secondary-level hospitals compared with costs at tertiary-level hospitals. For example,
unit costs per bed-day for primary-level hospitals was 74 per cent of costs at teaching
hospitals. (Table 4.7)
Cost-ratio of primary-level hospital compared with teaching hospitals from WHO-
CHOICE (74 per cent) was multiplied with estimated costs at tertiary-level hospitals (RM
1,073), to obtain estimates of unit costs per bed-day at primary-level hospitals of RM 795.
(Table 4.7)
Cost-ratio of secondary-level hospital compared with teaching hospitals from WHO-
CHOICE (77 per cent) was multiplied with estimated costs at tertiary-level hospitals (RM
1,073), to obtain estimates of unit costs per bed-day at secondary-level hospitals of RM
830. (Table 4.7)
The estimated unit costs by facility type was multiplied with the proportion of
distribution of facilities derived from the dengue study, and the sum product of this for
all facilities was the weighted average costs per bed-day of RM 944. (Table 4.7)
51 In the years 2010 and 2011, there were no new MOH hospitals opening. In 2012, there were three new MOH hospitals. These
were the Hospital Orang Asli Gombak (91 beds), Hospital Queen Elizabeth II, Sabah (400 beds) and Hospital Wanita dan Kanak-
kanak, Likas (504 beds).
Hospital Orang Asli, Gombak, is a primary level hospital catering to the needs of the aboriginal community and has been in operation since 1954. This hospital was taken over by the MOH, Malaysia from the Aboriginal Development Department (Jabatan
Kemajuan Orang Asli) in 2012.
Hospital Queen Elizabeth II, Sabah was previously a private medical centre in Sabah (Sabah Medical Centre) and was purchased by the MOH, Malaysia in 2009. Though it was fully operational from November 2009, this hospital was officially opened in 2012.
Hospital Wanita dan Kanak-kanak, Likas is a tertiary level hospital in Sabah specialising in the treatment of women and children
(Paediatric departments, Obstetrics and Gynaecology, and Emergency Department). As the addition of these three hospitals did not substantially change the number or the distribution of facilities and services in
Malaysia, it was assumed that the distribution of hospitals by number of beds in Malaysia for 2013 was similar to that in 2010.
Univers
ity of
Mala
ya

84
The average costs per bed-day of RM 944 was assumed to be equivalent to unit costs
of public facilities. The unit cost estimates for tertiary-level hospitals of RM 1,073 per
bed-day was assumed to be equivalent to unit costs at private facilities. (Table 4.7)
Duration of admission for an episode of rotavirus gastroenteritis (3.3 days) was
obtained from a 2010 prospective hospital-based study (Lee, Lim, Chai, Kirkwood, &
Lee, 2012). The full description of this dataset and its analysis is detailed in Chapter 6.
Duration of admission for an episode of rotavirus gastroenteritis was multiplied by unit
cost per bed-day, to obtain costs per inpatient treated episode. (Table 4.10)
Table 4.7 shows the estimation of unit costs per bed-day and per outpatient visit at
healthcare facilities in Malaysia.
Univers
ity of
Mala
ya

85
Table 4.7: Estimation of unit cost in healthcare facilities in Malaysia, 2013
Type of facility a Distribution of facility
(%) b, c
Unit cost
(2008 RM)
WHO-CHOICE
Cost-ratio
by facility type d
Unit cost
(2013 RM)
Cost per bed-day
Primary-level hospital 20% 289.23 0.74 795.30
Secondary-level hospital 30% 301.73 0.77 829.67
Teaching hospital 50% 390.15 1.00 1072.80 e
Average cost per bed-day 944.36 f
Cost per outpatient visit
Health facilities with no beds 56% 25.50 0.48 11.80 g
Primary-level hospital 20% 53.20 1.00 135.76 h
Secondary-level hospital 30% 75.00 1.41 191.39
Tertiary-level hospital 50% - - 214.56 e
Average cost per outpatient visit at a hospital 191.85i
Average cost per outpatient visit 91.02 j
Univers
ity of
Mala
ya

86
a Definitions of facility levels used in WHO-CHOICE can be obtained from Barnum and Kutzin. ‘Public hospitals in developing countries: resource use, cost, financing’, 1993
(Barnum & Kutzin, 1993).
b Distribution of facility type by hospital beds, for estimation of cost per bed-day and cost per outpatient visits at hospitals was based on expert opinion (D. S. Shepard et al., 2012)
c Distribution of ‘health facilities with no beds’ was based on data from the Ministry of Health, Malaysia (Ministry of Health Malaysia, 2012d).
Fifty six per cent of diarrhoeal outpatient visits reported to MOH, Malaysia in 2012 were to public health clinics, while the remaining were to hospitals.
d Cost-ratios by facility type are the ratio of unit costs from WHO-CHOICE by facility type, used to estimate unit costs
e Average cost per bed-day from five tertiary-level hospitals in Malaysia was used to represent costs of ‘teaching hospital’ from WHO-CHOICE. Note that there are no equivalent
unit costs for outpatient visits at tertiary-level facilities in WHO-CHOICE.
f The estimated unit costs by facility type was multiplied with the proportion of distribution of facilities, and the sum product of this for all facilities was the weighted average costs
per bed-day of RM 944.
[(20% × RM795.30) + (30% × RM829.67) + (50% × RM1072.80)] = RM944.36
g Unit cost per-visit equivalent to ‘health facilities with no beds’ from WHO-CHOICE, was obtained from the 1995 costing study on outpatient services at 11 MOH public clinics in
Kedah (K. J. Lim, 1995).
h Unit cost equivalent to ‘primary-level hospitals’ from WHO-CHOICE, obtained from the 2001 costing study of six primary-level or district hospitals (Sabrina, 2006)
i The estimated unit costs by facility type was multiplied with the proportion of distribution of facilities, and the sum product of this for all hospitals was the weighted average costs
per-visit at hospitals of RM 192.
[(20% × RM135.76) + (30% × RM191.39) + ( 50% × RM214.56) = RM191.85 ]
j The estimated unit costs by facility type was multiplied with the proportion of distribution of facilities, and the sum product of this was the weighted average costs per outpatient
visit of RM 91.
[(56% × RM11.80) + (44% × 20% × RM135.76) + (44% × 30% × RM191.39) + (44% × 50% × RM214.56) = RM91.02]
Univers
ity of
Mala
ya
87
ii Costing of outpatient visits
Distribution of care to outpatient facilities was based on data collected on diarrhoeal
illness treated at MOH outpatient clinics from the Centre for Health Informatics, MOH,
Malaysia [Subsection 4.2.2.2(a)i, page 63]. Fifty six per cent of diarrhoeal outpatient
visits reported to MOH, Malaysia in 2012 were to public health clinics, while the
remaining were to hospitals (Ministry of Health Malaysia, 2012d).
Outpatient care at each hospital-type was assumed to be proportional to the number of
beds in these facilities, in accordance to the conclusion of the expert panel discussion in
the dengue study. Thereafter, the remaining forty-four per cent of outpatient visits was
distributed to tertiary-level (50 per cent), secondary-level (30 per cent) and primary-level
(20 per cent) hospitals. (Table 4.7)
The dengue workshop participants had agreed that the average cost per-visit of RM 12
for MOH clinics from the Lim K.J. study was considered to be reflective of the actual
costs of service provision in the MOH clinics. (Barnum & Kutzin, 1993; World Health
Organization, 2014c).
In this thesis, costs per-visit from the Lim K.J. study of RM 12 was used for outpatient
costs at ‘health facilities with no beds’, costs per-visit from the Sabrina A.R. study of RM
136 was used for outpatient costs at primary-level hospitals, and average costs per-visit
from UMMC and four MOH hospitals of RM 215 was used for outpatient costs at tertiary-
level hospitals. (Table 4.7)
Cost estimates by facility-types from WHO-CHOICE was used to derive cost-ratios
for the estimation of unit costs for outpatient visits at secondary-level hospitals (Barnum
& Kutzin, 1993; World Health Organization, 2011).
Unit costs per outpatient visit for secondary-level hospitals were 141 per cent of the
costs at primary-level hospitals. Cost-ratio of secondary-level hospital compared with
primary-level hospitals from WHO-CHOICE (141 per cent) was multiplied with
Univers
ity of
Mala
ya

88
estimated costs for primary-level hospitals (RM 136), to obtain estimates of cost at
secondary-level hospitals of RM 191 per-visit. (Table 4.7)
The estimated unit costs by facility type was multiplied with the proportion of
distribution of facilities, and the sum product of this for all hospitals was the weighted
average costs per-visit at hospitals of RM 192. (Table 4.7)
In this thesis, unit costs of RM 12 was assumed for public clinic visits (estimates of
unit costs per outpatient visit for ‘Health facilities with no beds’ from the Lim K.J. study),
RM 192 for public hospital outpatient visits (estimates of the average unit cost per
outpatient visit at a hospital), and RM 215 for private clinic visits (average unit costs per
outpatient visit at tertiary-level hospital). (Table 4.7)
4.2.3.2 Direct non-medical costs
Direct non-medical costs were transportation costs and costs of additional diapers and
food consumed during an episode of rotavirus gastroenteritis.
The National Health and Morbidity Survey 2011 (NHMS 2011) is the fourth in a series
of nationally representative household health surveys. NHMS 2011 was conducted five
years after the NHMS 2006, with a specific aim to determine healthcare demand of the
community, as well as to determine risk factors for cardiovascular disease among the
adult population and the prevalence of other health related problems among the
community in Malaysia (Ministry of Health Malaysia, 2011b, p. 9). The NHMS 2011
determined healthcare consumption costs and provided average costs for one-way travel
to health facilities in Malaysia (Ministry of Health Malaysia, 2011b).
In this thesis, for the estimation of transportation costs, one-way travel costs from
NHMS 2011 were doubled for an outpatient visit and quadrupled for a hospital admission.
These were conservative assumptions for transportation costs, based on minimum travel
requirements to and from healthcare facilities. Transportation costs were determined for
illness episodes requiring inpatient care at public hospitals (RM 49), private hospitals
Univers
ity of
Mala
ya

89
(RM 52), and outpatient care at public hospitals (RM 24), public clinics (RM 8) and
private clinics (RM 11).
Costs for extra food and diapers was obtained from the 2010 hospital-based study
conducted at two centres in Malaysia, which examined out-of-pocket healthcare
expenditure associated with an episode of rotavirus gastroenteritis requiring
hospitalisation (Lee et al., 2012). The full description of this dataset is detailed in Chapter
6. An average cost of RM 10 for extra diapers was used for all rotavirus gastroenteritis
episodes regardless of severity. The costs of extra food (RM 2.25) was only applied for
rotavirus gastroenteritis episodes requiring hospital admission. (Table 4.11)
4.2.3.3 Indirect costs
Indirect costs were defined as productivity loss for one parent or caregiver for the
duration of diarrhoeal illness. Productivity loss was calculated by multiplying average
daily wage with the days of work missed to care for an ill child with rotavirus diarrhoea.
The average duration of diarrhoeal illness in children under-five years of 2.7 days,
obtained from NHMS 2006, was assumed to represent days of work missed for all
rotavirus gastroenteritis episodes regardless of severity (Ministry of Health Malaysia,
2006). This is a conservative assumption for productivity loss, as although days of work
lost for hospitalised diarrhoeal episodes may be greater than for milder episodes, data on
work-day loss for the care of children with diarrhoea of every severity is unavailable.
The average monthly wage for both sexes in Malaysia of RM 2,052 was obtained from
the 2013 Wages and Salaries Survey Report (Department of Statistics Malaysia, 2013c).
As wage-earners were assumed to work six days a week, hence daily wage of RM 79,
was calculated by dividing the average monthly wage by 26. Hence, the estimated
productivity loss of RM 213 was estimated for an episode of rotavirus gastroenteritis.
(Table 4.12)
Univers
ity of
Mala
ya
90
4.3 Results
4.3.1 Health burden
The following subsections provide detailed results of the incidence of acute
gastroenteritis, the proportion of acute gastroenteritis attributable to rotavirus and the
incidence of rotavirus gastroenteritis in Malaysia.
4.3.1.1 Incidence of acute gastroenteritis
(a) Hospitalisations
In 2011, 96 of the 142 public hospitals in Malaysia contributed data on hospital
discharges to the national database. Among children under-five years, 23,450 (6.4 per
cent) of 365,931 public hospital discharges had ICD-10 codes for acute gastroenteritis.
(Table 4.1)
In 2013, 107 of 209 private hospitals in Malaysia provided data on hospital discharges
to the national database. Of the 153,717 private hospital discharges in children under-five
years, 15,886 (10.3%) had ICD-10 codes for acute gastroenteritis. (Table 4.1)
When reported data was adjusted for hospitals not reporting discharges, a total of
70,000 acute gastroenteritis hospitalisations among children under-five years was
estimated annually for Malaysia, with 52,000 (75 per cent) discharges to public hospitals
and 18,000 (25 per cent) to private hospitals. (Table 4.2 )
Annually, the incidence of acute gastroenteritis hospitalisations was estimated at 27.5
episodes per-1,000 children. (Table 4.8)
(b) Outpatient visits
In 2012, there were 129,424 acute gastroenteritis related outpatient visits reported to
MOH facilities among children under-ten years. (Table 4.3)
Annually, 40,000 (17 per cent) acute gastroenteritis related outpatient visits to public
hospitals (emergency department, general outpatient department, satellite clinics and
specialist clinics), 42,000 (18 per cent) visits to public clinics (Table 4.3) and 151,000
Univers
ity of
Mala
ya

91
(65 per cent) visits to private clinics were estimated for children under-five years (Table
4.4).
The annual incidence of acute gastroenteritis related outpatient visits was 91.9
episodes per-1,000 children under-five years. (Table 4.8)
(c) Home-treated episodes
Annually, an estimated 1.2 million acute gastroenteritis episodes, among children
under-five years were treated at home. The annual incidence of home-treated acute
gastroenteritis was estimated at 475.3 episodes per 1,000 children under-five years.
(Table 4.8)
(d) Deaths
In 2008, a total of 60 (1.5 per cent) of the 3,887 deaths in children under-five years
were acute gastroenteritis related; of which 47 (78 per cent) were medically certified and
13 (22 per cent) were certified by lay persons. (Table 4.5)
In 2013, the under-five mortality rate for acute gastroenteritis was estimated at 11.96
per 100,000 live births (95 per cent CI: 9.18 to 14.74). This results in an estimated 61
diarrhoeal deaths in 2013. (Table 4.5)
The annual incidence of diarrhoeal deaths was estimated at 2.4 deaths per 100,000
children. (Table 4.8)
Table 4.8 displays the health burden of acute gastroenteritis and rotavirus
gastroenteritis, by health service utilisation in Malaysia.
Univers
ity of
Mala
ya

92
Table 4.8: Health burden of rotavirus gastroenteritis among children under-five years in Malaysia, 2013.
Annual no. of episodes Episodes per-1,000 children per-year a
Acute
gastroenteritis
related
Rotavirus
gastroenteritis
related b
Acute
gastroenteritis
related
Rotavirus
gastroenteritis
related
Deaths 61 27 0.02 0.01
Hospitalisations 70,000 31,000 27.5 12.2
Outpatient visits 234,000 41,000 91.9 16.2
Home treated episodes 1,209,000 145,000 475.3 57.0
Total 1,513,000 217,000 594.7 85.5
Note:
a Diarrhoeal episodes per-1,000 children per year, were estimated by dividing annual number of gastroenteritis episodes with the total population of children under-five years. Total
population under-five years (both sexes combined) in 2012 is 2,550,000 (Department of Statistics Malaysia, 2012b).
b To estimate the incidence of rotavirus gastroenteritis, the incidence of acute gastroenteritis is multiplied with the proportion of gastroenteritis episodes attributable to rotavirus.
(Figure 4.1, page 58).
The proportion of acute gastroenteritis attributable to rotavirus at hospital settings and for deaths (44.5 per cent) was obtained by meta-analysis (See Figure 4.3, page 98).
The proportion of acute gastroenteritis attributable to rotavirus at outpatient settings (18 per cent) and home-treated (12 per cent) was obtained from a community-based rotavirus
study (Yap et al., 1992). [See Subsection 4.2.2.5(a), page 74].
To estimate annual rotavirus deaths of 27 deaths among children under five years in Malaysia, estimated annual incidence of acute gastroenteritis (61) was multiplied with the
proportion of acute gastroenteritis attributable to rotavirus (44.5 per cent). Univ
ersity
of M
alaya

93
4.3.1.2 Proportion attributable to rotavirus among children hospitalised for acute
gastroenteritis
The systematic search of three databases provided a total of 94 citations; 39 from
Pubmed, 38 from Scopus and 17 from Web of Science. No further articles were identified
from citation search or consultation with experts. After duplicates were excluded, 27
articles on rotavirus in Malaysia were screened by title and abstract. Of these, a further
15 were excluded for not being prospective, hospital-based rotavirus surveillance studies.
Three papers were discarded for being duplicate publications based on results of the same
primary studies52. Full text articles of the remaining nine papers were read, and the
eligibility criteria was applied.
A PRISMA flow diagram of the review process is shown in Figure 4.2.
52 Duplicate publications refers to multiple publications of the same primary study. The primary study was published more than
once on different aspects.
Univers
ity of
Mala
ya

94
Figure 4.2: PRISMA flow diagram on the systematic review of hospital-based rotavirus studies in Malaysia
Note:
EIA- Enzyme immunoassay test; PRISMA- Preferred Reporting Items for Systematic Reviews and Meta-Analyses;
Duplicate publications refers to multiple publication of the same primary study material. Univ
ersity
of M
alaya
95
From 1982 to 2012, there were nine prospective hospital-based rotavirus surveillance
studies conducted in Malaysia. These studies were conducted at Kuala Lumpur, and other
locations including Kuching in Sarawak, Kota Kinabalu in Sabah, Johor Baru in Johor
and Kuala Terengganu in Terengganu. Only three studies were conducted among children
under-five years old. Five of the nine studies used EIA methods to test stool specimens
for rotavirus. A total of 9,510 stool specimens were tested for rotavirus, with the rotavirus
detection proportion of between 23 per cent and 50 per cent at each site.
Of these nine hospital-based rotavirus surveillance studies, a total of three studies met
the predetermined eligibility criteria and were included in the meta-analysis (Hsu et al.,
2005; Hung et al., 2006; Lee et al., 2012). These studies were conducted at different time
points between the year 2000 and 2010, and at different geographic locations in Malaysia.
A total of 5,586 stool samples were tested for rotavirus. The rotavirus detection
proportion ranged from 32 per cent to 50 per cent at each individual study site (Table
4.9).
Each of these three studies were conducted at two study locations. The study by Lee
et al was conducted in Kuala Lumpur and Kuala Terengganu (Lee et al., 2012). While the
study by Hung et al. and the study by Hsu et al were both conducted in Kuala Lumpur
and Kuching (Hsu et al., 2005; Hung et al., 2006). With exception of the Hsu et al. paper,
which reported a summary figure for both sites, each of the published papers reported
rotavirus detection proportions for each individual study site (Table 4.9).
Table 4.9 provides a summary of the three prospective hospital-based rotavirus
surveillance studies selected for the meta-analysis.
Univers
ity of
Mala
ya

96
Table 4.9: Summary of the hospital-based rotavirus studies selected for meta-analysis
Study
Period
Study
length
Age
group
(years)
RV-detection
method
Location No. of
cases
tested
No. of RV
positives
RV-
detection
proportion
References
2001-2003 2 years < 5 EIA Kuala Lumpur &
Kuching 2260 1130 50% (Hsu et al., 2005)
2002–2003 2 years < 5 EIA Kuala Lumpur 1756 820 47% (Hung et al., 2006)
Kuching 912 445 49%
2008–2010 2 years < 5 EIA
Kuala Lumpur 385 161 42% (Lee et al., 2012)
Kuala Terengganu 273 87 32%
Note:
RV- Rotavirus; EIA - Enzyme Immunoassay test; < 5, indicates children under-five years of age.
Univers
ity of
Mala
ya

97
The rotavirus detection proportion from five individual study sites from these three
papers were pooled for the meta-analysis. As there was considerable heterogeneity
(I2 = 81 per cent), a random effects model was applied for the meta-analysis. The pooled
estimates of the rotavirus detection proportion in children under-five years hospitalised
for acute gastroenteritis was 44.5 per cent (95 per cent CI: 39.6 to 49.4).
Figure 4.3 displays the forest plot and details the meta-analysis of rotavirus detection
proportions from prospective hospital-based studies conducted in Malaysia.
Univers
ity of
Mala
ya
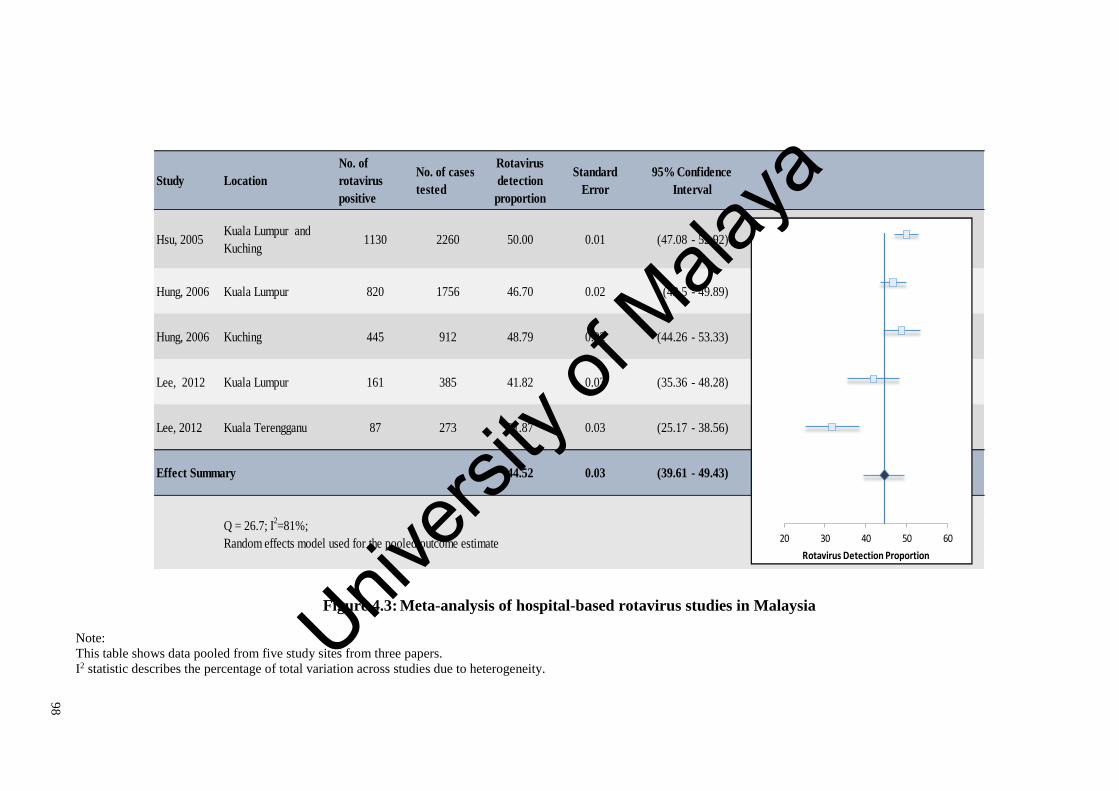
98
Figure 4.3: Meta-analysis of hospital-based rotavirus studies in Malaysia
Note:
This table shows data pooled from five study sites from three papers.
I2 statistic describes the percentage of total variation across studies due to heterogeneity.
Study Location
No. of
rotavirus
positive
No. of cases
tested
Rotavirus
detection
proportion
Standard
Error
Hsu, 2005 Kuala Lumpur and
Kuching1130 2260 50.00 0.01 (47.08 - 52.92)
Hung, 2006 Kuala Lumpur 820 1756 46.70 0.02 (43.5 - 49.89)
Hung, 2006 Kuching 445 912 48.79 0.02 (44.26 - 53.33)
Lee, 2012 Kuala Lumpur 161 385 41.82 0.03 (35.36 - 48.28)
Lee, 2012 Kuala Terengganu 87 273 31.87 0.03 (25.17 - 38.56)
44.52 0.03 (39.61 - 49.43)
Q = 26.7; I2=81%;
Random effects model used for the pooled outcome estimate
95% Confidence
Interval
Effect Summary
20 30 40 50 60
Rotavirus Detection Proportion
Univers
ity of
Mala
ya

99
4.3.1.3 Incidence of rotavirus gastroenteritis
Approximately 27 rotavirus-related deaths were estimated to occur annually.
Rotavirus gastroenteritis was estimated to result in 31,000 hospitalisations (75 per cent to
the public sector and 25 per cent to the private sector), 41,000 outpatient visits (35 per
cent to the public sector and 65 per cent to the private sector) and 145,000 episodes that
are home treated (67 per cent of total episodes), annually. (Table 4.8)
The annual incidence of rotavirus among children under-five years was estimated at
one death per-100,000 children; 12.2 hospitalisations per-1,000 children; 16.2 outpatient
clinic visits per-1,000 children and 57.0 home-treated cases per-1,000 children.
(Table 4.8)
4.3.2 Economic burden
Direct medical costs were estimated at RM 3,153 per-episode requiring hospitalisation
and RM 174 per-episode receiving outpatient care (Table 4.10). Direct non-medical costs
were estimated at RM 62, RM 23 and RM 10 respectively, for episodes requiring
hospitalisation, outpatient and home-treatment (Table 4.11). Indirect costs were estimated
at RM 213 per-episode of rotavirus gastroenteritis53 (Table 4.12).
Annually, rotavirus gastroenteritis was estimated to incur direct medical costs of RM
105 million, for hospitalisations and outpatient visits. Of the direct medical costs, RM 72
million (68 per cent) were costs to the public sector, and RM 34 million (32 per cent)
were costs to the private sector (Table 4.10).
Rotavirus was estimated to cost RM 156 million to society annually, of which a third
was contributed by indirect costs (RM 46 million). Publicly, privately and home-treated
episodes consist of 52 per cent, 27 per cent and 21 per cent of total societal costs. In
Malaysia, rotavirus gastroenteritis was estimated to cost RM 61 per child under-five years
53 Costs per-episode of rotavirus gastroenteritis was estimated by dividing total costs by the total number of rotavirus episodes.
Univers
ity of
Mala
ya

100
annually54. This translates to societal costs of RM 3,153 per-episode requiring
hospitalisation, RM 410 per-episode receiving outpatient care and RM 223 per home-
treated episode (Table 4.13).
Table 4.10, Table 4.11 and Table 4.12 detail the estimation of direct medical, direct
non-medical and indirect costs for rotavirus gastroenteritis in Malaysia according to
health service utilisation.
Table 4.13 provides the economic burden of rotavirus gastroenteritis among children
under-five years in Malaysia.
54 Total societal costs of rotavirus diarrhoea (RM 156 million) was divided by the population of children under-five years (2.6
million) in Malaysia, to obtain annual societal costs of RM 61 per child under-five years in Malaysia.
Univers
ity of
Mala
ya

10
1
Table 4.10: Estimation of direct medical costs for rotavirus gastroenteritis among children under-five years in Malaysia, 2013
Rotavirus episodes
(‘000)
Unit costs
per episode
(RM)
Direct medical costs
(‘000 RM)
Hospitalisations a, b
Public hospital 23 3,022 70,272
Private hospital 8 3,540 27,948
Outpatient visits c
Public hospital 7 192 1,368
Public clinic 7 12 88
Private clinic 27 215 5,726
Home treated episodes 145 0 -
TOTAL 217 105,402
Note:
All costs are in 2013 RM;
a Unit costs of inpatient services of RM 944 per bed-day was estimated for public facilities, and RM 1,073 per bed-day was estimated for private facilities. Estimation of unit costs
detailed in Subsection 4.2.3.1(c)i, page 82. See Table 4.7.
b To obtain cost per inpatient treated episode, the average duration of admission (3.3 days) was multiplied with cost per bed-day (Lee et al., 2012)
c Unit costs for outpatient visits of RM 192 was estimated for public hospital outpatients, RM 12 for public clinic outpatients and RM 215 for private clinic outpatients. Estimation of
unit costs are detailed in Subsection 4.2.3.1(c)ii, page 87. See Table 4.7. Univers
ity of
Mala
ya

10
2
Table 4.11: Estimation of direct non-medical costs for rotavirus gastroenteritis among children under-five years in Malaysia, 2013
Rotavirus
episodes
(‘000)
Transportation
costs
per-episode a
(RM)
Total
transportation
costs
(‘000 RM)
Diaper costs
per-episode b
(RM)
Total
diaper
costs
(‘000 RM)
Food costs
per-episode c
(RM)
Total food
costs
(‘000 RM)
Direct non-
medical
costs
(‘000 RM)
Hospitalisations
Public hospital 23 49 1,128 10 236 0.72 52 1,417
Private hospital 8 52 410 10 80 0.72 18 507
Outpatient visits
Public hospital 7 24 173 10 72 0 0 246
Public clinic 7 8 63 10 76 0 0 139
Private clinic 27 11 302 10 271 0 0 573
Home treated episodes 145 0 0 10 1,474 0 0 1,474
TOTAL 217 2,076 2,209 70 4,356
Note:
All costs are in 2013 RM; RVGE, rotavirus gastroenteritis;
a One way transportation costs obtained from the National Health and Morbidity Survey 2011. Costs were doubled for outpatient episodes and quadrupled for inpatient episodes;
b Diaper costs per-episode obtained from the average costs for both hospitals were used in the 2010 hospital-based study (Lee et al., 2012);
c Additional food costs for an episode of diarrhoea hospitalised at University of Malaya Medical Centre was used for inpatient episodes . Univers
ity of
Mala
ya
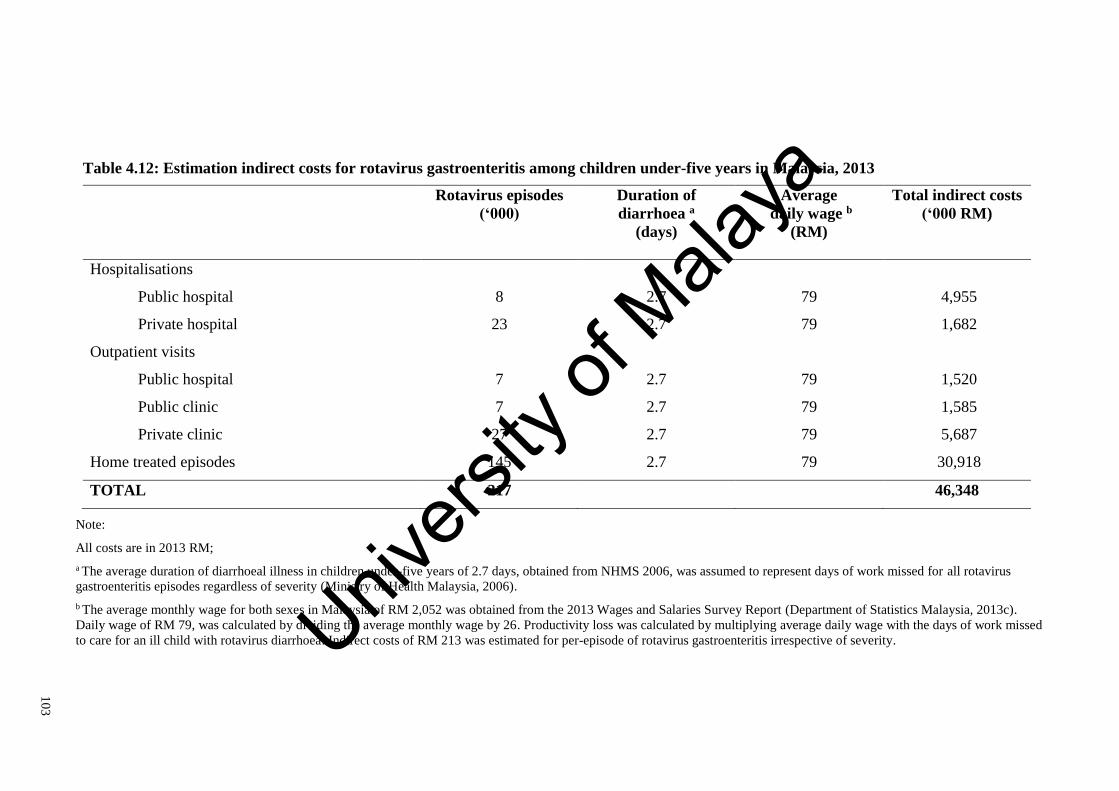
10
3
Table 4.12: Estimation indirect costs for rotavirus gastroenteritis among children under-five years in Malaysia, 2013
Rotavirus episodes
(‘000)
Duration of
diarrhoea a
(days)
Average
daily wage b
(RM)
Total indirect costs
(‘000 RM)
Hospitalisations
Public hospital 8 2.7 79 4,955
Private hospital 23 2.7 79 1,682
Outpatient visits
Public hospital 7 2.7 79 1,520
Public clinic 7 2.7 79 1,585
Private clinic 27 2.7 79 5,687
Home treated episodes 145 2.7 79 30,918
TOTAL 217 46,348
Note:
All costs are in 2013 RM;
a The average duration of diarrhoeal illness in children under-five years of 2.7 days, obtained from NHMS 2006, was assumed to represent days of work missed for all rotavirus
gastroenteritis episodes regardless of severity (Ministry of Health Malaysia, 2006).
b The average monthly wage for both sexes in Malaysia of RM 2,052 was obtained from the 2013 Wages and Salaries Survey Report (Department of Statistics Malaysia, 2013c).
Daily wage of RM 79, was calculated by dividing the average monthly wage by 26. Productivity loss was calculated by multiplying average daily wage with the days of work missed
to care for an ill child with rotavirus diarrhoea. Indirect costs of RM 213 was estimated for per-episode of rotavirus gastroenteritis irrespective of severity. Univers
ity of
Mala
ya

10
4
Table 4.13: Economic burden of rotavirus gastroenteritis among children under-five years in Malaysia, 2013
Rotavirus
episodes
(‘000)
Direct medical
costs a
(RM ‘000)
Direct non-
medical costs b
(RM ‘000)
Indirect costs c
(RM ‘000)
Total costs
(RM ‘000)
Hospitalisations
Public hospital 23 70,272 1,417 4,955 76,644
Private hospital 8 27,948 507 1,682 30,138
Outpatient visits
Public hospital 7 1,368 245 1,520 3,133
Public clinic 7 88 139 1,585 1,812
Private clinic 27 5,726 573 5,687 11,987
Home treated episodes 145 - 1,474 30,919 32,393
TOTAL 217 105,402 4,356 46,348 156,107
Note:
All costs are in 2013 RM;
a Direct medical costs were estimated at RM 3,153 per-episode requiring hospitalisation and RM 171 per-episode receiving outpatient care. Direct medical costs were divided by
number of rotavirus episodes to derive costs per-episode. See Table 4.10 for detailed estimation of direct medical costs;
b Direct non-medical costs were estimated at RM 62 per-episode requiring hospitalisation, RM 23 per-episode receiving outpatient care and RM 10 per home-treated episode. Direct
non-medical costs were divided by number of rotavirus episodes to derive costs per-episode. See Table 4.11 for detailed estimation of direct non-medical costs;
c Indirect costs per-episode of rotavirus gastroenteritis was estimated at RM 213 per-episode. Indirect costs per-episode of rotavirus gastroenteritis is calculated by multiplying the
average daily wage with the average duration of diarrhoeal illness. See Table 4.12 for detailed estimation of indirect costs. Univers
ity of
Mala
ya

105
4.4 Discussion
This study found that rotavirus has a substantial health and economic burden in
Malaysia. It is estimated that rotavirus gastroenteritis results in 27 deaths, 31,000
hospitalisations, 41,000 outpatient visits and 145,000 episodes of home-treated diarrhoea,
annually. Rotavirus incidence is estimated at one death per 100,000 children and 12
hospitalisations, 16 outpatient clinic visits, and 57 home-treated episodes per-1,000
children under-five years, annually (Table 4.8). Annually, rotavirus gastroenteritis was
estimated to cost RM 105 million to the healthcare providers and RM 156 million to
society. Productivity loss accounts for a third of the societal burden (RM 46 million).
(Table 4.13)
This current work is the most recent and comprehensive estimation of national burden,
and the only one to include data on annual discharges and outpatient visits from both
public and private facilities. This study demonstrates the considerable health burden of
rotavirus diarrhoea presenting to the private sector (25 per cent of inpatient treated and
65 per cent of outpatient treated episodes) and treated at home (67 per cent of total
episodes) that were previously not adequately considered. These privately and home-
treated episodes consist of 27 per cent and 21 per cent of total societal costs for rotavirus
gastroenteritis in Malaysia.
Only one previous estimate of rotavirus burden in Malaysia has been published, and
this inadequately considered privately treated episodes (Hsu et al., 2005). The study by
Hsu et al. found that 3.3 per-1,000 children were hospitalised for rotavirus gastroenteritis
in 1998, which may have been an underestimation. There are three main reasons for the
differences in estimates rotavirus hospitalisations.
Firstly, Hsu et al. reported 27,873 acute gastroenteritis related discharges among
children under-five years to MOH hospitals during the two-year study period (1999 to
2000). This translates to an average of 13,937 acute gastroenteritis related discharges
Univers
ity of
Mala
ya

106
reported annually to the MOH national database in that period. This figure is much less
than the average of 21,000 acute gastroenteritis discharges reported annually from 2008
to 2013 (Table 4.1). A possible explanation for this is that the ICD-10 diagnostic coding
of discharges has improved since the Hsu et al. study. The Hsu et al. study was conducted
during the early years of establishment of the national database55. During this period, not
all discharges were coded with ICD-10 diagnostic codes, resulting in considerable under-
reporting of acute gastroenteritis.
Secondly, the Hsu et al. study did not directly collect private hospital discharges, as
the national database only began compiling data from private hospitals after the year
2000. Hsu et al. adjusted for an additional 20 per cent of hospitalisations occurring at the
private sector, estimating a total of 8,571 rotavirus-related hospitalisations annually in
public and private hospitals in Malaysia. This estimate for rotavirus hospitalisations is
very much lower than our current estimate. From 2010 to 2013, the national database
captured an annual average of 17,000 acute gastroenteritis related discharges in children
under-five years to private hospitals in Malaysia. (Table 4.1)
Thirdly, public hospitals not administered by MOH, including eight university and
army hospitals, do not contribute hospital discharge data to the national database
(Ministry of Health Malaysia, 2012b). In this current study, diarrhoeal discharges were
adjusted using weightage of hospital beds, to account for all diarrhoeal discharges in
Malaysia, including from facilities not reporting discharges to the national database.
Hospitals not reporting discharges were not accounted for in the Hsu et al study. (Table
4.2)
The current study findings of 12.2 rotavirus hospitalisations per-1000 children per-
year in Malaysia is within the range of results of a 2012 systematic review of the burden
of rotavirus gastroenteritis in Asia. Kawai et al. (2012) found the incidence rotavirus-
55 The national database started collecting public hospital discharges from MOH hospitals in 1999. The data collected by Hsu et
al. was from 1999 to 2000.
Univers
ity of
Mala
ya

107
related hospitalisation among children under-five years ranged from 2.1 to 20.0 episodes
per-1000 children per-year in Asia.
The Hsu et al. (2005) study was likely to have underestimated the incidence of
rotavirus outpatient visits, as this study failed to account for outpatient visits to private
healthcare facilities in Malaysia. The previous study findings of 5.5 rotavirus-related
outpatient visits per-1000 children under-five years did not include visits to private
facilities.
It was important in this current study to include an estimate of outpatient visits to
private facilities, as a substantial portion of the population utilises private healthcare in
Malaysia. The NHMS 2006 found that 64 per cent of children seeking outpatient
treatment for a recent illness sought private care (Ministry of Health Malaysia, 2006).
The current estimate of 16.2 rotavirus-related outpatient visits per-1,000 children
annually in Malaysia, is similar to findings from India (15.0 per-1,000 children),
Philippines (12.1 per-1,000 children) and China (20.1 per-1,000 children) (Carlos et al.,
2009; Lou, Xu, Wu, Tao, & Tong, 2011; Tate, Chitambar, et al., 2009). Also, the study
findings are within the range of the Kawai et al. (2012) estimates for Asia of 5.6 to 45.3
rotavirus-related outpatient visits per-1000 children per-year.
This study found that 145,000 episodes of mild rotavirus gastroenteritis did not seek
medical treatment, resulting in RM 32 million in indirect and direct non-medical costs,
or 21 per cent of the total economic burden to society. This considerable hidden burden
has not been previously explored in Malaysia. Although, mild diarrhoeal episodes do not
present to the healthcare system, these are an important societal burden. Children with
mild diarrhoea still require caregiver’s time, incurring productivity loss. However,
estimating episodes treated at home has inherent uncertainty, as these episodes are not
directly captured in inpatient or outpatient records and can only be derived by examining
community healthcare utilisation patterns.
Univers
ity of
Mala
ya

108
The estimates of home-treated episodes in this study, are based on health utilisation
patterns from the only community-based study in Malaysia (Yap et al., 1992). While this
study may be dated, it is the only community-based rotavirus study in Malaysia. In
addition, on examining a series of National Health and Morbidity Surveys (1996, 2006,
and 2011), it was found that health utilisation patterns for children under-five years
seeking care for acute illness in Malaysia, did not change greatly in the fifteen year period
examined (Ministry of Health Malaysia, 1996, 2006, 2011b).
The results of estimation of home-treated rotavirus gastroenteritis in this thesis is
comparable with those of two international studies (J. Bilcke et al., 2009; Parashar et al.,
2003).
Parashar et al. (2003) estimated that for every child requiring medical attention for
rotavirus gastroenteritis, an additional three to five children develop illness that requires
only home-treatment. The current study findings suggest that in Malaysia, the number of
children with rotavirus diarrhoea that were home-treated (145,000) was about 3.5 times
the number who sought outpatient care (41,000). This is within the range of estimates of
home-treated episodes obtained when using the Parashar et al. expansion factor of four
times of outpatient episodes (home-treated episodes range from 124,000 to 206,000 in
Malaysia).
The J. Bilcke et al. (2009) meta-analysis estimated the global incidence of
symptomatic rotavirus infections at 0.31 (0.19 to 0.50) per-person per-year in children
under-two years. This would mean an annual average of 315,000 (193,000 to 509,000)
symptomatic episodes in children under-two years in Malaysia. The current study
estimate of 218,000 episodes of symptomatic rotavirus annually, among children under-
five years in Malaysia, is well below this estimate.
Using national mortality data, this study estimated 61 acute gastroenteritis related
deaths for 2013. There were 27 rotavirus deaths estimated in 2013, with an annual
Univers
ity of
Mala
ya

109
rotavirus mortality rate of 1.0 deaths per-100,000 children under-five years. These
findings are consistent with those estimated for Malaysia, by the Child Health
Epidemiology Reference group (CHERG) for WHO and UNICEF of 55 diarrhoeal deaths
in 2010 (Liu et al., 2012) and slightly higher than the WHO estimate of 15 rotavirus
deaths in 2008 (Tate et al., 2012). While rotavirus deaths are not high in Malaysia, these
deaths are preventable with vaccination. Rotavirus vaccines have an important role in
reducing child mortality.
The current estimation of the economic burden of rotavirus gastroenteritis on the
health system in Malaysia is much higher than the estimation by Lee et al. (2007), of US$
1.8 million (RM 6.8 million) in 2002. This 2002 estimation was based on average direct
medical costs per-episode of rotavirus hospitalisation obtained from one university
hospital and extrapolated for the whole country. The 2002 estimation was from the
healthcare provider’s perspective and did not consider costs to the private sector and
episodes treated as outpatient or at home.
The current study findings estimated the healthcare costs for treatment of rotavirus
requiring hospitalisation and outpatient treatment, as well as non-medical and indirect
costs to society. The estimate of annual societal costs for rotavirus gastroenteritis of RM
61 (US$ 19) for a child under-five years in Malaysia, is similar to estimates for upper-
middle income countries of US$ 15, when inflated to 2013 values (R. D. Rheingans et
al., 2009). Comparing costs between countries are difficult because of inherently different
economies, healthcare systems and different assumptions and methodologies used in the
evaluations. However, the current estimation of direct medical costs per hospitalised
episode of rotavirus of RM 3,153 (US$ 1,000) are comparable to costs in high-income
countries in Asia like Japan (US$ 1,500-2,000) (Ito et al., 2011; Nakagomi et al., 2005;
Sato, Nakagomi, & Nakagomi, 2011), Taiwan (US$ 330-760) (Chen et al., 2007; Lu et
Univers
ity of
Mala
ya

110
al., 2006; Mast et al., 2010), and Hong Kong (US$ 2,500) (E Anthony S Nelson et al.,
2005) when costs are inflated to 2013 values.
This study has several limitations. Firstly, as there are no official unit costs for
healthcare facilities in Malaysia, costs were estimated based on top-down costing
methods (D. S. Shepard et al., 2000; D. S. Shepard et al., 2012; Suaya et al., 2009).
Nevertheless, this current estimation is robust, as it used local data costing data from
annual reports of five tertiary-level hospitals, costing studies of six primary-level
hospitals and eleven health clinics, in addition to unit costs from WHO-CHOICE, to
account for public and private healthcare facilities in Malaysia. Although these costing
data are from different time frames, they are the best available to account for healthcare
costs in diverse segments of the health sector in Malaysia.
Secondly, the estimation of outpatient attendances to public health facilities is
conservative. Data from MOH captures outpatient attendances to MOH hospitals and
primary healthcare clinics, but does not capture treatment for childhood diarrhoea given
by nurses or midwives at maternal and child health clinics at MOH facilities56. These
episodes can be assumed to be mild, as they are not referred to be treated by a medical
officer. Also the reported data does not capture diarrhoeal outpatient visits to non-MOH
public clinics (like university hospitals and army hospitals). However, the NHMS 2006
found that among children under-five years with self-reported diarrhoeal illness, only 1.4
per cent sought outpatient care at army hospitals and none sought outpatient care at
university hospitals (Ministry of Health Malaysia, 2006, p. 68). As such, diarrhoeal
outpatient visits to non-MOH public clinics were assumed to be negligible in this thesis.
56 The MOH public health facilities, provide maternal child health (MCH) services in addition to general outpatient services, at
various levels of care depending the facilities and the needs of the population. MCH clinics may be located in facilities together with
outpatient services or in separate, smaller clinics close to villages and communities. MCH services are provided by nurses and
midwifes at smaller clinics, but also by medical officers’ and Family Medicine Specialists’ at larger health centres. Returns on outpatient diarrhoeal attendances are not recorded or collected at MCH clinics. MCH clinics provide child health
services, and are mainly Well Baby Clinics, monitoring growth and development, nutrition and administering immunisations (Noor
Ghani & Yadav, 2008). Mild diarrhoeal illness may be treated by nurses especially in smaller community clinics, but more severe episodes would be referred to the outpatient department for treatment by medical officers.
Univers
ity of
Mala
ya

111
Since all except one study on rotavirus in Malaysia were hospital-based, the rotavirus
detection proportion at outpatient clinics and for home-treated episodes was obtained
from the only community-based rotavirus study conducted in 1988 (Yap et al., 1992).
Nevertheless, the rotavirus detection proportion at outpatient clinics in Malaysia of 18
per cent is comparable to a 2012 pooled estimate of outpatient-based rotavirus studies in
Asia of 23 per cent (Kawai et al., 2012). In addition, the rotavirus detection proportion
for home-treated cases in Malaysia of 12 per cent is similar to the results of a community-
based study conducted in Thailand (12.2 per cent) (Jiraphongsa et al., 2005).To better
represent the proportion of acute gastroenteritis requiring hospitalisation, attributable to
rotavirus for Malaysia, a meta-analysis was conducted of primary studies conducted at
different time-points and regions in the country.
The estimation of transportation costs is conservative, as one-way transportation costs
from NHMS 2011 was doubled for outpatient visits and quadrupled for hospitalisations.
This resulted in an estimated transportation costs of RM 52 and RM 48 per-episode for
private and public hospitals, based on data from NHMS 2011. This estimate is
comparable to findings of a 2010 hospital-based rotavirus study at two public hospitals
in Malaysia. In this 2010 study, average transportation costs for an episode of rotavirus
gastroenteritis requiring hospitalisation in Kuala Lumpur was RM 60, while at Kuala
Terengganu transportation costs was about RM 6 in 2013 RM. (Table 6.3, page 193).
The estimation for lost productivity is conservative, as days of work missed was
assumed to be the same for all diarrhoea episodes, regardless of severity. In addition, the
emotional impact of caring for a child with diarrhoea is not captured here. The stress and
anxiety of caring for an ill child, or a qualitative loss of productivity beyond lost wages,
could translate to higher economic costs, and is an avenue for future research. For the
cost-effectiveness analysis, the health burden was expressed in terms of quality adjusted
life years (QALYs). Health evaluation was conducted using Health Utility Index Mark 2
Univers
ity of
Mala
ya

112
(HUI 2) questionnaires in children and EuroQoL 5D (EQ-5D) in adults, which measures
quality of life over multiple dimensions including emotion and pain. Chapter 5 details the
evaluation of cost-effectiveness of rotavirus vaccines in Malaysia.
Also, this study does not consider expenditure for informal care as this is not relevant
in the Malaysian setting. The NHMS 2006 found that less than three per cent of children
under-five years with acute diarrhoea sought care at non-medical facilities, like traditional
healers or Chinese medicine shops (Ministry of Health Malaysia, 2006).
4.5 Conclusion
A comprehensive estimation of rotavirus gastroenteritis burden is necessary when
considering the benefits of vaccines in preventing illness. This chapter demonstrates the
considerable burden of rotavirus gastroenteritis in Malaysia, including episodes treated
privately and at home, which were not well captured in previous studies. This provides
vital information for the evaluation of cost-effectiveness and the broader economic
impacts of vaccination, which are necessary for policy-making regarding universal
vaccination.
In the next chapter, the cost-effectiveness and affordability of universal rotavirus
vaccination are evaluated from the healthcare provider and societal perspectives in
Malaysia.
Univers
ity of
Mala
ya

113
CHAPTER 5: THE COST-EFFECTIVENESS AND AFFORDABILITY OF
ROTAVIRUS VACCINATION IN MALAYSIA
5.1 Introduction
Rotavirus vaccines are widely regarded as cost-effective interventions in many countries
(Atherly et al., 2012; R. D. Rheingans et al., 2009). However, high vaccine prices are a
barrier for public finance of rotavirus vaccines in middle-income countries (Madsen et
al., 2012; E. A. S. Nelson et al., 2013).
While cost-effectiveness analysis is designed to assess value for money, the
affordability of vaccination programmes is of practical concern to budget holders. As
Malaysia lacks a national threshold for the determination of cost-effectiveness of medical
technologies, WHO-CHOICE thresholds have been used as an informal reference for
cost-effectiveness. However, the WHO-CHOICE thresholds were meant for regional
priority setting, and have acknowledged short-comings when used to inform national
policy. The WHO-CHOICE thresholds are easily achieved and its use does not consider
the affordability of interventions within the context of finite budgets. This reduces the
value of cost-effectiveness analysis in informing resource allocation decisions (Marseille,
Larson, Kazi, Kahn, & Rosen, 2015; Newall et al., 2014; Shillcutt, Walker, Goodman, &
Mills, 2009).
In this chapter, the cost-effectiveness and affordability of incorporating rotavirus
vaccines into the Malaysian national immunisation programme were evaluated. Cost-
effectiveness was explored using various thresholds determined for Malaysia, with the
aim of informing vaccine price negotiation. The chapter begins with Section 5.2, which
presents study methods, data sources and assumptions used for the cost-effectiveness,
threshold and budget impact analysis of rotavirus vaccines in Malaysia. Next Section 5.3,
presents the results of this study. This is followed by Section 5.4, which discusses study
Univers
ity of
Mala
ya
114
findings, limitations and its policy relevance. The chapter ends with Section 5.5, which
provides concluding statements.
5.2 Materials and methods
5.2.1 Study overview
In this chapter, cost-effectiveness of universal rotavirus vaccination in Malaysia is
compared with the current scenario of ‘no vaccination’. The cost-effectiveness of both
Rotarix® and RotaTeq® were considered separately, from the healthcare provider’s and
societal perspective. The impact of rotavirus vaccines in reducing the health and
economic burden of rotavirus gastroenteritis episodes was determined.
Cost-effectiveness was evaluated using the POLYMOD model, an age-stratified,
static, multi-cohort model. Multiple cohorts of vaccinated and unvaccinated children,
based on the 2012 Malaysian birth cohort of 508,774 live births (Department of Statistics
Malaysia, 2012b), were followed from birth to age five years. Subsection 5.2.2 provides
the rationale for the use of mathematical modeling in evaluating cost-effectiveness and
explains the choice of models used in this current analysis.
The estimation of the health and economic burden of rotavirus gastroenteritis was
detailed in Chapter 4. Results of that estimation provided inputs on rotavirus incidence
and costs in Malaysia, for use in the cost-effectiveness analysis. Rotavirus gastroenteritis
was divided into episodes requiring home-treatment, outpatient consultation, hospital
admission, and those resulting in death.
The effectiveness outcome was expressed as the incremental cost-effectiveness ratio
(ICER) or the ratio of net costs per unit of health benefits gained from vaccination. The
ICER was reported in terms of net costs per-QALY gained. Net costs were defined as
vaccination costs less the cost savings from reduced illness post vaccination. Health
benefits were valued in QALYs.
Univers
ity of
Mala
ya

115
In the base-case, the cost-effectiveness of Rotarix® was evaluated from the healthcare
provider’s perspective. In alternate scenarios, cost-effectiveness of RotaTeq® was
evaluated and also from the societal perspective. In the base-case, QALY loss for the
child and one caregiver was assumed. Health Related Quality of Life (HRQoL) weights
for a home-treated episode of rotavirus gastroenteritis was assumed to be fifty per cent of
episodes requiring medical care57. The Pan American Health Organization (PAHO)
Revolving Fund prices58 were used in the base-case, as the most likely tender price for
rotavirus in Malaysia (Ministry of Health Malaysia, 2014a; PAHO, 2013). The
Recommended Retail Price for Malaysia was used as the most likely market price.
A time horizon of five years was chosen for the cost-effectiveness analysis, as
rotavirus gastroenteritis commonly occurs in children under-five years (World Health
Organization, 2013d). All future costs and benefits were discounted at the rate of three
per cent per annum, as recommended by the WHO (Walker, Hutubessy, & Beutels, 2010).
Parameters in the model are listed in Table 5.1. The assumptions in the base-case and
alternative scenarios are presented in Table 5.2. Subsection 5.2.3 explains the economic
assumptions and the parameters used in the model.
As Malaysia has not defined a threshold for cost-effectiveness, this chapter explores
cost-effectiveness using three different thresholds for Malaysia. Threshold analysis was
conducted to inform on cost-effective vaccine prices for vaccine price negotiations.
Vaccine affordability was assessed with a budget impact analysis, comparing annual costs
of vaccination programmes with the Malaysian public health budget.
Subsection 5.2.4 details the assumptions behind the scenarios tested during the
sensitivity analysis. Subsection 5.2.5 explains the rationale behind the cost-effectiveness
57 The HRQoL weights were obtained from a Canadian study conducted in an outpatient setting (Sénécal et al., 2008). Hence in
this thesis, QALY loss for home-treated episodes was assumed to be fifty per cent of children treated at an outpatient setting. This
assumption was previously used in the economic evaluation of rotavirus vaccines in the United Kingdom (Jit et al., 2009).The rationale
behind these assumptions are explained in Subsection 5.2.3.3, page 136. 58 The PAHO Revolving Fund for vaccine procurement in the Americas region, ensures the lowest negotiable vaccine prices
worldwide through pooled purchasing mechanisms (E. A. S. Nelson et al., 2013).
Univers
ity of
Mala
ya

116
thresholds and the methodology used for the threshold analysis. This is followed by
Subsection 5.2.6, which presents the rationale and methods for the budget impact
analysis.
The base year for analysis was 2013. All costs were inflated to 2013 RM using GDP
deflators (Department of Statistics Malaysia, 2012a). The 2013 World Bank exchange
rate of US$ 1 to RM 3.15 was used for conversions (World Bank, 2014a). Analysis was
conducted using Microsoft Excel® Professional Plus 2013.
Univers
ity of
Mala
ya

117
Table 5.1: Parameters used in the model
Parameter Value Source
Demographics
Life expectancy at birth (years) 74 (World Health Organization, 2012a)
Infant mortality rate (per-1,000 live births) 7 (World Health Organization, 2012b)
Under-five mortality rate (per-1,000 live
births)
9 (World Health Organization, 2012b)
Population under-five years 2,426,958 (United Nations, 2013)
Birth cohort 508,774 (Department of Statistics Malaysia,
2012b)
Incidence of rotavirus gastroenteritis
Deaths (per-100,000 children per-year) 1 Chapter 4, page 99
Hospitalisation (per-1,000 children per-year) 12 Chapter 4, page 99
Outpatient visits(per-1,000 children per-
year)
16 Chapter 4 page 99
Home-treatment(per 1,000 children per-
year)
57 Chapter 4, page 99
Utilities
QALYs for an episode
Child 0.0022 (Brisson, Sénécal, Drolet, & Mansi, 2010)
Caregiver 0.0018 (Brisson et al., 2010)
Cost of illness
Direct medical costs
Hospitalisation RM 3,153 Chapter 4, page 99
Outpatient visits RM 174 Chapter 4, page 99
Direct non-medical costs
Hospitalisation RM 62 Chapter 4, page 99
Outpatient visits RM 23 Chapter 4, page 99
Home-treatment RM 10 Chapter 4, page 99
Indirect costs RM 213 Chapter 4, page 99
Vaccination Programme
Vaccine coverage 97% (World Health Organization, 2013b)
Vaccine wastage 5% (World Health Organization, 2014b)
Vaccine procurement costs per-dose
PAHO revolving fund price
Rotarix® RM 20 (PAHO, 2013)
RotaTeq® RM 16 (PAHO, 2013)
Market price
Rotarix® RM 139 (Ministry of Health Malaysia, 2014a)
RotaTeq® RM 116 (Ministry of Health Malaysia, 2014a)
Additional administrative cost RM 15 (De la Hoz-Restrepo, Castaneda-Orjuela,
Paternina, & Alvis-Guzman, 2013)
Univers
ity of
Mala
ya

118
Table 5.1: Parameters used in the model (Continued)
Parameter Value Source
Vaccine efficacy
Rotarix®
One-dose efficacy:
Hospitalisation 96% (Vesikari, Karvonen, et al., 2007)
Outpatient visits 88% (Vesikari, Karvonen, et al., 2007)
Home-treatment 87% (Vesikari, Karvonen, et al., 2007)
Two-dose efficacy:
Hospitalisation 100% (Vesikari, Karvonen, et al., 2007)
Outpatient visits 92% (Vesikari, Karvonen, et al., 2007)
Home-treatment 87% (Vesikari, Karvonen, et al., 2007)
Waning immunity (First to second season)
Hospitalisation 92% (Vesikari, Karvonen, et al., 2007)
Outpatient visits 83% (Vesikari, Karvonen, et al., 2007)
Home-treatment 83% (Vesikari, Karvonen, et al., 2007)
RotaTeq®
One-dose efficacy:
Hospitalisation 82% (Iwata et al., 2013)
Outpatient visits 66% (P. H. Dennehy et al., 2011; Iwata et al.,
2013)
Home-treatment 62% (P. H. Dennehy et al., 2011; Iwata et al.,
2013)
Two-dose efficacy:
Hospitalisation 84% (Iwata et al., 2013)
Outpatient visits 68% (P. H. Dennehy et al., 2011; Iwata et al.,
2013)
Home-treatment 63% (P. H. Dennehy et al., 2011; Iwata et al.,
2013)
Complete dose efficacy:
Hospitalisation 100% (Iwata et al., 2013)
Outpatient visits 81% (Iwata et al., 2013)
Home-treatment 75% (Iwata et al., 2013)
Waning immunity (First to second season)
Hospitalisation 90% (Vesikari et al., 2006)
Outpatient visits 85% (Vesikari et al., 2006)
Home-treatment 85% (Vesikari et al., 2006)
Note:
All costs are in 2013 RM;
PAHO, Pan American Health Organization; QALY, Quality adjusted life years.
Univers
ity of
Mala
ya

11
9
Table 5.2: Assumptions in the base-case and alternative scenarios
Base-case Alternative Scenarios
Vaccine Rotarix® RotaTeq®
Discount rate Three per cent costs and benefits Zero per cent costs and benefits;
4.5 per cent costs and 1.5 per cent benefits
Perspective Health care provider Societal
Caregivers affected One Zero, two
QALY adjustment for home-treated case 50 per cent of episodes seeking medical care 100 per cent of episodes seeking medical care
Price of vaccine PAHO price Market price
Note:
QALY, Quality-adjusted life-years; PAHO, Pan American Health Organization
Univers
ity of
Mala
ya

120
5.2.2 Economic models used for cost-effectiveness analysis
5.2.2.1 Mathematical models
Mathematic models are used in various scientific disciplines to present the
complexities of reality into more simple and comprehensible forms. In economic
evaluations of vaccination programmes, models are used to bring together all relevant
biological, clinical, epidemiological and economic factors from various sources (Kim &
Goldie, 2008).
Models are used in situations where the conduct of experimental studies are
impractical, infeasible or unethical. Although clinical trials provide the highest level of
scientific evidence, trials rarely capture all relevant economic data for economic
evaluations. Mathematical models are used to extrapolate beyond the immediate or
intermediate end-points of trials to final end-points (Buxton et al., 1997; Drummond,
Sculpher, Torrance, O'Brien, & Stoddart, 2005; Jit & Brisson, 2011; Siebert, 2003; Szucs,
2005).
Models used in health economic evaluations or decision analytical models, are
mathematical models that require complex, computer-based simulations. Decision
analytical models can be divided into dynamic and static models (Beutels, Van Doorslaer,
Van Damme, & Hall, 2003; Kim & Goldie, 2008).
Dynamic models are often used to model the complexities of infectious disease, such
as transmission of infection from infectious to susceptible individuals. In dynamic
models, the force of transmission, or the rate at which the susceptible individual becomes
infected, changes with time, thus is dynamic. Dynamic models takes into account the
indirect protection conferred by vaccination and the possibility of acquiring natural
immunity. Results from a dynamic model usually indicates that the intervention is more
cost effective than of the static model. This is because dynamic models are able to capture
both direct and indirect benefits of vaccination (Beutels et al., 2003; Jit & Brisson, 2011).
Univers
ity of
Mala
ya

121
In static models or models without interaction, the force of infection does not change
with time. The force of infection is independent of the proportion of population that is
infected (Jit & Brisson, 2011; Kim & Goldie, 2008).
5.2.2.2 Choice of economic model
Dynamic models are relatively complex; requiring more data and assumptions, as well
as more skill to construct, understand and interpret the results (Bakir, Standaert, Turel,
Bilge, & Postma, 2012; Jit & Brisson, 2011; Kim & Goldie, 2008). Advanced models are
used to answer complex questions, like control measures for an epidemic. When
advanced models are used to answer simple questions like cost-effectiveness, its results
do not differ greatly from simple models (Bakir et al., 2012; Postma et al., 2011).
Static models are frequently used to evaluate the economic impact of rotavirus
vaccines (Bakir et al., 2012; Beutels et al., 2003; Joke Bilcke & Beutels, 2009). Cost-
effectiveness results for rotavirus vaccines when evaluated using different models, using
the same input parameters have been similar and comparable (Bakir et al., 2012; Postma
et al., 2011).
In this thesis, cost-effectiveness was evaluated using the POLYMOD model, a static,
multi-cohort model (Jit et al., 2009; Jit & Edmunds, 2007; Jit, Yuzbashyan, Sahakyan,
Avagyan, & Mosina, 2011; Tilson et al., 2011). The choice of model was informed by a
WHO initiated review, designed to guide low- and middle-income countries on model
design and choices for the economic evaluation of rotavirus vaccines. This review
suggested that model choice may not be as crucial as the input parameters and
assumptions used in economic evaluations. As the epidemiology of rotavirus infection
does not vary much between countries, existing health economic models may be adapted
to local contexts to evaluate cost-effectiveness of rotavirus vaccination (Postma et al.,
2011).
Univers
ity of
Mala
ya
122
Models examined in this review were the Roxanne (Rotarix® Analysis of Economics
from GSK), the CoRoVa (Consensus Rotavirus model Vaccination) and the POLYMOD
models. Standardised input parameters from four different regions were entered into the
three different cost-effectiveness models. Results of the cost-effectiveness analysis were
found to be broadly similar for all the models examined (Postma et al., 2011).
The POLYMOD model was chosen for use in this thesis based on its independence of
funding. Unlike other models in the review, the POLYMOD was not designed or financed
by the pharmaceutical industry. The POLYMOD model was independently developed as
part of an European Union funded project, and was designed by modellers from several
European countries (Postma et al., 2011).
In this thesis, cost-effectiveness was evaluated using the POLYMOD model, an excel-
based, static model. The POLYMOD model is an age stratified multi-cohort model which
accounts for different birth cohorts entering the model yearly, within a five year time
frame. For the first year, the cohort is stratified into monthly age bands. Subsequently
from one to five years old, yearly bandings are applied (Jit et al., 2009; Jit & Edmunds,
2007; Jit et al., 2011; Tilson et al., 2011).
5.2.3 Economic assumptions and parameters used in the model
5.2.3.1 Population demographics
Mortality rates and life expectancy for children under-five were obtained for Malaysia
from the Global Health Observatory of the World Health Organization (World Health
Organization, 2012a, 2012b). (Table 5.1)
5.2.3.2 Rotavirus incidence
Rotavirus incidence was classified into rotavirus episodes requiring home-treatment,
outpatient treatment, hospital admission and those resulting in death. Estimation of
rotavirus incidence for Malaysia was detailed in Chapter 4 (Subsection 4.2.2), and
summaries of this estimation are provided here.
Univers
ity of
Mala
ya
123
Annual rotavirus hospitalisations and outpatient visits of 12 and 16 per-1,000 children
under-five years to both public and private healthcare in Malaysia, was estimated from
acute gastroenteritis related discharges and outpatient visits reported to the MOH,
Malaysia. The incidence of home-treated rotavirus of 57 episodes per 1,000 children
under-five was estimated based on health utilisation patterns from a 1989 community-
based rotavirus study (Yap et al., 1992). Rotavirus mortality of one per 100,000 children
under-five years in 2013 was estimated from under-five diarrheal mortality rates obtained
from the Department of Statistics, Malaysia. Proportion of diarrheal disease attributable
to rotavirus for hospitalised episodes (44.5%) was estimated from a meta-analysis
conducted of primary hospital-based rotavirus studies in Malaysia. The 1989 community-
based study provided rotavirus detection proportions for acute gastroenteritis treated at
outpatient (18%) and at home (12%) settings (Yap et al., 1992).
The age distribution of children with rotavirus gastroenteritis was obtained from a two-
year hospital-based rotavirus study conducted in Kuala Lumpur and Kuala Terengganu,
and applied to all episodes in the model. (23 per cent in children under 12 months, 37 per
cent in children aged 12 to 23 months, 19 per cent in children aged 24 to 35 months, 11
per cent in children aged 36 to 47 months and nine per cent in children aged 48 to 59
months). Chapter 6 describes the findings of this hospital-based study. (Table 5.1)
5.2.3.3 Quality-adjusted life-years
Cost-utility analysis is a type of cost effectiveness analysis, in which health benefits
are expressed using a utility-based measure59, either QALYs or disability adjusted life
years (DALYs). Utility-based measures express outcomes based on individual
preferences for health states. QALYs are a composite measure of length and quality of
life. QALYs account for both quantity and quality of life gained from a healthcare
intervention. Health Related Quality of Life (HRQoL) values health states in a numeric
59 Utility is an economic term for the wellbeing experienced by an individual in different health states.
Univers
ity of
Mala
ya

124
scale, in which a year of life spent in perfect health is valued at one and death is valued
at zero (Robinson, 1993).
DALYs averted and QALYs gained are very different health outcome measures
(Robberstad, 2005). DALYs are recommended for use by WHO and World Bank, and
are generally used by low-income countries (Edejer, 2003; World Bank, 1993). QALYs
are preferred by economists in high- and middle-income countries (Brazier & Longworth,
2011; Henry, Hill, & Harris, 2005).
Malaysia is an upper middle-income country with no explicit threshold for cost-
effectiveness. As such, health outcomes will be measured in QALYs in this study to allow
for comparability between health interventions.
HRQoL measurement in young children have several difficulties. There is a lack of
measurement tools specifically designed to evaluate health states in young children
under-five years of age. Many of the health dimensions in health classification systems
designed for adults are not relevant to a young children60. Also, young children lack the
cognitive ability to complete a valuation61, requiring adults to value the health states of a
child. In addition, children are dependent on parents or caregivers. Thus, the impact of
the health of a child on parental utility need separate consideration in economic
evaluations (Griebsch et al., 2005). The challenges of health state valuation include the
necessity of assessing a young child for a relatively mild and self-limiting illness, like
rotavirus gastroenteritis (Beutels et al., 2008).
The United Kingdom’s National Institute for Health and Care Excellence (NICE) in
its reference case for health technology assessment, specified the use of preference-based
measures designed specifically for use in children, like the Health Utility Index Mark 2
(HUI-2) for HRQoL assessment of children (Adlard, Kinghorn, & Frew, 2014).
60 Young children are still developing, and a normal child under five years may require help to eat, dress, bathe or use the toilet.
Thus, mobility and self-care, two dimensions of the EuroQoL 5D (EQ-5D) questionnaire, are not applicable in young children (Griebsch, Coast, & Brown, 2005).
61 Health states are valued using either standard gamble, time trade off techniques or visual analogue scales.
Univers
ity of
Mala
ya

125
HUI-2 is a generic multi-attribute, preference-based system for assessing HRQOL,
designed specifically for children. HUI-2 measures quality of life over dimensions of
sensation, mobility, emotion, cognition, self-care and pain. Each dimension is scored
using between three to five levels, which range from "normal functioning for age" to
"extreme disability". HUI-2 is suitable for self-completion by children above the age of
eight years, while a proxy version is available for younger children62. This tool was
developed by Torrance et al., based on interviews with parents of school age children in
Canada (Feeny, Furlong, Boyle, & Torrance, 1995; Torrance et al., 1996).
Children are dependent on parents or caregivers, thus the impact of the health of a
child on the parental utility should be considered in economic evaluations (Griebsch et
al., 2005). Hence, QALY loss was considered for both the child and the primary caregiver
in this thesis.
A prospective, community-based Canadian rotavirus study provided information on
per-episode HRQoL weights for the child (0.0022) and caregiver (0.0018) used in this
thesis (Table 5.1). QALY loss was calculated over three visits made over a two week
period. QALY loss was measured for children under the age of three years presenting
with diarrhoea at outpatient settings using HUI-2 questionnaires and Visual Analogue
Scores (VAS), administered to caregivers. This same study also assessed the QALY loss
for the primary caregiver of a child with diarrhoea, using the EuroQoL 5D (EQ-5D)
questionnaire and VAS. (Brisson et al., 2010).
Data from this Canadian study was chosen for use in this thesis, as this study used
caregivers as proxy to measure of a child’s utility. This is preferable to another similar
study conducted in the United Kingdom, in which clinicians were used as proxy (Martin,
Cottrell, & Standaert, 2008).
62 Adult caregivers may answer the HUI-2 as proxy for a young child.
Univers
ity of
Mala
ya
126
The HRQoL weights from the Canadian study was obtained from an outpatient setting
(Sénécal et al., 2008). Hence in this thesis, QALY loss for home-treated episodes was
assumed to be fifty per cent of children treated at an outpatient setting. This assumption
was previously used in the economic evaluation of rotavirus vaccines in the United
Kingdom (Jit et al., 2009). This fraction of HRQoL detriments for home-treated episodes
was varied between fifty per cent and hundred per cent in the sensitivity analysis. (Table
5.2)
5.2.3.4 Cost of illness
The estimation of the economic burden of rotavirus gastroenteritis was detailed in
Chapter 4 (Subsection 4.2.3), and summaries of this estimation are provided here. In this
current chapter, cost per-episode of rotavirus gastroenteritis by health service utilisation
was used as model inputs for the cost-effectiveness analysis. From the healthcare
provider’s perspective, costs included were direct medical costs for hospitalisations and
outpatient visits. While, from the societal perspective, costs included were direct medical,
direct non-medical and indirect costs for all episodes of rotavirus gastroenteritis.
Direct medical costs per-episode of rotavirus gastroenteritis was estimated for
inpatient and outpatient episodes. Multiple data sources were used for this estimation
including local data from annual reports of five tertiary-level hospitals, costing studies of
six primary-level hospitals and eleven health clinics, in addition to unit costs from WHO-
CHOICE. Direct medical costs for an episode of rotavirus gastroenteritis receiving
inpatient and outpatient care was estimated at RM 3,153 and RM 171. (Table 4.13)
Direct non-medical costs include transportation, additional diapers and food consumed
during an episode of rotavirus gastroenteritis. Direct non-medical costs for rotavirus
gastroenteritis episodes receiving inpatient, outpatient and home-treatment was estimated
at RM 62, RM 23 and RM 10 per-episode respectively. (Table 4.13)
Univers
ity of
Mala
ya
127
Indirect costs were defined as productivity loss for one caregiver for the duration of
diarrhoeal illness. Productivity loss was calculated by multiplying average daily wage
with the days of work missed to care for an ill child with rotavirus diarrhoea. Indirect
costs of RM 213 was estimated for per-episode of rotavirus gastroenteritis irrespective of
severity. (Table 4.13 and Table 5.1)
5.2.3.5 Vaccine coverage
Universal rotavirus vaccination if implemented is likely to be administered together
with the routine DTP vaccines at two and three months for Rotarix® and at two, three
and five months of age for RotaTeq® (World Health Organization, 2013d). Thus it was
assumed that the rotavirus vaccine coverage would be the same as coverage of routine
DTP vaccines in Malaysia. Rotavirus vaccine coverage was based on third dose DTP
coverage of 97 per cent in Malaysia (World Health Organization, 2013b) (Table 5.1 ).
As the national immunisation programme in Malaysia is well established, no step-up
in coverage was assumed for rotavirus vaccines (Jaafar et al., 2013).
5.2.3.6 Costs of the vaccination programme
Costs of the vaccination programme include vaccine procurement costs, additional
administrative costs and vaccine wastage. Costs of the vaccination programme are
detailed in the following subsections.
a) Vaccine procurement costs
The price at which vaccines are purchased for national immunisation programmes are
not known in advance, and is likely to be substantially lower than current market prices.
This is the result of competitive tendering process and price negotiations for bulk
purchase of vaccines.
The Pan American Health Organization (PAHO) is a specialised public health agency
that also serves as the Regional Office of the WHO, for the Americas region. The PAHO
Univers
ity of
Mala
ya

128
functions to enhance partnership to improve the health and quality of life in the 35
member countries in the Americas region (PAHO, 2015a).
The PAHO Revolving Fund is a regional cooperative mechanism for the bulk purchase
of vaccines and related supplies for participating member states in the Americas region.
Based on a central purchasing model, the fund handles vaccine procurement and pays for
vaccines through a common fund, prior to being reimbursed by countries (DeRoeck et
al., 2006). The PAHO Revolving Fund for vaccine procurement ensures the lowest
negotiable vaccine prices through pooled procurement mechanisms, bulk purchasing and
guaranteed supply 63 (E. A. S. Nelson et al., 2013).
The PAHO per-dose vaccine prices for 2013 of RM 20 for Rotarix® and RM 16 for
RotaTeq®, were used as the most likely tender price for evaluation (PAHO, 2013). The
2013 Recommended Retail Price in Malaysia of RM 139 and RM 116 per-dose for
Rotarix® and RotaTeq®, were used as most likely market price in the evaluation
(Ministry of Health Malaysia, 2014a). (Table 5.1)
b) Additional administrative costs
Additional administrative costs are marginal programmatic costs, including costs for
enhancing vaccine storage, cold chains, delivery, surveillance, training and advocacy
(Edejer, 2003). In Malaysia, rotavirus vaccines are likely to be administered concurrently
with other childhood vaccines. As such, costs for additional caregiver travel and
productivity loss was assumed to be negligible.
To estimate additional administrative costs required for rotavirus vaccines in
Malaysia, a recent review on cost-effectiveness studies that measured incremental non-
vaccine costs was identified (De la Hoz-Restrepo et al., 2013). From this review, thirteen
primary studies measuring additional administrative costs of rotavirus vaccination
63 “Based on the principles of equity and solidarity, and thanks to economies of scale, all participating Member States have access
to the same high-quality products, offered through the Revolving Fund at the lowest price, which is a single price independent of the
country’s size or economic situation.”(PAHO, 2015b)
Univers
ity of
Mala
ya

129
programmes, were identified. When the measured additional administrative costs were
compared with the GNI per-capita of countries, additional administrative costs were
found to be highly correlated with GNI per-capita (Pearson correlation coefficient of 0.79,
p = 0.001). Additional administrative costs were found to have a linear relationship with
GNI-per-capita. A high goodness of fit (R2 = 0.63) validated the use of GNI per-capita
for the prediction of additional administrative costs. Using a simple linear regression, the
GNI per-capita of Malaysia was used to predict the additional administrative costs of RM
15.20 (US$ 4.83) for rotavirus vaccination. (Table 5.1)
Table 5.3 shows the thirteen cost-effectiveness studies identified that measured
additional administrative costs for rotavirus vaccination programmes.
Univers
ity of
Mala
ya

130
Table 5.3: Cost-effectiveness analysis studies with measured additional
administrative costs
Country name GNI per
capita
Additional
administrative
costs per-dose
Reference
Kenya $ 2,780 $ 1.75 (van Hoek et al., 2012)
Kenya $ 2,780 $ 0.95 (Tate, Rheingans, et al.,
2009)
United States of
America
$ 53,750 $ 17.31 (Tucker et al., 1998)
United States of
America
$ 53,750 $ 13.16 (Weycker, Sofrygin,
Kemner, Pelton, &
Oster, 2009)
Kyrgyzstan $ 3,080 $ 0.73 (Flem et al., 2009)
Israel $ 31,780 $ 4.08 (Chodick et al., 2009)
Gavi eligible countries $ 1,580 $ 0.96 (Atherly et al., 2012)
Vietnam $ 5,070 $ 1.58 (Kim, Goldie, &
Salomon, 2009)
Australia $ 42,450 $ 2.46 (Newall, Beutels,
Macartney, Wood, &
MacIntyre, 2007)
United Kingdom $ 38,160 $ 14.07 (Jit & Edmunds, 2007)
United Kingdom $ 38,160 $ 5.48 (Martin, Batty, Roberts,
& Standaert, 2009)
Finland $ 39,930 $ 4.49 (Takala, Koskenniemi,
Joensuu, Mäkelä, &
Vesikari, 1998)
Malawi $ 750 $ 0.28 (Berry, Johns, Shih,
Berry, & Walker, 2010)
Note:
GNI per capita is based on purchasing power parity (PPP), in current international dollars from the World
Bank. GNI per-capita are in current international dollars based on the 2011 International Comparison
Programme (ICP) Round;
Costs are inflated to 2013 US$ using GDP deflators from the World Bank.
Primary studies used in this analysis were sourced from a 2013 systematic review of incremental non-
vaccine cost estimates included in cost-effectiveness analysis of rotavirus vaccines (De la Hoz-Restrepo
et al., 2013)
GNI per-capita of Malaysia was used to predict the additional administrative costs of RM 15.20
(US$ 4.83) for rotavirus vaccination in Malaysia.
Univers
ity of
Mala
ya

131
c) Vaccine wastage
Based on recommendations of the WHO-UNICEF comprehensive multi-year plan for
immunization (cMYP), vaccine wastage of five per cent per-dose was included to the
vaccine cost (World Health Organization, 2014b). (Table 5.1)
5.2.3.7 Vaccine efficacy
The WHO SAGE recommends that rotavirus vaccine efficacy could be extrapolated
from countries within similar child mortality strata. The SAGE experts defined three
mortality strata using countries’ mortality rate for children under-five years divided into
quartiles: high mortality (highest mortality quartile), intermediate mortality (next
quartile) and low mortality (lowest two quartiles) (Strategic Advisory Group of Experts,
2009).
Malaysia had an under-five mortality rate of nine per 1,000 live births in 2013, and is
categorised in the low mortality strata (World Health Organization, 2013a). In this thesis,
vaccine efficacy was estimated for both Rotarix® and RotaTeq® in Malaysia, for both
complete and incomplete regimes, for all episodes requiring inpatient and outpatient
treatment, based on studies conducted in countries within the low mortality strata.
Based on the safety profile from pre-licensure trials (Phua et al., 2009; Ruiz-Palacios
et al., 2006; Vesikari et al., 2009; Vesikari et al., 2006) and post-licensure studies (Buttery
et al., 2011; Manish M. Patel et al., 2011; Shui et al., 2012), the risk of severe adverse
events following immunisation was assumed to be minimal.
a) Rotarix®
A double-blinded, randomised, placebo-controlled trial conducted in six European
countries assessed safety and efficacy of Rotarix® in preventing rotavirus gastroenteritis
among infants in the first two years of life (Vesikari, Karvonen, et al., 2007). This study
was chosen as it presented efficacy results for (1) complete and incomplete regimes of
Rotarix® vaccine (two-dose and one-dose), (2) efficacy end-points against rotavirus
Univers
ity of
Mala
ya
132
episodes of any severity and severe rotavirus episodes, (3) and with a follow-up period
of one year, all of which are relevant for this estimation of vaccine efficacy in Malaysia.
Although a rotavirus vaccine efficacy trial was conducted in high-income Asian
countries, Singapore, Taiwan and Hong Kong, this study was not chosen for use in this
thesis because efficacy results were only published for a two year follow-up period64
(results for one year follow-up were not available) (Phua et al., 2009).
In the multi-centre European trial, follow-up for gastroenteritis episodes was from two
weeks after the second vaccine dose through to two consecutive rotavirus seasons.
Vaccine efficacy for two-doses of Rotarix® at the end of the first rotavirus season of 87.1
per cent (95 per cent CI: 79.6 to 92.1 per cent) against episodes of any severity, 91.8 per
cent (95 per cent CI: 84.0 to 96.3 per cent) against episodes seeking medical attention,
and 100.0 per cent (95 per cent CI: 81.8 to 100.0 per cent) against episodes requiring
hospital admission (Vesikari, Karvonen, et al., 2007). These results were used for two-
dose efficacy of Rotarix® (complete regime) against home-treated (87.1 per cent),
outpatient (91.8 per cent) and inpatient treated (100.0 per cent) episodes in Malaysia,
respectively. (Table 5.4)
This European trial found efficacy for one-dose of Rotarix® (partial regime) at the end
of the first rotavirus season of 87.3 per cent (95 per cent CI: 80.3 to 92.0 per cent) against
any rotavirus gastroenteritis episode and 96.0 per cent (95 per cent CI: 90.2 to 98.8 per
cent) against severe episodes (Vesikari, Karvonen, et al., 2007). These results were used
for one-dose efficacy of home-treated (87.3 per cent) and inpatient treated episodes (96.0
per cent) in Malaysia. (Table 5.4)
One-dose efficacy against rotavirus outpatient treated episodes of 88.1 per cent was
estimated by multiplying the ratio of two-dose efficacy between rotavirus gastroenteritis
64 For this economic evaluation of rotavirus vaccines in Malaysia, vaccine efficacy was estimated for complete and partial regimes
of Rotarix® and RotaTeq®. Efficacy was estimated for one-dose (partial regime) and two-doses (complete regime) of Rotarix® at
the end of the first rotavirus season (one year of follow-up), and also for one-dose and two-dose (partial regime), and three-dose (complete regime of RotaTeq®. Please see Table 5.4 for vaccine efficacy estimates. Efficacy results after the one-year follow-up
period indicates waning efficacy, and was considered separately in the model.
Univers
ity of
Mala
ya

133
episodes seeking medical attention and admissions (0.92), with the one-dose efficacy
against rotavirus gastroenteritis admissions (96.0 per cent) (Vesikari, Karvonen, et al.,
2007). (Table 5.1 and Table 5.4)
Table 5.4 shows the vaccine efficacy estimates for complete and partial regimes of
Rotarix® and RotaTeq® vaccines, used in the base-case and worst case analysis.
Univers
ity of
Mala
ya
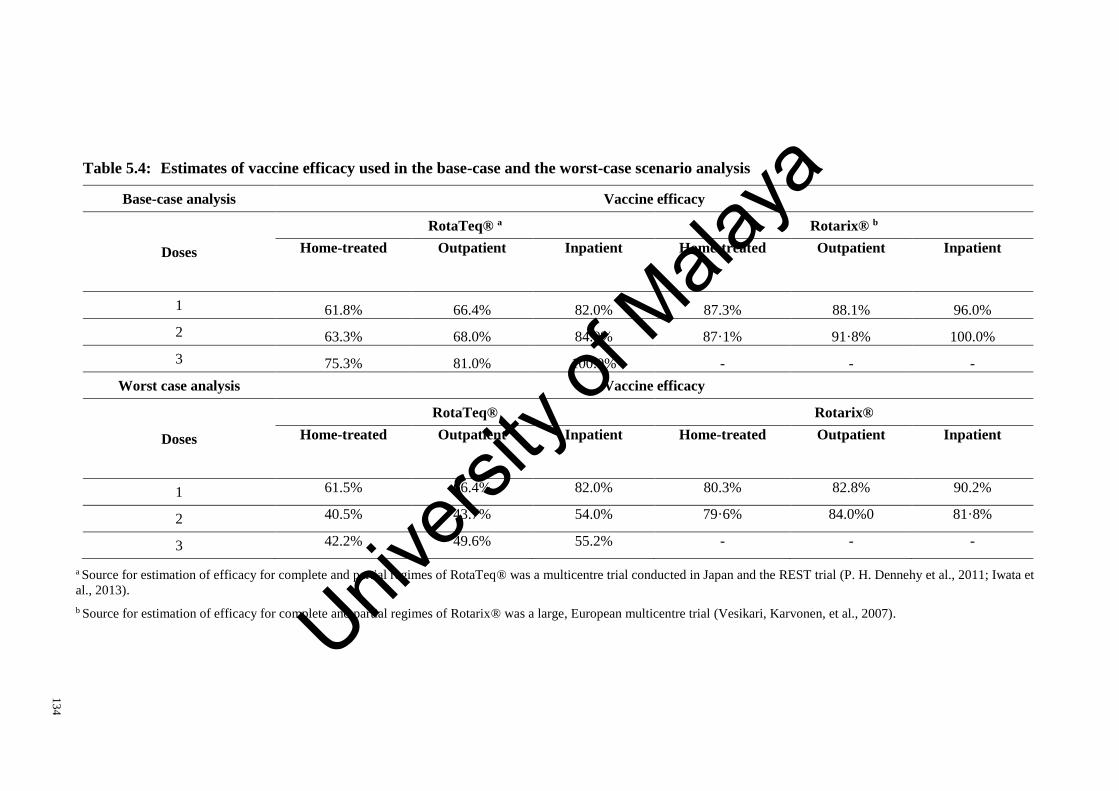
13
4
Table 5.4: Estimates of vaccine efficacy used in the base-case and the worst-case scenario analysis
Base-case analysis Vaccine efficacy
Doses
RotaTeq® a Rotarix® b
Home-treated Outpatient Inpatient Home-treated Outpatient Inpatient
1 61.8% 66.4% 82.0% 87.3% 88.1% 96.0%
2 63.3% 68.0% 84.0% 87·1% 91·8% 100.0%
3 75.3% 81.0% 100.0% - - -
Worst case analysis Vaccine efficacy
Doses
RotaTeq® Rotarix®
Home-treated Outpatient Inpatient Home-treated Outpatient Inpatient
1 61.5% 66.4% 82.0% 80.3% 82.8% 90.2%
2 40.5% 43.7% 54.0% 79·6% 84.0%0 81·8%
3 42.2% 49.6% 55.2% - - -
a Source for estimation of efficacy for complete and partial regimes of RotaTeq® was a multicentre trial conducted in Japan and the REST trial (P. H. Dennehy et al., 2011; Iwata et
al., 2013).
b Source for estimation of efficacy for complete and partial regimes of Rotarix® was a large, European multicentre trial (Vesikari, Karvonen, et al., 2007). Univers
ity of
Mala
ya
135
b) RotaTeq®
A recent multi-centre trial conducted in over 32 sites across Japan, assessed the safety
and efficacy of RotaTeq® vaccines (Iwata et al., 2013). This study found RotaTeq®
efficacy against rotavirus gastroenteritis due to any rotavirus regardless of serotype was
75.3 per cent (95 per cent CI: 42.2 per cent to 90.9 per cent) for episodes of any severity,
and 81.0 per cent (95 per cent CI: 49.6 per cent to 94.3 per cent) for moderate-to-severe
episodes, and 100.0 per cent (95 per cent CI: 55.2 per cent to 100.0 per cent) for severe
rotavirus gastroenteritis, respectively (Iwata et al., 2013). These efficacy results were
used as the three-dose (complete regime) RotaTeq® efficacy against home-treated (75.3
per cent), outpatient treated (81.0 per cent) and hospitalised (100.0 per cent) rotavirus
gastroenteritis in Malaysia. (Table 5.4)
The Rotavirus Efficacy and Safety Trial (REST) was a large, multi-centre trial
conducted to evaluate the safety and efficacy of RotaTeq® in 11 countries in Europe,
Latin America and the Caribbean regions (Vesikari, Itzler, et al., 2007). A post-hoc
analysis of the REST trial determined the between dose efficacy of RotaTeq® (vaccine
efficacy before the completion of the three-dose regime), and provided the one-dose (82.0
per cent) and two-dose efficacy (84.0 per cent) for rotavirus gastroenteritis
hospitalisations in Malaysia (P. H. Dennehy et al., 2011). (Table 5.4)
The multi-centre study from Japan provided distribution weights to estimate partial
regime (one-dose and two-dose) efficacy against outpatient treated and home-treated
rotavirus gastroenteritis (Iwata et al., 2013).
The ratio of three-dose efficacy between moderate-to-severe rotavirus gastroenteritis
and severe rotavirus gastroenteritis of (0.81) (Iwata et al., 2013), was multiplied with two-
dose efficacy against rotavirus hospitalisations (84.0 per cent) (P. H. Dennehy et al.,
2011), to obtain two-dose efficacy against outpatient treated rotavirus episodes (68 per
cent). The ratio of three-dose efficacy between moderate-to-severe rotavirus
Univers
ity of
Mala
ya

136
gastroenteritis and severe rotavirus gastroenteritis of (0.81) (Iwata et al., 2013) was
multiplied with one-dose efficacy against rotavirus hospitalisations (82.0 per cent) (P. H.
Dennehy et al., 2011), to obtain one-dose efficacy against outpatient treated rotavirus
gastroenteritis (66.4 per cent). (Table 5.4)
The ratio of three-dose efficacy between rotavirus gastroenteritis of any severity and
severe rotavirus gastroenteritis (0.75) (Iwata et al., 2013) was multiplied with two-dose
efficacy against rotavirus hospitalisations (84.0 per cent) (P. H. Dennehy et al., 2011), to
obtain two-dose vaccine efficacy against home-treated rotavirus gastroenteritis episodes
(63.3 per cent). This ratio of three-dose efficacy between rotavirus gastroenteritis of any
severity and severe rotavirus gastroenteritis (0.75) (Iwata et al., 2013) was multiplied with
one-dose efficacy against rotavirus hospitalisations (82.0 per cent) (P. H. Dennehy et al.,
2011), to obtain one-dose vaccine efficacy against home-treated rotavirus gastroenteritis
episodes (61.8 per cent). (Table 5.1 and Table 5.4)
c) Waning efficacy
The rate of waning vaccine protection was determined from the difference in efficacy
between the first and second rotavirus seasons post-vaccination. Evidence of waning
efficacy is available for rotavirus gastroenteritis of any severity and those requiring
admission and medical treatment for Rotarix® (Vesikari, Karvonen, et al., 2007) and for
severe episodes and episodes of any severity for RotaTeq® (Vesikari et al., 2006). (Table
5.1) Univers
ity of
Mala
ya

137
5.2.4 Sensitivity analysis
Sensitivity analysis was performed to assess the robustness of the economic evaluation
to the variation of key parameters. Input parameters were varied individually while others
were fixed at base-case settings. As vaccination was found to be cost-saving65 at base-
case analysis, various pessimistic scenarios that would make the vaccination program less
cost-effective were explored. The various worst-case scenarios explored are detailed here.
(Table 5.2)
5.2.4.1 Incidence
Conservative estimates of rotavirus incidence was obtained using the same sources as
the Chapter 4 estimation of rotavirus burden in Malaysia.
To obtain a conservative estimate of rotavirus hospitalisations in Malaysia, complete
reporting of hospital discharges from all public and private facilities to the MOH,
Malaysia was assumed. The unexpanded acute gastroenteritis discharges gave rise to
annual estimates of 6.9 rotavirus hospitalisations per-1,000 children under-five years (See
Table 4.2, page 62).66
Conservative estimates of rotavirus outpatient visits (6.8 per 1,000 children under-five
years) were obtained by multiplying the proportion of children that sought care for
diarrhoeal illness in the 1998 community-based rotavirus study (Yap et al., 1992), with
the total population of children under-five years in Malaysia (3.8 per cent of all children
under-five years in Malaysia sought care for acute diarrhoeal illness).
5.2.4.2 Costs
The conservative estimate of RM 1,162 and RM 72 per-episode for rotavirus
gastroenteritis requiring hospitalisation and outpatient treatment was used in the worst
65 These results of the cost-effectiveness analysis are presented in the results Subsection 5.3.1, page 164. 66 Reported episodes of acute gastroenteritis hospitalisation (39,336 episodes) were multiplied with the rotavirus detection
proportion of 44.5 per cent to obtain conservative estimate of 17,512 episodes of rotavirus gastroenteritis hospitalisations in Malaysia.
Univers
ity of
Mala
ya
138
case scenario. These costs were estimated using the weighted average of unit costs by
facility types from WHO-CHOICE. (See Table 4.7, page 85)
Unit costs by facility-type from WHO-CHOICE was multiplied with the proportion of
distribution of facilities, and the sum product of this for all facilities was the conservative
estimate of hospitalisation costs67. This figure was then inflated to 2013 RM and
multiplied with duration of diarrhoeal illness (3.3 days) to obtain conservative costs per
bed-day of RM 1,162.
Unit costs by facility-type from WHO-CHOICE and unit costs for tertiary hospitals in
Malaysia was multiplied with the proportion of distribution of facilities, and the sum
product of this for all facilities was the conservative estimate of outpatient costs68. This
figure was then inflated to 2013 RM to obtain conservative costs per visit of RM 72.
5.2.4.3 Vaccine efficacy
The lower limit values of vaccine efficacy for Rotarix® and RotaTeq® from the
sources used in the base-case efficacy estimation, were used to estimate efficacy in the
worst-case scenario. Table 5.4 shows the efficacy for complete and partial regimes of
Rotarix® and RotaTeq® vaccines, used in the worst case analysis.
Lower limit vaccine efficacy from the multicentre European trial was used for the
conservative estimation Rotarix® vaccine efficacy (Vesikari, Karvonen, et al., 2007).
Efficacy for two-doses of Rotarix® at the end of the first rotavirus season of 87.1 per cent
(95 per cent CI: 79.6 to 92.1 per cent) against episodes of any severity, 91.8 per cent (95
per cent CI: 84.0 to 96.3 per cent) against episodes seeking medical attention, and 100.0
per cent (95 per cent CI: 81.8 to 100.0 per cent) against admissions. The lower limit of
these efficacy results were used for conservative estimates of two-dose efficacy of
67 Costs per bed day: [(20% × $86.6) + (30% × $90.34) + (50% × $116.81)] = $102.83 68 Costs per outpatient visit:
[(56% × $7.63) + (44% × 20% × $15.93) + (44% × 30% × $22.46) + (44% × 50% × $68.11) = $23.62]
Univers
ity of
Mala
ya

139
Rotarix® (complete regime) against home-treated (79.6 per cent), outpatient (84.0 per
cent) and inpatient treated (81.8 per cent) episodes in Malaysia, respectively.
The multi-centre trial conducted in Japan, provided conservative estimates of
RotaTeq® vaccine efficacy (Iwata et al., 2013). This study found RotaTeq® efficacy
against rotavirus gastroenteritis due to any rotavirus regardless of serotype was 75.3 per
cent (95 per cent CI: 42.2 per cent to 90.9 per cent) for episodes of any severity and 81.0
per cent (95 per cent CI: 49.6 per cent to 94.3 per cent) for moderate-to-severe episodes
and 100.0 per cent (95 per cent CI: 55.2 per cent to 100.0 per cent) for severe rotavirus
gastroenteritis, respectively. The lower limits of these efficacy results were used as the
three-dose (complete regime) RotaTeq® efficacy against home-treated (42.2 per cent),
outpatient treated (49.6 per cent) and hospitalised (55.2 per cent) rotavirus gastroenteritis
for the worst case scenario.
The same methods used in the base-case to estimate between-dose efficacy was used
in this analysis. (See Subsection 5.2.3.7, page 131).
See Table 5.4 for vaccine efficacy estimates used in the worst case analysis.
5.2.4.4 Quality-adjusted life-years
In the base-case, QALY loss was assumed for one caregiver. In the sensitivity analysis,
scenarios with no QALY loss and QALY loss for two caregivers was explored. In the
base-case, home-treated episodes were assumed to have 50 per cent of the HRQoL
detriments of those seeking medical care. This fraction of HRQoL detriments for home-
treatment was varied between 50 per cent and 100 per cent during sensitivity analysis.
(Table 5.2)
5.2.4.5 Discount rate
Sensitivity analysis was conducted at discount rates of zero per cent for costs and
benefits (Hutubessy et al., 2011; World Health Organization, 2008), and the use of
Univers
ity of
Mala
ya

140
different discount rates for costs (4.5 per cent) and benefits (1.5 per cent), as used by the
Netherlands was explored (College voor zorgverzekeringen, 2006). (Table 5.2)
5.2.5 Threshold analysis
Efficiency in a cost-effectiveness analysis is expressed by the ICER. The ICER is
reported in terms of costs per unit of health gained, usually as QALYs gained. An
intervention may be considered cost-effective if the ICER falls below a defined cost-
effectiveness threshold.
A cost-effectiveness threshold is a reference measure that may be used explicitly or
implicitly to inform resource allocation decisions (Eichler et al., 2004). Countries like the
United Kingdom, Thailand, Australia and Canada have defined cost-effective thresholds
for decision-making (ISPOR, 2015). Other countries like Malaysia, which have yet to
formalise economic evaluations as part of resource allocation decisions for health
technologies, do not have defined cost-effectiveness thresholds (Ministry of Health
Malaysia, 2012e). WHO-CHOICE thresholds have been widely used as a measure of
cost-effectiveness in low- and middle-income countries with no locally derived cost-
effectiveness thresholds. As the use of WHO-CHOICE thresholds as a decision rule has
many acknowledged shortfalls (Eichler et al., 2004; Newall et al., 2014), cost-
effectiveness was explored in this thesis using different thresholds for Malaysia.
In this chapter, threshold analysis was conducted at cost-effectiveness thresholds
derived using three different approaches: (1) the WHO-CHOICE thresholds (human
capital); (2) the societal willingness to pay thresholds (consumer sovereignty) and (3) the
marginal productivity thresholds (opportunity costs). The rationale behind these
thresholds are described in the following subsections.
Threshold analysis was conducted to inform prices at which vaccination programmes
are ‘cost-effective’ in Malaysia. Threshold prices are vaccine procurement prices below
Univers
ity of
Mala
ya

141
which vaccination programmes are cost-effective. At threshold prices, the net vaccination
costs per-QALY gained (the ICER) are equal to the cost-effectiveness threshold.
5.2.5.1 WHO-CHOICE threshold
WHO-CHOICE thresholds were motivated by the human capital theory. Theodore
Schultz first conceptualised the term ‘human capital’ in the 1960’s. According to Schultz
(1961), human capital could be invested to increase productivity. Investment in a person’s
stock of knowledge, skills and experience, with job training and education, would result
in increased productivity in both the market sector of economy by increasing monetary
earnings, and in the non-market sector by increasing utility (Becker, 1962). Michael
Grossman (1972) modelled ‘health capital’ as a stock in human capital. The human
capital approach values life according to a persons’ contribution to society, commonly
measured by GDP or GNI per capita69.
The Commission for Macroeconomics and Health was the first to use a nation’s GDP
per capita70 as a benchmark for cost-effectiveness. The Commission recognised health as
a cornerstone of human capital development, the basis for individual productivity and a
crucial element towards economic development. The value of human life was recognised
as more than just average income and includes extra market value, such as utility
produced during leisure time. Hence the value of an extra year of life was estimated at up
to three times of annual earnings (World Health Organization, 2001, 2002b).
The WHO-CHOICE project advocated the use of GDP per capita as an indicator for
cost-effectiveness. The WHO-CHOICE project broadly categorised interventions into
three categories: those costing less than the GDP per capita are classified as ‘very cost-
effective’, those between one and three times GDP per capita are ‘cost-effective’, and
69 This implies the value of human life is equated to average income or productivity. 70 GDP is the value of goods and services produced in a country in one year. GDP per capita is a measure of a countries economic
output, calculated by dividing the GDP by the number of people in the country (the mid-year population). (World Bank, 2015a)
Univers
ity of
Mala
ya
142
those above three time GDP per capita are ‘not cost effective’ (Edejer, 2003; World
Health Organization, 2015c).
As Malaysia has no explicit threshold for cost-effectiveness (Ministry of Health
Malaysia, 2012e), convention dictates the use of WHO-CHOICE thresholds as a
reference for cost-effectiveness (Edejer, 2003; Walker et al., 2010). WHO-CHOICE
thresholds have been widely used as a measure of cost-effectiveness in low- and middle-
income countries with no locally derived cost-effectiveness thresholds. However,
thresholds based on multiples of GDP per capita have major short-comings as a marker
for policy making (Marseille et al., 2015; Newall et al., 2014).
WHO-CHOICE thresholds for cost-effectiveness analysis were formulated to aid
regional priority setting and were not suggested for formulaic use for decision-making on
national resource allocation (Edejer, 2003). Thresholds based on GDP per capita assume
that governments are willing to pay up to the GDP of the country on health benefits,
without any concrete evidence of societal willingness-to-pay (WTP)71 (Marseille et al.,
2015). The use of GDP based thresholds does not consider the affordability of the
intervention within the context of finite budgets, and may lead to unsustainable healthcare
costs (Marseille et al., 2015; Newall et al., 2014; Shillcutt et al., 2009; M. E. Singer,
2009).
The value of life as determined by the Commission of Macroeconomics and Health,
of up to three times of average income was arbitrarily determined. These values were not
based on empirical evidence, but rather on general assessment of economic literature
(Newall et al., 2014).
In addition, the WHO-CHOICE thresholds sets a low bar for cost-effectiveness and
are easily achieved. Many interventions with some effectiveness, are found to cost less
than the annual GDP per capita, reducing the value of cost-effectiveness analysis in
71 Hypothetically, if every person in the country receives an intervention that produces a QALY per person, and the net cost of
the programme per person is the GDP per capita of the country, the nation will spend its entire GDP on the health gain.
Univers
ity of
Mala
ya

143
informing on resource allocation decisions (Marseille et al., 2015). Hence, results of
‘cost-effective’ or even ‘very cost-effective’ in economic evaluations does not guarantee
vaccine adoption by middle-income countries. A recent review of cost-effectiveness
analysis results and subsequent implementation of universal vaccination programmes
suggests that budget constraints, rather than cost-effectiveness based on arbitrarily
defined thresholds, were more likely to influence decision-making (Newall et al., 2014).
In this thesis, the WHO-CHOICE thresholds were explored to obtain ‘cost-effective’
and ‘very cost-effective’ vaccine prices. The WHO-CHOICE thresholds provided prices
for comparison with the ‘cost-effective’ prices obtained from the Societal WTP and
Marginal productivity thresholds. Vaccine prices were ‘cost-effective’ when net costs
per-QALY gained were between one and three times the 2013 GDP per capita of Malaysia
of RM 33,204 (US$ 10,538) and ‘very cost-effective’ when below the 2013 GDP per
capita. (World Bank, 2014a)
5.2.5.2 Societal willingness to pay threshold
Societal WTP thresholds are based on the principles of consumer sovereignty.
Consumer sovereignty is an economic argument asserting that ultimately consumers’
preferences determine the allocation of scarce resources and the production of goods and
services. This is the basis of the expected utility theory, which emphasises the ability and
freedom of consumers to choose from a range of goods and services (McGuire et al.,
1988, pp. 30-33).
Societal WTP thresholds are based on preferences of individuals within a society for
specific health outcomes. Preference elicitations methods, either revealed or stated, are
used to assign a monetary value to a QALY gained (Ryen & Svensson, 2014). Revealed
preference measures examines real world healthcare allocation decisions for societal
value of health gain. Stated preference measures assess individual WTP, either by
Univers
ity of
Mala
ya

144
contingent valuation methods or discrete choice experiments, according to hypothetical
choices people make in relation to incremental risk of death or disease.
In contingent valuation methods, respondents are given hypothetical scenarios and are
asked to state the price they are WTP to obtain a specific health benefit (Diener, O'Brien,
& Gafni, 1998; Ryan et al., 2001). In discrete choice experiments, respondents are asked
to choose between alternative hypothetical scenarios that differ in terms of price and
health benefits (Ryen & Svensson, 2014).
Societal WTP thresholds are based on preferences of individuals within a society for
specific health outcomes. However, the assumption that individual WTP reflects on
societal preferences may not hold true. The individual is likely to evaluate personally
experienced health benefits, like life extension, more highly compared to social benefits
or externalities derived from public goods, like vaccination (Shiroiwa et al., 2010; R. D.
Smith & Richardson, 2005). Individual preferences vary according to the characteristics
of those studied, for example age, wealth, education, employment, and current health
status. To reduce bias, the population surveyed should be sufficiently large, randomly
sampled and representative of the national population (Cookson, 2003; R. D. Smith &
Richardson, 2005).
Large variation in results of WTP may also be due to differing methods (discrete
choice experiments or contingent valuation methods) and methodology used in evaluating
QALYs, including study locations, perspective taken (social or individual), and sample
population (general population or patient groups) (Mason, Baker, & Donaldson, 2008;
Ryen & Svensson, 2014).
QALYs are a composite measure that includes both the length and quality of life. WTP
per-QALY estimates obtained from HRQoL improvements may not be appropriate when
evaluating policy affecting length of life and vice versa. A 2014 study found that the WTP
for a QALY was significantly higher when the QALY gain came from life extension,
Univers
ity of
Mala
ya
145
rather than quality of life improvements. It was also found that the WTP for a QALY was
dependent on the size of the QALY gain valued (Ryen & Svensson, 2014)
In this thesis, empirical findings from a local cross-sectional study, which employed
contingent valuation methods, was used to derive a societal WTP threshold for Malaysia
(Shafie, Lim, Chua, & Hassali, 2014). This cross-sectional study was conducted in
Penang, Malaysia in 2010. Study participants were selected from geographical grids in
Penang, by a random walking technique. Data was collected using predesigned
questionnaires in face-to-face interviews of 347 respondents. Data on qualities of life,
was collected using the EuroQol Visual Analog Scale (EQ-VAS), and the WTP for an
additional QALY was elicited using a double-bound dichotomous choice via a bidding
game approach.
This cross-sectional study determined an average societal WTP of RM 30,918 per-
QALY gained in the state of Penang, Malaysia (Shafie et al., 2014). This WTP threshold
was 0.81 times of the 2013 per-capita GDP of the state of Penang (RM 38,356)
(Department of Statistics Malaysia, 2013b). By multiplying this fraction with the 2013
GDP per-capita for Malaysia of RM 33,284 (World Bank, 2014a), a societal WTP
threshold of RM 26,766 (US $8,495) per-QALY gained was estimated in Malaysia, for
threshold analysis in this thesis.72
5.2.5.3 Marginal productivity threshold
The concept of opportunity costs are fundamental to health economics. The
opportunity cost of investing in a healthcare intervention is best measured by the health
benefits that would have been achieved had the money been spent on the next best
alternative (Palmer & Raftery, 1999; L. B. Russell, 1992). In economic evaluation of
healthcare interventions, cost-effectiveness thresholds should ideally reflect opportunity
costs of foregone benefits of next best alternative not implemented, in other words the
72 This was done to adjust for individual variation of average wealth at the national level.
Univers
ity of
Mala
ya

146
marginal productivity of health systems in generating health (Revill et al., 2014; Woods,
Revill, Sculpher, & Claxton, 2015).
Local empirical data on marginal productivity would give insight into resource
allocation decisions that maximise population health, however this data is lacking (Revill
et al., 2014; Woods et al., 2015). The exception being a study by Claxton et al. which
used data from the National Health Services (NHS) in the United Kingdom, to study the
relationship between health expenditure for a range health programmes with changes in
mortality73. This study of the marginal productivity of healthcare investments estimated
a threshold of £12,936 (US$ 20,212) per-QALY for the NICE in the United Kingdom
(Claxton et al., 2015).
In the absence of local empirical data, researchers at the University of York estimated
cost-effectiveness thresholds for various countries by using estimates of benefits foregone
from the NHS in the United Kingdom, the GDP per capita of the United Kingdom and
other respective countries and the income elasticities of the Value of Statistical Life74
(VSL).
The York study estimated marginal productivity thresholds for Malaysia ranging from
RM 10,968 to RM 19,510 (Woods et al., 2015). These estimates were used in this thesis
for threshold analysis
5.2.6 Budget impact analysis
While cost-effectiveness analysis examines the value for money of a vaccination
programme, a budget impact analysis examines its affordability. The budget impact
analysis is conducted to inform the budget holder on the ability to remain within the
73 Using programme-level expenditure data from the NHS to study the relationship between expenditure for healthcare
programmes and mortality. 74 The Value of a Statistical Life (VSL) is an economic term, denoting the amount of money an individual (or society) is willing
to pay to save a life (trade-off between mortality risks and money) (Viscusi & Aldy, 2003). Mortality risk reductions are important to quantify benefits of environmental and other policies. Estimates of VSL are transferred across countries with different income levels,
by using income elasticity of the VSL (Hammitt & Robinson, 2011).
Univers
ity of
Mala
ya
147
annual budget. Budget impact analysis is complementary to cost-effectiveness analysis,
as it provides additional information for the allocation of scarce healthcare resources.
The costs in a budget impact analysis are financial costs to the budget holder. In a
budget impact analysis, costs of interest are the costs incurred by the budget holder, or
direct medical costs from the healthcare providers’ perspective. In contrast, a cost-
effectiveness analysis may consider all relevant economic costs from the societal
perspective, including both direct and indirect costs. Reduction in productivity loss are of
interest to society, but are of little consequence to healthcare budget holders, as
productivity loss to caregivers and employers are not directly passed on to the healthcare
service.
In a budget impact analysis, the time horizon considered is much shorter than that of
a cost-effectiveness analysis. In a cost-effectiveness analysis the time horizon considered
is usually long term, to take into account all possible costs and benefits. However, the
time horizon in a financial budget is seldom longer than one to three years. This is because
healthcare services cannot operate by overspending in the short term in anticipation of
future benefits. In absence of additional funding to pay for new healthcare investments,
existing programmes may need to be disinvested or reprioritised (Garattini & van de
Vooren, 2011; Trueman et al., 2001).
In this thesis, a budget impact analysis was conducted to estimate the financial
consequences of adoption of the rotavirus vaccine by the Ministry of Health, Malaysia.
The inputs used in the budget impact analysis are the same used in the cost-effectiveness
analysis. However, the budget impact analysis was conducted from the healthcare
provider’s perspective and within a time frame of one year.
There is no explicit threshold or margin to inform on affordability of a healthcare
programme in Malaysia. As such, affordability is a consensus arrived at by comparing
Univers
ity of
Mala
ya

148
programmatic costs with the public health budget of Malaysia75. The Malaysian public
health expenditure for the year 2012 was obtained from the Annual Report of the MOH,
Malaysia. In 2012, a total of RM 15.2 billion was allocated to the operational budget of
the MOH, Malaysia. The total operating expenditure of the MOH, Malaysia in 2012 was
RM 16.8 billion (a 10.9 per cent increase from the allocated budget), out of which RM
3.4 billion was public health expenditure (Ministry of Health Malaysia, 2012a).
75 The budget for a new vaccination programme would initially come from public health budget of the MOH, Malaysia.
Univers
ity of
Mala
ya

149
5.3 Results
5.3.1 Base-case analysis
In a cohort of children followed from birth to five years of age, rotavirus gastroenteritis
was estimated to result in 205,500 nonfatal episodes, 29,400 hospitalisations and 26
deaths or 1,293 QALY lost in Malaysia. Rotavirus gastroenteritis was estimated to cost
RM 35.9 million to the healthcare provider and RM 46 million to society, annually. (Table
5.5)
At base-case assumptions, Rotarix® would prevent 138,700 nonfatal episodes (68 per
cent), 24,600 hospitalisations (84 per cent), 21 deaths (84 per cent), and avert 1,003 of
QALYs lost (78 per cent) from rotavirus gastroenteritis, annually. Rotarix® would avert
RM 82.4 million (83 per cent) and RM 115.0 million (78 per cent) in costs to the
healthcare provider and society, respectively. (Table 5.5)
At base-case assumptions, RotaTeq® would prevent 125,600 nonfatal episodes (61
per cent), 23,700 hospitalisations (81 per cent), 21 deaths (81 per cent), and avert 949 of
QALYs lost (73 per cent) from rotavirus gastroenteritis, annually. RotaTeq® would avert
RM 79.3 million (79 per cent) and RM 108.9 million (74 per cent) of costs to the
healthcare provider and society, respectively. (Table 5.5)
At the PAHO prices of RM 20 per-dose of Rotarix®, the vaccination programme
would cost RM 36.0 million and result in net savings of RM 46.4 million in direct medical
costs. The ICER is cost saving from the healthcare provider’s perspective, at RM – 46,288
per-QALY gained. From the societal perspective, the ICER is cost saving at RM -78,788
per-QALY gained (Table 5.5).
At PAHO prices of RM 16 per-dose of RotaTeq®, the vaccination programme would
cost RM 15 million and result in net savings of RM 32.0 million in direct medical costs.
The ICER is cost saving from the healthcare provider’s perspective, at RM -33,731 per-
Univers
ity of
Mala
ya
150
QALY gained. From the societal perspective, the ICER is cost-saving at RM -64,927 per-
QALY gained (Table 5.5).
At market prices of RM 122 per-dose of Rotarix®, the ICER was RM 75,192 per-
QALY gained from the healthcare provider’s perspective, and RM 42,692 per-QALY
gained from the societal perspective. (Table 5.6)
At market prices of RM 74 per-dose of RotaTeq®, the ICER was RM 127,343 per-
QALY gained from the healthcare provider’s perspective, and RM 96,146 per-QALY
gained from the societal perspective. (Table 5.6)
At PAHO prices, both rotavirus vaccines were cost saving, from the healthcare
provider’s and societal perspectives, using all cost-effectiveness definitions76. (Table 5.6)
At market prices using the WHO-CHOICE cost-effectiveness thresholds, Rotarix®
programmes were cost-effective, but RotaTeq® programmes were not cost-effective
from the healthcare provider’s perspective. Both vaccination programmes were cost-
effective from the societal perspective. (Table 5.6)
Using the Societal WTP and Marginal productivity thresholds, both vaccines were not
cost-effective at market prices, from the healthcare provider’s and societal perspectives.
(Table 5.6)
Table 5.5 shows the outcomes of vaccination with Rotarix® and RotaTeq® under
base-case assumptions, from the healthcare provider’s and societal perspectives.
Table 5.6 shows the discounted ICERs of Rotarix® and RotaTeq® vaccination
programmes at PAHO and market prices.
76At WHO-CHOICE thresholds, vaccines are ‘cost-effective’ when the ICER is between one and three times the 2013 GDP per
capita of Malaysia of US$ 10,538, and ‘very cost-effective’ when below the 2013 GDP per capita. The societal WTP threshold for Malaysia is estimated at US $8,495 per-QALY gained.
The Marginal Productivity threshold is estimated from between US$ 3,481 to US$ 6,192 per-QALY gained.
Univers
ity of
Mala
ya

15
1
Table 5.5: Outcomes of rotavirus vaccination compared with no vaccination under base-case assumptions
No Vaccine Rotarix® RotaTeq®
Rotavirus episodes
Inpatient episodes 29,429 4,798 (24,631) 5,652 (23,777)
Non-fatal episodes 205,497 66,722 (138,775) 79,864 (125,633)
Deaths 26 4 (21) 5 (21)
QALYs lost
Nonfatal QALYs 553 170 (383) 203 (350)
Life years lost from death 740 120 (620) 141 (599)
Total QALYs lost 1,293 290 (1003) 344 (949)
Healthcare provider costs
Vaccine costs 0 35,984,615 (-35,984,615) 47,282,93 (-47,282,93)
Inpatient episodes 92,993,467 15,161,423 (77,832,043) 17,858,879 (75,134,588)
Outpatient episodes 6,777,322 2,183,045 (4,594,277) 2,629,349 (4,147,973)
Total healthcare costs 99,770,788 17,344,468 (82,426,320) 20,488,227 (79,282,561)
Total costs 99,770,788 53,329,083 (46,441,705) 67,771,162 (31,999,627)
Costs per QALY gained - 46,288 -33,731
Univers
ity of
Mala
ya

15
2
Table 5.5: Outcomes of rotavirus vaccination compared with no vaccination under base-case assumptions (continued)
No Vaccine Rotarix® RotaTeq®
Societal costs
Inpatient episodes 101,085,173 16,480,675 (84,604,498) 19,412,846 (81,672,327)
Outpatient episodes 15,991,489 5,151,022 (10,840,467) 6,204,103 (9,787,386)
Home treated episodes 30,613,253 11,024,518 (19,588,735) 13,195,294 (17,417,959)
Total societal costs 147,689,914 32,656,215 (115,033,699) 38,812,242 (108,877,672)
Total costs 147,689,914 68,640,830 (79,049,084) 86,095,177 (61,594,738)
Costs per QALY gained -78,788 -64,927
Note:
All costs are in 2013 RM;
Difference in outcomes between ‘vaccine’ and ‘no vaccine’ groups are given in the parenthesis (episodes, QALYs and costs prevented by vaccination);
An annual discount rate of three per cent is used for costs and benefits;
Pan American Health Organization (PAHO) Revolving Fund vaccine price for 2013 of RM 20 per-dose for Rotarix® and RM 16 per-dose for RotaTeq® were used (PAHO, 2013);
The World Bank exchange rate for 2013 of US$ 1 to RM 3.15 was used in this analysis (World Bank, 2014a).
Costs and incremental cost effectiveness ratios (ICERs) are presented from the healthcare provider and societal perspectives; ICERs are expressed as costs per QALY gained.
Univers
ity of
Mala
ya

15
3
Table 5.6: Incremental cost-effectiveness ratios of Rotarix® and RotaTeq® vaccination programmes at PAHO and market price
PAHO price a Market price b
Cost per-QALY gained Cost per-QALY gained
Healthcare provider’s perspective
Rotarix® -46,288 75,192
RotaTeq® -33,731 127,343
Societal perspective
Rotarix® -78,788 42,692
RotaTeq® -64,927 96,146
Note:
Costs are in 2013 RM; QALY, Quality-adjusted life-years; Annual discount rate of three per cent for costs and benefits;
a PAHO prices are the Pan American Health Organization (PAHO) Revolving Fund per-dose price for 2013 (PAHO, 2013);
b Market price are based on the Recommended Retail Price per-dose of rotavirus vaccines for Malaysia in 2012 (Ministry of Health Malaysia, 2014a);
At WHO-CHOICE thresholds, vaccines are ‘cost-effective’ when the ICER is between one and three times the 2013 GDP per capita of Malaysia of RM 33,200, and ‘very cost-
effective’ when below the 2013 GDP per capita;
The societal WTP threshold for Malaysia is estimated at RM 26,766 per-QALY gained;
The Marginal Productivity threshold is estimated from between RM 10,968 to RM 19,510 per-QALY gained.
Univers
ity of
Mala
ya

154
5.3.2 Sensitivity analysis
During the sensitivity analysis, parameters were varied individually to observe
changes in the cost per-QALY gained from vaccination, while other parameters were kept
constant at base-case assumptions. Parameters that resulted in the most change in the cost
per-QALY gained from vaccination were direct medical costs, incidence of rotavirus
gastroenteritis requiring hospitalisation and vaccine efficacy. (Figure 5.1)
However, Table 5.6 shows that cost per-QALY gain was highly sensitive to vaccine
price. This was apparent as both vaccines were cost-saving at PAHO prices at all cost-
effectiveness thresholds, while both vaccines were not cost-effective at market prices,
using the Societal WTP and Marginal productivity thresholds. (Table 5.6)
Univers
ity of
Mala
ya

15
5
Figure 5.1: Tornado graph showing sensitivity analysis and effects on incremental cost-effectiveness ratio
Note:
QALY, quality-adjusted life-year; ICER, incremental cost-effectiveness ratio. ICERs are in RM per QALY gained.
The tornado graph shows the parameters that result in the most changes in the costs per QALY gained by vaccination from (a) Rotarix® and (b) RotaTeq, when they are varied
individually and all other parameters are kept constant. Parameters resulting in small changes in cost per-QALY gained (less than ten per cent change) are not shown;
QALY Opt1: QALYs considered for one caregiver. Home-treated episodes are 100 per cent HRQoL weights of those seeking medical treatment;
QALY Opt2: QALYs considered for two caregivers. Home-treated episodes are 50 per cent HRQoL weights of those seeking medical treatment;
Discount rate Opt1: Costs are discounted at 4 per cent and benefits at 1.5 per cent;
Discount rate Opt2: Costs and benefits are discounted at zero per cent;
Please see Subsection 5.2.4, page 137, for description of the scenarios in the sensitivity analysis.Univers
ity of
Mala
ya

156
5.3.3 Threshold analysis
Using the WHO-CHOICE threshold, Rotarix® would be ‘cost-effective’ below RM
163 per-dose and ‘very cost-effective’ below RM 98 per-dose. At the Societal WTP
threshold, Rotarix® would be ‘cost-effective’ below RM 92 per-dose. At the Marginal
Productivity threshold, Rotarix® would be cost-effective between RM 76 and RM 85
per-dose. (Table 5.7)
Using the WHO-CHOICE threshold, RotaTeq® would be ‘cost-effective’ below RM
98 per-dose and ‘very cost-effective’ below RM 57 per-dose. At the Societal WTP
threshold, RotaTeq® would be ‘cost-effective’ below RM 53 per-dose. Using the
Marginal Productivity threshold, RotaTeq® would be cost-effective when priced between
RM 44 and RM 49 per-dose. (Table 5.7)
‘Cost-effective’ programmes as defined using the WHO-CHOICE threshold are
between three and five per cent of the 2012 public health budget and between 0.6 and one
per cent of the operational budget of the MOH, Malaysia. Rotarix® vaccination
programmes costing between RM 116 to RM 182 million, and RotaTeq® programmes
costing between RM 111 to RM 174 million, annually. (Table 5.7)
While, at ‘cost-effective’ prices as defined by the Societal WTP and Marginal
Productivity threshold, both vaccination programmes would cost about three per cent of
the 2012 public health budget, and less than 0.65 per cent of the 2012 operating budget
of the MOH, Malaysia. (Table 5.7)
A Rotarix® vaccination programme would cost about RM 183 million at ‘cost-
effective’ prices as defined by the Societal WTP Threshold, and between RM 153 to 169
million at ‘cost-effective’ prices defined by the Marginal Productivity threshold. (Table
5.7)
Univers
ity of
Mala
ya
157
A RotaTeq® vaccination programme would cost about RM 160 million at ‘cost-
effective’ prices as defined by the Societal WTP Threshold, and between RM 131 to 147
million, at prices defined by the Marginal Productivity threshold. (Table 5.7)
5.3.4 Budget impact analysis
At PAHO prices of RM 20 per-dose, a Rotarix® vaccination programme would cost
RM 36 million or about 1.1 per cent of the 2012 public health budget of the MOH,
Malaysia, and about 0.2 per cent of the 2012 operating budget of the MOH, Malaysia.
While at PAHO prices of RM 16 per-dose, a RotaTeq® vaccination programme would
cost RM 47.3 million, or about 1.4 per cent of the 2012 public health budget and 0.3 per
cent of the operating budget of the MOH, Malaysia. (Table 5.7)
At market prices of RM 139 and RM 116 per-dose, vaccination programmes with
Rotarix® and RotaTeq® would cost RM 158 million and RM 200 million annually, or
from between five to six per cent of the 2012 public health budget and approximately one
per cent of the 2012 operating budget of the MOH, Malaysia. (Table 5.7)
Table 5.7 shows the results of the threshold analysis and budget impact analysis of
both Rotarix® and RotaTeq® in Malaysia.
Univers
ity of
Mala
ya

15
8
Table 5.7: Threshold analysis and budget impact analysis of rotavirus vaccines in Malaysia
Price per dose
(RM)
Price per
course a
(RM)
Total vaccine cost b
(RM million)
% Public health
budget c
% MOH
budget d
Rotarix
Base-case price 20 41 36 1.1% 0.2%
Market price 139 278 157 4.6% 0.9%
Threshold price:
WHO-CHOICE e 98 to 163 196 to 326 116 to 182 3.4 to 5.3% 0.7 to 1.1%
Societal WTP f 92 183 109 3.2% 0.7%
Marginal Productivity g 76 to 85 153 to 169 93 to 102 2.7 to 2.9% 0.6 to 0.6%
RotaTeq
Base-case price 16 49 47 1.4% 0.3%
Market price 116 347 200 5.9% 1.2%
Threshold price:
WHO-CHOICE e 57 to 98 173 to 295 111 to 174 3.2 to 5.1% 0.7 to 1.0%
Societal WTP f 53 160 105 3.1% 0.6%
Marginal Productivity g 44 to 49 131 to 147 90 to 98 2.6 to 2.9% 0.5 to 0.6%
Note: All costs are in 2013 RM; a Vaccine price per course was calculated for Rotarix® (two-dose course)and RotaTeq® (three-dose course);
b Vaccine costs were not discounted. Vaccine costs include cost of vaccine purchase, wastage and additional administrative costs.
(Total vaccine cost = cohort size × vaccine coverage × vaccine cost per dose)
c, d Public Health, and the MOH operational budget was sourced from the MOH, Malaysia operational expenditure for 2012 (Ministry of Health Malaysia, 2012a);
e At WHO-CHOICE thresholds, vaccines are ‘cost-effective’ when the incremental cost-effectiveness ratio (ICER) is between one and three times the 2013 GDP per capita of
Malaysia of RM 33,200 and ‘very cost-effective’ when below the 2013 GDP per capita;
f The societal WTP threshold for Malaysia was estimated at RM 26,766 per-QALY gained;
g The Marginal Productivity threshold was estimated from between RM 10,968 to RM 19,510 per-QALY gained.
Univers
ity of
Mala
ya

159
5.4 Discussion
In a cohort followed from birth to the age of five years in Malaysia, rotavirus
gastroenteritis is estimated to result in 205,500 non-fatal episodes, 29,400
hospitalisations, and 26 deaths, with costs of RM 99.7 million to the healthcare provider
and RM 147.7 million to society. Rotavirus vaccination would avert up to 67 per cent of
non-fatal episodes and 84 per cent rotavirus hospitalisations. Although rotavirus mortality
is comparatively low in Malaysia, preventable child deaths are unacceptable. This study
demonstrates that rotavirus vaccines would effectively prevent approximately twenty
deaths a year, among children under-five years in Malaysia. Rotavirus vaccination would
result in annual savings of up to RM 82 million to the healthcare provider and RM 115
million to society. (Table 5.5)
At PAHO prices, both vaccines are cost-saving. However, interpretation of cost-
effectiveness at market prices differ with thresholds used. When using the WHO-
CHOICE thresholds, at market prices Rotarix® programmes are cost-effective and
RotaTeq® programmes are not cost-effective from the healthcare provider’s perspective;
while both vaccines are cost-effective from the societal perspective. Using other cost-
effectiveness thresholds (Societal WTP and Marginal productivity thresholds), both
vaccines are not cost-effective at market prices, from both the healthcare provider and
societal perspectives.
While the WHO-CHOICE thresholds are widely used in economic evaluations, these
thresholds are easily achieved, negating its usefulness as a decision rule for national
resource allocation. WHO-CHOICE thresholds were suggested for regional resource
allocation and not for national decision-making. Achieving cost-effectiveness with
WHO-CHOICE thresholds does not ensure affordability, which is crucial for adoption of
a vaccination programme decisions (Marseille et al., 2015; Newall et al., 2014; Shillcutt
Univers
ity of
Mala
ya

160
et al., 2009). As such, threshold analysis was conducted in this thesis at various cost-
effectiveness thresholds suggested for Malaysia.
The Societal WTP threshold for Malaysia used for this thesis, was based on an
empirically measured individual WTP in a Malaysian population. The Societal WTP
estimated was 0.81 times of the 2013 per-capita GDP of Malaysia (Shafie et al., 2014).
These findings were within the range of that estimated by another recent cross-sectional,
contingent valuation study conducted in the states of Penang, Kedah, Selangor, and Kuala
Lumpur, using a stratified multistage cluster random sampling technique. This study
determined an average WTP per-QALY gained of 0.59 to 0.84 times of GDP per-capita
in Malaysia (Y. W. Lim, Shafie, Chua, & Hassali, 2014)77. Thailand, a neighbouring
middle-income country uses a locally established threshold of 160,000 Baht or 0.9 times
the annual GDP per-capita of Thailand (Teerawattananon, Tritasavit, Suchonwanich, &
Kingkaew, 2014).
This cross-sectional study conducted in the state of Penang, is the first to empirically
measure individual WTP for an additional QALY in Malaysia. However, this study had
several limitations. In the absence of a population-based sampling frame, convenient
sampling was performed in this study. Also, this study was conducted in the island state
of Penang, with a wealthier population and a different ethnic distribution compared to the
rest of Malaysia, thus may not be representative of the population distribution of the
country (Shafie et al., 2014).
In this thesis, individual WTP from the Penang study was used to estimate societal
WTP for Malaysia, by adjusting for differences in average wealth by using GDP per-
capita. This preference based threshold is much lower than that of the WHO-CHOICE
threshold and may be useful to inform policy. However, to make a meaningful
contribution, there is need for a nation-wide, representative survey with appropriate
77 This 2014 study was not used in this thesis, as it was still unpublished at the time of this writing. The study results were
presented in a poster. http://www.ispor.org/ScientificPresentationsDatabase/Presentation/51577
Univers
ity of
Mala
ya

161
methodology (random sampling and adequate sample size), to properly evaluate societal
WTP in Malaysia. This is an area for future research.
However, individual valuation of health relates to personal income and not the
healthcare budget. Thresholds based on consumer sovereignty approach (Societal WTP
threshold), have limited usefulness in conditions of budgetary constraints, as
interventions deemed cost-effective using these thresholds may prove to be unaffordable
(Revill et al., 2014).
Health systems aim to allocate scarce healthcare resources in order to best maximise
health gains for the population78. Cost-effectiveness analysis compare the costs and
benefits of alternative healthcare interventions in aid of decision making. For results of
cost-effectiveness analysis to align with aims of population health maximisation, cost-
effectiveness thresholds should reflect the opportunity costs of health benefits foregone
(Revill et al., 2014).
Researchers at the University of York estimated cost-effectiveness thresholds for
various countries based on estimates marginal productivity from the NHS, combined with
GDP per capita of the United Kingdom and other countries, with income elasticities of
the value of statistical life. These thresholds were a first attempt to inform policy on
resource allocation with the aim of population health maximisation (Woods et al., 2015).
The thresholds suggested by the University of York rely on the assumptions that the
differences in the consumption value of health (individual and societal WTP) and
marginal productivity of a health system in generating health, are constant across
countries. Also, the NHS, in the United Kingdom was assumed to be typical of all health
systems, in terms of efficiency of health production. These assumptions may lead to over-
or under-estimation of thresholds, and these biases can only be over-come by examining
country-level empirical estimates of marginal productivity.
78 Utilitarian principles of efficiency. See Subsection 3.2.2, page 44.
Univers
ity of
Mala
ya

162
The cost-effectiveness thresholds resulting from the York analysis are substantially
lower than thresholds previously applied in many countries, especially the WHO-
CHOICE thresholds of one to three times of GDP per capita. The upper bounds of these
thresholds indicate values of 51 per cent of GDP per-capita for low-income countries and
71 per cent GDP per-capita for middle-income countries (Woods et al., 2015). The upper
bounds of marginal productivity thresholds for Malaysia are 60 per cent of the GDP per
capita of Malaysia. This is even lower than the Societal WTP threshold estimates (80 per
cent of the GDP per capita of Malaysia).
Cost-effectiveness thresholds based on the human capital approach have little
relevance to either societal WTP for interventions or healthcare budgets. While thresholds
based consumer sovereignty are often aspirational, informing decisions based on what
individuals in a society feel is appropriate to pay for health, (Woods et al., 2015) without
consideration of budgetary constraints. When healthcare budgets are limited, policy-
makers aim to maximise population health while remaining within budgets. Without the
reference to affordability, cost-effectiveness analysis have little relevance in informing
resource allocation.
The Marginal Productivity threshold is recommended for use in this thesis as a
reference for cost-effectiveness. These thresholds suggested by researchers at York
University were estimated based on empirical estimates of foregone benefits, from the
English NHS and using international income elasticities of the value of health. These
thresholds were determined in accordance to the health systems goal of population health
maximisation within budgetary constraint, and reflects opportunity costs. While these
figures are far from definitive, they are useful in this thesis to inform ‘cost-effective’
prices for rotavirus vaccines. These thresholds are a starting point for research on cost-
effectiveness thresholds for Malaysia that reflect opportunity costs.
Univers
ity of
Mala
ya
163
The thresholds suggested for Malaysia are 60 per cent of GDP per capita for Malaysia,
and much lower than the WHO-CHOICE thresholds. Cost-effective vaccine prices are
between RM 76 to RM 85 per-dose for Rotarix® (RM 153 to RM 169 per-course) and
between RM 44 to RM 49 per-dose for RotaTeq® (RM 131 to RM 147 per-course).
Vaccination programmes would cost between RM 93 and RM 102 million for Rotarix®,
and between RM 90 and RM 98 million for RotaTeq®. Vaccination programmes cost
approximately three per cent of the MOH public health budget and 0.6 per cent of the
MOH operating budget for 2012.
Although tender prices are not known in advance, prices for vaccines in national
immunisation programmes are often substantially lower than market prices. Policy-
makers often require cost-effectiveness analysis to be conducted at market prices, at
which rotavirus vaccination programmes are seldom cost-effective or affordable. High
vaccine prices are a perceived financial barrier for inclusion of rotavirus vaccines in
middle-income countries (E. A. S. Nelson et al., 2013).
While rotavirus vaccine prices are in the public domain for the PAHO Revolving Fund
(RM 41 to 49 per course) and Gavi, the Vaccine Alliance (RM 15 per course), prices
negotiated by individual governments are not available internationally. Tiered pricing
mechanisms and price opacity of vaccines hinders the efforts of individual governments
and aid organisations to effectively negotiate vaccine prices. Pricing opacity or the lack
of transparency in vaccine pricing, allows pharmaceutical companies to implement
unregulated differential pricing between countries79 (Medecins Sans Frontieres, 2015; E.
A. S. Nelson et al., 2013; Rappuoli, 2015). For these reasons, cost-effective prices
determined in this thesis are of practical value to aid future price negotiations for rotavirus
vaccines by the MOH, Malaysia.
79 An example of this is the higher rotavirus vaccine pricing at Morocco and Tunisia, both non-Gavi eligible middle-income
countries, compared to rotavirus vaccine prices in France, a high-income country (Rappuoli, 2015).
Univers
ity of
Mala
ya

164
In low- and middle-income countries worldwide, rotavirus vaccines have been found
to be cost-effective at low vaccine prices. A cost-effectiveness analysis of rotavirus
vaccination in 72 GAVI-eligible countries found the cost per DALY averted was RM 42
for all GAVI-eligible countries combined. Rotavirus vaccination would be considered
‘very cost-effective’ according to the WHO-CHOICE threshold, for all GAVI countries
as a group and in each country individually, as ICERs were less than the GDP per capita
(Atherly et al., 2012).
A 2010 systematic review of economic evaluations of rotavirus vaccines in developing
countries, concluded that although rotavirus vaccines were cost-effective interventions in
developing countries, vaccine prices was the dominant parameter influencing cost-
effectiveness. Lack of affordability was the main barrier for rotavirus vaccine
introduction (Tu et al., 2011).
An estimation of cost-effectiveness of rotavirus vaccines in developing countries at
different vaccine prices ranges, found that rotavirus vaccines were cost-effective in
middle-income countries when prices are low. (R. D. Rheingans et al., 2009)
As there is no threshold in Malaysia to determine affordability of a vaccination
programme, programme affordability can only be definitively determined by the budget
holder. In this thesis, the results of a budget impact analysis (comparing programme costs
with budgets) provide additional information to decision makers to gauge programme
affordability.
In 2012, the total operating budget of the MOH, Malaysia was RM 16.8 billion, with
RM 3.4 billion spent on public health (Ministry of Health Malaysia, 2012a). At PAHO
prices, rotavirus vaccination programmes are about one per cent of the 2012 public health
expenditure of the MOH, Malaysia. While at cost-effective prices, as defined by the
Marginal Productivity thresholds, vaccination programmes are approximately three per
cent of the public health budget. Hence, it is likely that a publicly financed, universal
Univers
ity of
Mala
ya

165
rotavirus vaccination programme in Malaysia, at negotiated vaccine prices in line with
international tenders, would be cost-effective and affordable in Malaysia.
This study has several limitations. In this evaluation, additional administrative costs of
vaccination programmes was derived by regression analysis of empirically measured
costs conducted at different countries. Ideally, costing and financial planning for
universal vaccination should be empirically measured, using guidance from the WHO-
UNICEF cMYP immunisation (World Health Organization, 2014b). Unfortunately,
empirical measurements of programmatic costs was beyond the scope of this study, as the
information needed for this costing is not available outside the MOH.
As there are no local or regional evaluation on the impact of rotavirus gastroenteritis
on young children, HRQol weights derived from a Canadian study was used in this
evaluation (Brisson et al., 2010). The Canadian study used here is methodologically
superior to a similar study conducted in the United Kingdom, as parents and not
healthcare professionals were used to evaluate HRQoL loss in children (Martin et al.,
2008). The methodological difficulties of estimating QALYs in children, including the
lack of validated measurement tools specifically designed to assess children under the age
of five years, hamper the conduct of these assessments in Malaysia. This is an avenue for
future research.
Efficiency of vaccination programmes cannot be measured empirically prior to
inclusion into a countries’ national immunisation programme. As such, models are used
in economic evaluations of vaccination programmes. Models synthesize all available
parameter inputs, to make projections on health and economic impact. Assumptions are
made and input parameters are often based on estimation. Thus, modelling is subject to
uncertainty (Joke Bilcke & Beutels, 2009; Jain, Grabner, & Onukwugha, 2011).
In model based economic evaluations, uncertainty can be classified into
methodological, model and parameter uncertainty (Joke Bilcke & Beutels, 2009; Briggs,
Univers
ity of
Mala
ya

166
2000; Jain et al., 2011). Methodological uncertainty relates to lack of standardisation in
analytical methods used. This for example, may be differences in time horizons,
perspectives and cost-effectiveness thresholds. In this study, the main methodological
assumptions used are based on international guidelines for economic evaluation
(Drummond et al., 2005; Edejer, 2003). Model uncertainty relates to the choice of model
structure, dynamic or static, used for evaluation. The choice of model is not crucial in
evaluation of rotavirus vaccines, as cost-effectiveness results by different models using
the same parameters, have been similar (Bakir et al., 2012; Postma et al., 2011). Simple
static models are frequently used to evaluate economic impact of rotavirus vaccine, as the
disease epidemiology and natural history is relatively uncomplicated (Bakir et al., 2012;
Beutels et al., 2003; Joke Bilcke & Beutels, 2009).
Parameter uncertainty refers to the uncertainty on the true values of input parameters.
Often multiple data sources of differing quality are synthesized for input into models,
leading to parameter uncertainty (Joke Bilcke & Beutels, 2009). Sensitivity analysis is
generally conducted to test the robustness of the study findings by varying parameters
used in the model. In this study, univariate and scenario based sensitivity analysis
revealed that that cost-effectiveness was sensitive to the variation in direct medical costs,
incidence of rotavirus gastroenteritis hospitalisations and vaccine efficacy. However,
rotavirus vaccines were found to be highly cost saving at base-case price and not cost-
effective at market price. This demonstrates that cost-effectiveness is greatly influenced
by vaccine price. As Malaysia has no explicit cost-effectiveness threshold, it was thus
informative to conduct a threshold analysis at different thresholds to inform price
negotiations.
Univers
ity of
Mala
ya

167
5.5 Conclusion
Universal rotavirus vaccination is likely to reduce the health and economic burden
associated with rotavirus, and depending on negotiated prices, is potentially cost saving
and affordable in Malaysia. This first economic evaluation of rotavirus vaccines for
Malaysia, suggests that rotavirus vaccines represent good value for money and are
potentially affordable depending on negotiated vaccine prices. A range of cost-effective
prices are suggested here to aid in vaccine price negotiations.
In the next chapter, data from a two year, hospital-based prospective rotavirus
gastroenteritis surveillance study was examined to explore the household impact and
income-related inequities of healthcare payments for rotavirus gastroenteritis requiring
hospitalisation in Malaysia.
Univers
ity of
Mala
ya

168
CHAPTER 6: HOUSEHOLD CATASTROPHIC HEALTHCARE
EXPENDITURE AND IMPOVERISHMENT DUE TO ROTAVIRUS
GASTROENTERITIS REQUIRING HOSPITALISATION IN MALAYSIA
6.1 Introduction
Rotavirus gastroenteritis results in substantial burden to the healthcare provider and
society in Malaysia. The average costs incurred by households for an episode of rotavirus
gastroenteritis requiring hospitalisation was estimated at RM 766 (range RM 186 to RM
2,914) in 2013 RM, which constituted 26 per cent of the average monthly household
income in 2007 (Chai & Lee, 2009). Although the impact of healthcare payments on
households due to rotavirus gastroenteritis is potentially high, this impact has not been
fully explored in Malaysia.
Whilst out-of-pocket (OOP) healthcare expenditure incurred due to an acute diarrhoeal
illness may not be large in magnitude, it may be financially catastrophic to some
households. Direct medical costs paid OOP exceeding ten per cent of household income
are widely considered to be catastrophic, as it can potentially disrupt household living
standards (O'Donnell & Wagstaff, 2008). Unexpected healthcare payments, incurred
OOP may push families into poverty.
The financial implications of OOP healthcare payments are different among the rich
and the poor. The poor are likely to spend more of household income on basic necessities,
like food, shelter and other essentials, thus are more vulnerable to unanticipated expenses.
The rich have more resources and better ability to smooth consumption (Flores,
Krishnakumar, O'Donnell, & Van Doorslaer, 2008; Kruk et al., 2009; S. Russell, 1996).
Large OOP payments may deter the poor from seeking care, underestimating the financial
consequences of ill-health (Ke Xu et al., 2006). Other than the costs of actual treatment,
the cost of seeking care, including transportation and food, and the loss of income, may
adversely impact household welfare (Alam & Mahal, 2014).
Univers
ity of
Mala
ya

169
Hence a universal rotavirus vaccination programme has the potential to provide
financial risk protection by alleviating the economic burden due to childhood diarrhoea,
particularly for the poorest households. However, the magnitude and distribution of this
household burden has not been previously described in Malaysia, so the potential benefit
of rotavirus vaccination in this respect is still not clear.
In this chapter, economic costs incurred by households for an episode of rotavirus
gastroenteritis requiring hospitalisation were assessed. The levels and distribution of
catastrophic healthcare expenditure incurred, the poverty impact and income-related
inequities of OOP healthcare expenditure were explored. This study was based on
analysis of patient-level data from a two-year prospective, hospital-based rotavirus
surveillance study conducted at two public hospitals in Malaysia.
The chapter begins with Section 6.2, which presents a study overview, a description
of the study setting and data collection, as well as descriptions of the terms and methods
used in the analysis. Next Section 6.3 presents the study findings. This is followed by
Section 6.4, which discusses the study findings, limitations and policy relevance. The
chapter ends with Section 6.5, which provides concluding statements.
6.2 Materials and methods
6.2.1 Study overview
In this chapter, primary patient-level data from a two-year, two-hospital rotavirus
gastroenteritis surveillance study was analysed, to explore the magnitude and
distributional effects of illness-related expenditure on households in Malaysia.
Data collection for this study was conducted from 2008 to 2010, and was led by two
paediatricians Professor Dr. Lee Way Seah, from University Malaya Medical Centre
Univers
ity of
Mala
ya

170
(UMMC), Kuala Lumpur and Dato’ Dr. Jimmy Lee Kok Foo, from Hospital Sultanah
Nur Zahirah (HSNZ), Kuala Terengganu80.
This two-year, two-hospital, rotavirus surveillance study was conducted primarily to
obtain the rotavirus genotype distribution in Malaysia, and these results were published
in 2012 (Lee et al., 2012). Also collected was information on the clinical features, health
service utilisation and management of acute gastroenteritis, and costs incurred by
households for acute gastroenteritis episodes resulting in hospital admission. This
collected information was not previously analysed or described, and is useful for the
economic evaluation of rotavirus conducted in this thesis. This dataset was chosen for
analysis in this thesis, because it was the most recent hospital-based rotavirus study
conducted in Malaysia. Also, this dataset was chosen because it contained information on
household expenditure for rotavirus gastroenteritis resulting in hospitalisation relevant to
the objectives of this thesis.
Analysis of this dataset has also provided information for the estimation of national
burden of rotavirus (Chapter 4) and cost-effectiveness of rotavirus vaccines (Chapter 5)
in this thesis. Results of the analysis in this current chapter (Chapter 6), motivates and
provides inputs for the extended costs effectiveness analysis (ECEA) to be described in
Chapter 7.
A description of the hospital-based rotavirus study including the study settings and
data collection are provided in Subsection 6.2.2 and 6.2.3. This is followed by Subsection
6.2.4, in which the study terms and measures used in the analysis are described.
80 The author of this thesis was not involved in the study design or data collection for this hospital-based rotavirus study. The
author performed the data entry, cleaning and analysis of the data set. The author of this thesis designed and conducted the data
analysis for this chapter, the findings of which have been published (Loganathan, Lee, Lee, Jit, & Ng, 2015).
Univers
ity of
Mala
ya
171
6.2.2 Study settings
The two-year, prospective, hospital-based study of rotavirus gastroenteritis was
conducted from 1st April 2008 to 31st March 2010 at the paediatric departments of
UMMC, Kuala Lumpur and HSNZ, Kuala Terengganu.
UMMC is a 1600-bedded, publicly-funded, teaching hospital under the Ministry of
Higher Education, located in Kuala Lumpur, the federal capital of Malaysia. It serves the
mainly urban populations of Kuala Lumpur and the neighbouring city of Petaling Jaya.
HSNZ is an 800-bedded, publicly-funded, general hospital under the MOH, Malaysia.
It serves as the referral hospital for state of Terengganu, on the east coast of Malaysia and
caters to a predominantly rural population.
Both UMMC and HSNZ are tertiary medical hospitals, serving very different
catchment populations. UMMC serves the population of Kuala Lumpur and Selangor.
Kuala Lumpur is 100 per cent urban, while more than 90 per cent of the population of
Selangor live in urban areas. In contrast, HSNZ serves as a referral centre for the relatively
rural state of Terengganu where about half of the population of the state live in rural areas
(Department of Statistics Malaysia, 2010b).
6.2.3 Data collection
All children aged between one month and five years admitted for acute gastroenteritis
at both hospitals were considered eligible for the study. Acute gastroenteritis was defined
as an acute diarrhoeal illness with more than three episodes of loose stool within a 24
hour period, lasting less than ten days prior to admission. Children in
immunocompromised states, with surgical conditions or systemic infections predisposing
to diarrhoea were excluded from this study.
Written informed consent was obtained prior to inclusion into the study. After
informed consent was obtained, trained study personnel interviewed parents or guardians
using a standard, structured questionnaire. Faecal samples were obtained for rotavirus
Univers
ity of
Mala
ya

172
detection. Interviews were conducted at set time intervals; on admission and discharge of
patients, and every 48 hours after discharge until the cessation of diarrhoea. Face-to-face
interviews were conducted upon admission and discharge, while telephone interviews
were conducted after discharge.
The questionnaire used in this study was derived from the WHO Generic Protocol for
hospital-based rotavirus surveillance, and was designed to estimate the burden of
rotavirus gastroenteritis (World Health Organization, 2002a). Information collected
included health seeking behaviour, preadmission and inpatient management of diarrhoeal
illness, and all expenses incurred before, during and after hospitalisation, as well as
productivity loss of parents.
Stool samples were tested for rotavirus using a commercial kit, Premier® Rotaclone®
(Meridian Biosciences, Cincinnati, Ohio). This enzyme immunoassay test has a
sensitivity and specificity of 99 per cent and is recommended for rotavirus surveillance
by the WHO (World Health Organization, 2002a). Stool samples that tested positive for
rotavirus were deep frozen at −80°C, and sent to the Murdoch Childrens’ Research
Institute in Australia for genotyping. Details of the study protocol and results of viral
genotyping have been published previously (Lee et al., 2012).
6.2.4 Description of terms
The dataset provided information of all costs (direct and indirect) incurred during the
entire episode of diarrhoeal illness. In this section, the definitions used in this chapter and
the underlying rationale for the analysis is explained.
6.2.4.1 Direct medical costs
Direct medical costs were all OOP healthcare expenditure incurred, including
consultation fees and medication costs incurred prior to admission, as well as hospital
bills paid for the current and any other hospitalisations within the same illness episode.
Univers
ity of
Mala
ya

173
Full information on hospital bills paid by patients was collected at UMMC, however
this information was not collected at HSNZ. Although the Finance Department at HSNZ
was contacted, confirmation on hospital bills paid was not forthcoming. While, it was
possible to estimate hospital bills from the daily ward charges and laboratory test charges,
this would not accurately represent the OOP payments at MOH facilities.
In Malaysia, publicly provided healthcare services are highly subsidised. Also, a large
segment of patients are exempt from fees including school children, pregnant mothers,
public sector employees and their dependents, people with disabilities and the
socioeconomically disadvantaged (Kananatu, 2002). Despite the subsidies, many do not
settle hospital bills at MOH hospitals especially at rural settings. The NHMS 1996 which
specifically looked at health seeking behaviour and OOP healthcare payments in
Malaysia found that 92.5 per cent of respondents utilised government clinics and 66.4 per
cent utilised government hospitals for free. Furthermore, this survey demonstrated that
the average hospital charges paid in the state of Terengganu was a third that of payments
made at Kuala Lumpur (Ministry of Health Malaysia, 1996).
For these reasons, the assumption was made that hospital bills paid at HSNZ were
zero81.
6.2.4.2 Direct non-medical costs
Direct non-medical costs included transportation costs, cost of extra diapers and
special food. Transportation costs were defined as the additional expenditure related to
travel while seeking care, including petrol and toll charges, parking fees and bus or taxi
fares. The cost of extra diapers and special food was defined as expenditure above normal
consumption due to illness.
81 Although this could not be confirmed by the Finance Department at HSNZ, Kuala Terengganu, it was assumed that children
were not charged for hospitals admissions for acute diarrhoeal illness at HSNZ.
Univers
ity of
Mala
ya

174
6.2.4.3 Indirect costs
Indirect costs were defined as the loss of productivity of parents for the duration of
illness. In this study, self-declared parental income and work-days missed due to illness
was collected for both parents (mother and father). This allowed calculation of
productivity loss for both parents.
For working parents with self-reported monthly income and work-days missed,
productivity loss was calculated by multiplying daily wage with days of work missed. As
it was assumed that wage-earners worked a six-day week, the daily wage was calculated
by dividing the self-reported monthly income by 26.
Productivity loss for non-working parents or unpaid caregivers was not included. This
is a conservative assumption, as caring for an ill child, would likely displace caregivers’
time that would otherwise be spent on productive or leisure activities.
6.2.4.4 Catastrophic healthcare expenditure
(a) Background
OOP healthcare expenditure are often unexpected and involuntary, and can be thought
of as a ‘health shock’ (Adam Wagstaff, 2008). When a large fraction of household
resources is spent on illness-related expenditure, less resources remain for the
consumption of other basic needs, like food, education and shelter, and this may force
households to sell assets or incur debt, leading to impoverishment (McIntyre, Thiede,
Dahlgren, & Whitehead, 2006; S. Russell, 2004). OOP healthcare expenditure are
payments for healthcare made directly at the point of care, and these may deter the poor
from seeking needed care.
Unanticipated OOP healthcare payments above a certain threshold of household
income may have an adverse impact on household living standards and can be considered
to be financially catastrophic (Berki, 1986; O'Donnell & Wagstaff, 2008; Ke Xu et al.,
2010).
Univers
ity of
Mala
ya

175
Ideally, longitudinal data is needed to study household response to health shocks, in
terms of changes in consumption of non-medical goods and services. The use of
longitudinal data would better determine the impact of illness-related payments on
household living standards (Gertler & Gruber, 2002). Since cross-sectional data is most
often available, an approximation of the fraction of expense in relation to resources which
disrupts household welfare is required82 (Berki, 1986; O'Donnell & Wagstaff, 2008; S.
Russell, 2004; Adam Wagstaff & Van Doorslaer, 2003; Ke Xu et al., 2003).
Medical spending is defined as catastrophic, when it exceeds a specified threshold or
fraction of total household resources, over a given time period, usually a year (O'Donnell
& Wagstaff, 2008). The idea being, spending a large fraction of household resources on
healthcare must be at the expense of the consumption of other goods and services.
However, there is no consensus on the threshold value at which healthcare spending
depletes household resources and disrupts living standards. The threshold value set
depends on whether the denominator used is total household resources83 or non-
discretionary expenditure (Adam Wagstaff & Van Doorslaer, 2003). As the threshold
value selected is often arbitrary, sensitivity analysis is recommended to be performed
around the threshold (Adam Wagstaff, 2008).
Healthcare expenditure exceeding ten per cent of total household resources are widely
regarded as catastrophic by many, including researchers from the World Bank (McIntyre
et al., 2006; Pradhan & Prescott, 2002; Ranson, 2002; Adam Wagstaff & Van Doorslaer,
2003). The rationale being, healthcare expenditure exceeding ten per cent of total
household resources is likely to be at the expense of essential goods and services, forcing
82 When using cross-sectional data, a threshold value is determined, above which healthcare expenditure is considered
catastrophic. 83 Total household resources are either measured as total household income or expenditure. The catastrophic impact of healthcare
expenditure on households without savings are potentially higher than that of households with savings, and this may be reflected in
changes in consumption patterns. The use of household income as a denominator for catastrophic expenditure, may not be reflective of reduction in current consumption or the use of other coping mechanisms like access to savings and loans. In contrast, the use of
household expenditure as a denominator for catastrophic expenditure may reflect changes in household consumption (O'Donnell &
Wagstaff, 2008).
Univers
ity of
Mala
ya

176
households to reduce consumption of basic needs, sell assets or incur debt, and leading to
impoverishment (S. Russell, 2004).
Researchers at the World Health Organization use the threshold of 40 per cent of
‘capacity to pay’, to define catastrophic payments (Ke Xu et al., 2003). The denominator
of non-discretionary expenditure, or also called ‘capacity to pay’ is used as an indicator
of living standards (Ke Xu et al., 2003). Non-discretionary expenditure or total household
expenditure net of spending for basic necessities, is commonly indicated by non-food
spending (Adam Wagstaff & Van Doorslaer, 2003). The idea being, subtracting expenses
for basic necessities gives a better indication of a household’s ability to pay (Adam
Wagstaff, 2008).
The definition of catastrophic healthcare expenditure using the numerator of OOP
direct medical expenditure84 is conservative. This narrow definition does not include all
costs that impact household welfare, like direct non-medical expenditure and indirect
costs, which are usually not collected in household income and expenditure surveys,
commonly used in health systems research (Ke Xu et al., 2003).
When considered, indirect costs often exceed direct costs in detrimental household
impact (McIntyre et al., 2006). In Indonesia, Gertler and Gruber (2002) found that loss of
earnings resulted in greater health shocks to households compared to direct illness-related
expenditure. Also, while some may forego seeking formal treatment to avoid OOP
payments, households still suffer loss of earnings due to foregone work days by the sick
person or caregivers (Alam & Mahal, 2014).
Another limitation associated with these threshold-based definitions of catastrophic
healthcare expenditure, is that they fail to consider how expenses are financed, ignoring
the households’ capacity to cope by drawing on current spending, savings, assets or loans
to pay for healthcare. By not considering the source of funds, this limits the ability to
84 OOP direct medical expenditure consists of the cost of medical care and treatment of illness paid OOP on the receipt of care.
Univers
ity of
Mala
ya
177
identify households for whom healthcare is truly affordable85 (Flores et al., 2008; Kruk
et al., 2009). Also, these threshold-based definitions fail to consider those who do not
seek healthcare due to high OOP healthcare payments (Adam Wagstaff, 2008).
The idea of catastrophic expenditure as a ‘health shock’ is that it is unexpected and
unanticipated. Such unplanned healthcare expenditure displaces essential household
consumption, disrupting household welfare. Spending a large fraction of household
resources on healthcare could threaten living standards in the long term and lead to
poverty, by triggering coping mechanisms like the sale of assets and debt accumulation
(Alam & Mahal, 2014; McIntyre et al., 2006; Van Doorslaer et al., 2007).
(b) Measures used in this analysis
Catastrophic healthcare expenditure was defined in this thesis as OOP direct medical
costs exceeding ten per cent of monthly household income (O'Donnell & Wagstaff, 2008).
It is usual to define healthcare expenditure as catastrophic when it exceeds a fraction
of household income over a given period of a year (O'Donnell & Wagstaff, 2008).In this
chapter, OOP costs incurred were compared with monthly income. This is because illness
associated with rotavirus is in the short term, with a duration of illness of no longer than
a week. Also the first rotavirus infection is the most severe; the subsequent infections are
milder or asymptomatic. As such, rotavirus episodes requiring hospitalisation are unlikely
to be repeated (Bernstein, 2009). Considering that expenses incurred for rotavirus are
over a short duration and are unlikely to be repeated, costs and income were not
annualised in this analysis.
The measures used in this study give an indication on the short-term household impact
of illness-related expenditure for an episode of rotavirus gastroenteritis requiring hospital
admission. The limitation of the use of cross-sectional data, is that households in the short
85 For example, wealthy households may spend large portions of income on non-essential healthcare like cosmetic surgery, which
even though is expensive may be affordable to them. While, the poor may resort to selling assets or incurring debt, to pay for relatively
small healthcare expenses, masking the impact of excessive expenses on income (S. Russell, 1996).
Univers
ity of
Mala
ya

178
term may have better ability to cope with unexpected payments, which will not be
detected here.
In this chapter, the threshold of ten per cent of total household income was used to
indicate catastrophic expenditure. While the appropriate threshold for use as a marker of
catastrophic expenditure is debatable, the threshold of ten per cent is used by researchers
at the World Bank (O'Donnell & Wagstaff, 2008). The threshold of ten per cent is widely
regarded as catastrophic when the denominator of total household income is used
(O'Donnell & Wagstaff, 2008). Expenditure exceeding the threshold of ten per cent of
total income is regarded to be at the expense of consumption of essential goods and
services, adversely impacting household living standards (S. Russell, 2004). In this
chapter, catastrophic expenditure was explored at different thresholds from five per cent
to 20 per cent, as a sensitivity analysis. These results are shown in Figure 6.2.
In this chapter, catastrophic headcount or incidence of catastrophic healthcare
expenditure was generated. The impact of all illness-related expenses, both direct and
indirect costs on household income, were also considered. This was particularly important
from the household perspective, as the economic burden on households, in addition to
OOP direct medical costs, also include direct non-medical costs and productivity loss.
The distributional impact of healthcare payments on households was explored over
income quintiles.
6.2.4.5 Poverty impact
(a) Background
Impoverishment has been described as the “processes of household asset depletion and
income loss that cause consumption levels to fall below minimum needs” (S. Russell,
2004, p. 147). Illness can contribute to impoverishment through two main pathways.
Firstly, illness may result in income loss, either through death or the loss of productive
Univers
ity of
Mala
ya
179
time. Secondly, illness-related expenses may lead to depletion of household assets and
debt accumulation.
Illness can be considered impoverishing when a household’s income was above the
poverty line before making healthcare payments, but subsequent to payments fall below
the poverty line. The poverty line being the income threshold below which even the
minimum standard of living is not ensured (Ravallion, 2010).
Poverty is a complex and multi-dimensional phenomenon. Due to its multidimensional
nature, poverty is often difficult to define. A common definition of poverty is whether
households or individuals have enough resources to meet their basic needs (Coudouel,
Hentschel, & Wodon, 2002; Narayan-Parker & Patel, 2000). Poverty has been defined as
the lack of basic requirements for material well-being, especially food, but also monetary
and physical assets, leading to physical deprivation. Poverty also has been described as a
deprivation of individual capabilities, like a lack of education or health, which prevents
the attainment of well-being (Narayan-Parker & Patel, 2000). Also, poverty has
psychological, cultural and social dimensions, which encompass an individual’s lack of
power and independence that lead to the breakdown of social norms and social
exclusion86. Under the multidimensional approach, poverty is also associated with the
lack of infrastructure including roads, electricity, access to clean water and sanitation,
education and healthcare (Narayan-Parker & Patel, 2000; Saksena et al., 2014).
While poverty is multidimensional, standard measures of poverty compare a monetary
measure of household economic welfare, namely household income, with a poverty line.
Households with income levels below the Poverty Line Income (PLI) are deemed poor.
PLI being the minimum income sufficient to obtain the basic necessities in life, including
food and non-food items (Zin, 2007).
86 Social exclusion is the alienation and disenfranchisement experienced by the poor, which is manifested by the inability to
participate in social activities (Narayan-Parker & Patel, 2000).
Univers
ity of
Mala
ya

180
The threshold for absolute poverty is internationally determined, as the absolute
minimum income for survival, for any person worldwide (Ravallion, 2010). International
poverty lines allow for standardised monitoring between countries of global trends in
poverty. International poverty lines87 as determined by the World Bank, were used in the
first Millennium Development Goal, as a measure of progress towards eradication of
absolute poverty88. High- and middle-income countries have higher standards of living
than low-income countries. Hence, international poverty lines are a modest measure, too
low to meaningfully capture poverty in these settings (United Nations Development
Programme, 2007).
Relative poverty interprets poverty in relation to the prevailing standards of living of
society, thus is different between countries and over time. The poverty line under this
approach may be calculated for a country, in terms of average income89. The concept of
relative poverty, is that the income line is the minimum standard below which no
household should fall below, and these standards should rise as the country becomes
richer, with the rising standard of living (Ravallion, 2010).
The concept of PLI assumes the same minimum standard of living for all members of
society. However, since individuals in a society have different basic needs90 and also as
prices differ according to geographic locations91, the same poverty line can hardly be used
for all in society. In keeping with this rationale, the Malaysian Government revised the
methodology used to calculate the PLI for Malaysia, in the Ninth Malaysian Plan (Zin,
2007).
87 International poverty line income, with the lower threshold of US$ 1 per day was calculated as the median of ten lowest poverty
lines from the world’s poorest countries. This threshold represents a minimum standard of living, also referred to as extreme poverty
(Ravallion, Datt, & Walle, 1991). The international poverty line was updated to US$ 1.90 per-day, as of October 2015 by the World
Bank.(World Bank, 2015b) 88 The first Millennium Development Goal of reducing by half between 1990 and 2015, the number of people living on less than
US$ 1 per day (United Nations Development Programme, 2007). 89 Relative poverty compares the ‘worse-off’ in society with the average or ‘norm’ in society. 90 Food and non-food needs differ for individuals depending on age and gender. For instance a child would have less caloric
requirements than an adult. 91 Difference in standard of living in different geographical regions or between urban and rural areas, explain price differences.
Univers
ity of
Mala
ya

181
(b) Poverty Line Income for Malaysia
The Household Income and Basic Amenities Survey is an income survey carried out
twice in five years since 1973, by the Department of Statistics, Malaysia. The main
objectives of this survey are to measure the economic well-being of the population, to
collect information on the income distribution of households, and to identify poverty and
accessibility to basic amenities. The 2009 Household Income and Basic Amenities Survey
provided data for the calculation of the 2009 Malaysian PLI.
The calculation of the poverty line was based on methodology first introduced in 2004,
which takes into consideration food and non-food PLI for households visited. PLI was
determined separately for each household surveyed, considering household size and
demographic composition, its location in Peninsular Malaysia or East Malaysia, and
urban and rural area92.
The food PLI was based on local expert recommendation on the minimum daily caloric
requirement for an average family of five persons (8,725 kilo calories). The kilo calorie
estimation was converted to a monetary value using retail prices. The non-food PLI was
determined by examining spending patterns of low-income households in the survey.
These non-food basic necessities include clothing, rental, electricity, transportation,
communication and others (Department of Statistics Malaysia, 2009; Zin, 2007).
(c) Measures used in analysis
In this thesis, the 2009 PLI, specific for urban and rural regions in Peninsula Malaysia
in 2009, was used to determine medical impoverishment (Department of Statistics
Malaysia, 2009). The 2009 PLI for Malaysia was appropriate for use in this current
analysis, as the data collection for the hospital-based study was conducted from the years
2008 to 2010.
92 This estimation takes into account individual consumption needs for a basic standard of living, which varies according to age
and gender, and cost of living in different regional locations, and urban and rural areas.
Univers
ity of
Mala
ya

182
Illness can be considered impoverishing when a household’s income was above the
poverty line before making healthcare payments, but subsequent to payments fall below
the poverty line. A household was considered poor if its total monthly income falls below
the poverty line.
The measures of medical impoverishment used in this thesis, compare illness-related
expenditure against monthly income giving an indication of the short-term poverty impact
due to illness-related expenditure. The long term consequences of illness-related
payments is not explored in this thesis, because the transient nature of the illness.
The poverty headcount is the number of households with a total monthly household
income below the poverty line, and is a measure of incidence of poverty (O'Donnell &
Wagstaff, 2008). Poverty headcounts were explored before and after healthcare
payments. The poverty impact of illness is the proportion of households that fall into
poverty, after deducting OOP direct medical payments from household income. The
poverty impact of direct and indirect costs on household income were also considered in
this chapter.
6.2.4.6 Income-related inequity in healthcare payments
(a) Background
The poor are particularly vulnerable to the burden of ill health. In a review of literature
on the economic impacts of health shocks on households in low- and middle-income
countries, Alam and Mahal (2014) found that OOP healthcare payments were particularly
detrimental to poor households. Poor households were more likely to spend a larger
portion of household income on healthcare payments. As a consequence, the catastrophic
and impoverishing impact of healthcare payments were likely to be concentrated among
the poor.
Poor households are more vulnerable and are less able to cope with unbudgeted OOP
payments compared to the rich. The poor have less physical and financial assets and
Univers
ity of
Mala
ya

183
access to loans, thus less ability to buffer expenditure. Hence, the poor are more likely to
cut back on consumption of basic necessities due to health shocks, compromising
household welfare (Alam & Mahal, 2014).
As the poor have less resources, OOP payments may deter the poor from seeking care
(O'Donnell & Wagstaff, 2008). Excessive reliance on OOP payments may ration services
away from the poor to those with ability to pay, exacerbating inequities in healthcare
access (Alam & Mahal, 2014; Ke Xu et al., 2003).
(b) Measures used in analysis
In this study, concentration curves and indices were generated to explore income-
related inequities in healthcare payments at both hospitals.
The concentration curve is a visual representation of health inequalities. The
concentration curve examines inequalities in the distribution of a health variable of
interest against a measure of living standard93.
In this analysis, a concentration curve displays the share of OOP healthcare payments
accounted for by the cumulative proportion of population groups, ranked from poorest to
richest. The line of equality is the diagonal (45-degree) line, representing no inequality in
OOP payments by household income. If the concentration curve falls on the line of
equality, every individual irrespective of household income, pays the same OOP for an
episode of rotavirus gastroenteritis requiring hospitalisation. The concentration curve that
lies above the line of equality indicates OOP payments concentrated among poorer
groups. In contrast, the concentration curve lies below the line of equality when OOP
payments are concentrated among the richer groups (O'Donnell & Wagstaff, 2008).
Concentration curves may be used to identify the existence of income-related health
inequalities. However, concentration curves does not measure the magnitude of
93 The concentration curve could examine any health sector variable, including the distribution of health outcomes (mortality or
morbidity), health behaviours (smoking, exercise, alcohol), healthcare programmes (uptake or success of programmes), or of interest
in this study, OOP healthcare payments. A living standards measure is a socio-demographic variable (income, geography, social class,
ethnicity) against which the distribution of the health variable of interest is assessed (O'Donnell & Wagstaff, 2008).
Univers
ity of
Mala
ya

184
inequities, nor does it allow for comparison between regions. While the concentration
curve is a visual representation of income-related health inequalities, the concentration
index is used to quantify the degree of inequalities (Kakwani, Wagstaff, & Van Doorslaer,
1997; O'Donnell & Wagstaff, 2008; A. Wagstaff, Paci, & van Doorslaer, 1991).
The concentration index is defined as twice the area between the concentration curve
and the line of equality. When the concentration index is zero, there is no income-related
inequality in OOP healthcare payments. When the concentration index takes a negative
value and the concentration curve lies above the line of equality, this indicates a
disproportionate concentration of OOP payments among the poor. A positive
concentration index and a concentration curve that lies below the line of equality,
indicates that OOP payments are concentrated among the rich. The concentration index
is valued between −1 and +1 (O'Donnell & Wagstaff, 2008).
6.2.5 Statistical Analysis
The original patient information sheets from both hospitals were obtained for this
current study. The analysis for this study began with data entry and cleaning. Patient
information sheets were scrutinised to confirm that each case fulfilled eligibility criteria.
Of the 483 patients recruited at UMMC during the study period, 16 cases (three per cent)
were discarded as they did not fulfil eligibility criteria. Likewise at HSNZ, 337 patients
were recruited and 4 cases (one per cent) were excluded for not fulfilling eligibility
criteria. The main reason for non-fulfilment was age; however one case was discarded
because the patient did not have symptoms of diarrhoea.
Patients were divided into groups according to rotavirus status: all cases of acute
gastroenteritis, rotavirus gastroenteritis and non-rotavirus gastroenteritis. Analysis was
done separately to compare gastroenteritis groups at each hospital and subsequently the
datasets were merged, to compare findings between both hospitals.
Univers
ity of
Mala
ya

185
All costs, where appropriate, were presented as mean (± standard deviation, SD).
Kolmogorov–Smirnov test was applied to test for normality of distribution. Independent
sample t-test was used to test differences in means. Mann-Whitney U test was applied to
test differences between groups when the assumption of normality was not met. A p-value
of 0.05 was considered as statistically significant. The catastrophic impact of healthcare
payments on households distributed by income quintiles was explored. Concentration
curves and indices were generated, to explore the magnitude of income-related
inequalities in OOP direct medical payments for acute gastroenteritis episodes at both
centres.
Costs were inflated to 2013 price values using GDP deflators (Department of Statistics
Malaysia, 2012a). All costs were reported as 2013 Ringgit Malaysia (RM). The World
Bank exchange rate for 2013 of US$ 1 to RM 3.15 was used for currency conversion
(World Bank, 2014a).
The Malaysian Poverty Line Income (PLI) for 2009, stratified for urban and rural areas
in Peninsular Malaysia was used. PLI in 2009 for urban regions was used for Kuala
Lumpur (RM 771), and for rural regions was used for Kuala Terengganu (RM 743)
(Department of Statistics Malaysia, 2009).
Statistical analysis was performed using SPSS version 20.0 (SPSS Inc., Chicago,
Illinois, USA).
Univers
ity of
Mala
ya

186
6.2.5.1 Handling of missing values of household income
The study datasets had missing values of household income. The original questionnaire
used for data collection did not collect information on monthly household income. These
variables were included after the start of data collection, to allow for estimation of indirect
costs and the impact of OOP payments on household income. As such, the first 31 cases
(seven per cent) from UMMC, Kuala Lumpur and 80 cases (24 per cent) from HSNZ,
Kuala Terengganu did not contain information on household income. Over the course of
the study, a further nine cases (two per cent) from UMMC and 47 cases (14 per cent)
from HSNZ contained missing values for household income.
Table 6.1 shows missing values for total household income at UMMC and HSNZ.
Table 6.1: Missing values for total household income at UMMC, Kuala Lumpur
and HSNZ, Kuala Terengganu
UMMC HSNZ
Total sample 467 (100%) 333 (100%)
Household income not collected 31 (7%) 80 (24%)
Missing values 9 (2%) 47 (14%)
Total missing values (Household income) 40 (9%) 127 (38%)
UMMC, Universiti Malaya Medical Centre; HSNZ, Hospital Sultanah Nur Zahirah
Univers
ity of
Mala
ya

187
The pattern of missing values for total monthly income at both centres was examined
to inform appropriate measures to deal with missing values.
At UMMC, there was no difference in total direct costs between cases with missing
total monthly income and those with no missing values (RM 614 vs. RM 596; p = 0.79).
The Little’s (1988) MCAR test was non-significant (p = 0.79) indicating that data was
missing completely at random (MCAR) (Allison, 2001; Little, 1988).
At HSNZ, total direct costs were lower in those with missing values compared with
cases with no missing values of total monthly income (RM 19 vs. RM 32; p < 0.0001).
Significant results of the Little’s MCAR test (p < 0.0001), suggests that data was either
missing at random (MAR) or not missing at random (NMAR) (Schlomer, Bauman, &
Card, 2010).
In rural areas, some may rely on a traditional subsistence economy and may not receive
a fixed wage (e.g. farmers, fisherman). This may explain non-disclosure of monthly
income at Kuala Terengganu. While the possibility of NMAR if ignored may bias results,
there is no consensus on the appropriate methods to be used to reduce bias (Buhi,
Goodson, & Neilands, 2008).
In this chapter, multiple imputations method was used for the HSNZ dataset with
specifications to best deal with the missing values. In this hospital-based study,
information was collected on clinical features and management of childhood diarrhoea,
health-seeking behaviour and costs. Socio-demographic variables like parental education
level, or housing status, which is usually appropriate for use in predicting income, was
not collected.
As total household income was significantly correlated to direct costs, direct costs
were used to predict household income. At HSNZ, the Pearson correlation coefficient was
0.2 (p = 0.001). However, direct costs do not sufficiently explain the variation in total
household income (F2 = 0.05).
Univers
ity of
Mala
ya
188
Multiple imputations were performed using SPSS version 20.0 (SPSS Inc., Chicago,
Illinois, USA). Total direct costs were used as the independent (predictor) variable and
total household income as the dependent (outcome) variable. Linear regression was used
for the imputation model and a monotone imputation method was used. Five imputed
datasets were generated and a pooled result was used for analysis.
As the imputed and non-imputed datasets were found to give largely similar results,
the imputed dataset was used for the estimation of costs. This allowed utilisation of the
full sample for estimation of cost (Table 6.3). As direct costs did not fully explain total
household income, case-wise deletion was used for missing values of total household
income in the rest of the analysis. Analysis for the catastrophic and poverty impact of
OOP payments, and the generation of concentration curve and indices was conducted
using the non-imputed datasets (Figure 6.1, Figure 6.2, Figure 6.3 and Table 6.4).
Univers
ity of
Mala
ya

189
6.3 Results
6.3.1 General findings
From the period of April 2008 to March 2010, a total of 800 children under-five years
with acute gastroenteritis were admitted to the two study sites and 658 stool samples (82
per cent) were tested for rotavirus. Overall, 248 (37.7 per cent) samples tested positive
for rotavirus. Of the 467 children admitted for acute gastroenteritis at UMMC, 385 (82
per cent) had stool tested and of these 161 (41.8 per cent) tested positive for rotavirus. At
HSNZ, of the 333 children admitted for acute gastroenteritis, 273 (82 per cent) had stool
samples tested, and 87 (31.9 per cent) tested positive for rotavirus. (Table 6.2)
At both hospitals, a hundred and fifty children (61 per cent) with rotavirus
gastroenteritis were aged two years or younger. While the median duration of diarrhoea
for an episode of rotavirus gastroenteritis was longer at UMMC compared to HSNZ (six
days vs. five days; p = 0.001), there was no difference in the median duration of admission
at both hospitals (3 days; p = 0.264). (Table 6.2)
Patients with rotavirus gastroenteritis had increased frequency of fever and vomiting,
compared with non-rotavirus gastroenteritis. Majority of children admitted with acute
gastroenteritis at UMMC had moderate dehydration (92 per cent), while 55 per cent of
children admitted at HSNZ had mild dehydration. Work days missed by both mothers and
fathers of patients with rotavirus gastroenteritis were both significantly more at UMMC
than at HSNZ. (Table 6.2)
Table 6.2 compares the characteristics of children hospitalised for acute gastroenteritis
and tested for rotavirus at UMMC, Kuala Lumpur and HSNZ, Kuala Terengganu.
Univers
ity of
Mala
ya
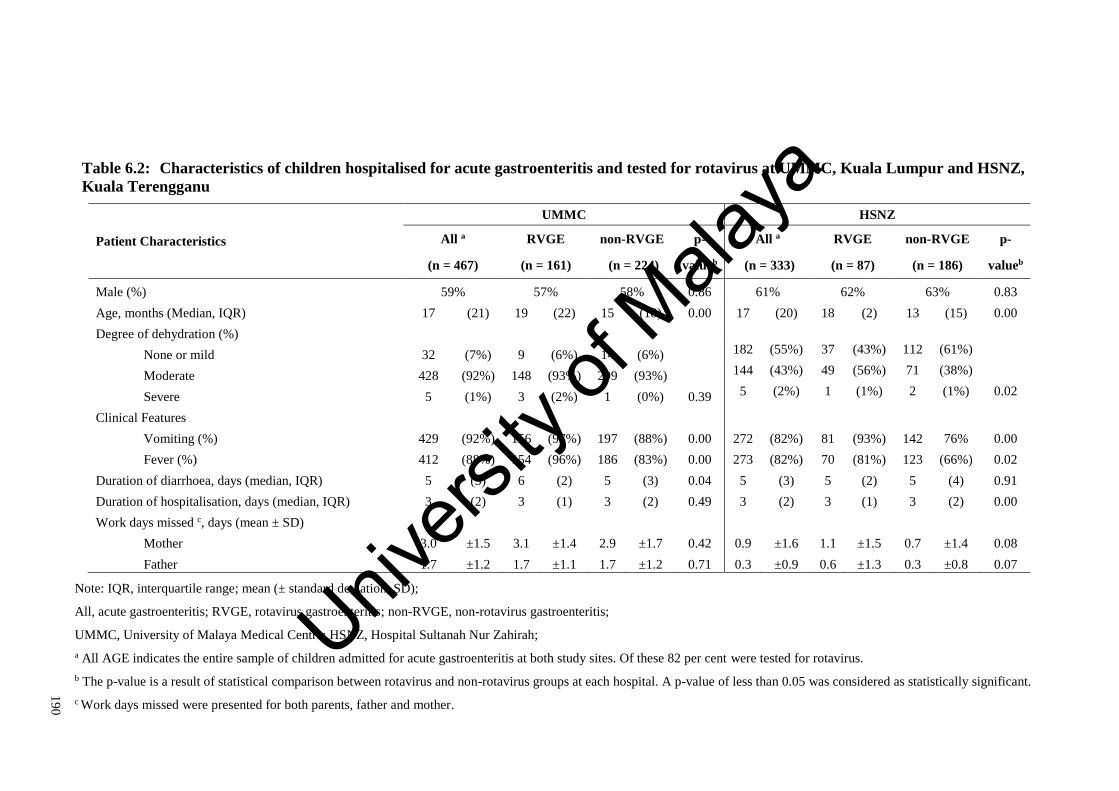
19
0
Table 6.2: Characteristics of children hospitalised for acute gastroenteritis and tested for rotavirus at UMMC, Kuala Lumpur and HSNZ,
Kuala Terengganu
Patient Characteristics
UMMC HSNZ
All a RVGE non-RVGE p- All a RVGE non-RVGE p-
(n = 467) (n = 161) (n = 224) valueb (n = 333) (n = 87) (n = 186) valueb
Male (%) 59% 57% 58% 0.86 61% 62% 63% 0.83
Age, months (Median, IQR) 17 (21) 19 (22) 15 (18) 0.00 17 (20) 18 (2) 13 (15) 0.00
Degree of dehydration (%)
None or mild 32 (7%) 9 (6%) 14 (6%) 182 (55%) 37 (43%) 112 (61%)
Moderate 428 (92%) 148 (93%) 209 (93%) 144 (43%) 49 (56%) 71 (38%)
Severe 5 (1%) 3 (2%) 1 (0%) 0.39 5 (2%) 1 (1%) 2 (1%) 0.02
Clinical Features
Vomiting (%) 429 (92%) 156 (97%) 197 (88%) 0.00 272 (82%) 81 (93%) 142 76% 0.00
Fever (%) 412 (88%) 154 (96%) 186 (83%) 0.00 273 (82%) 70 (81%) 123 (66%) 0.02
Duration of diarrhoea, days (median, IQR) 5 (3) 6 (2) 5 (3) 0.04 5 (3) 5 (2) 5 (4) 0.91
Duration of hospitalisation, days (median, IQR) 3 (2) 3 (1) 3 (2) 0.49 3 (2) 3 (1) 3 (2) 0.00
Work days missed c, days (mean ± SD)
Mother 3.0 ±1.5 3.1 ±1.4 2.9 ±1.7 0.42 0.9 ±1.6 1.1 ±1.5 0.7 ±1.4 0.08
Father 1.7 ±1.2 1.7 ±1.1 1.7 ±1.2 0.71 0.3 ±0.9 0.6 ±1.3 0.3 ±0.8 0.07
Note: IQR, interquartile range; mean (± standard deviation, SD);
All, acute gastroenteritis; RVGE, rotavirus gastroenteritis; non-RVGE, non-rotavirus gastroenteritis;
UMMC, University of Malaya Medical Centre; HSNZ, Hospital Sultanah Nur Zahirah;
a All AGE indicates the entire sample of children admitted for acute gastroenteritis at both study sites. Of these 82 per cent were tested for rotavirus.
b The p-value is a result of statistical comparison between rotavirus and non-rotavirus groups at each hospital. A p-value of less than 0.05 was considered as statistically significant.
c Work days missed were presented for both parents, father and mother.
Univers
ity of
Mala
ya

191
6.3.2 Direct and indirect costs
There was no difference in direct and indirect costs between rotavirus gastroenteritis
and non-rotavirus gastroenteritis groups at UMMC. At HSNZ, patients with rotavirus
gastroenteritis had higher consultation costs for preadmission care compared to non-
rotavirus gastroenteritis groups (RM 16 vs. RM 10; p = 0.03), however other costs did
not differ significantly between groups.
At UMMC, the average total direct costs for an episode of rotavirus gastroenteritis
requiring hospital care was RM 367 (SD ± RM 190), of which 78 per cent was due to
direct medical costs. Seventy-eight per cent of direct medical costs were contributed by
direct hospitalisation payment, RM 223 (SD ± RM 172). The average direct and indirect
costs were RM 700 (SD ± RM 391), of which productivity losses (48 per cent) was a
major component. The average productivity loss experienced by both parents was RM
336 (SD ± RM 299).
All costs incurred by households at HSNZ were significantly lower than at UMMC.
The mean direct costs for an episode of rotavirus gastroenteritis requiring admission was
RM 26 (SD ± RM 29) at HSNZ. As direct hospitalisation charges at HSNZ were assumed
to be zero, the main contributor for direct medical costs was preadmission consultations,
RM 12 (SD ± RM 23). The average direct and indirect costs was RM 143 (SD ± RM
167), of which productivity losses for both parents accounted for 73 per cent of spending.
The mean direct and indirect costs incurred for rotavirus gastroenteritis were
significantly higher in UMMC compared with HSNZ (RM 700 vs. RM 143; p < 0.001).
The mean direct and indirect costs consisted 20 per cent of monthly household income in
UMMC, as compared with only five per cent household income at HSNZ.
On average, households of patients at UMMC had higher income than those at HSNZ
(RM 3986 vs. RM 2929; p < 0.001).
Univers
ity of
Mala
ya

192
Table 6.3 compares costs incurred by households for children hospitalised for acute
gastroenteritis and tested for rotavirus at UMMC, Kuala Lumpur and HSNZ, Kuala
Terengganu
Univers
ity of
Mala
ya
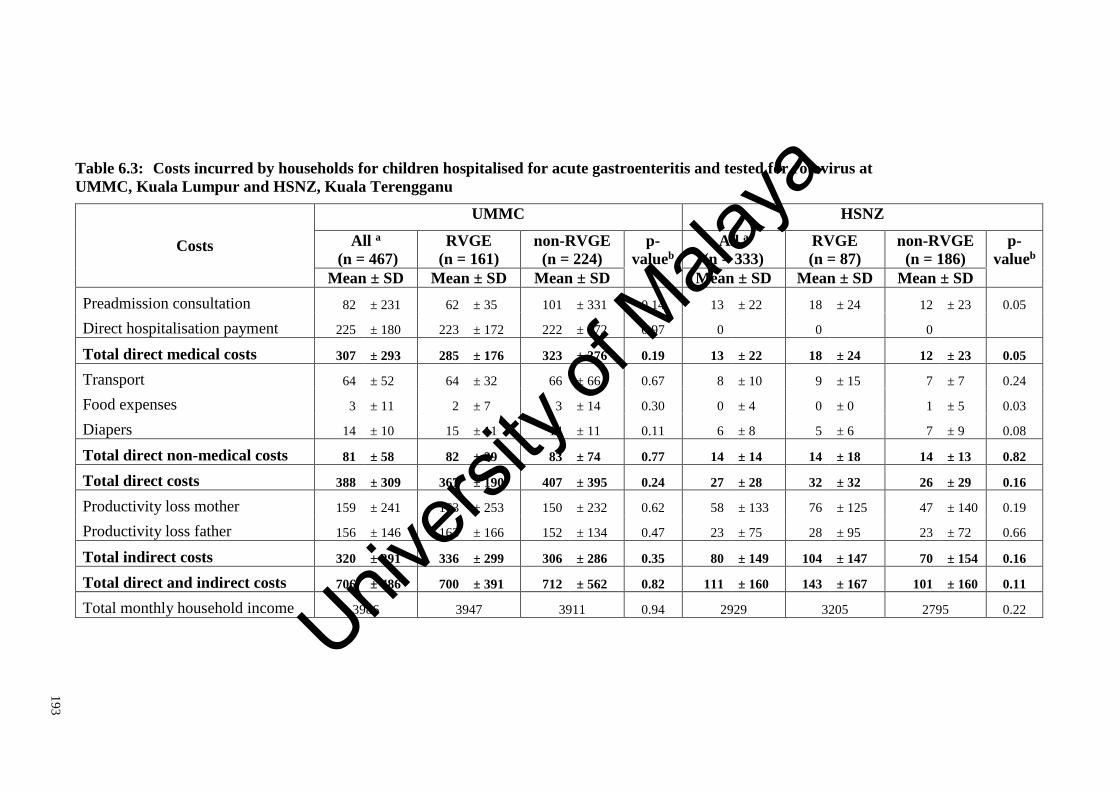
19
3
Table 6.3: Costs incurred by households for children hospitalised for acute gastroenteritis and tested for rotavirus at
UMMC, Kuala Lumpur and HSNZ, Kuala Terengganu
Costs
UMMC HSNZ
All a
(n = 467)
RVGE
(n = 161)
non-RVGE
(n = 224)
p-
valueb
All a
(n = 333)
RVGE
(n = 87)
non-RVGE
(n = 186)
p-
valueb
Mean ± SD Mean ± SD Mean ± SD Mean ± SD Mean ± SD Mean ± SD
Preadmission consultation 82 ± 231 62 ± 35 101 ± 331 0.14 13 ± 22 18 ± 24 12 ± 23 0.05
Direct hospitalisation payment 225 ± 180 223 ± 172 222 ± 172 0.97 0 0 0
Total direct medical costs 307 ± 293 285 ± 176 323 ± 376 0.19 13 ± 22 18 ± 24 12 ± 23 0.05
Transport 64 ± 52 64 ± 32 66 ± 66 0.67 8 ± 10 9 ± 15 7 ± 7 0.24
Food expenses 3 ± 11 2 ± 7 3 ± 14 0.30 0 ± 4 0 ± 0 1 ± 5 0.03
Diapers 14 ± 10 15 ± 11 14 ± 11 0.11 6 ± 8 5 ± 6 7 ± 9 0.08
Total direct non-medical costs 81 ± 58 82 ± 39 83 ± 74 0.77 14 ± 14 14 ± 18 14 ± 13 0.82
Total direct costs 388 ± 309 367 ± 190 407 ± 395 0.24 27 ± 28 32 ± 32 26 ± 29 0.16
Productivity loss mother 159 ± 241 163 ± 253 150 ± 232 0.62 58 ± 133 76 ± 125 47 ± 140 0.19
Productivity loss father 156 ± 146 163 ± 166 152 ± 134 0.47 23 ± 75 28 ± 95 23 ± 72 0.66
Total indirect costs 320 ± 291 336 ± 299 306 ± 286 0.35 80 ± 149 104 ± 147 70 ± 154 0.16
Total direct and indirect costs 706 ± 486 700 ± 391 712 ± 562 0.82 111 ± 160 143 ± 167 101 ± 160 0.11
Total monthly household income 3986 3947 3911 0.94 2929 3205 2795 0.22
Univers
ity of
Mala
ya

19
4
Note:
All costs are reported in 2013 RM; mean (± standard deviation, SD);
All, acute gastroenteritis; RVGE, rotavirus gastroenteritis and non-RVGE, non-rotavirus gastroenteritis;
UMMC, University of Malaya Medical Centre; HSNZ, Hospital Sultanah Nur Zahirah;
a All AGE indicates the entire sample of children admitted for acute gastroenteritis at both study sites. Of these 82 per cent were tested for rotavirus;
b The p-value is a result of independent t-test between means of rotavirus and non-rotavirus groups at each hospital, alpha less than 0.05 is significant.
Univers
ity of
Mala
ya
195
6.3.3 Catastrophic healthcare expenditure
As there was no difference in costs between rotavirus and acute gastroenteritis groups
at both hospitals, the entire dataset (of all patients admitted with acute gastroenteritis)
was analysed for the catastrophic and impoverishing impact of healthcare payments.
On average, direct medical costs paid OOP for hospitalisation of acute gastroenteritis
at UMMC represented 11 per cent of the total monthly household income. Catastrophic
healthcare expenditure was experienced by a third of households at UMMC. Households
in the highest income quintile had the highest average OOP direct medical costs (RM
377; SD ± RM 563), followed by households in the lowest income quintile (RM 319; SD
± RM 208). OOP direct medical costs as a proportion of monthly household income was
significantly lower (5.7 per cent) in the highest income quintile as compared to the lowest
income quintile (23.2 per cent) (p < 0.001) (Figure 6.1). Eight per cent of households in
the highest income quintile experienced catastrophic healthcare payments, as compared
to 86 per cent in the lowest income quintile (Figure 6.2). When all direct and indirect
costs were considered, 376 households at UMMC (88 per cent) experienced illness-
related payments of more than ten per cent of monthly household income.
In contrast at HSNZ, direct medical costs were less than one per cent of the total
monthly household income and only one household experienced catastrophic healthcare
expenditure (Figure 6.2). Households in the highest income quintile had higher average
OOP direct medical costs (RM 24; SD ± RM 35), compared to households in the lowest
income quintile (RM 6; SD ± RM 14). This difference was statistically significant (p <
0.001) (Figure 6.1). When all direct and indirect costs were considered, 19 households
(nine per cent) experienced illness-related expenditure of more than ten per cent of
monthly household income.
Figure 6.1 displays mean out-of-pocket costs for acute gastroenteritis requiring
hospitalisation by income quintiles.
Univers
ity of
Mala
ya

196
Figure 6.2 shows households with catastrophic healthcare payments due to acute
gastroenteritis requiring hospitalisation by income quintiles.
Univers
ity of
Mala
ya

197
Figure 6.1: Mean out-of-pocket costs for acute gastroenteritis requiring
hospitalisation by income quintiles at UMMC, Kuala Lumpur and HSNZ, Kuala
Terengganu
Note:
Costs are in 2013 Ringgit Malaysia (RM);
UMMC, University of Malaya Medical Centre; HSNZ, Hospital Sultanah Nur Zahirah.
The blue bars denote average out-of-pocket direct medical costs to households by income quintiles
(poorest to richest income quintiles), resulting from rotavirus diarrhoea episodes requiring hospitalisation.
The red line denotes average out-of-pocket direct medical costs as a proportion of household income for
each income quintile. Blue bars relate to the left-hand y-axis. Red lines relate to the right-hand y-axis.
Error bars represent 95 per cent confidence interval of out-of-pocket costs as a proportion of household
income
Univers
ity of
Mala
ya

198
Figure 6.2: Households with catastrophic healthcare payments due to acute
gastroenteritis requiring hospitalisation by income quintiles at UMMC, Kuala
Lumpur and HSNZ, Kuala Terengganu
Note:
UMMC, University of Malaya Medical Centre; HSNZ, Hospital Sultanah Nur Zahirah;
The yellow bars denote the number of households that incur catastrophic healthcare payments due to
acute gastroenteritis requiring hospitalisation by income quintiles (poorest to richest income quintiles).
The blue line denotes the proportion of households per quintile that incur catastrophic healthcare
payments. Yellow bars relate to the left-hand y-axis. Blue lines relate to the right-hand y-axis.
Catastrophic healthcare expenditure is defined here as out-of-pocket direct medical costs above ten per
cent of total monthly household income.
Error bars represent range of results using catastrophic payment thresholds ranging from five per cent to
20 per cent.
Univers
ity of
Mala
ya
199
6.3.4 Poverty impact of illness-related payments
At UMMC, two households were below the poverty line prior to healthcare payments.
Direct medical costs paid OOP displaced 11 households (three per cent) below the
poverty line. When both direct and indirect costs were deducted from monthly incomes,
25 households (six per cent) were pushed below the poverty lines.
At HSNZ, the pre-payment poverty headcount was 30. However, no households were
impoverished after direct healthcare payments and only one household incurred poverty
after deducting direct and indirect costs from monthly income.
Table 6.4 shows the poverty impact of illness-related payments for acute
gastroenteritis requiring hospitalisation at UMMC, Kuala Lumpur and HSNZ, Kuala
Terengganu.
Univers
ity of
Mala
ya

200
Table 6.4: Poverty impact of illness-related payments for acute gastroenteritis requiring hospitalisation at UMMC, Kuala Lumpur and
HSNZ, Kuala Terengganu
UMMC
(n = 427)
HSNZ
(n = 207)
Poverty Headcounts (no, %)
Pre-payment 2 (0%) 30 (14%)
Post-payment
Post direct medical costs 13 (3%) 30 (14%)
Post direct costs 18 (4%) 30 (14%)
Post direct and indirect costs 27 (6%) 31 (15%)
Poverty Impact
Post direct medical costs 11 (3%) 0 (0%)
Post direct costs 16 (4%) 0 (0%)
Post direct and indirect costs 25 (6%) 1 (0%)
Note: UMMC, University of Malaya Medical Centre; HSNZ, Hospital Sultanah Nur Zahirah;
Poverty Line Income in 2009 for urban regions was used for, Kuala Lumpur (RM 771) and rural regions, was used for Kuala Terengganu (RM 743) (Department of Statistics
Malaysia, 2009).
Univers
ity of
Mala
ya
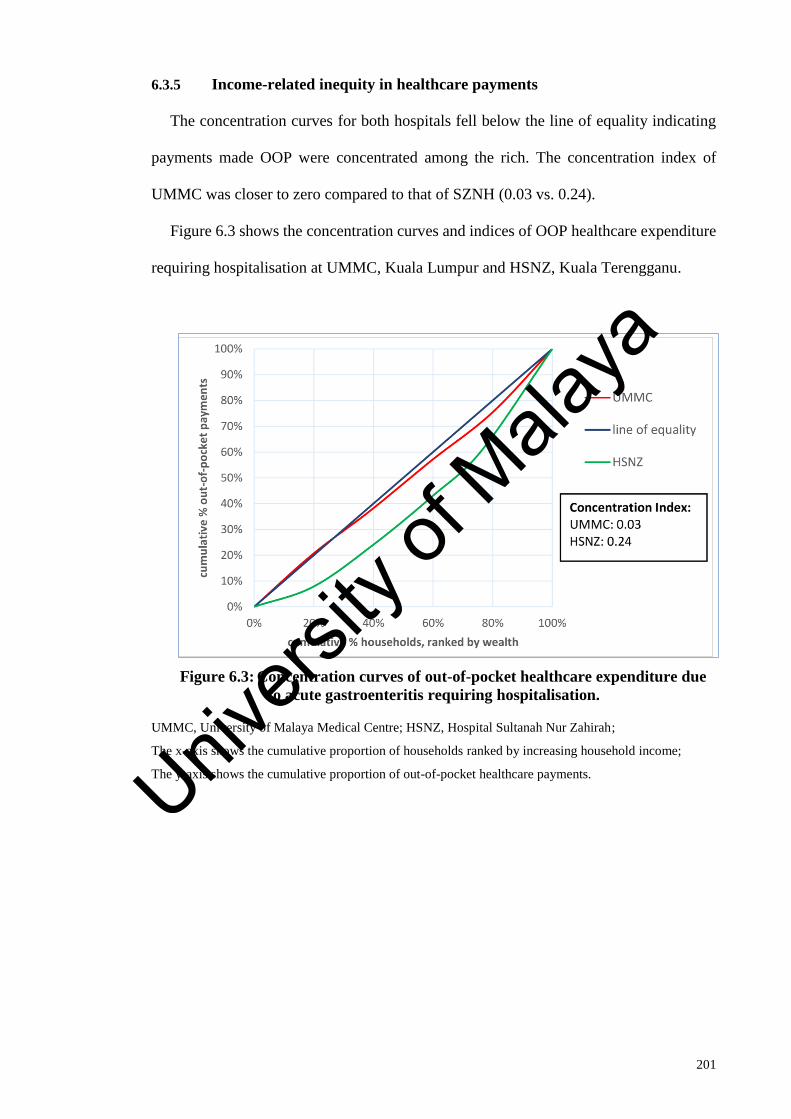
201
6.3.5 Income-related inequity in healthcare payments
The concentration curves for both hospitals fell below the line of equality indicating
payments made OOP were concentrated among the rich. The concentration index of
UMMC was closer to zero compared to that of SZNH (0.03 vs. 0.24).
Figure 6.3 shows the concentration curves and indices of OOP healthcare expenditure
requiring hospitalisation at UMMC, Kuala Lumpur and HSNZ, Kuala Terengganu.
Figure 6.3: Concentration curves of out-of-pocket healthcare expenditure due
to acute gastroenteritis requiring hospitalisation.
UMMC, University of Malaya Medical Centre; HSNZ, Hospital Sultanah Nur Zahirah;
The x-axis shows the cumulative proportion of households ranked by increasing household income;
The y-axis shows the cumulative proportion of out-of-pocket healthcare payments. Univers
ity of
Mala
ya

202
6.4 Discussion
This chapter shows that in Malaysia, the financial burden of diarrhoeal hospitalisations
on households differs in urban and rural areas. Although households in Kuala Lumpur
had higher income than those in Kuala Terengganu (RM 3986 vs. RM 2929, p < 0.001),
all costs incurred in Kuala Lumpur were significantly higher than in Kuala Terengganu.
On average, direct and indirect costs incurred by the households at UMMC, Kuala
Lumpur for an episode of rotavirus gastroenteritis requiring hospitalisation was RM 706
(SD ± RM 486), which consisted 20 per cent of the total monthly household income. This
is consistent with findings from a study conducted at UMMC in 2007. In that 2007 study,
out-of-pocket direct medical costs for an episode of gastroenteritis requiring
hospitalisation, consisted of 26 per cent of the average monthly household income (Chai
& Lee, 2009). In contrast, direct and indirect costs due to an episode of rotavirus
gastroenteritis requiring hospitalisation at HSNZ, Kuala Terengganu was a mere RM 143
(SD ± RM 167), or less than six per cent of the average monthly household income.
It is estimated that a third of households in the UMMC dataset experienced
catastrophic healthcare payments. In addition, after the incurrence of direct and indirect
costs, 25 households (six per cent) were pushed into poverty. This catastrophic impact of
healthcare expenses on households is unexpected in Malaysia, which is widely credited
to have achieved Universal Health Coverage (Savedoff & Smith, 2011). Malaysia has an
extensive network of primary health clinics which provide free services for children,
whilst admission to public hospitals are heavily subsidised (Chee & Barraclough, 2007).
Analysis of nationally representative household survey data has shown a low incidence
of catastrophic healthcare payments in Malaysia, with only two per cent of households
spending more than ten per cent of total household budget on healthcare (Van Doorslaer
et al., 2007). Also, the poverty headcount ratio for Malaysia in 2009 was estimated by the
World Bank at 3.8 per cent of the population (World Bank, 2014b).
Univers
ity of
Mala
ya

203
However, it is surprising that HSNZ which serves a predominantly rural population in
Kuala Terengganu, only one household incurred catastrophic payments due to
hospitalisation. While households at Kuala Terengganu are less wealthy, healthcare
expenses incurred were also significantly lower at Kuala Terengganu (total direct medical
costs for acute gastroenteritis at HSNZ compared UMMC; RM 13 vs. RM 307; p <
0.001). Low healthcare expenses incurred are a testimony to the success of the rural focus
of public health services in Malaysia. Expenses at MOH health facilities are generally
subsidised at all levels of care and in many forms (Kananatu, 2002). For example, even
non-urgent patients in rural settings may be transported from primary health clinics to
hospital for admission via free ambulance services. Lower cost of living at rural areas
may explain lower direct non-medical costs like transport, food and diapers.
Interestingly, inequalities in OOP expenditure along the income quintiles were found.
In Kuala Lumpur, households in the lowest income quintile paid more OOP for healthcare
compared to all other households apart from those in the highest income quintile.
Furthermore, households in the lowest income quintile were far more likely to experience
catastrophic payments compared with those in the highest income quintile (86 per cent
vs. eight per cent). This is important as it suggests that although the richest households
paid more for healthcare, they were less likely to suffer change in living standards or
incur debt due to healthcare expenses. In Kuala Terengganu, although healthcare
expenditure was higher in the highest income quintile as compared to the lowest income
quintile (RM 24 vs. RM 6; p < 0.001), these costs had minimal catastrophic impact. The
concentration curves suggest that while OOP healthcare payments at both hospitals were
concentrated among the rich, interventions to alleviate OOP payments were more likely
to be pro-poor in rural compared to urban regions. These findings are supported by the
concentration index which was closer to zero at UMMC compared to that at HSNZ (0.03
Univers
ity of
Mala
ya

204
vs. 0.24). While the poor pay as much OOP as the rich in Kuala Lumpur, the poor were
largely protected from OOP healthcare payments at Kuala Terengganu.
The National Health and Morbidity Survey 2006 showed that 47.6 per cent of children
under-five years with acute diarrhoea first sought treatment at a private clinic (Ministry
of Health Malaysia, 2006). In the present study, 79 per cent (353) of children at Kuala
Lumpur, almost half of which belong to the two lowest income quintiles, had sought
treatment at a private clinic prior to hospitalisation.
The higher fee structure at UMMC compared to HSNZ and different payment
collection mechanisms may explain the higher direct hospitalisation payments at UMMC.
UMMC is a teaching hospital under Ministry of Higher Education, and while fees are still
subsidised, they are higher than other public hospitals under the MOH, Malaysia. As
UMMC is the only public hospital in Petaling Jaya, a city with a population of more than
a million, its fee structure impacts the poor. Our findings indicate an increased demand
for affordable inpatient and outpatient healthcare services in Kuala Lumpur, which is
unfulfilled by available public healthcare services.
Two rotavirus vaccines have been available internationally since 2006 (World Health
Organization, 2013d) and although these vaccines are available commercially in the
private market, Malaysia has yet to introduce the rotavirus vaccine universally. Findings
in this chapter suggest that the economic burden of rotavirus gastroenteritis is particularly
severe in poorer urban households, who are also least likely to purchase the vaccine
privately (Kannan Kutty et al., 2010).
Traditionally, evidence on disease burden and the availability of a safe and effective
vaccine that is cost-effective and affordable, was enough to inform decision-making
around vaccine introduction. Increasingly, the broader economic impact of vaccination
including improvements in financial risk protection and equity, are important
considerations (Deogaonkar et al., 2012; R. Rheingans, Atherly, & Anderson, 2012;
Univers
ity of
Mala
ya

205
Verguet et al., 2013). The World Health Report 2013 states that ‘the goal of universal
health coverage is to ensure that all people obtain necessary health services without risk
of financial ruin or incurring poverty’ (World Health Organization, 2013f, p. 5). This
current study demonstrates that the introduction of a rotavirus vaccine into a national
immunization programme may smooth the path towards universal health coverage by
providing financial risk protection to households with the greatest need.
There are several limitations to this study. Both, income and costs obtained were self-
reported, which may have led to under-reporting of wages or expenses being over-stated.
To minimise bias, multiple interviews were conducted at different time points using a
structured questionnaire. Imputation techniques were used to deal with missing values of
household income.
The examination of the impact of healthcare expenditure on households should ideally
be conducted using longitudinal data, to best estimate the extent of disruption of living
standards due to health shocks. Here the catastrophic and poverty impact of acute
gastroenteritis was examined using cross-sectional data from public hospitals in two
different locations in Malaysia. Nevertheless, this current study was conducted to
examine the burden of illness-related expenditure on households, which would
potentially be averted by rotavirus vaccination, and not as an exploration of health
financing in Malaysia.
While it is usual to define healthcare expenditure as catastrophic when it exceeds a
fraction of household income over a year, OOP costs incurred are compared here with
monthly income. Expenses incurred for acute diarrhoea is short term and are unlikely to
be repeated, as such we do not annualise costs or income. This must be interpreted with
caution as expenditure incurred over a single month may not have the same implications
on household welfare as expenses over a year, as coping mechanisms like savings and
loans are easier to obtain on the short term. Assuming that the effects of illness-related
Univers
ity of
Mala
ya

206
expenditure are felt all at once may overstate the catastrophic impact of payments in the
short term, as these are likely to be smoothed over time by coping mechanisms (Adam
Wagstaff & Van Doorslaer, 2003). However, large expenses in the short term, may
adversely impact the welfare of poor households, with less ability to cope (Alam &
Mahal, 2014).
As information on hospital charges actually paid by patients was unavailable at HSNZ,
the assumption was made that these charges were zero. Although it was possible to
estimate the hospital bill, this would not accurately represent the OOP payments made.
While publicly provided healthcare services at MOH hospitals are highly subsidised,
many patients do not settle hospital bills. Also, a large segment of patients are exempt
from fees including school children, pregnant mothers, public sector employees and their
dependents, people with disabilities and the socioeconomically disadvantaged (Kananatu,
2002). The National Health and Morbidity Survey 1996 found that 92.5 per cent of
respondents utilised government clinics and 66.4 per cent used government hospitals for
free. In addition, the average hospital charges paid in the state of Terengganu was a third
that of payments made at Kuala Lumpur (Ministry of Health Malaysia, 1996). At Kuala
Lumpur and urban areas, public hospitals are more likely to collect fees as the population
served is wealthier. In 2012, the mean average household income for Kuala Lumpur was
RM 8,586 per-month as compared to RM 3,967 per-month in Terengganu and the national
average income of RM 5,000 (Economic and Planning Unit, 2012). In 2006, unpaid bills
amounted to RM 26.1 million or around 0.3 per cent of the MOH budget (Jaafar et al.,
2013).
Whilst HSNZ is representative of tertiary hospitals serving rural populations, UMMC
may not be representative of all urban public hospitals in Malaysia. UMMC is unique in
terms of its status as a teaching hospital and its location in Kuala Lumpur. As a teaching
hospital under Ministry of Education, UMMC has a higher fee structure and payment
Univers
ity of
Mala
ya

207
collection mechanism than hospitals under the MOH. Also, UMMC serves the population
in Kuala Lumpur, the federal capital of Malaysia, together with the neighbouring city of
Petaling Jaya, in the state of Selangor, the most populous and population dense states in
Malaysia. The Population and Housing Survey of 2010 reported that the population
density in Kuala Lumpur (6,696 per square kilometre) and Selangor (668 per square
kilometre) is much higher than the national average of 83 per square kilometre
(Department of Statistics Malaysia, 2010b). The population UMMC serves is also
considerably more affluent than in other areas.
The information on direct hospitalisation payments at UMMC was obtained through
patient interviews. However, if a similar assumption of hospital charges being zero was
made at UMMC, the differential impact of payments on households across income
quintiles will not be seen.
This study has several strengths. This is the first study of its kind to explore the
catastrophic and poverty impact of acute gastroenteritis in Malaysia. By examining costs
incurred by households for rotavirus gastroenteritis in urban and rural settings by income
quintiles, this allows for the exploration of the potential distributional consequences of
universal rotavirus vaccination in Malaysia.
Univers
ity of
Mala
ya

208
6.5 Conclusion
Although households in Kuala Lumpur have higher income than those in Kuala
Terengganu, it is paradoxical that poor urban households may be more vulnerable to the
financial impact of healthcare expenditure. The introduction of a universal rotavirus
vaccination as an effective preventive measure against childhood diarrhoea, may
substantially benefit all families; not only by reducing the disease burden, but also by
providing financial risk protection to households with the greatest need.
In the next chapter, the distributional benefits of rotavirus vaccination in providing
financial risk protection against the catastrophic and impoverishing impact of illness-
related expenditure on households in Malaysia is explored.
Univers
ity of
Mala
ya

209
CHAPTER 7: ENHANCING EQUITY AND FINANCIAL RISK PROTECTION
WITH ROTAVIRUS VACCINATION IN MALAYSIA
7.1 Introduction
The United Nations General Assembly has unanimously endorsed the goal of achieving
Universal Health Coverage (UHC) (United Nations, 2012). Towards achieving this goal,
health systems are responsible for expanding the range of services that can be accessed,
while ensuring equitable distribution of benefits, and financial risk protection against the
catastrophic or impoverishing impact of healthcare payments (World Health
Organization, 2010, 2013e).
The path to UHC is complex in middle-income countries with mixed public-private
healthcare systems. Malaysia is widely credited as having achieved UHC through a public
healthcare system that ensures access to subsidised healthcare for the whole population
(Savedoff & Smith, 2011). However, perceptions of short-comings in public healthcare,
including long waits to access care and inadequate staff numbers, lead patients to seek
care in the private sector. This exposes many to the financial risks of OOP payments for
private healthcare (Jaafar et al., 2013).
The previous chapter demonstrated that OOP expenses related to rotavirus
gastroenteritis hospital admissions may result in financially catastrophic expenditure and
even medical impoverishment, especially amongst the poorest. Such OOP healthcare
expenditure is inconsistent with the stated aims of UHC, which is to deliver effective
interventions as needed, while ensuring equitable distribution of benefits and financial
risk protection for all.
Financial risk protection, an essential component in achieving UHC, can be defined as
access to quality healthcare as needed without incurring financial hardship (Saksena et
al., 2014). Preventive measures such as vaccination may be complementary to health
Univers
ity of
Mala
ya

210
financing strategies as a means to achieve UHC, since they remove the risk of having to
pay for illness-related care.
In this chapter, extended cost-effectiveness analysis (ECEA) methods, which
explicitly quantifies financial risk protection and distributional benefits of policy, are
used to evaluate universal rotavirus vaccination in Malaysia. The chapter begins with
Section 7.2, which provides a study overview and describes the rationale behind the use
of the ECEA. This is followed by a description of data sources, parameters, and analytical
methods used in the analysis. Next, Section 7.3 presents the study findings. This is
followed by Section 7.4, which discusses the study findings and limitations. The chapter
ends with Section 7.5, which provides the chapter conclusions.
7.2 Materials and methods
7.2.1 Study overview
In this chapter, rotavirus vaccines were evaluated from the perspective of households,
using methods of an ECEA. An ECEA was used to evaluate the benefits of universal
rotavirus vaccination distributed across national income quintiles in Malaysia, across
three domains of (1) health gains - hospitalisations and clinic visits averted, (2) household
healthcare expenditure crowded out – OOP direct medical costs averted, and (3) financial
risk protection afforded - prevention of financially catastrophic and impoverishing
payments.
Rotavirus incidence, health service utilisation, illness-related expenditure and other
input parameters were obtained from multiple local data sources. Age-stratified cohorts
were distributed into national income quintiles and followed from birth over the first five
years of life in the POLYMOD model. The POLYMOD model is the static, multi-cohort
model, used in Chapter 5 of this thesis to evaluate cost-effectiveness of rotavirus vaccines
in Malaysia. (Jit et al., 2009; Jit & Edmunds, 2007).
Univers
ity of
Mala
ya

211
The impact of monovalent Rotarix® (GlaxoSmithKline, Rixensart, Belgium) on
rotavirus episodes and household expenditure was considered in the base-case. In
alternate scenarios, the impact of RotaTeq® (Merck & Co. Inc., USA) and the additional
effects of herd immunity were evaluated. Rotarix® was evaluated in the base-case, as this
two-dose vaccine was found to be more cost-effective and affordable in Malaysia. Please
refer to the results of cost-effectiveness and affordability in Chapter 5 (Subsection 5.3,
page 149).
The base year for analysis was 2013. All costs are presented in 2013 Ringgit Malaysia
(RM).A discount rate of three per cent per-year was used (Walker et al., 2010). Analysis
was conducted using Microsoft Excel® Professional Plus 2013 and R version 3.2.0.
Parameters in the base-case are listed in Table 7.1. The rationale for use of the ECEA
is described in Subsection 7.2.2. The data sources and parameters used in the model are
described in Subsection 7.2.3 and 7.2.4. The analytical methods of the ECEA is described
in Subsection 7.2.5. The scenario analysis is described in Subsection 7.2.6.
Univers
ity of
Mala
ya
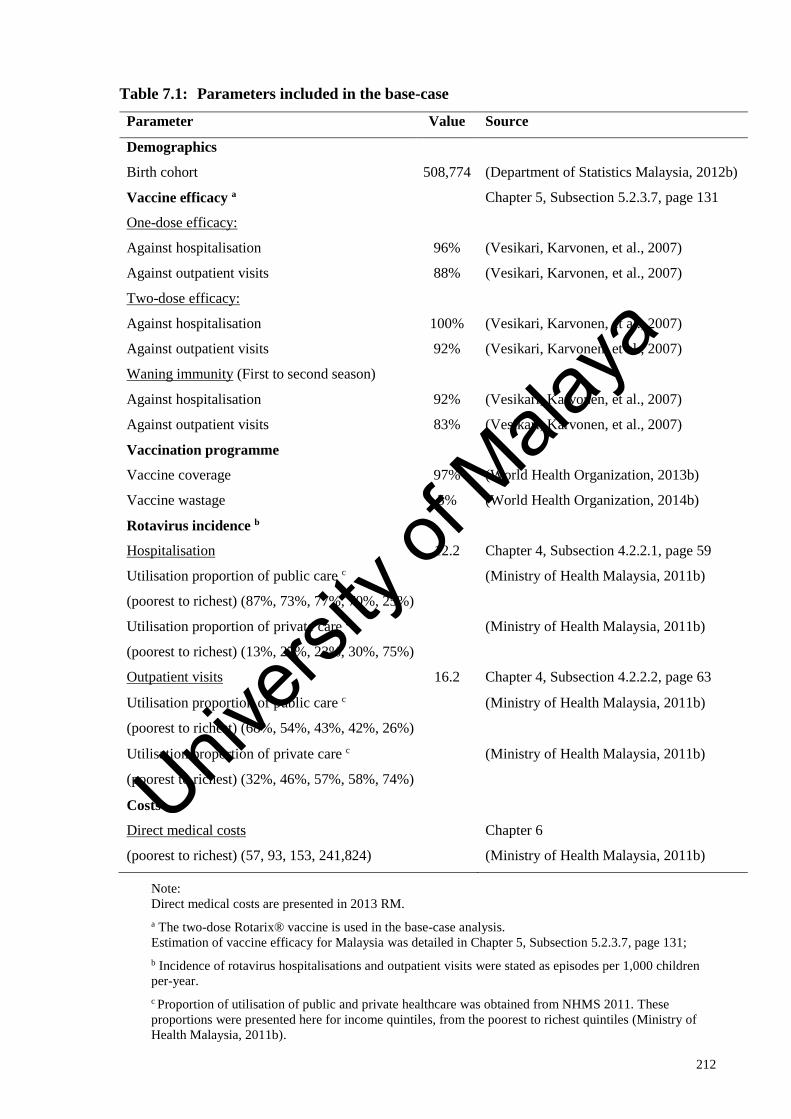
212
Table 7.1: Parameters included in the base-case
Parameter Value Source
Demographics
Birth cohort 508,774 (Department of Statistics Malaysia, 2012b)
Vaccine efficacy a Chapter 5, Subsection 5.2.3.7, page 131
One-dose efficacy:
Against hospitalisation 96% (Vesikari, Karvonen, et al., 2007)
Against outpatient visits 88% (Vesikari, Karvonen, et al., 2007)
Two-dose efficacy:
Against hospitalisation 100% (Vesikari, Karvonen, et al., 2007)
Against outpatient visits 92% (Vesikari, Karvonen, et al., 2007)
Waning immunity (First to second season)
Against hospitalisation 92% (Vesikari, Karvonen, et al., 2007)
Against outpatient visits 83% (Vesikari, Karvonen, et al., 2007)
Vaccination programme
Vaccine coverage 97% (World Health Organization, 2013b)
Vaccine wastage 5% (World Health Organization, 2014b)
Rotavirus incidence b
Hospitalisation 12.2 Chapter 4, Subsection 4.2.2.1, page 59
Utilisation proportion of public care c
(poorest to richest) (87%, 73%, 77%, 70%, 25%)
(Ministry of Health Malaysia, 2011b)
Utilisation proportion of private care c
(poorest to richest) (13%, 27%, 23%, 30%, 75%)
(Ministry of Health Malaysia, 2011b)
Outpatient visits 16.2 Chapter 4, Subsection 4.2.2.2, page 63
Utilisation proportion of public care c
(poorest to richest) (68%, 54%, 43%, 42%, 26%)
(Ministry of Health Malaysia, 2011b)
Utilisation proportion of private care c
(poorest to richest) (32%, 46%, 57%, 58%, 74%)
(Ministry of Health Malaysia, 2011b)
Costs
Direct medical costs Chapter 6
(poorest to richest) (57, 93, 153, 241,824) (Ministry of Health Malaysia, 2011b)
Note:
Direct medical costs are presented in 2013 RM.
a The two-dose Rotarix® vaccine is used in the base-case analysis.
Estimation of vaccine efficacy for Malaysia was detailed in Chapter 5, Subsection 5.2.3.7, page 131;
b Incidence of rotavirus hospitalisations and outpatient visits were stated as episodes per 1,000 children
per-year.
c Proportion of utilisation of public and private healthcare was obtained from NHMS 2011. These
proportions were presented here for income quintiles, from the poorest to richest quintiles (Ministry of
Health Malaysia, 2011b).
Univers
ity of
Mala
ya

213
7.2.2 Rationale for the extended cost-effectiveness analysis
7.2.2.1 Financial risk protection
The World Health Report 2000 identified three fundamental goals of health systems:
(1) health improvement, (2) increasing health system responsiveness, and (3) fairness in
financing. Of relevance to this thesis, are the goals of health improvement and fairness in
financing. Improving population health is not merely about raising the average level of
health, but also involves reducing health inequities in a population. Fairness of financing
means that every household pays a fair share of the total healthcare costs for the country94.
This implies that households should not be impoverished or spend an excessive portion
of income to obtain needed health care (Murray & Frenk, 2000; World Health
Organization, 2000).
Towards achieving UHC, the World Health Report 2010 recommends that countries
provide all people with needed health care of sufficient quality, while ensuring that no
one suffers from financial hardship from receiving healthcare (World Health
Organization, 2010).
World leaders have endorsed and pledged support to the Agenda for Sustainable
Development by the year 2030. Seventeen Sustainable Development Goals (SDGs) with
169 targets were laid out as part of an integrated plan of action for sustainable
development for fifteen years beginning from 1st January 2016. The eight target of the
third SDG specifically targets UHC:
“Achieve universal health coverage, including financial risk protection, access to
quality essential health-care services and access to safe, effective, quality and
affordable essential medicines and vaccines for all.” (United Nations, 2015).
94 A ‘fair’ share implies progressivity in financing. In which the rich pay more as a proportion of household income on healthcare
compared to the poor. To ensure that all people are protected from the financial consequences of healthcare, it may also mean that the
poor may pay nothing at all.
Univers
ity of
Mala
ya

214
The MOH, Malaysia has emphasised the need for a health system that is equitable,
affordable and ensures UHC. This is clearly stated in the MOH Vision for Health:
“Malaysia is to be a nation of healthy individuals, families and communities,
through a health system that is equitable, affordable, efficient…” (Ministry of
Health Malaysia, 2008, p. 4).
The Tenth Malaysia Health Plan (2011 to 2015) proposed a plan to restructure the
current national healthcare system, to deal with challenges posed by increasing private
healthcare spending. The proposal was for a restructured national health system that
ensured UHC:
“The restructured national health system is one that is responsive and provides
choice of quality health care, ensuring universal coverage for health care needs
of population based on solidarity and equity.”(Ministry of Health Malaysia, 2010,
p. 53).
Financial risk protection refers to how far people are protected from the financial
consequences of ill health (Moreno-Serra, Millett, & Smith, 2011). Two main concepts
are used to measure financial risk protection in health, and both these concepts relate to
illness-related spending above a certain threshold of living standards (Moreno-Serra et
al., 2011; Peter C Smith, 2005). The first measure defines illness-related expenditure as
financially catastrophic if it exceeds a critical threshold of household income. The second
measure defines illness-related expenditure as impoverishing if the household income is
pushed below a pre-defined poverty line after payments (Saksena et al., 2014).
7.2.2.2 Extended cost-effectiveness analysis
Traditionally economic evaluation of vaccines have focused on the narrow benefits of
the cost-effectiveness analysis, namely illness averted and costs savings to the healthcare
system, underestimating the broader economic impacts of vaccination. The broader
Univers
ity of
Mala
ya

215
economic impacts of vaccination encompasses among others, the long term benefits of
improved health to individuals and societies (including increased lifetime productivity
which is linked with improved educational attainment, job performance and lifetime
earnings), community and health system externalities (including improvements in equity
and financial risk protection) and the impact to the broader economy (impact on public
sector budget and macroeconomic impact) (Bärnighausen, Bloom, Cafiero-Fonseca, &
O’Brien, 2014; Bloom et al., 2005; Deogaonkar et al., 2012; Jit et al., 2015).
The majority of economic evaluations of vaccination programmes focus on achieving
efficiency, particularly on improving population health, ignoring broader considerations
of equity and financial risk protection, which are fundamental health system goals. In this
thesis, methods of an ECEA are used to evaluate the benefits of rotavirus vaccine in
providing financial risk protection and reducing inequities in Malaysia.
The ECEA evaluates the consequences of health interventions in multiple domains of
health gains, household healthcare expenditure averted, and financial risk protection
afforded, across socio-economic strata. ECEA is a new methodology developed to inform
policy on the universal public finance of programmes. Universal public finance is the
government’s financing of programmes for the benefit of all, irrespective of who is
receiving it (Verguet et al., 2013).
ECEA has been used to inform on the benefits of public finance of universal rotavirus
vaccination in India and Ethiopia (Verguet et al., 2013), measles vaccination in Ethiopia
(Driessen, Olson, Jamison, & Verguet, 2015), HPV vaccination in China (Levin et al.,
2015) and tuberculosis treatment in India (Verguet, Laxminarayan, & Jamison, 2015).
Also, ECEA was conducted to inform health policy on selected interventions for public
finance by the government of Ethiopia (Verguet, Olson, et al., 2015) and on tobacco
taxation in China (Verguet, Gauvreau, et al., 2015).
Univers
ity of
Mala
ya
216
The ECEA builds on the traditional cost-effectiveness analysis framework, while
quantifying the broader value of universal vaccination starting with non-health benefits
such as household healthcare expenditure averted, financial risk protection, and equity.
These dimensions provide information in addition to the results of cost-effectiveness
analysis, to better enable decision-makers to evaluate policy on the public finance of
health programmes (Verguet, Laxminarayan, et al., 2015).
Firstly, the ECEA examines the direct financial implications of policy on households,
as a result of crowding out private expenditure. Interventions like universal rotavirus
vaccination by preventing of illness, also averts expenditure related to illness.
Secondly, the ECEA explicitly measures financial risk protection, an essential
dimension considered by the WHO towards achieving UHC (World Health Organization,
2010). The ECEA methods exhibits a vector of poverty reduction, critical for stake
holders like the Ministers of Finance, development agencies and other funders, when
considering investments in health (Verguet, Laxminarayan, et al., 2015). The global
importance of poverty eradication is exemplified with the SDGs, in which the first goal
is a commitment to eradicate poverty in all its forms everywhere95 (United Nations,
2015).
Finally, the ECEA evaluates the distributional consequences of policy across socio-
economic strata of a population. Inequities may be evaluated by disaggregating key
variables by wealth or income strata, residence (urban or rural), ethnicity, age, gender
and others (Boerma, AbouZahr, Evans, & Evans, 2014). The ECEA allows measurement
of both the levels and distribution of benefits of policy, which is vital towards monitoring
progress towards UHC.
95 The first SDG commits to eradicate poverty in all its forms. SDG Goal 1.1 states “By 2030, eradicate extreme poverty for all
people everywhere, currently measured as people living on less than US$1.25 a day”. SDG Goal 1.2 states “By 2030, reduce at least
by half the proportion of men, women and children of all ages living in poverty in all its dimensions according to national definitions” (United Nations, 2015).
Univers
ity of
Mala
ya

217
Specifically, ECEA was used in this thesis to evaluate universal rotavirus vaccination
in Malaysia, in three domains of (1) health gains - hospitalisations and clinic visits
averted, (2) household healthcare expenditure crowded out – OOP direct medical costs
averted, and (3) financial risk protection afforded - prevention of financially catastrophic
and impoverishing payments, distributed across the income strata of the country.
7.2.3 Data sources
7.2.3.1 The National Health and Morbidity Survey 2011
The National Health and Morbidity Surveys (NHMS) are a series of nationwide
household health surveys conducted by the MOH, Malaysia. These surveys are carried
out at regular intervals to assess health status, disease patterns and health-seeking
behaviour of the Malaysian population.
The NHMS 2011 is the fourth household health survey in this series and was
conducted in 2011. The general aim of the NHMS 2011 was to provide community based
health data to support the MOH, Malaysia in reviewing health priorities, strategies,
activities and the planning of resource allocation. One of the specific aims of NHMS
2011 was to ascertain health care demand of the community in Malaysia. This included
determining the load of illness, the health seeking behaviour, health utilisation patterns
and healthcare consumption costs of the community in Malaysia.
The sampling frame for the NHMS 2011 was provided by the Department of Statistics,
Malaysia, and was updated in 2010 prior to the National Population and Housing Census
2010. Based on this sampling frame, the country was divided into Enumeration Blocks
(EBs), which were geographically contiguous areas with identifiable demarcations. In
2010, there were approximately 75,000 EBs in Malaysia, each containing between 80 to
120 Living Quarters (LQs). Each LQ had an average of 500 to 600 people. Sample size
was determined by examining the prevalence rate for diseases and health problems in
Univers
ity of
Mala
ya

218
Malaysia from the NHMS 2006, with a margin of error of between 0.01 and 0.05, and a
confidence interval of 95 per cent.
The NHMS 2011 ensured national representativeness by using a two-stage, stratified
sampling design, targeting both urban and rural areas96, in all states in Malaysia. The two
strata were the primary stratum, which consisted of all the states and Federal Territories
in Malaysia, and the secondary stratum, which was made up of all the urban and rural
areas within the primary stratum. Sampling was conducted in two stages, with the EBs
as the primary sampling unit and the LQs within each sampled EBs, as the secondary
sampling unit. A total of 794 EBs were selected from all the EBs in Malaysia. From each
selected EBs, twelve LQs were selected randomly and all households within these
selected LQs were included in the study.
A total of 9,528 LQs were sampled for this survey with 8,529 LQs eligible, and a
response rate of 88.2 per cent at LQs. Each LQ had an average of 4.1 individuals. A total
of 30,806 individuals were eligible and 28,650 were interviewed, with a response rate of
93.0 per cent of individuals (Ministry of Health Malaysia, 2011b).
For this current chapter, the NHMS 2011 provided information on the average OOP
healthcare expenditure and utilisation patterns for both inpatient and outpatient care, at
public and private health facilities by national income quintiles in Malaysia (Ministry of
Health Malaysia, 2011b). The NHMS 2011 was chosen for use in this chapter, as it was
the most recent national household health survey. Also the NHMS 2011 was conducted
close to the study period of the 2010 hospital-based rotavirus study, which also provided
data for this chapter (Lee et al., 2012).
96 The classification of urban or rural areas for this survey was done by the Department of Statistics based on the population size
of gazetted areas at the time of the 2010 census. An urban area was defined as a gazetted area with a combined population of 10,000
or more. While a rural area was defined as a gazetted area with a population of less than 10,000.
Univers
ity of
Mala
ya
219
7.2.3.2 Hospital-based rotavirus study
The two-year prospective rotavirus study conducted at two public hospitals in
Malaysia from 2008 to 2010, collected information on illness-related expenditure for all
children younger than five years admitted for acute diarrhoea. This hospital-based
rotavirus study was the source for OOP direct medical costs for public hospitals, used in
this current analysis. This dataset was described and analysed in Chapter 6.
The national income quintiles used for this chapter was obtained from the NHMS 2011
(Ministry of Health Malaysia, 2011b). As income quintiles from the hospital-based
rotavirus study (Lee et al., 2012) corresponds with the national income quintiles obtained
from NHMS 2011, direct medical costs for rotavirus episodes treated at public hospitals
by income quintiles was obtained from this hospital-based study.
Table 7.2 shows a comparison of income between the NHMS 2011 dataset and the
hospital-based rotavirus study.
Univers
ity of
Mala
ya
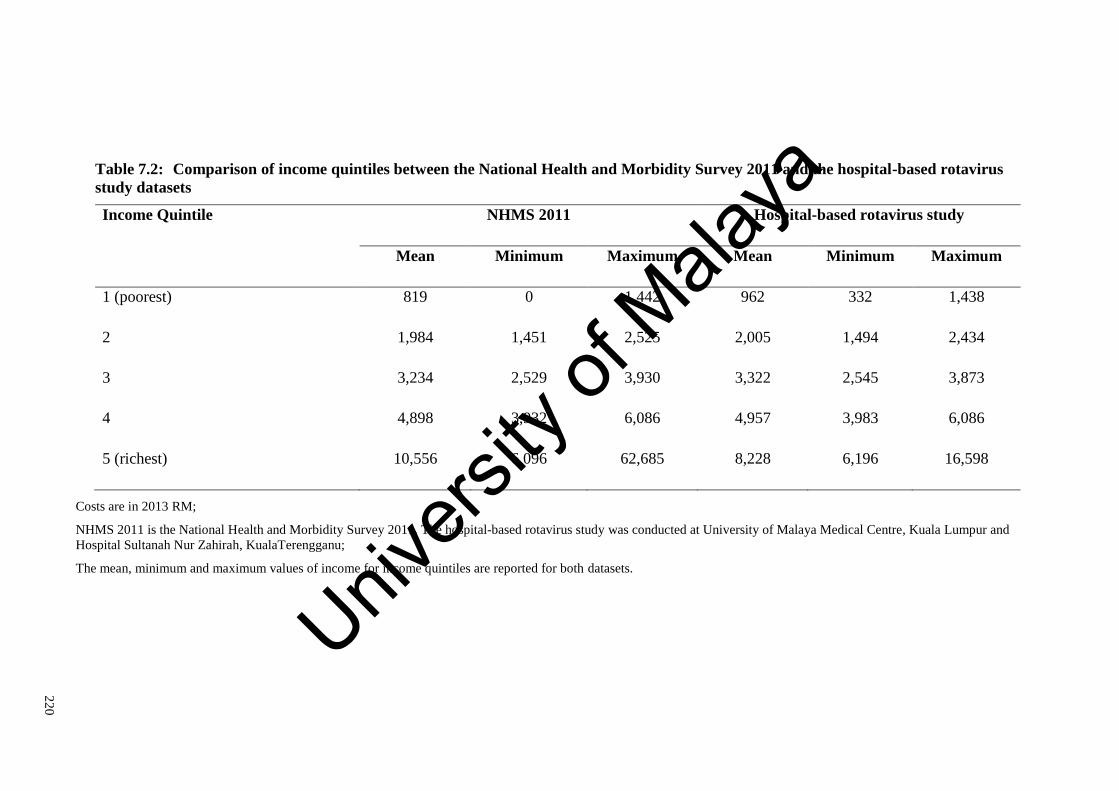
22
0
Table 7.2: Comparison of income quintiles between the National Health and Morbidity Survey 2011 and the hospital-based rotavirus
study datasets
Income Quintile NHMS 2011 Hospital-based rotavirus study
Mean Minimum Maximum Mean Minimum Maximum
1 (poorest) 819 0 1,442 962 332 1,438
2 1,984 1,451 2,525 2,005 1,494 2,434
3 3,234 2,529 3,930 3,322 2,545 3,873
4 4,898 3,932 6,086 4,957 3,983 6,086
5 (richest) 10,556 6,096 62,685 8,228 6,196 16,598
Costs are in 2013 RM;
NHMS 2011 is the National Health and Morbidity Survey 2011. The hospital-based rotavirus study was conducted at University of Malaya Medical Centre, Kuala Lumpur and
Hospital Sultanah Nur Zahirah, KualaTerengganu;
The mean, minimum and maximum values of income for income quintiles are reported for both datasets.
Univers
ity of
Mala
ya

221
7.2.4 Parameters in the model
7.2.4.1 Vaccine characteristics
The rotavirus vaccines were assumed to follow the routine schedule for DTP vaccines
in Malaysia. Thus, Rotarix® vaccines was assumed to be administered at the age two and
three months. Rotavirus vaccine coverage was based on the third dose DTP coverage of
97 per cent in Malaysia (World Health Organization, 2013b). Subsection 5.2.3.7 (page
131) details the estimation of rotavirus vaccine efficacy, for both complete and partial
regimes of Rotarix® in Malaysia (Table 7.1).
7.2.4.2 Rotavirus incidence
Rotavirus episodes considered here are episodes of rotavirus diarrhoea presenting to
the healthcare system, requiring either inpatient or outpatient care, at public or private
facilities. Episodes of rotavirus diarrhoea presenting to the healthcare system are relevant
for consideration by budget holders and policy makers. The estimation of rotavirus
incidence is detailed in Chapter 4, and a summary is presented here of parameters used
in the ECEA.
The annual incidence of rotavirus hospitalisations of 12.2 per 1,000 children under-
five years was estimated from diarrhoeal discharges to public and private hospitals in
Malaysia, reported to the MOH, Malaysia (Subsection 4.2.2.1, page 59). The annual
incidence of rotavirus outpatient visits of 16.2 per 1,000 children under-five years was
estimated based on diarrhoeal outpatient visits reported to MOH, Malaysia. Outpatient
visits were reported from MOH public health clinics and hospitals, and was estimated for
private health clinics (Subsection 4.2.2.2, page 63).
The proportion of diarrhoeal disease attributable to rotavirus for hospitalised episodes
(44.5 per cent) was obtained from a meta-analysis conducted of primary hospital-based
studies in Malaysia [Subsection 4.2.2.5(c), page 75]. A one year, community-based
Univers
ity of
Mala
ya

222
rotavirus surveillance study provided rotavirus detection proportions for acute
gastroenteritis treated at outpatient settings (18 per cent) [Subsection 4.2.2.5(a), page 74].
The age distribution of children presenting with rotavirus diarrhoea from the hospital-
based study was applied to all episodes in the model (Lee et al., 2012). (23 per cent in
children under 12 months, 37 per cent in children aged 12 to 23 months, 19 per cent in
children aged 24 to 35 months, 11 per cent in children aged 36 to 47 months and nine per
cent in children aged 48 to 59 months).
As rotavirus diarrhoea occurs in all children irrespective of socio-economic status
(Parashar et al., 2003; World Health Organization), episodes of rotavirus gastroenteritis
were distributed evenly across income quintiles. Malaysia has a tax-based, public
healthcare system that guarantees access to healthcare for all people regardless of income.
As such, the number of rotavirus gastroenteritis episodes receiving inpatient and
outpatient treatment were not varied by income quintile. However, utilisation of public
and private healthcare varies according to household income. Proportions of health
service utilisation by income quintile were obtained from the NHMS 2011. This allowed
for the distribution of health episodes to public or private care in each income quintile
(Ministry of Health Malaysia, 2011b). See Table 7.1 for the incidence of rotavirus
diarrhoea and proportions of utilisation of private and public care by income quintile in
Malaysia.
Table 7.3 presents results of the distribution of rotavirus gastroenteritis episodes in
Malaysia by income quintile.
Univers
ity of
Mala
ya
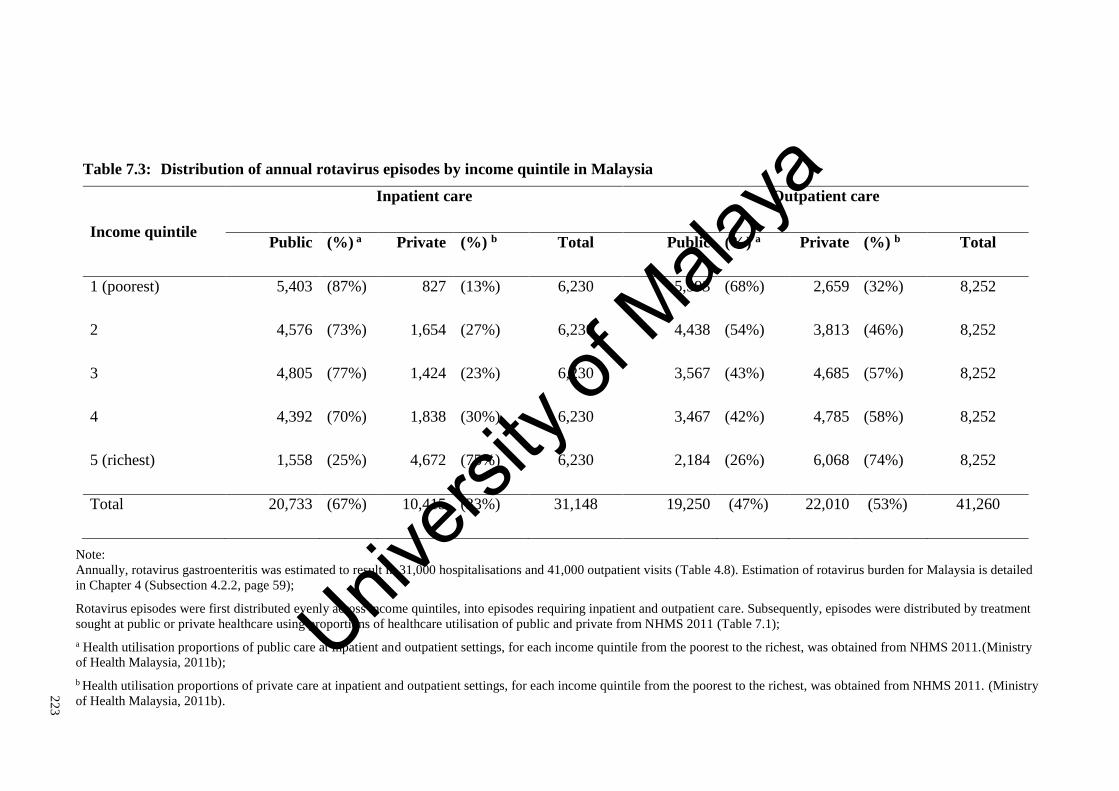
22
3
Table 7.3: Distribution of annual rotavirus episodes by income quintile in Malaysia
Income quintile
Inpatient care Outpatient care
Public (%) a Private (%) b Total Public (%) a Private (%) b Total
1 (poorest) 5,403 (87%) 827 (13%) 6,230 5,593 (68%) 2,659 (32%) 8,252
2 4,576 (73%) 1,654 (27%) 6,230 4,438 (54%) 3,813 (46%) 8,252
3 4,805 (77%) 1,424 (23%) 6,230 3,567 (43%) 4,685 (57%) 8,252
4 4,392 (70%) 1,838 (30%) 6,230 3,467 (42%) 4,785 (58%) 8,252
5 (richest) 1,558 (25%) 4,672 (75%) 6,230 2,184 (26%) 6,068 (74%) 8,252
Total 20,733 (67%) 10,415 (33%) 31,148 19,250 (47%) 22,010 (53%) 41,260
Note:
Annually, rotavirus gastroenteritis was estimated to result in 31,000 hospitalisations and 41,000 outpatient visits (Table 4.8). Estimation of rotavirus burden for Malaysia is detailed
in Chapter 4 (Subsection 4.2.2, page 59);
Rotavirus episodes were first distributed evenly across income quintiles, into episodes requiring inpatient and outpatient care. Subsequently, episodes were distributed by treatment
sought at public or private healthcare using proportions of healthcare utilisation of public and private from NHMS 2011 (Table 7.1);
a Health utilisation proportions of public care at inpatient and outpatient settings, for each income quintile from the poorest to the richest, was obtained from NHMS 2011.(Ministry
of Health Malaysia, 2011b);
b Health utilisation proportions of private care at inpatient and outpatient settings, for each income quintile from the poorest to the richest, was obtained from NHMS 2011. (Ministry
of Health Malaysia, 2011b).
Univers
ity of
Mala
ya

224
7.2.4.3 Direct medical costs
In this chapter, OOP direct medical costs were considered for rotavirus episodes
seeking care (hospitalisations and outpatient clinic visits). Direct medical costs were
healthcare expenditure paid OOP by patients, including costs for consultation, medication
and hospital charges for an illness episode.
OOP direct medical costs for public inpatient care by income quintile was obtained
from the 2010 hospital-based rotavirus study analysed in Chapter 6 (Lee et al., 2012).
Mean OOP direct medical costs by income quintiles was obtained from the combined
dataset of UMMC and HSNZ. These were RM 57, RM 93, RM 153, RM 241 and RM
824, for each income quintile from poorest to richest. (Table 7.1)
A ratio of OOP direct medical costs of private to public hospital care by income
quintile, was obtained from the NHMS 2011. These ratios were 2.3, 1.9, 4.5, 6.5 and 18.4,
for each income quintile from poorest to richest (Ministry of Health Malaysia, 2011b).
These ratios of OOP direct medical costs of private to public hospital care (from NHMS
2011) was multiplied with the OOP direct medical costs for hospitalisations97 (from the
2010 hospital-based study), to calculate OOP direct medical costs for private hospital
inpatient care by income quintile in Malaysia. (Table 7.4)
OOP direct medical costs for public and private outpatient visits by income quintile
were obtained directly from NHMS 2011 (Ministry of Health Malaysia, 2011b).
Table 7.4 shows average OOP direct medical costs for inpatient and outpatient care at
public and private healthcare, per-episode of rotavirus gastroenteritis by income quintile
in Malaysia.
97 OOP direct medical costs from the 2010 study consisted of pre-hospitalisation consultation costs and hospitalisation costs.
OOP direct medical costs for private inpatient care was calculated by multiplying hospitalisations costs from the hospital-based study,
with the ratio of private to public OOP healthcare costs from NHMS 2011. The ratio of private to public OOP healthcare costs were 2.3, 1.9, 4.5, 6.5 and 18.4, for each income quintile from poorest to richest.
Univers
ity of
Mala
ya

225
22
5
Table 7.4: Out-of-pocket direct medical costs per-episode of rotavirus gastroenteritis by income quintile in Malaysia
Income
quintile
Direct medical costs
Inpatient care Outpatient care
Public a Private b Public c Private c
1 (poorest) 115.87 204.30 0.63 9.23
2 191.52 254.47 1.08 13.38
3 221.65 755.64 1.83 13.38
4 245.87 1,240.11 1.82 26.99
5 (richest) 288.68 2,400.72 0.20 44.63
Note:
Costs are in 2013 RM;
a OOP direct medical costs for public inpatient care was obtained from the combined dataset of UMMC and HSNZ, from the 2010 hospital-based rotavirus study (Lee et al., 2012).
OOP direct medical costs from the 2010 study consisted of pre-hospitalisation consultation costs and hospitalisation costs;
b OOP direct medical costs for private inpatient care was calculated by multiplying hospitalisations costs from the hospital-based study, with the ratio of private to public OOP
healthcare costs from NHMS 2011. The ratio of private to public OOP costs were 2.3, 1.9, 4.5, 6.5 and 18.4, for each income quintile from poorest to richest;
c OOP direct medical costs for outpatient visits to public and private healthcare was obtained directly from NHMS 2011 (Ministry of Health Malaysia, 2011b).
Univers
ity of
Mala
ya

226
7.2.4.4 Catastrophic expenditure
Illness-related expenditure is regarded as financially catastrophic when it exceeds a
certain fraction of household income, as it is likely to disrupt household living standards.
While there is some debate on the appropriate threshold for use as a marker for
catastrophic expenditure, the threshold of ten per cent of monthly household income was
used in this thesis. The threshold of ten per cent has previously been used by researchers
at the World Bank, to indicate catastrophic healthcare payments (O'Donnell & Wagstaff,
2008; Adam Wagstaff & Van Doorslaer, 2003).
The choice of threshold for catastrophic expenditure is normative. The rationale being
expenditures above the threshold ten per cent of household income are considered to be
at the expense of other goods and service, forcing households to reduce consumption of
basic needs and disrupting household living standards (S. Russell, 2004).
The rationale for the estimation of catastrophic expenditure and the use of the
catastrophic threshold of ten per cent of monthly household income in this thesis, was
explained in Chapter 6 (Subsection 6.2.4.4, page 174).
7.2.4.5 Impoverishment
Healthcare payments are impoverishing, when households with incomes above the
poverty line prior to payments, fall below the poverty line as a consequence of OOP
healthcare payments. The poverty line income is the threshold below which even a
minimum standard of living is not ensured (Ravallion, 2010).
In this chapter, a household is considered impoverished if total monthly income falls
below the 2009 Poverty Line Income for Malaysia (RM 886 in 2013 RM), after payment
of direct medical costs (Department of Statistics Malaysia, 2009, p. 99). Incidence of
medical impoverishment is measured as the proportion of households impoverished due
to rotavirus gastroenteritis related health spending. The rationale for the measure of
Univers
ity of
Mala
ya
227
impoverishment and the use of the Poverty Line Income for Malaysia was explained in
Chapter 6 (Subsection 6.2.4.5, page 178).
7.2.5 Analytical methods
The national income quintiles used for this chapter was obtained from the NHMS 2011
(Ministry of Health Malaysia, 2011b). As income groups from the hospital-based
rotavirus study (Lee et al., 2012) corresponds with the national income quintiles obtained
from NHMS 2011, direct medical costs for rotavirus episodes treated at public hospitals
by income quintiles was obtained from this hospital-based study.
A histogram plotted to visualise the distribution of household income, revealed a log-
normal distribution of income by quintile. Also, a histogram plotted to visualise the
distribution of OOP direct medical costs showed that direct medical costs divided into
income quintiles had log-normal distributions.
Estimation of catastrophic and poverty impact of OOP direct medical costs was done
using R version 3.2.0. The mean and standard deviation of each income quintile was used
to generate log-normal income distributions of income. Direct medical costs was also
distributed according to log-normal distributions, using mean and standard deviations of
costs for each income quintile. Estimating the standard deviation of OOP direct medical
costs by income quintile is shown in Subsection 7.2.5.1.
Subsequently, the proportions of those incurring catastrophic expenditure or
impoverishment in each income quintile was estimated. The proportion of those incurring
catastrophic expenditure were the proportion of those with OOP direct medical
expenditure above the threshold of ten per cent of household income. The proportion of
those with medical impoverishment, was the proportion of households with household
income below the Malaysian Poverty Line Income after deducting OOP direct medical
costs (RM 886 in 2013 RM) (Department of Statistics Malaysia, 2009, p. 99). This was
Univers
ity of
Mala
ya

228
excluding those with income below the poverty line prior to deduction of healthcare
expenses.
To evaluate the impact of vaccination in reducing catastrophic and impoverishing
payments, vaccine efficacy specific to inpatient and outpatient treated episodes was
multiplied with the proportions of catastrophic payments and impoverishment for each
of these categories.
Univers
ity of
Mala
ya

229
7.2.5.1 Estimating the standard deviation for out-of-pocket direct medical costs by
income quintile
Average OOP direct medical costs by income quintile was calculated by dividing the
sum of inpatient and outpatient costs, with the incidence of rotavirus gastroenteritis for
each income quintile.
Average OOP costs = (inpatient costs + outpatient costs)/Incidence
c1 Hospitalisation costs 2010 hospital-based study
c2 Pre-hospitalisations costs 2010 hospital-based study
u1 Proportion of utilisation of
public care
NHMS 2011
u2 Proportion of utilisation of
private care
NHMS 2011
m ratio of private to public
OOP direct medical costs
NHMS 2011
c1 + c2 Public inpatient costs 2010 hospital-based study
mc1 private inpatient costs Author’s calculation
Inpatient costs = public inpatient costs + private inpatient costs
Inpatient costs
= [(𝐜𝟏 + 𝐜𝟐) 𝐮𝟏 + (𝐦𝐜𝟏) 𝐮𝟐]
(𝐮𝟏 + 𝐮𝟐)
Since utilisation of public and private care was a proportion of total healthcare,
(𝐮𝟏 + 𝐮𝟐) = 𝟏
Hence, Inpatient costs
= (𝐜𝟏 + 𝐜𝟐) 𝐮𝟏 + (𝐦𝐜𝟏) 𝐮𝟐
This formula was applied directly to the combined dataset of UMMC and HSNZ from
the 2010 hospital-based rotavirus study, to obtain inpatient costs. Inpatients costs were
then divided into income quintile, to obtain mean and standard deviations for each income
quintile. These standard deviations by income quintile were used to distribute OOP direct
medical costs according to log-normal distributions.
Univers
ity of
Mala
ya

230
7.2.6 Scenario analysis
Alternate scenarios were considered to explore the uncertainty around vaccine impact
estimates. These scenarios were (1) vaccination with RotaTeq® (Merck & Co. Inc., West
Point, PA, USA), and (2) considering the benefits of herd immunity.
Scenario analysis was also conducted to evaluate the impact of vaccination on all
illness-related costs relevant to households, including (1) direct costs – direct medical
and non-medical costs, and (2) direct and indirect costs.
7.2.6.1 RotaTeq®
RotaTeq® is a pentavalent, live attenuated rotavirus vaccine recommended by the
WHO for inclusion into the national immunisation programmes worldwide (World
Health Organization, 2013d). The vaccination schedule for the three-dose RotaTeq®
vaccine was assumed at two, three and five months of age, following the administration
schedule of DTP vaccines in Malaysia. Chapter 5 details the estimation of RotaTeq®
vaccine efficacy for complete and partial regimes (Subsection 5.2.3.7, page 135)
7.2.6.2 Herd immunity
Herd immunity is the protection conferred to unvaccinated individuals, when a
sufficiently large proportion of the population is vaccinated. The indirect benefits of
rotavirus vaccination have long been evidenced in numerous post-licensure studies in
high- and middle-income countries worldwide (Lopman et al., 2012; Pollard et al., 2015;
Seybolt & Bégué, 2012).
In this scenario the additional benefits of herd-immunity were included the evaluation.
The POLYMOD model incorporates the benefits of herd immunity based on results of a
transmission dynamic model of rotavirus vaccination in Belgium (Jit et al., 2009).
7.2.6.3 Direct non-medical costs
Direct non-medical costs are expenditure above normal consumption for
transportation, diapers and food, during an illness episode.
Univers
ity of
Mala
ya

231
Direct non-medical costs for public inpatient care by income quintile, was obtained
from the 2010 hospital-based study (Lee et al., 2012). Direct non-medical costs for
episodes requiring private inpatient care, and public and private outpatient care were
obtained from the estimation of rotavirus burden shown in Chapter 4 (Subsection 4.2.3.2,
page 88)98. These costs were distributed into income quintiles, by using weighted
averages for transportation, diapers and food costs by income quintiles from the 2010
hospital-based study.
7.2.6.4 Indirect costs
Productivity loss was calculated by multiplying daily wage with days of work missed
to care for an episode of rotavirus gastroenteritis.
The minimum monthly wage in Malaysia of RM 900 in 2013 was used as the
benchmark for productivity loss in this chapter (Attorney General's Chambers Malaysia,
2012). This was a conservative assumption of productivity loss, as minimum wages is
assumed for all income groups, including non-wage earning carers like housewives and
those in the informal sector, without fixed wage rates. The average duration of diarrhoeal
illness in children under five years of age of 2.7 days, was obtained from NHMS 2006,
was assumed to represent days of work missed for rotavirus gastroenteritis episodes
(Ministry of Health Malaysia, 2006). This is a conservative assumption, as work days
lost were assumed to be the same for all diarrhoeal episodes regardless of severity.
As wage-earners were assumed to work six days a week, daily wage was calculated
by dividing the monthly minimum wage by 26. The Malaysian monthly minimum wage
was multiplied with the average duration of diarrhoea to estimate productivity loss of RM
93 per-episode.
98 Estimation of direct non-medical costs for inpatient and outpatient care, at both public and private healthcare facilities are
shown in Chapter 4 (Subsection 4.2.3.2, page 108).
Univers
ity of
Mala
ya

232
7.3 Results
7.3.1 General findings
Rotavirus episodes were distributed evenly across income quintiles. However the
utilisation of public and private services varied by income, with the rich utilising more
private care, and the poor utilising more public care. Despite the availability of subsidised
public care, the poorest still utilise private care, especially for outpatient treatment. (Table
7.3)
The richest spend the most on rotavirus-related direct medical costs compared to all
other income groups especially the poorest (RM 824 vs. RM 57) (Figure 7.1). The richest
are likely to incur higher healthcare expenditure due to the utilisation of more expensive
private care (Table 7.4). The poor pay less than the rich in direct medical costs. However,
the poorest are second only to the richest income quintile, in terms of OOP direct medical
costs as a percentage of total household income (six per cent vs. ten per cent) (Figure
7.1).
OOP direct medical costs for rotavirus results in catastrophic expenditure among all
income groups, and impoverishment among the poorest three income quintiles.
Surprisingly, about forty per cent of the richest spent more than ten per cent of household
income on direct medical costs for rotavirus, although none were impoverished. (Table
7.5)
Prior to deducting healthcare expenditure, forty per cent of those in the poorest
quintile had income below the poverty line. Despite the high-frequency of catastrophic
payments among the richest quintile, the poorest were vulnerable to health shocks with
twelve per cent experiencing catastrophic payments and five per cent impoverished due
to rotavirus-related expenditure. (Table 7.5)
Figure 7.1 shows average OOP direct medical costs for rotavirus gastroenteritis by
income quintile in Malaysia.
Univers
ity of
Mala
ya

233
7.3.2 Base-case analysis
Rotavirus vaccination resulted in substantial reduction of rotavirus episodes (76 per
cent) and OOP direct medical expenditure (84 per cent), evenly across all income groups.
Annually, rotavirus vaccination would result in savings of RM 16.7 million in OOP direct
medical costs to households seeking care for rotavirus episodes. These benefits were
evenly distributed across income quintiles.
Vaccination with Rotarix® averted catastrophic expenditure evenly among all income
groups (83 per cent). While, poverty reduction benefits were concentrated among the
poorest three quintiles (83 per cent).
Benefits of rotavirus vaccination are detailed in Table 7.5. Table 7.5 shows the
outcomes of rotavirus vaccination compared with no vaccination by income quintile in
Malaysia. The outcomes of rotavirus vaccination was expressed in terms of rotavirus
gastroenteritis episodes, OOP direct medical costs, catastrophic and impoverishing
healthcare payments.
Univers
ity of
Mala
ya
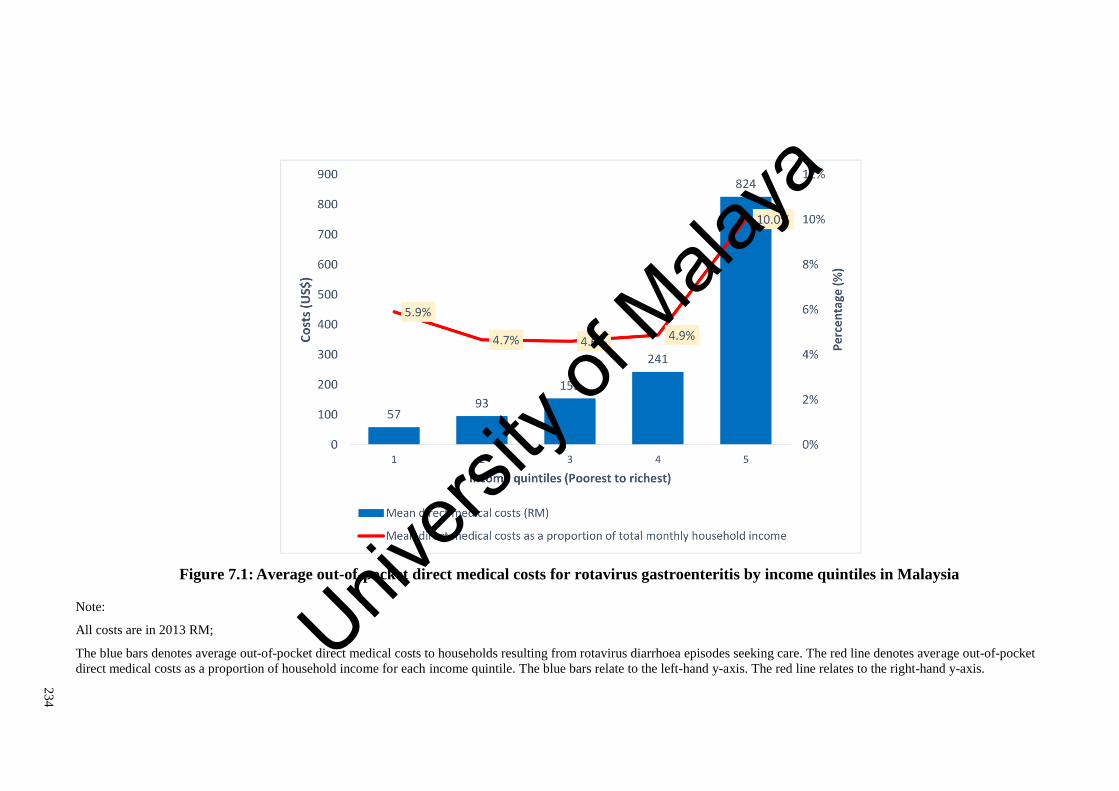
23
4
Figure 7.1: Average out-of-pocket direct medical costs for rotavirus gastroenteritis by income quintiles in Malaysia
Note:
All costs are in 2013 RM;
The blue bars denotes average out-of-pocket direct medical costs to households resulting from rotavirus diarrhoea episodes seeking care. The red line denotes average out-of-pocket
direct medical costs as a proportion of household income for each income quintile. The blue bars relate to the left-hand y-axis. The red line relates to the right-hand y-axis. Univ
ersity
of M
alaya

23
5
Table 7.5: Outcomes of rotavirus vaccination compared with no vaccination by income quintile in Malaysia
Income
quintiles
(Poorest)
1 2 3 4
(Richest)
5
Vaccination No
Vaccine Vaccine ∆
No
Vaccine Vaccine ∆
No
Vaccine Vaccine ∆
No
Vaccine Vaccine ∆
No
Vaccine Vaccine ∆
Rotavirus
episodes (×’000) 14.5 3.5 (76%) 14.5 3.5 (76%) 14.5 3.5 (76%) 14.5 3.5 (76%) 14.5 3.5 (76%)
OOP direct
medical costs
(×’000 RM)
823 131 (84%) 1,353 217 (84%) 2,210 351 (84%) 3,494 559 (84%) 11,937 1,880 (84%)
Catastrophic
payments a (%) 11.54% 1.93% (83%) 12.18% 2.02% (83%) 12.89% 2.13% (84%) 16.81% 2.78% (84%) 42.33% 6.96% (84%)
Impoverishment b
(%) 5.01% 0.86% (83%) 1.19% 0.20% (83%) 0.52% 0.09% (83%) 0.11% 0.02% (79%) 0.05% 0.01% (73%)
Note:
OOP, out-of-pocket costs; Costs are in 2013 RM;
∆, the percentage difference between ‘vaccine’ and ‘no vaccine’ groups are shown in parenthesis. The vaccine group shows outcomes of Rotarix® vaccination;
a Proportions of catastrophic payments are the proportions of households with OOP direct medical costs for rotavirus gastroenteritis above ten per cent of total monthly household
income;
b Proportions of medical impoverishment are the proportion of households with household income below the Malaysian Poverty Line Income, RM 886 in 2013 RM (Department of
Statistics Malaysia, 2009, p. 99) after deducting OOP direct medical costs. This was after excluding households with income below the poverty line prior to deduction of healthcare
expenses;
23
5
Univers
ity of
Mala
ya
236
7.3.3 Scenario analysis
Both commercially available vaccines were found to have similar impact and
distributional implications on rotavirus gastroenteritis incidence, expenditure, and
financial risk protection.
Herd immunity provides substantial additional benefits in reducing rotavirus
gastroenteritis episodes, direct medical costs, and alleviating the catastrophic and
impoverishing impact of healthcare payments. Impact of RotaTeq® vaccines and the
additional benefits of herd immunity are shown in Table 7.5.
When all household costs (direct and indirect costs) were considered, Rotarix®
resulted in substantial reduction in household expenditure (81 per cent) and catastrophic
expenditure (80 per cent) among all income groups. Rotarix® prevented impoverishment
(80 per cent) among the poorest three quintiles. Vaccine impact on all household costs
are shown in Table 7.7.
Univers
ity of
Mala
ya

23
7
Table 7.6: Scenario analysis comparing the impact of both rotavirus vaccines and herd immunity on outcome measures
Income quintiles (Poorest)
1 2 3 4
(Richest)
5
Vaccination No
Vaccine Vaccine
∆ No
Vaccine Vaccine
∆ No
Vaccine Vaccine
∆ No
Vaccine Vaccine
∆ No
Vaccine Vaccine
∆
Episodes (×’000)
RotaTeq® 14.5 4.2 (71%) 14.5 4.2 (71%) 14.5 4.2 (71%) 14.5 4.2 (71%) 14.5 4.2 (71%)
Rotarix® 14.5 3.5 (76%) 14.5 3.5 (76%) 14.5 3.5 (76%) 14.5 3.5 (76%) 14.5 3.5 (76%)
Herd Immunity 14.5 1.1 (93%) 14.5 1.1 (93%) 14.5 1.1 (93%) 14.5 1.1 (93%) 14.5 1.1 (93%)
Direct medical costs (×’000 RM)
RotaTeq® 823 155 (81%) 1,353 256 (81%) 2,111 414 (81%) 3,494 659 (81%) 11,937 2,216 (81%)
Rotarix® 823 131 (84%) 1,353 217 (84%) 2,111 351 (84%) 3,494 559 (84%) 11,937 1,879 (84%)
Herd Immunity 823 34 (96%) 1,353 56 (96%) 2,111 90 (96%) 3,494 144 (96%) 11,937 480 (96%)
Catastrophic expenditure (%)
RotaTeq® 11.54% 2.27% (80%) 12.18% 2.39% (80%) 12.89% 2.51% (81%) 16.81% 3.28% (80%) 42.33% 8.20% (81%)
Rotarix® 11.54% 1.93% (83%) 12.18% 2.02% (83%) 12.89% 2.13% (83%) 16.81% 2.78% (83%) 42.33% 6.96% (84%)
Herd Immunity 11.54% 0.49% (96%) 12.18% 0.52% (96%) 12.89% 0.54% (96%) 16.81% 0.71% (96%) 42.33% 1.76% (96%)
Impoverishment (%)
RotaTeq® 5.01% 1.01% (80%) 1.19% 0.24% (80%) 0.52% 0.10% (80%) 0.11% 0.03% (75%) 0.05% 0.02% (68%)
Rotarix® 5.01% 0.86% (83%) 1.19% 0.20% (83%) 0.52% 0.09% (83%) 0.11% 0.02% (79%) 0.05% 0.01% (73%)
Herd Immunity 5.01% 0.22% (96%) 1.19% 0.05% (96%) 0.52% 0.02% (96%) 0.11% 0.01% (94%) 0.05% 0.00% (92%)
Note: Costs are in 2013 RM;
∆, the percentage difference between ‘vaccine’ and ‘no vaccine’ groups are shown in parenthesis;
Scenarios compared here are vaccination with RotaTeq®, Rotarix®, and additional herd immunity. The scenario with Rotarix® is the base case scenario.
Univers
ity of
Mala
ya

23
8
Table 7.7: Scenario analysis considering the impact of vaccination on household costs for rotavirus gastroenteritis
Income quintiles (Poorest)
1
2
3
4
(Richest)
5
Vaccination No
Vaccine Vaccine
∆ No
Vaccine Vaccine
∆ No
Vaccine Vaccine
∆ No
Vaccine Vaccine
∆ No
Vaccine Vaccine
∆
Costs (×’000 RM)
Direct medical costs 823 131 (84%) 1,353 217 (84%) 2,211 351 (84%) 3,494 559 (84%) 11,937 1,880 (84%)
Direct costs 1,103 189 (83%) 1,879 323 (83%) 2,819 473 (83%) 4,175 695 (83%) 12,618 2,015 (84%)
Direct and indirect costs 2,456 513 (79%) 3,232 647 (80%) 4,172 798 (81%) 5,528 1,019 (82%) 13,972 2,340 (83%)
Catastrophic expenditure (%)
Direct medical costs 11.54% 1.93% (83%) 12.18% 2.02% (83%) 12.89% 2.13% (83%) 16.81% 2.78% (83%) 42.33% 6.96% (84%)
Direct costs 15.72% 2.77% (82%) 17.87% 3.12% (83%) 17.17% 2.93% (83%) 20.92% 3.53% (83%) 42.93% 7.10% (83%)
Direct and indirect costs 36.64% 7.90% (78%) 30.20% 6.44% (79%) 23.10% 4.96% (79%) 22.49% 5.06% (78%) 52.89% 7.52% (86%)
Impoverishment (%)
Direct medical costs 5.01% 0.86% (83%) 1.19% 0.20% (83%) 0.52% 0.09% (83%) 0.11% 0.02% (79%) 0.05% 0.01% (73%)
Direct costs 6.33% 1.24% (80%) 1.60% 0.31% (81%) 0.61% 0.12% (80%) 0.11% 0.03% (72%) 0.06% 0.02% (73%)
Direct and indirect costs 15.28% 3.37% (78%) 3.04% 0.64% (79%) 1.07% 0.20% (82%) 0.27% 0.06% (79%) 0.04% 0.03% (39%)
Note:
Costs are in 2013 RM;
∆, the percentage difference between ‘vaccine’ and ‘no vaccine’ groups are shown in parenthesis.;
Scenarios compared here are the impact of Rotarix® vaccination on direct medical costs, direct costs, and direct and indirect costs. The scenario testing Rotarix® vaccination on
direct medical costs is the base-case scenario.
Univers
ity of
Mala
ya

239
7.4 Discussion
In this chapter, the study findings indicate that households in all income groups
experience some degree of catastrophic payments due to healthcare expenditure for
rotavirus gastroenteritis. However, only households in the three poorest quintiles were
impoverished as a result of healthcare payments. Universal rotavirus vaccination helps
alleviate catastrophic expenses among all income quintiles, and prevents impoverishment
among the poorest quintiles.
Hence universal rotavirus vaccination, free at the point of use, can be considered as a
pro-poor policy that reduces health and social inequalities. However, these benefits are
not exclusive to the poor. The results in this chapter show that people in all income
quintiles benefit in terms of financial risk protection. Preventive measures such as
rotavirus vaccination are able to avert both the cost to households of actual treatment,
which are highly subsidised in the Malaysian context, but also the cost of seeking care
and productivity loss.
These findings suggest that universal, publicly-financed rotavirus vaccination, and
potentially other childhood vaccines administered to all, may be best regarded as common
goods to be made freely available to everyone, rather than a means-tested benefits
programme targeted at the poor only. A publicly-financed, universal vaccination policy
can be seen to protect all income groups, while protecting particularly the poorest from
impoverishing medical payments. This has implications beyond Malaysia to other
middle-income countries considering between alternative strategies towards UHC.
. Demonstrated in this analysis are the social values of fairness and distributive justice
promoted by universal vaccination, by allowing access to health benefits and financial
risk protection for all. Public-financing of programmes designed to promote equitable
distribution of benefits, for example a basic package of essential care including childhood
vaccines, enhance social solidarity.
Univers
ity of
Mala
ya
240
Healthcare in many middle-income countries are often delivered by mixed public-
private systems. In this environment, publicly-financed government healthcare delivery
coexists with privately-financed market delivery, in which OOP payments dominate as a
means of financing (Nishtar, 2010). Reliance on OOP payments may have detrimental
consequences on household welfare, exacerbating poverty and inequities in terms of
health outcomes and healthcare payments.
In Malaysia, the availability of a parallel private healthcare system exposes many to
the financial risk of direct payments for healthcare (Chee & Barraclough, 2007).
Household OOP expenditure in Malaysia is the largest source of financing in the private
sector amounting to 79 per cent of spending in this sector, or 37 per cent of total health
expenditure in 2012 (Ministry of Health Malaysia, 2012c). Our findings, that the rich opt-
out of public care in Malaysia, has similarities with Thailand, where the better-off are at
risk of catastrophic expenditure despite universal coverage (Somkotra & Lagrada, 2009).
However, our findings demonstrate that the poor also rely on private healthcare, despite
the heavy financial burden this often causes.
The financial consequences of illness on households are more than those directly
related to the healthcare service, and include non-medical costs like transportation and
productive time loss. Thus, financial risk protection is just one component of an even
broader social protection mechanism, which may include paid sick leave on the short term
and disability insurance in the long-term (Saksena et al., 2014). While this is not in the
immediate purview of health systems, governments may be concerned in ensuring social
protection against illness and its consequences.
Health financing strategies towards achieving UHC, either general taxation or
insurance based, provide protection against OOP healthcare payments but not against
non-medical spending associated with illness. In this thesis, universal vaccination is
Univers
ity of
Mala
ya

241
proposed as a social protection policy against medical and non-medical spending,
associated with ill health.
This analysis has several limitations. There are no universally accepted definition of
what is considered an “excessive” financial loss following illness, against which
governments should protect their populations. Because of this, two widely accepted,
threshold-based measures are used. The first defines healthcare expenditure as
catastrophic, if it exceeds a defined threshold of household income over a specified
duration of time. This acknowledges that households of any income can be badly hit by
healthcare expenditure, even if they are not forced into poverty. The second defines
healthcare expenditure as impoverishing when the post-expenditure household income
falls below a fixed threshold. In both cases, the use of threshold-based metrics for
measuring financial risk protection, has inherent methodological issues. These metrics
may underestimate financial hardship, as the poor may be deterred from utilising
healthcare as a result of high user fees. Also threshold-based metrics fail to consider
coping mechanisms like savings, borrowing or selling of assets (Moreno-Serra et al.,
2011; Saksena et al., 2014; Adam Wagstaff, 2008). Despite these acknowledged
limitations, threshold-based metrics are well established and widely used by
policymakers, thus chosen for this study.
Measures of financial risk protection are usually conducted for research on health
systems financing. In health systems research, definitions of catastrophic expenditure
usually compare all healthcare costs incurred by households against total household
resources over a defined period, usually a year. This current analysis examines the effect
of OOP healthcare payments for rotavirus gastroenteritis on household income, and the
benefits of universal vaccination in alleviating this burden. The current analysis differs
from health systems research in two ways. Firstly, the numerator used in this study are
Univers
ity of
Mala
ya
242
healthcare expenses specific for rotavirus diarrhoea and not all healthcare expenditure,
generally used in health systems research.
Secondly, in this study healthcare expenditure is considered to be catastrophic when it
exceeds a defined threshold of household income over a duration of one month. The
duration of one month is used because rotavirus diarrhoea is an acute illness, with
expenses incurred over a period of days and unlikely to be repeated (Bernstein, 2009).
Hence in this thesis, costs incurred for rotavirus diarrhoea are compared with monthly
income. Expenses over a short term have a different impact on household welfare
compared to expenses over a longer period, as some households are better able to use
current income, savings and established family or social networks to cope. Nevertheless,
an unexpectedly large, one-time expense may adversely impact poor households with less
resources to cope (Alam & Mahal, 2014).
The economic costs of diarrhoeal deaths are not considered here as Malaysia has low
rotavirus mortality. In this thesis, 27 rotavirus gastroenteritis related deaths among
children younger than five years, were estimated for 2013 (Table 4.8, p.92). While,
rotavirus vaccination would substantially reduce rotavirus mortality in Malaysia99,
estimation of the productivity gain of mortality averted is likely to be more important in
low-income countries, with higher rotavirus mortality.
Also, expenditure for informal care is not considered in this thesis as this is not relevant
in this setting. The NHMS 2006 reported that less than three per cent of children under-
five years with acute diarrhoea sought care at non-medical facilities, like traditional
healers or Chinese medicine shops (Ministry of Health Malaysia, 2006).
99 The analysis in Chapter 5 found that rotavirus vaccination would reduce 81 to 85 per cent of deaths due to rotavirus
gastroenteritis in Malaysia, annually. (Table 5.5, page 169)
Univers
ity of
Mala
ya

243
7.5 Conclusions
Universally administered rotavirus vaccines would benefit all in the population, but
the poorest benefits the most in terms of financial risk protection. Towards achieving
UHC, importance is placed on reducing societal disparities. In this thesis, it is proposed
that well-designed universal vaccination programs complements health financing reforms
in attaining and strengthening UHC.
Vaccines have long been regarded as cheap and effective interventions towards
improving population health (World Bank, 1993). However traditional evaluations of
vaccines focus on health gains and savings to the health system, underestimating the
broader benefits of vaccination (T. Bärnighausen et al., 2014; Till Bärnighausen et al.,
2014; Bishaia, Koenig, & Khan, 2003; Bloom et al., 2005; Deogaonkar et al., 2012).
In this thesis, it is proposed that economic evaluations of vaccines move away from
the narrow perspective of the health systems and consider the perspective of households,
with equity and financial risk protection as additional criteria towards vaccine
introduction. The ECEA explicitly quantifies the broader value of universal vaccination
starting with non-health benefits such as financial risk protection and equity. The tools
employed here are easily adaptable to other settings with different immunisation
programmes and health systems, to measure the essential role of vaccines towards UHC.
In the final chapter, the analytical findings of this thesis are discussed and policy
recommendations are made. Univers
ity of
Mala
ya
244
CHAPTER 8: CONCLUSION AND RECOMMENDATIONS
8.1 Introduction
In this thesis, an economic evaluation was conducted to inform policy on public finance
of rotavirus vaccines in Malaysia.
Rotavirus gastroenteritis is an important cause of severe childhood diarrhoea and
deaths worldwide. Rotavirus is a resilient and highly contagious virus. Public health
measures, such as improvement of hygiene and the provision of clean water and
sanitation, do not reduce viral transmission. Consequently, rotavirus vaccines are the only
effective preventive measure against rotavirus gastroenteritis. Although rotavirus
vaccines are available that are recommended for universal vaccination by the WHO, these
vaccines are not yet part of the Malaysian national immunisation programme. Therefore
this study sought to gather economic evidence to inform policy on rotavirus vaccine
introduction into the national immunisation programme in Malaysia.
Malaysia currently lacks an evidence-informed platform for decision making on
vaccine introduction. As such, a framework was suggested in this thesis specifically for
the economic evaluation of rotavirus vaccines in Malaysia. The health and economic
burden of rotavirus gastroenteritis was comprehensively estimated, with the aim of
establishing the public health importance of rotavirus in Malaysia. Subsequently, the cost-
effectiveness and affordability of rotavirus vaccines were evaluated. In this thesis, the
magnitude and distribution of the burden of illness-related payments for rotavirus
diarrhoea on household were explored using data from two hospitals in Malaysia. On
identifying income-related inequities in healthcare payments, the benefits of rotavirus
vaccines in providing financial risk protection across income groups in Malaysia were
explored.
In this final chapter, the economic evidence gathered in this thesis are rationally
discussed to inform policy on the public finance of rotavirus vaccines in Malaysia. The
Univers
ity of
Mala
ya

245
chapter begins with Section 8.2, which discusses the policy implications of the study
findings, in Malaysia and other countries. Next Section 8.3, identifies directions for future
research. The thesis ends with Section 8.4, which presents the concluding statements.
8.2 Research significance
8.2.1 Policy lessons for Malaysia
Market failure in healthcare and the population-wide benefits of herd immunity, are
strong motivators for the public finance of vaccines. However, economic evidence is not
yet a formal part of the decision-making process on the public finance of vaccines in
Malaysia. This is particularly important as new vaccines are more expensive and have
less clear benefits than traditional EPI vaccines100, making vaccine introduction decisions
more complex. Therefore, a framework for the economic evaluation of vaccines is
suggested in this thesis, to inform decisions on vaccine introduction. Although, this
framework is suggested specifically for rotavirus vaccines in Malaysia, it may be used to
evaluate other vaccines, and in other middle-income countries.
In this thesis, economic arguments are suggested for evidence-informed policy making
on vaccine introduction. Cost-effectiveness is suggested here not as a ‘gating-criteria’
towards vaccine introduction, but as a vital component in the economic evaluations of
vaccines. Cost-effectiveness together with a comprehensive estimate of health and
economic burden, vaccine affordability, and benefits in enhancing equity and providing
financial risk protection, are proposed as part of a range of economic evidence necessary
to inform policy on vaccine introduction. This thesis proposes that economic evaluations
of vaccines move beyond the narrow perspective of health systems and consider the
perspective of households and society, with equity and financial risk protection as
additional criteria towards vaccine introduction.
100 Traditional EPI vaccines, like the polio, diphtheria and tetanus vaccines, have clear benefits in preventing mortality and
disability. New vaccines like rotavirus vaccines, especially in low-mortality countries, have more benefits in preventing morbidity, in
terms of reduction of illness and the associated economic burden.
Univers
ity of
Mala
ya

246
Cost-effectiveness analysis are based on utilitarian principles, which aims to maximise
population health within budgetary constraints. Using results of a cost-effectiveness
analysis as the sole criteria for allocation decisions ignores vital considerations of equity,
and the fair distribution of benefits and costs in society. While determination of cost-
effectiveness is well-established in economic evaluations, assessment of the equity
impact of interventions is relatively new. In this thesis, the novel methods of an ECEA
were used to evaluate the benefits of rotavirus vaccines in providing financial risk
protection across income groups (Verguet, Laxminarayan, et al., 2015). The ECEA
explicitly quantifies the broader value of universal vaccination starting with non-health
benefits such as financial risk protection and equity. The ECEA provides an important
tool to understand the implications of vaccination for UHC beyond traditional
considerations of efficiency.
The economic evaluation of rotavirus vaccines in this thesis is the first conducted in
Malaysia. The evidence gathered here strongly suggest that rotavirus vaccines are a
worthy investment for the government of Malaysia. This study has revealed the
substantial health and economic burden of rotavirus in Malaysia, which vaccines are
likely to alleviate. This study has also found that both rotavirus vaccines are cost-effective
and likely to be affordable, depending on negotiated prices. Of importance to the health
system goal of health maximisation, is the reduction in the health burden. Rotavirus
vaccines substantially reduces episodes of rotavirus gastroenteritis and prevents up to 84
per cent of rotavirus deaths among children under-five years in Malaysia. Rotavirus
vaccines reduces health events and household illness-related expenditure among the
entire population, while protecting the poor in particular from impoverishment due to ill
health. The public finance of rotavirus vaccines strengthens UHC, by providing health
benefits and financial risk protection for the entire population.
Univers
ity of
Mala
ya

247
In middle-income countries like Malaysia, with mixed public-private healthcare
systems, the implications for public finance of vaccination programmes are unique. A
strong private sector puts the population at risk of the catastrophic and impoverishing
impact of healthcare payments (Jaafar et al., 2013). Vaccines as a part of basic package
of publicly-provided health services, may function as a social protection mechanism
against the financial consequences of ill health.
In Malaysia, rotavirus vaccines are currently only available for purchase at private
healthcare facilities. Retail prices of rotavirus vaccines are prohibitively expensive and
may preclude the poor from access to these essential vaccines. At current retail prices,
each dose of rotavirus vaccine costs between six and seven per cent of the average
monthly wage, or between thirteen and fifteen per cent of the minimum wage in
Malaysia101 (Attorney General's Chambers Malaysia, 2012; Department of Statistics
Malaysia, 2013c; Ministry of Health Malaysia, 2014a). Thus universal rotavirus
vaccination is particularly valuable in the Malaysian context, as it demonstrates the social
values of fairness and distributional justice, by allowing access to health benefits and
financial risk protection for all.
In this study, economic evaluation was conducted using the best available local
epidemiological and costing data, taking into consideration the Malaysian health system
and healthcare utilisation patterns. This study was conducted to answer a larger policy
question of vaccine introduction in Malaysia, which has practical applications beyond the
premise of academia. While the economic evidence resulting from this analysis are
important, they are not the only relevant considerations towards vaccine introduction. The
economic evidences gathered in this thesis fit within a larger, decision-making platform
for vaccine introduction. This larger health technology assessment platform should
101 Average wage in Malaysia US$ 651 per month (RM 2,502 per month) (Department of Statistics Malaysia, 2013c). Minimum
wage in Malaysia is US$ 286 per month (RM 900 per month) (Attorney General's Chambers Malaysia, 2012). Recommended retail
price for Rotarix and RotaTeq are US$ 44 (RM139) and US$ 37 (RM 136) per-dose (Ministry of Health Malaysia, 2014a).
Univers
ity of
Mala
ya

248
ideally include evidence on vaccine safety and efficacy, cost-effectiveness and other
economic criteria, as well as considerations of programmatic feasibility, ethics, values
and social acceptability, and the legal and political context (Field & Caplan, 2012; Hauck
et al., 2004; Ultsch et al., 2015).
The MOH, Malaysia through an extensive network of public health clinics, has a
mature vaccine delivery system (Jaafar et al., 2013). Consequently, programmatic
feasibility is not an issue in the Malaysian context. With investment in training and
manpower, a rotavirus surveillance network, and additional cold-chain and laboratory
capacity, among others (World Health Organization, 2005b), the public health system
under the MOH, Malaysia would be well able to cope with an additional vaccine in the
national immunisation programme.
The social context in Malaysia is unique. Malaysia has a multi-ethnic, multi-religious
society, with Islam as the national religion. Although the government is secular, religious
sensitivity influences policy. In 2008, the National Fatwa council issued a religious edict
against the use of RotaTeq® vaccines (JAKIM, 2008). According to the official website,
the fatwa was issued due to the alleged content of porcine derivatives in the vaccine
manufacturing process and the perceived non-urgency of the burden of rotavirus in
Malaysia (JAKIM, 2008). Such religious edicts have wide-spread repercussions affecting
public sentiment and spurring the growth of anti-vaccination groups. The stance of the
Malaysian Paediatric Association on this issue is positive, advocating for rotavirus
vaccine introduction on the basis of its public health importance. The Malaysian
Paediatric Association has countered the relevance of this edict with arguments based on
Islamic jurisprudence (Musa, Ismail, & Chan, 2015; Nordin, 2014). The Malaysian
Paediatric Association argued the relevance of this fatwa, by referencing a 2003 edict by
the European Council of Fatwa and Research, on the permissibility of oral polio vaccines,
which also contains trace elements of porcine trypsin (Nordin, 2014).
Univers
ity of
Mala
ya

249
In this social context, health authorities have a role in engaging with the public and
various special interest groups, to counter the spread of misinformation using scientific
evidence (Musa et al., 2015). This thesis contributes to vaccine advocacy by providing
health burden estimates which were previously not recorded, thus reinforcing the
importance of vaccination for prevention of illness.
Vaccinology is an increasingly complex field. New vaccines like the rotavirus
vaccines, unlike traditional vaccines in the EPI, are expensive. In low-mortality countries
like Malaysia, rotavirus vaccines prevent illness and suffering, but result in few deaths.
For these reasons, the WHO has recommended establishment of national technical
advisory bodies to guide immunisation programmes. The establishment of National
Immunisation Technical Advisory Groups (NITAGs) has been endorsed by all United
Nations member states during the 2012 World Health Assembly, along with the
endorsement of the Global Vaccine Action Plan (GVAP) 2011 to 2020 - a global
framework to prevent millions of deaths worldwide by 2020, through equitable access to
vaccination (World Health Organization, 2015a). NITAGs are independent bodies of
multi-disciplinary experts, who generate and collate available evidence to empower
policy-makers in making evidence-based decisions on immunisation programmes.
Independence from the influence of lobbyists, special interest groups, industry, media and
anti-vaccination groups, ensures the credibility of this process. (Adjagba et al., 2015;
Duclos, 2010).
The Health Intervention and Technology Assessment Programme (HITAP) in
Thailand is an example of a national agency that conducts economic appraisals of medical
products and public health initiatives, to enable evidence-based policy making. The
HITAP was established in 2007, as a semi-autonomous agency within the Ministry of
Public Health in Thailand (Tantivess, Teerawattananon, & Mills, 2009). In Malaysia, a
National Committee on Immunisation Practices was established in 2008 (NRC, 2015).
Univers
ity of
Mala
ya

250
However, the role of this committee in evidence generation and the extent of its influence
towards vaccine introduction is not clear.
Towards the use of economic evidence for national policy-making, benchmarks for
national resource allocation decisions need to be set by the MOH, Malaysia. Although
the MOH, Malaysia has produced methodological guidelines in an effort to standardise
economic research, this work is still in a preliminary stage (Ministry of Health Malaysia,
2012e). Malaysia has yet to define a cost-effectiveness threshold to inform resource
allocation decisions for public policy. In this thesis, cost-effectiveness thresholds for
Malaysia are explored with the aim of aiding negotiations for vaccine prices. The findings
of this thesis may stimulate further research, towards establishment of Malaysian cost-
effectiveness thresholds.
In this thesis, it is proposed that economic evidence be a definitive part of health
technology assessment for vaccine introduction in Malaysia. Evidences gathered in this
thesis, will be disseminated to policy-makers, and the local and international scientific
communities to aid policy on rotavirus introduction, advance research in novel
approaches to economic evaluations, and for use in vaccine advocacy.
8.2.2 Policy lessons for other countries
Middle-income countries are diverse in terms of income levels102, population size and
structure, and burden of disease (Kaddar et al., 2013). Despite the fact that most of the
world’s poor live in middle-income countries, these countries do not have the same access
to global aid and funding available to low-income countries for vaccine introduction
(Glassman, Duran, & Sumner, 2011). As such, middle-income countries fall behind low-
and high-income countries in introducing new and potentially lifesaving vaccines
(Kaddar et al., 2013; PATH, 2015).
102 The World Bank classifies middle-income countries as those with GNI per capita of between US$1,045 and US$12,736.
Middle-income countries are further divided into lower- and upper- middle-income countries by a GNI per capita of US$4,125.
(http://data.worldbank.org/about/country-and-lending-groups)
Univers
ity of
Mala
ya
251
Malaysia is an upper middle-income, with a mixed public-private healthcare system.
Therefore some of the challenges faced in Malaysia may be similar with other middle-
income countries. Lessons learned from this thesis on the economic evaluation of
rotavirus vaccines in Malaysia may be applicable to other middle-income countries.
The budgetary constraints faced by middle-income countries necessitate economic
evaluations of vaccines. The framework suggested in this thesis, though specific for the
evaluation of rotavirus vaccines in Malaysia, may be used as a guide for economic
evaluation of vaccines in other countries. The uniqueness of this framework is in its
consideration of multiple economic criteria beyond cost-effectiveness, including the
health and economic burden of the disease, programmatic affordability, as well as
benefits of the vaccine in enhancing equity and providing financial risk protection, all of
which inform decision-making on vaccine introduction.
A salient lesson from this thesis, is the customisation of the economic evaluation to
account for the complexity of health systems. Healthcare in most low- and middle-income
countries are provided by mixed public-private health systems, in which provision of
publicly-financed healthcare coexists with privately-financed healthcare (Nishtar, 2010).
This thesis demonstrates an example of a country-specific economic evaluation that could
easily be replicated in other countries.
In order to be relevant to national policy making, economic evaluations should utilise
the best available local evidence and be cognizant to the permutations of the health system
and population. Nevertheless, this may be challenging as most middle- and low-income
countries lack expertise on the generation of economic evidence, in addition to the paucity
of local data of quality (Kaddar et al., 2013). The research in this thesis would motivate
other middle- and low-income countries to utilise available data in order to develop
country-specific evaluations, while establishing mechanisms for better data collection.
Univers
ity of
Mala
ya

252
The dominance of out-of-pocket payments in mixed health systems may be financially
detrimental on households. This thesis is unique as it specifically considers the household
perspective in an economic evaluation of universal rotavirus vaccination in Malaysia.
From the households’ perspective, poverty reduction, and financial risk protection, could
be viewed as important aims of health systems that would strengthen the case for vaccine
introduction. Middle-income countries like Indonesia, Sri Lanka, Viet Nam and others
that have yet to introduce rotavirus vaccines could potentially benefit from the broader
social and economic impact of rotavirus vaccination (PATH, 2016). The ECEA
methodology explicitly quantifies the broader economic value of universal vaccination,
in providing financial risk protection and enhancing equity. The tools employed in this
thesis are easily adaptable to other settings, to measure the role of vaccines towards UHC.
Like Malaysia, many other countries have not defined a cost-effectiveness threshold
for decision making on healthcare resource allocations. As the use of cost-effectiveness
analysis increase, there will be a need for countries to define thresholds for transparent
and consistent decision-making. The cost-effectiveness analysis conducted in this thesis
considered WHO-CHOICE thresholds and different thresholds suggested for Malaysia,
could inform the debate on appropriate cost-effectiveness thresholds in other countries.
Univers
ity of
Mala
ya

253
8.3 Direction for future research
Economic evaluations of vaccines are considered a necessary part of resource
allocation decisions in many countries. While the need for economic evidence is
indisputable, this has yet to be formalised for use in vaccine-related health sector
decisions in Malaysia. This thesis gathered economic arguments towards aiding decisions
on public finance of rotavirus vaccines in Malaysia. While it is clear from the study
findings, that rotavirus vaccines are a good investment in Malaysia, the scale of this
debate warrants further exploration. To generate achievable policy strategies, there needs
to be further research on the decision-making process in the country. Suggested here are
studies that would fill identified research gaps for future economic evaluation of
childhood vaccines.
Firstly, qualitative research should be conducted to identify the important dimensions
and processes involved in decision-making on programme introduction in the MOH,
Malaysia. This would be advantageous in making scientific and economic evidence more
accessible and friendly to policy makers. This evidence may have a practical value in
consolidating the role of NITAGs in Malaysia.
Secondly, qualitative studies should be conducted to explore the public’s view on
vaccination. This kind of exploration would provide insight to designing and delivering
vaccination programmes with the aim of improving vaccine uptake and acceptance, in the
light of individual and community needs.
Thirdly, the lack of a validated questionnaire to assess the health status of children
under-five years, is an important area for research, both locally and internationally103.
Evaluation of health status of children under-five years in the Malaysia setting would be
facilitated by the construction of an appropriate questionnaire.
103 Questionnaires available do not take into account the developmental aspects of a growing child.
Univers
ity of
Mala
ya

254
The lack of unit costs of healthcare services is an important gap in conducting
economic evaluations in Malaysia. Costing of services is particularly relevant for priority
setting, planning and evaluation of public programmes in Malaysia. Given the complexity
of the healthcare system, costing should be conducted at all levels of the health service,
both in the public and private sector.
Also, clinical research on infectious disease or vaccine efficacy should include a
costing component. Timely collection of necessary costing data would aid future
economic evaluations of vaccines, and subsequent decision-making on vaccine
introduction.
Finally, as cost-effectiveness thresholds have yet to be defined in Malaysia, this is an
important avenue for future research. Studying the impact of changes in health sector
investment decisions on population health outcomes, or in other words the opportunity
costs of introducing new technologies, would help validate cost-effectiveness thresholds
estimated for Malaysia by researchers at York University (Woods et al., 2015). A
nationally representative, population-wide survey on the individual willingness-to-pay
for health would also be useful to inform societal willingness-to-pay thresholds for
Malaysia.
Univers
ity of
Mala
ya

255
8.4 Conclusion
Findings of this thesis demonstrate a considerable health and economic burden of
rotavirus in Malaysia to healthcare providers, society and households. Rotavirus
vaccines, at prices negotiated in accordance to international norms, are likely to be a cost-
effective and affordable intervention in Malaysia. In addition to reducing the burden of
rotavirus and providing financial risk protection across all income groups, rotavirus
vaccination protects the poorest households against the impoverishing impact of illness-
related expenditure. The economic evidence gathered in this thesis suggests that universal
rotavirus vaccination is a worthy investment for public finance by the MOH, Malaysia.
This thesis proposes that economic evaluation of vaccines move beyond the traditional
considerations of cost-effectiveness and consider the broader economic benefits of
vaccination in improving equity and providing financial risk protection. The framework
developed here is important not only in the Malaysian setting, but also in other middle-
income countries where economic evidence is not yet part of decision-making on vaccine
introduction.
Univers
ity of
Mala
ya

256
REFERENCES
Adam, T., Evans, D. B., & Murray, C. J. (2003). Econometric estimation of country-
specific hospital costs. Cost Effectiveness and Resource Allocation, 1(1), 3.
Adjagba, A., Senouci, K., Biellik, R., Batmunkh, N., Faye, P. C., Durupt, A., . . . da
Silva, A. (2015). Supporting countries in establishing and strengthening
NITAGs: Lessons learned from 5 years of the SIVAC initiative. Vaccine,
33(5), 588-595.
Adlard, N., Kinghorn, P., & Frew, E. (2014). Is the UK NICE “Reference Case”
Influencing the Practice of Pediatric Quality-Adjusted Life-Year Measurement
within Economic Evaluations? Value in Health, 17(4), 454-461.
Adnan, T. H., Bujang, M. A., Supramaniam, P., Hamedon, N. M. a., Lazim, S. S. M.,
Haniff, J., & Hamid, A. M. A. (2012). Trend Analysis of Medically Certified
Death in Malaysia, 1995-2010. Journal of Health Informatics in Developing
Countries, 6(1).
Alam, K., & Mahal, A. (2014). Economic impacts of health shocks on households in
low and middle income countries: A review of the literature. Global Health,
10, 21.
Allison, P. D. (2001). Missing data (Vol. 136). Thousand Oaks, California: Sage
Publications.
Armah, G. E., Sow, S. O., Breiman, R. F., Dallas, M. J., Tapia, M. D., Feikin, D. R., . . .
Ansah, N. A. (2010). Efficacy of pentavalent rotavirus vaccine against severe
rotavirus gastroenteritis in infants in developing countries in sub-Saharan
Africa: A randomised, double-blind, placebo-controlled trial. The Lancet,
376(9741), 606-614.
Arrow, K. J. (1963). Uncertainty and the welfare economics of medical care. The
American economic review, LIII(5), 941-973.
Atherly, D. E., Lewis, K. D., Tate, J., Parashar, U. D., & Rheingans, R. D. (2012).
Projected health and economic impact of rotavirus vaccination in GAVI-
eligible countries: 2011–2030. Vaccine, 30, A7-A14.
Attorney General's Chambers Malaysia. (2012). Minimum Wages Order. Malaysia:
Federal Government Gazette Retrieved from
http://minimumwages.mohr.gov.my/news-publications/law/.
Univers
ity of
Mala
ya

257
Aziz, F. (2016, 13 January 2016). Health Ministry faces budget cut of between
RM250m to RM300m New Straits Times Online. Retrieved from
http://www.nst.com.my/news/2016/01/122006/health-ministry-faces-budget-
cut-between-rm250m-rm300m?d=1
Bakir, M., Standaert, B., Turel, O., Bilge, E., & Postma, M. (2012). Estimating and
comparing the clinical and economic impact of paediatric rotavirus
vaccination in Turkey using a simple versus an advanced model. Vaccine,
31(6), 979-986.
Baltussen, R., & Niessen, L. (2006). Priority setting of health interventions: the need for
multi-criteria decision analysis. Cost Effectiveness and Resource Allocation,
4(1), 14.
Bank Negara Malaysia. (2015). Bank Negara Malaysia. Rates and Statistics: Exchange
Rates. Retrieved 20th October 2015, from
http://www.bnm.gov.my/index.php?ch=statistic&pg=stats_exchangerates&lan
g=en&StartMth=1&StartYr=2015&EndMth=10&EndYr=2015&sess_time=12
00&pricetype=Mid&unit=rm
Bärnighausen, T., Berkley, S., Bhutta, Z., Bishai, D. M., Black, M. M., Bloom, D. E., . .
. Griffiths, U. (2014). Reassessing the value of vaccines. The Lancet Global
Health, 2(5), e251-e252.
Bärnighausen, T., Bloom, D. E., Cafiero-Fonseca, E. T., & O’Brien, J. C. (2014).
Valuing vaccination. Proceedings of the National Academy of Sciences,
111(34), 12313-12319.
Barnum, H., & Kutzin, J. (1993). Public hospitals in developing countries: resource
use, cost, financing. Baltimore, Maryland: Johns Hopkins University Press.
Becker, G. S. (1962). Investment in human capital: A theoretical analysis. The journal
of political economy, 70(5), 9-49.
Berki, S. E. (1986). A look at catastrophic medical expenses and the poor. Health
affairs, 5(4), 138-145.
Bernstein, D. I. (2009). Rotavirus overview. The Pediatric infectious disease journal,
28(3), S50-S53.
Berry, S. A., Johns, B., Shih, C., Berry, A. A., & Walker, D. G. (2010). The cost-
effectiveness of rotavirus vaccination in Malawi. Journal of Infectious
Diseases, 202(Supplement 1), S108-S115.
Univers
ity of
Mala
ya

258
Beutels, P., Scuffham, P. A., & MacIntyre, C. R. (2008). Funding of drugs: do vaccines
warrant a different approach? The Lancet Infectious Diseases, 8(11), 727-733.
Beutels, P., Van Doorslaer, E., Van Damme, P., & Hall, J. (2003). Methodological
issues and new developments in the economic evaluation of vaccines. Expert
review of vaccines, 2(5), 649-660.
Bhandari, N., Rongsen-Chandola, T., Bavdekar, A., John, J., Antony, K., Taneja, S., . . .
Bhan, M. K. (2014). Efficacy of a monovalent human-bovine (116E) rotavirus
vaccine in Indian children in the second year of life. Vaccine, 32, Supplement
1, A110-A116.
Bilcke, J., & Beutels, P. (2009). Reviewing the cost effectiveness of rotavirus
vaccination. Pharmacoeconomics, 27(4), 281-297.
Bilcke, J., Van Damme, P., Van Ranst, M., Hens, N., Aerts, M., & Beutels, P. (2009).
Estimating the incidence of symptomatic rotavirus infections: A systematic
review and meta-analysis. PLoS One, 4(6), e6060.
Bishaia, D., Koenig, M., & Khan, M. A. (2003). Measles vaccination improves the
equity of health outcomes: evidence from Bangladesh. Health economics,
12(5), 415-419.
Bishop, R. F., Davidson, G. P., Holmes, I. H., & Ruck, B. J. (1973). Virus particles in
epithelial cells of duodenal mucosa from children with acute non-bacterial
gastroenteritis. The Lancet, 302(7841), 1281-1283.
Black, S. (2013). The role of health economic analyses in vaccine decision making.
Vaccine, 31(51), 6046-6049.
Bloom, D. E., Canning, D., & Weston, M. (2005). The value of vaccination. World
Economics, 6(3), 15-39.
Boerma, T., AbouZahr, C., Evans, D., & Evans, T. (2014). Monitoring intervention
coverage in the context of universal health coverage. PLoS Medicine, 11(9),
e1001728.
Bradley, J. V. (1968). Distribution-free statistical tests. Englewood Cliffs, New Jersey
Prentice-Hall, Inc.
Braveman, P., & Gruskin, S. (2003). Defining equity in health. Journal of epidemiology
and community health, 57(4), 254-258.
Univers
ity of
Mala
ya

259
Brazier, J., & Longworth, L. (2011). NICE DSU technical support document 8: An
introduction to the measurement and valuation of health for NICE
submissions. NICE Decision Support Unit, London.
Briggs, A. H. (2000). Handling uncertainty in cost-effectiveness models.
Pharmacoeconomics, 17(5), 479-500.
Brisson, M., Sénécal, M., Drolet, M., & Mansi, J. A. (2010). Health-related quality of
life lost to rotavirus-associated gastroenteritis in children and their parents: A
Canadian prospective study. The Pediatric infectious disease journal, 29(1),
73-75.
Buhi, E. R., Goodson, P., & Neilands, T. B. (2008). Out of sight, not out of mind:
Strategies for handling missing data. American journal of health behavior,
32(1), 83-92.
Buttery, J., Danchin, M., Lee, K., Carlin, J., McIntyre, P., Elliott, E., . . . Bines, J.
(2011). Intussusception following rotavirus vaccine administration: Post-
marketing surveillance in the National Immunization Program in Australia.
Vaccine, 29(16), 3061-3066.
Buxton, M. J., Drummond, M. F., Van Hout, B. A., Prince, R. L., Sheldon, T. A., Szucs,
T., & Vray, M. (1997). Modelling in ecomomic evaluation: An unavoidable
fact of life. Health economics, 6(3), 217-227.
Carlos, C. C., Inobaya, M. T., Bresee, J. S., Lagrada, M. L., Olorosa, A. M., Kirkwood,
C. D., & Widdowson, M.-A. (2009). The burden of hospitalizations and clinic
visits for rotavirus disease in children aged< 5 years in the Philippines.
Journal of Infectious Diseases, 200(Supplement 1), S174-S181.
Chai, P. F., & Lee, W. S. (2009). Out-of-pocket costs associated with rotavirus
gastroenteritis requiring hospitalization in Malaysia. Vaccine, 27, F112-F115.
Chee, H. L., & Barraclough, S. (Eds.). (2007). Health care in Malaysia: The dynamics
of provision, financing and access. USA and Canada: Routledge
Chen, K.-T., Fan, S.-F., Tang, R.-B., Huang, Y.-F., Lee, P.-I., Chen, P.-Y., . . . Chen,
H.-C. (2007). Hospital-based study of the economic burden associated with
rotavirus diarrhea in Taiwan. Vaccine, 25(21), 4266-4272.
Chodick, G., Waisbourd-Zinman, O., Shalev, V., Kokia, E., Rabinovich, M., &
Ashkenazi, S. (2009). Potential impact and cost-effectiveness analysis of
rotavirus vaccination of children in Israel. The European Journal of Public
Health, 19(3), 254-259.
Univers
ity of
Mala
ya

260
Claxton, K., Martin, S., Soares, M., Rice, N., Spackman, E., Hinde, S., . . . Sculpher, M.
(2015). Methods for the estimation of the National Institute for Health and
Care Excellence cost-effectiveness threshold. Health Technology Assessment,
19(14).
College voor zorgverzekeringen, D. (2006). Guidelines for pharmacoeconomic
research, updated version Netherlands: Retrieved from
http://www.ispor.org/peguidelines/source/HTAGuidelinesNLupdated2006.pdf.
Cookson, R. (2003). Willingness to pay methods in health care: A sceptical view.
Health economics, 12(11), 891-894.
Coudouel, A., Hentschel, J. S., & Wodon, Q. T. (2002). Poverty measurement and
analysis. In J. Klugman (Ed.), A Sourcebook for poverty reduction strategies
(Vol. 1, pp. 27-74). Washington DC: The World Bank.
Culyer, A. J. (2001). Equity-some theory and its policy implications. Journal of medical
ethics, 27(4), 275-283.
Culyer, A. J., & Newhouse, J. P. (Eds.). (2000). Handbook of health economics (Vol.
1). Amsterdam, The Netherlands: Elselvier.
Dawson, A. (2011). Vaccination Ethics. In A. Dawson (Ed.), Public health ethics: Key
concepts and issues in policy and practice. Cambridge, United Kingdom:
Cambridge University Press.
De la Hoz-Restrepo, F., Castaneda-Orjuela, C., Paternina, A., & Alvis-Guzman, N.
(2013). Systematic review of incremental non-vaccine cost estimates used in
cost-effectiveness analysis on the introduction of rotavirus and pneumococcal
vaccines. Vaccine, 31, C80-C87.
Dennehy, P. (2000). Transmission of rotavirus and other enteric pathogens in the home.
The Pediatric infectious disease journal, 19(Supplement 10 ), S103-S105.
Dennehy, P. H., Vesikari, T., Matson, D. O., Itzler, R. F., Dallas, M. J., Goveia, M., . . .
Ciarlet, M. (2011). Efficacy of the pentavalent rotavirus vaccine, RotaTeq®
(RV5), between doses of a 3-dose series and with less than 3 doses
(incomplete regimen). Human Vaccines, 7(5), 563-568.
Deogaonkar, R., Hutubessy, R., van der Putten, I., Evers, S., & Jit, M. (2012).
Systematic review of studies evaluating the broader economic impact of
vaccination in low and middle income countries. BMC Public Health, 12(1),
878.
Univers
ity of
Mala
ya
261
Department of Statistics Malaysia. (2009). Household income and basic amenities
survey report 2009. Malaysia: Department of Statistics.
Department of Statistics Malaysia. (2010a). Malaysia at a glance. Malaysia: Department
of Statistics.
Department of Statistics Malaysia. (2010b). Population distribution and basic
demographic characteristics Population and Housing Census of Malaysia.
Malaysia: Department of Statistics.
Department of Statistics Malaysia. (2012a). GDP and GNI current and constant prices
1980-2012 Economic Time Series, National Accounts. Malaysia: Department
of Statistics.
Department of Statistics Malaysia. (2012b). Vital Statistics Malaysia: Department of
Statistics.
Department of Statistics Malaysia. (2013a). Annual Gross Domestic Product, 2005-
2013, Macroeconomic key data. Malaysia: Department of Statistics.
Department of Statistics Malaysia. (2013b). GDP by state 2005-2013 National
Accounts. Malaysia: Department of Statistics.
Department of Statistics Malaysia. (2013c). Salaries and wages survey report 2013.
Malaysia: Department of Statistics.
DeRoeck, D., Bawazir, S. A., Carrasco, P., Kaddar, M., Brooks, A., Fitzsimmons, J., &
Andrus, J. (2006). Regional group purchasing of vaccines: review of the Pan
American Health Organization EPI revolving fund and the Gulf Cooperation
Council group purchasing program. The International journal of health
planning and management, 21(1), 23-43.
DerSimonian, R., & Laird, N. (1986). Meta-analysis in clinical trials. Controlled
clinical trials, 7(3), 177-188.
Diener, A., O'Brien, B., & Gafni, A. (1998). Health care contingent valuation studies: A
review and classification of the literature. Health economics, 7(4), 313-326.
Driessen, J., Olson, Z. D., Jamison, D. T., & Verguet, S. (2015). Comparing the health
and social protection effects of measles vaccination strategies in Ethiopia: An
extended cost-effectiveness analysis. Social Science & Medicine, 139, 115-
122.
Univers
ity of
Mala
ya
262
Driver, J. (2014, 22 September 2014). The history of utilitarianism. Winter 2014
edition. Retrieved 15 November 2015, from
http://plato.stanford.edu/entries/utilitarianism-history/
Drummond, M. F., Sculpher, M. J., Torrance, G. W., O'Brien, B. J., & Stoddart, G. L.
(2005). Methods for the economic evaluation of health care programmes (3rd
ed.). Oxford, United Kingdom: Oxford University Press
Duclos, P. (2010). National Immunization Technical Advisory Groups (NITAGs):
guidance for their establishment and strengthening. Vaccine, 28, A18-A25.
Dykstra, S., Glassman, A., Kenny, C., & Sandefur, J. (2015). The impact of Gavi on
vaccination rates: Regression discontinuity evidence. Center for Global
Development, Working Paper 394, 1-49.
Economic and Planning Unit. (2012). Household income and poverty: Mean monthly
gross household income by ethnicity, strata and state, Malaysia, 1970-2012.
Retrieved 2 February 2015, from Economic and Planning Unit, Prime
Minister's Department Malaysia http://www.epu.gov.my/en/household-
income-poverty
Edejer, T. T.-T. (2003). Making choices in health: WHO guide to cost effectiveness
analysis (Vol. 1). Geneva, Switzerland: World Health Organization.
Eichler, H.-G., Kong, S. X., Gerth, W. C., Mavros, P., & Jönsson, B. (2004). Use of
cost-effectiveness analysis in health-care resource allocation decision-making:
How are cost-effectiveness thresholds expected to emerge? Value in Health,
7(5), 518-528.
Erickson, L. J., De Wals, P., & Farand, L. (2005). An analytical framework for
immunization programs in Canada. Vaccine, 23(19), 2470-2476.
Ezat, S., & Aljunid, S. (2010). Comparative cost-effectiveness of HPV vaccines in the
prevention of cervical cancer in Malaysia. Asian Pacific Journal Cancer
Prevention, 11(4), 943-951.
Faudzi, A., Amal, N., Zainal, A., Lailanor, I., Sirajuddin, H., & Taha, M. (2011).
Improvement in Medically Certified Death: Results from a Pilot Study in the
State of Malacca, Malaysia. Medical Journal of Malaysia, 66(1), 33-35.
Feeny, D., Furlong, W., Boyle, M., & Torrance, G. W. (1995). Multi-attribute health
status classification systems. Pharmacoeconomics, 7(6), 490-502.
Univers
ity of
Mala
ya
263
Field, R. I., & Caplan, A. L. (2012). Evidence-based decision making for vaccines: The
need for an ethical foundation. Vaccine, 30(6), 1009-1013.
Fine, P. E. (1993). Herd immunity: History, theory, practice. Epidemiologic reviews,
15(2), 265-302.
Flem, E. T., Latipov, R., Nurmatov, Z. S., Xue, Y., Kasymbekova, K. T., & Rheingans,
R. D. (2009). Costs of diarrheal disease and the cost-effectiveness of a
rotavirus vaccination program in Kyrgyzstan. Journal of Infectious Diseases,
200(Supplement 1), S195-S202.
Flores, G., Krishnakumar, J., O'Donnell, O., & Van Doorslaer, E. (2008). Coping with
health‐care costs: Implications for the measurement of catastrophic
expenditures and poverty. Health economics, 17(12), 1393-1412.
Garattini, L., & van de Vooren, K. (2011). Budget impact analysis in economic
evaluation: A proposal for a clearer definition. The European Journal of
Health Economics, 12(6), 499-502.
Gavi. (2015). Gavi's Mission. Gavi, The Vaccine Alliance. Retrieved 2 December 2015,
from http://www.gavi.org/about/mission/
Gertler, P., & Gruber, J. (2002). Insuring consumption against illness. The American
economic review, 92(1), 51-70.
Glassman, A. L., Duran, D., & Sumner, A. (2011). Global Health and the New Bottom
Billion: What Do Shifts in Global Poverty and the Global Disease Burden
Mean for GAVI and the Global Fund? Center for Global Development,
Working Paper 270.
GlaxoSmithKline. (2014). Tiered pricing approach for vaccines. Global Public Policy
Position. Retrieved 17 January 2016, from
https://www.gsk.com/media/280905/tiered-pricing-for-vaccines-policy.pdf
Griebsch, I., Coast, J., & Brown, J. (2005). Quality-adjusted life-years lack quality in
pediatric care: A critical review of published cost-utility studies in child
health. Pediatrics, 115(5), e600-e614.
Grossman, M. (1972). On the concept of health capital and the demand for health. The
journal of political economy, 80(2), 223-255.
Hammitt, J. K., & Robinson, L. A. (2011). The income elasticity of the value per
statistical life: Transferring estimates between high and low income
populations. Journal of Benefit-Cost Analysis, 2(1), 1-29.
Univers
ity of
Mala
ya
264
Hauck, K., Smith, P. C., & Goddard, M. (2004). The economics of priority setting for
health care: A literature review Health, Nutrition and Population (HNP)
Discussion Paper. Washington DC: World Bank.
Henry, D. A., Hill, S. R., & Harris, A. (2005). Drug prices and value for money: The
Australian Pharmaceutical Benefits Scheme. Jama, 294(20), 2630-2632.
Houweling, H., Verweij, M., & Ruitenberg, E. J. (2010). Criteria for inclusion of
vaccinations in public programmes. Vaccine, 28(17), 2924-2931.
Hsu, V. P., Abdul Rahman, H. B., Wong, S. L., Ibrahim, L. H. J., Yusoff, A. F. H. J.,
Chan, L. G., . . . Bresee, J. (2005). Estimates of the burden of rotavirus disease
in Malaysia. The Journal Of Infectious Diseases, 192(Supplement 1), S80-
S86.
Hung, L., Wong, S., Chan, L., Rosli, R., Ng, A., & Bresee, J. (2006). Epidemiology and
strain characterization of rotavirus diarrhea in Malaysia. International journal
of infectious diseases, 10(6), 470-474.
Hutubessy, R., Henao, A. M., Namgyal, P., Moorthy, V., & Hombach, J. (2011).
Results from evaluations of models and cost-effectiveness tools to support
introduction decisions for new vaccines need critical appraisal. BMC medicine,
9(1), 55.
Imam, H., Phak, N., & Thomas, T. (2013). Paediatrics protocols for Malaysian
hospitals (3rd ed.). Malaysia: Ministry of Health.
ISPOR. (2015). Pharmacoeconomic guidelines around the world. Retrieved 1st
October 2015, from http://www.ispor.org/peguidelines/index.asp
Ito, H., Otabe, O., Katsumi, Y., Matsui, F., Kidowaki, S., Mibayashi, A., . . . Nakagomi,
O. (2011). The incidence and direct medical cost of hospitalization due to
rotavirus gastroenteritis in Kyoto, Japan, as estimated from a retrospective
hospital study. Vaccine, 29(44), 7807-7810.
Iwata, S., Nakata, S., Ukae, S., Koizumi, Y., Morita, Y., Kuroki, H., . . . Lawrence, J.
(2013). Efficacy and safety of pentavalent rotavirus vaccine in Japan: A
randomized, double-blind, placebo-controlled, multicenter trial. Human
vaccines & immunotherapeutics, 9(8), 1626-1633.
Jaafar, S., Noh, K. M., Muttalib, K. A., Othman, N., & Healy, J. (2013). Malaysia
Health System Review. In J. Healy (Ed.), Health Systems in Transition (Vol.
3). Geneva, Switzerland: World Health Organization (on behalf of Asia
Pacific Observatory on Health Systems and Policies).
Univers
ity of
Mala
ya

265
Jain, R., Grabner, M., & Onukwugha, E. (2011). Sensitivity analysis in cost-
effectiveness studies: From guidelines to practice. Pharmacoeconomics, 29(4),
297-314.
JAKIM. (2008). The ruling on using Biothrax and Rotateq vaccine that used pig sources
in its production process. e-FATWA. Portal Rasmi Fatwa Malaysia. Retrieved
12 December 2015, from http://www.e-fatwa.gov.my/fatwa-
kebangsaan/hukum-penggunaan-vaksin-biothrax-dan-vaksin-rotateq-yang-
menggunakan-unsur-babi-dal
Jiang, V., Jiang, B., Tate, J., Parashar, U. D., & Patel, M. M. (2010). Performance of
rotavirus vaccines in developed and developing countries. Human Vaccines,
6(7), 532-542.
Jiraphongsa, C., Bresee, J. S., Pongsuwanna, Y., Kluabwang, P., Poonawagul, U.,
Arporntip, P., . . . Intusoma, U. (2005). Epidemiology and burden of rotavirus
diarrhea in Thailand: Results of sentinel surveillance. Journal of Infectious
Diseases, 192(Supplement 1), S87-S93.
Jit, M., Bilcke, J., Mangen, M. J., Salo, H., Melliez, H., Edmunds, W. J., . . . Beutels, P.
(2009). The cost-effectiveness of rotavirus vaccination: Comparative analysis
for five European countries and transferability in Europe. Vaccine, 27(44),
6121-6128.
Jit, M., & Brisson, M. (2011). Modelling the epidemiology of infectious diseases for
decision analysis. Pharmacoeconomics, 29(5), 371-386.
Jit, M., & Edmunds, W. J. (2007). Evaluating rotavirus vaccination in England and
Wales: Part II. The potential cost-effectiveness of vaccination. Vaccine,
25(20), 3971-3979.
Jit, M., Hutubessy, R., Png, M. E., Sundaram, N., Audimulam, J., Salim, S., & Yoong,
J. (2015). The broader economic impact of vaccination: Reviewing and
appraising the strength of evidence. BMC medicine, 13(1), 209.
Jit, M., Yuzbashyan, R., Sahakyan, G., Avagyan, T., & Mosina, L. (2011). The cost-
effectiveness of rotavirus vaccination in Armenia. Vaccine, 29(48), 9104-
9111.
Kaddar, M., Schmitt, S., Makinen, M., & Milstien, J. (2013). Global support for new
vaccine implementation in middle-income countries. Vaccine, 31(S), B81-
B96.
Univers
ity of
Mala
ya

266
Kakwani, N., Wagstaff, A., & Van Doorslaer, E. (1997). Socioeconomic inequalities in
health: Measurement, computation, and statistical inference. Journal of
econometrics, 77(1), 87-103.
Kananatu, K. (2002). Healthcare financing in Malaysia. Asia-Pacific Journal of Public
Health, 14(1), 23-28.
Kannan Kutty, P., Pathmanathan, G., & Salleh, N. M. (2010). Analysis of factors in
response to rotavirus vaccination counselling in a private paediatric clinic.
Medical Journal of Malaysia, 65(2), 1-6.
Kawai, K., O’Brien, M. A., Goveia, M. G., Mast, T. C., & El Khoury, A. C. (2012).
Burden of rotavirus gastroenteritis and distribution of rotavirus strains in Asia:
A systematic review. Vaccine, 30(7), 1244-1254.
Kim, S.-Y., & Goldie, S. J. (2008). Cost-effectiveness analyses of vaccination
programmes. Pharmacoeconomics, 26(3), 191-215.
Kim, S.-Y., Goldie, S. J., & Salomon, J. A. (2009). Cost-effectiveness of Rotavirus
vaccination in Vietnam. BMC Public Health, 9(1), 29.
Kimman, T. G., Boot, H. J., Berbers, G. A. M., Vermeer-de Bondt, P. E., de Wit, G. A.,
& de Melker, H. E. (2006). Developing a vaccination evaluation model to
support evidence-based decision making on national immunization programs.
Vaccine, 24(22), 4769-4778.
Knapp, M. (1984). The economics of social care. London, United Kingdom: Macmillan
Kruk, M. E., Goldmann, E., & Galea, S. (2009). Borrowing and selling to pay for health
care in low-and middle-income countries. Health affairs, 28(4), 1056-1066.
Lee, W. S., Lim, B. T. Y., Chai, P. F., Kirkwood, C. D., & Lee, J. K. F. (2012).
Rotavirus genotypes in Malaysia and universal rotavirus vaccination. Human
vaccines & immunotherapeutics, 8(10), 1401-1406.
Lee, W. S., Poo, M. I., & Nagaraj, S. (2007). Estimates of economic burden of
providing inpatient care in childhood rotavirus gastroenteritis from Malaysia.
Journal Of Paediatrics And Child Health, 43(12), 818-825.
Levin, C. E., Sharma, M., Olson, Z., Verguet, S., Shi, J.-F., Wang, S.-M., . . . Kim, J. J.
(2015). An extended cost-effectiveness analysis of publicly financed HPV
vaccination to prevent cervical cancer in China. Vaccine, 33(24), 2830-2841.
Univers
ity of
Mala
ya
267
Lim, K. J. (1995). Costing of OPD services at main health clinics Kedah Darul Aman.
Malaysia: Ministry of Health.
Lim, Y. W., Shafie, A. A., Chua, G. N., & Hassali, M. A. A. (2014). Determination of
cost-effectiveness threshold For Malaysia. Value in Health, 7(17), A438.
Little, R. J. (1988). A test of missing completely at random for multivariate data with
missing values. Journal of the American Statistical Association, 83(404),
1198-1202.
Liu, L., Johnson, H. L., Cousens, S., Perin, J., Scott, S., Lawn, J. E., . . . Black, R. E.
(2012). Global, regional, and national causes of child mortality: An updated
systematic analysis for 2010 with time trends since 2000. The Lancet,
379(9832), 2151-2161.
Loganathan, T., Lee, W.-S., Lee, K.-F., Jit, M., & Ng, C.-W. (2015). Household
Catastrophic Healthcare Expenditure and Impoverishment Due to Rotavirus
Gastroenteritis Requiring Hospitalization in Malaysia. PLoS One, 10(5),
e0125878.
Lopman, B. A., Payne, D. C., Tate, J. E., Patel, M. M., Cortese, M. M., & Parashar, U.
D. (2012). Post-licensure experience with rotavirus vaccination in high and
middle income countries; 2006 to 2011. Current Opinion in Virology, 2(4),
434-442.
Lou, J.-T., Xu, X.-J., Wu, Y.-D., Tao, R., & Tong, M.-Q. (2011). Epidemiology and
burden of rotavirus infection among children in Hangzhou, China. Journal of
Clinical Virology, 50(1), 84-87.
Lu, C.-Y., Lauderdale, T.-L., Fang, Y.-H., Wang, C.-Y., Ho, Y.-H., Hung, C.-L., . . .
Huang, L.-M. (2006). Disease burden and related medical of rotavirus
infectioncosts s in Taiwan. BMC infectious diseases, 6(1), 1-8.
Madsen, L. B., Ustrup, M., Fischer, T. K., Bygbjerg, I. C., & Konradsen, F. (2012).
Reduced price on rotavirus vaccines: Enough to facilitate access where most
needed? Bulletin of the World Health Organization, 90(7), 554-556.
Marmot, M., Friel, S., Bell, R., Houweling, T. A., & Taylor, S. (2008). Closing the gap
in a generation: Health equity through action on the social determinants of
health. The Lancet, 372(9650), 1661-1669.
Marseille, E., Larson, B., Kazi, D. S., Kahn, J. G., & Rosen, S. (2015). Thresholds for
the cost–effectiveness of interventions: alternative approaches. Bulletin of the
World Health Organization, 93(2), 118-124.
Univers
ity of
Mala
ya
268
Martin, A., Batty, A., Roberts, J. A., & Standaert, B. (2009). Cost-effectiveness of
infant vaccination with RIX4414 (Rotarix™) in the UK. Vaccine, 27(33),
4520-4528.
Martin, A., Cottrell, S., & Standaert, B. (2008). Estimating utility scores in young
children with acute rotavirus gastroenteritis in the UK. Journal of Medical
Economics, 11(3), 471-484.
Mason, H., Baker, R., & Donaldson, C. (2008). Willingness to pay for a QALY: Past,
present and future. Expert Review of Pharmacoeconomics & Outcomes
Research, 8(6), 575-582.
Mast, T. C., Chen, P.-Y., Lu, K.-C., Hsu, C.-M., Lin, H. C., Liao, W.-C., . . . Lac, C.
(2010). Epidemiology and economic burden of rotavirus gastroenteritis in
hospitals and paediatric clinics in Taiwan, 2005–2006. Vaccine, 28(17), 3008-
3013.
McGuire, A., Henderson, J., & Mooney, G. (1988). The economics of health care: An
introductory text. London, United Kingdom and New York, NY: Routledge &
Kegan Paul.
McIntyre, D., Thiede, M., Dahlgren, G., & Whitehead, M. (2006). What are the
economic consequences for households of illness and of paying for health care
in low-and middle-income country contexts? Social Science & Medicine,
62(4), 858-865.
Medecins Sans Frontieres. (2015). The right shot: Bringing down barriers to affordable
and adapted vaccines Access Campaign (2nd ed.): Medecins Sans Frontieres.
Meloni, A., Locci, D., Frau, G., Masia, G., Nurchi, A. M., & Coppola, R. C. (2011).
Epidemiology and prevention of rotavirus infection: An underestimated issue?
Journal of Maternal-Fetal and Neonatal Medicine, 24(S2), 48-51.
Milstien, J. B., Batson, A., & Wertheimer, A. I. (2005). Vaccines and drugs:
Characteristics of their use to meet public health goals Health, Nutrition and
Population (HNP) Discussion Paper: World Bank.
Ministry of Finance Malaysia. (2015). Annual Budget 2016: Federal Government
Budget Information Retrieved 28th October 2015, from Ministry of Finance
http://www.treasury.gov.my/pdf/bajet/maklumat_bajet_kerajaan/2016/b42_1.p
df
Ministry of Finance Malaysia. (2016). Special Address by the Prime Minister: 2016
Budget Recalibration [Press release]. Retrieved from
http://www.treasury.gov.my/pdf/ucapan/2016/Budget2016_Recalibration.pdf
Univers
ity of
Mala
ya
269
Ministry of Health Malaysia. (1996). Recent illness/injury, health seeking behaviour
and out-of-pocket health care expenditure The National Health and Morbidity
Survey 1996 (Vol. 3). Malaysia: Institute of Public Health, Ministry of Health.
Ministry of Health Malaysia. (2004). Childhood immunisation Clinical Practice
Guidelines. Malaysia: Ministry of Health and Academy of Medicine.
Ministry of Health Malaysia. (2006). Load of illness: Acute diarrhoeal illness The
National Health and Morbidity Survey 2006. Malaysia: Institute for Public
Health, Ministry of Health.
Ministry of Health Malaysia. (2008). Towards achieving better health through
consolidation of services Ministry of Health, Malaysia Strategic Plan 2006 –
2010. Malaysia: Ministry of Health.
Ministry of Health Malaysia. (2010). Country health plan 10th Malaysia Plan 2011 -
2015. 1 Care for 1 Malaysia. Malaysia: Ministry of Health.
Ministry of Health Malaysia. (2011a). Cervical cancer vaccine: Gardasil® and
Cervarix® Malaysia: Health Technology Assessment Section, Ministry of
Health.
Ministry of Health Malaysia. (2011b). The National Health and Morbidity Survey 2011
Methodology and General Findings (Vol. 1). Malaysia: Institute for Public
Health, Ministry of Health.
Ministry of Health Malaysia. (2012a). Annual Report 2012. Malaysia: Ministry of
Health.
Ministry of Health Malaysia. (2012b). Health Facts 2012. Malaysia: Center for Health
Informatics, Ministry of Health.
Ministry of Health Malaysia. (2012c). National Health Expenditure Report, 1997-2012.
Malaysia: Malaysian National Health Accounts Unit, Ministry of Health.
Ministry of Health Malaysia. (2012d). Outpatient attendences. HIMS Medical Care
Sub-System PER-PL206. Center for Health Informatics, Ministry of Health.
Malaysia.
Ministry of Health Malaysia. (2012e). Pharmacoeconomic guideline for Malaysia.
Malaysia: Pharmaceutical Services Division, Ministry of Health.
Univers
ity of
Mala
ya

270
Ministry of Health Malaysia. (2013). Guideline for Stillbirth and Under-five Mortality
Reporting System. Malaysia: National Stillbirth and Under Five Mortality
Technical Committee, Ministry of Health.
Ministry of Health Malaysia. (2014a). Consumer Retail Price Retrieved 2 April 2015,
from Pharmaceuticals Services Division, Ministry of Health, Malaysia
http://www.pharmacy.gov.my/v2/ms/apps/drug-price
Ministry of Health Malaysia. (2014b). Health Facts 2014. Malaysia: Center for Health
Informatics, Ministry of Health.
Ministry of Health Malaysia. (2015). List of government hospitals. Retrieved
September 2015, from
http://www.moh.gov.my/english.php/database_stores/store_view/3
Ministry of Health Malaysia. (2016). Routine immunisation schedule Malaysia.
Retrieved 2 January 2016, from Portal Rasmi MyHealth, Ministry of Health,
Malaysia http://www.myhealth.gov.my/?p=28
Moreno-Serra, R., Millett, C., & Smith, P. C. (2011). Towards improved measurement
of financial protection in health. PLoS Medicine, 8(9), 1166.
Murphy, T. V., Smith, P. J., Gargiullo, P. M., & Schwartz, B. (2003). The first rotavirus
vaccine and intussusception: Epidemiological studies and policy decisions.
Journal of Infectious Diseases, 187(8), 1309-1313.
Murray, C. J., & Frenk, J. (2000). A framework for assessing the performance of health
systems. Bulletin of the World Health Organization, 78(6), 717-731.
Musa, M. N., Ismail, S. A., & Chan, L. J. (Eds.). (2015). Immunisation controversies:
What you really need to know. Malaysia: Islamic Medical Association of
Malaysia (IMAM), Islamic Medical Association & Network of Indonesia
(IMANI).
Musgrove, P. (1999). Public spending on health care: how are different criteria related?
Health Policy, 47(3), 207-223.
Nakagomi, T., Nakagomi, O., Takahashi, Y., Enoki, M., Suzuki, T., & Kilgore, P. E.
(2005). Incidence and burden of rotavirus gastroenteritis in Japan, as estimated
from a prospective sentinel hospital study. Journal of Infectious Diseases, 192
(Supplement 1), S106-S110.
Univers
ity of
Mala
ya

271
Narayan-Parker, D., & Patel, R. (2000). Voices of the poor: Can anyone hear us? (Vol.
1). Washington DC and New York, NY, USA: Oxford University Press for the
World Bank
Nelson, E. A. S., de Quadros, C. A., Santosham, M., Parashar, U. D., & Steele, A. D.
(2013). Overcoming perceptions of financial barriers to rotavirus vaccine
introduction in Asia. Human vaccines & immunotherapeutics, 9(11), 2418-
2426.
Nelson, E. A. S., Tam, J. S., Bresee, J. S., Poon, K.-H., Ng, C.-H., Ip, K.-S., . . . Glass,
R. I. (2005). Estimates of rotavirus disease burden in Hong Kong: Hospital-
based surveillance. Journal of Infectious Diseases, 192(Supplement 1), S71-
S79.
Newall, A. T., Beutels, P., Macartney, K., Wood, J., & MacIntyre, C. R. (2007). The
cost-effectiveness of rotavirus vaccination in Australia. Vaccine, 25(52), 8851-
8860.
Newall, A. T., Jit, M., & Hutubessy, R. (2014). Are current cost-effectiveness
thresholds for low-and middle-income countries useful? Examples from the
world of vaccines. Pharmacoeconomics, 32(6), 525-531.
Neyeloff, J. L., Fuchs, S. C., & Moreira, L. B. (2012). Meta-analyses and forest plots
using a microsoft excel spreadsheet: step-by-step guide focusing on
descriptive data analysis. BMC research notes, 5(1), 52.
Nishtar, S. (2010). The mixed health systems syndrome. Bulletin of the World Health
Organization, 88(1), 66-73.
Noor Ghani, S., & Yadav, H. (2008). Health Care in Malaysia. Kuala Lumpur,
Malaysia: University of Malaya Press.
Nordin, M. M. (2014). The permissibility of using rotavirus vaccines - a personal
perspective. Bulletin of the Malaysian Paediatric Association. Retrieved 12
December 2015, from http://mpaweb.org.my/article.php?aid=684
NRC. (2015). NITAG Resource Center: Malaysia. Retrieved 10 December 2015, from
SIVAC Initiative http://www.nitag-resource.org/country/131-malaysia
O'Donnell, O. A., & Wagstaff, A. (2008). Analyzing health equity using household
survey data: A guide to techniques and their implementation. Washington DC:
The World Bank
Univers
ity of
Mala
ya

272
PAHO. (2013). Vaccine prices for year 2013. Expanded Programme for Immunization.
Retrieved 6th April 2015, from
http://www.paho.org/hq/index.php?option=com_content&view=article&id=18
64&Itemid=2234&lang=en
PAHO. (2015a). Key Facts about PAHO. Retrieved 5th December 2015, from
http://www.paho.org/hq/index.php?option=com_content&view=article&id=92
&Itemid=40697&lang=en
PAHO. (2015b). PAHO's Revolving Fund for Vaccine Procurement. Immunization
Toolkit: Resources for Expanded Program on Immunization (EPI). Retrieved
24 September 2015, from http://www.paho.org/immunization/toolkit/vaccine-
procurement-fund.html
Palmer, S., & Raftery, J. (1999). Economics notes: Opportunity cost. British Medical
Journal, 318(7197), 1551.
Palmer, S., & Torgerson, D. J. (1999). Economic notes: Definitions of efficiency.
British Medical Journal, 318(7191), 1136.
Parashar, U. D., Burton, A., Lanata, C., Boschi-Pinto, C., Shibuya, K., Steele, D., . . .
Glass, R. I. (2009). Global mortality associated with rotavirus disease among
children in 2004. Journal of Infectious Diseases, 200(Supplement 1), S9-S15.
Parashar, U. D., Hummelman, E. G., Bresee, J. S., Miller, M. A., & Glass, R. I. (2003).
Global illness and deaths caused by rotavirus disease in children. Emerging
infectious diseases, 9(5), 565-572.
Patel, M. M., Glass, R., Desai, R., Tate, J. E., & Parashar, U. D. (2012). Fulfilling the
promise of rotavirus vaccines: How far have we come since licensure? The
Lancet Infectious Diseases, 12(7), 561-570.
Patel, M. M., López-Collada, V. R., Bulhões, M. M., De Oliveira, L. H., Márquez, A.
B., Flannery, B., . . . Parashar, U. D. (2011). Intussusception risk and health
benefits of rotavirus vaccination in Mexico and Brazil. New England Journal
of Medicine, 364(24), 2283-2292.
Patel, M. M., Steele, D., Gentsch, J. R., Wecker, J., Glass, R. I., & Parashar, U. D.
(2011). Real-world impact of rotavirus vaccination. The Pediatric infectious
disease journal, 30(1), S1-S5.
PATH. (2015). Investing in vaccines for the developing world Vaccine Development
Fact Sheet. Washington DC: PATH.
Univers
ity of
Mala
ya

273
PATH. (2016). Country introductions of rotavirus vaccine. Retrieved 7 January 2016
from PATH http://sites.path.org/rotavirusvaccine/country-introduction-maps-
and-spreadsheet/
Pereira, J. (1993). What does equity in health mean? Journal of Social Policy, 22(1),
19-48.
Persad, G., Wertheimer, A., & Emanuel, E. J. (2009). Principles for allocation of scarce
medical interventions. The Lancet, 373(9661), 423-431.
Phua, K. B., Lim, F. S., Lau, Y. L., Nelson, E. A., Huang, L. M., Quak, S. H., . . . Bock,
H. L. (2009). Safety and efficacy of human rotavirus vaccine during the first 2
years of life in Asian infants: Randomised, double-blind, controlled study.
Vaccine, 27(43), 5936-5941.
Piso, B., & Wild, C. (2009). Decision support in vaccination policies. Vaccine, 27(43),
5923-5928.
Pollard, S. L., Malpica-Llanos, T., Friberg, I. K., Fischer-Walker, C., Ashraf, S., &
Walker, N. (2015). Estimating the herd immunity effect of rotavirus vaccine.
Vaccine, 33(32), 3795-3800.
Postma, M. J., Jit, M., Rozenbaum, M. H., Standaert, B., Tu, H.-A., & Hutubessy, R. C.
(2011). Comparative review of three cost-effectiveness models for rotavirus
vaccines in national immunization programs; a generic approach applied to
various regions in the world. BMC medicine, 9(1), 84.
Pradhan, M., & Prescott, N. (2002). Social risk management options for medical care in
Indonesia. Health economics, 11(5), 431-446.
Raftery, J. (1998). Economics notes: Economic evaluation: an introduction. British
Medical Journal, 316(7136), 1013.
Ranson, M. K. (2002). Reduction of catastrophic health care expenditures by a
community-based health insurance scheme in Gujarat, India: Current
experiences and challenges. Bulletin of the World Health Organization, 80(8),
613-621.
Rappuoli, R. (2015). What are affordable vaccines? The Lancet, 385(9974), 1177-1178.
Ravallion, M. (2010). Poverty lines across the world World Bank Policy Research
Working Paper Series. Washington DC: World Bank.
Univers
ity of
Mala
ya

274
Ravallion, M., Datt, G., & Walle, D. (1991). Quantifying absolute poverty in the
developing world. Review of Income and Wealth, 37(4), 345-361.
Revill, P., Walker, S., Madan, J., Ciaranello, A., Mwase, T., Gibb, D. M., . . . Sculpher,
M. J. (2014). Using cost-effectiveness thresholds to determine value for
money in low-and middle-income country healthcare systems: Are current
international norms fit for purpose? Centre for Health Economics Research
Paper York, UK: University of York.
Rheingans, R., Atherly, D., & Anderson, J. (2012). Distributional impact of rotavirus
vaccination in 25 GAVI countries: estimating disparities in benefits and cost-
effectiveness. Vaccine, 30, A15-A23.
Rheingans, R. D., Antil, L., Dreibelbis, R., Podewils, L. J., Bresee, J. S., & Parashar, U.
D. (2009). Economic costs of rotavirus gastroenteritis and cost-effectiveness
of vaccination in developing countries. Journal of Infectious Diseases,
200(Supplement 1), S16-S27.
Robberstad, B. (2005). QALYs vs DALYs vs LYs gained: What are the differences,
and what difference do they make for health care priority setting? Norsk
epidemiologi, 15(2), 183-191.
Robinson, R. (1993). Cost-utility analysis. British Medical Journal, 307(6908), 859-
862.
Roesel, S., & Banerjee, K. (2008). School immunization programme in Malaysia:
World Health Organization.
Ruiz-Palacios, G. M., Pérez-Schael, I., Velázquez, F. R., Abate, H., Breuer, T.,
Clemens, S. C., . . . O'Ryan, M. (2006). Safety and efficacy of an attenuated
vaccine against severe rotavirus gastroenteritis. New England Journal of
Medicine, 354(1), 11-22.
Russell, L. B. (1992). Opportunity costs in modern medicine. Health affairs, 11(2), 162-
169.
Russell, S. (1996). Ability to pay for health care: Concepts and evidence. Health policy
and planning, 11(3), 219-237.
Russell, S. (2004). The economic burden of illness for households in developing
countries: A review of studies focusing on malaria, tuberculosis, and human
immunodeficiency virus/acquired immunodeficiency syndrome. The American
journal of tropical medicine and hygiene, 71(Supplement 2), 147-155.
Univers
ity of
Mala
ya

275
Ryan, M., Scott, D., Reeves, C., Bate, A., Van Teijlingen, E., Russell, E., . . . Robb, C.
(2001). Eliciting public preferences for healthcare: A systematic review of
techniques. Health Technology Assessment, 5(5), 1-186.
Ryen, L., & Svensson, M. (2014). The willingness to pay for a quality adjusted life
year: A review of the empirical literature. Health economics, 24(10), 1289-
1301.
Sabrina, A. R. (2006). Unit cost of patient care in district hospitals, Ministry of Health,
Malaysia. (Masters in Public Health), University of Malaya, Malaysia.
Saksena, P., Hsu, J., & Evans, D. (2014). Financial risk protection and universal health
coverage: Evidence and measurement challenges. PLoS Medicine, 11(9),
e1001701.
Sato, T., Nakagomi, T., & Nakagomi, O. (2011). Cost-effectiveness analysis of a
universal rotavirus immunization program in Japan. Japan Journal of
Infectious Disease, 64(4), 277-283.
Savedoff, W. D., & Smith, A. L. (2011). Achieving universal health coverage: Learning
from Chile, Japan, Malaysia and Sweden. Washington, DC: Results for
Development Institute (R4D).
Schlomer, G. L., Bauman, S., & Card, N. A. (2010). Best practices for missing data
management in counseling psychology. Journal of Counseling Psychology,
57(1), 1-10.
Schultz, T. W. (1961). Investment in human capital. The American economic review,
51(1), 1-17.
Sénécal, M., Brisson, M., Lebel, M. H., Yaremko, J., Wong, R., Gallant, L. A., . . .
James, A. M. (2008). Measuring the impact of rotavirus acute gastroenteritis
episodes (MIRAGE): A prospective community-based study. The Canadian
Journal of Infectious Diseases & Medical Microbiology, 19(6), 397-404.
Seybolt, L. M., & Bégué, R. (2012). Rotavirus vaccination and herd immunity: An
evidence-based review. Pediatric Health Medical Therapeutics, 3, 25-37.
Shafie, A. A., Lim, Y. W., Chua, G. N., & Hassali, M. A. A. (2014). Exploring the
willingness to pay for a quality-adjusted life-year in the state of Penang,
Malaysia. ClinicoEconomics and Outcomes Research, 6, 473-481.
Shepard, D., Lees, R., Ng, C. W., Undurraga, E. A., Halasa, Y. A., & Lum, L. (2011).
Burden of dengue in Malaysia: Report from a collaboration between
Univers
ity of
Mala
ya

276
universities and the Ministry of Health of Malaysia. Malaysia: Schneider
Institutes for Health Policy, Brandeis University, & University of Malaya.
Shepard, D. S., Hodgkin, D., & Anthony, Y. E. (2000). Analysis of hospital costs: A
manual for managers. Geneva, Switzerland: World Health Organization
Shepard, D. S., Undurraga, E. A., Lees, R. S., Halasa, Y., Lum, L. C. S., & Ng, C. W.
(2012). Use of multiple data sources to estimate the economic cost of dengue
illness in Malaysia. The American journal of tropical medicine and hygiene,
87(5), 796-805.
Shillcutt, M. S. D., Walker, D. G., Goodman, C. A., & Mills, A. J. (2009). Cost
effectiveness in low-and middle-income countries. Pharmacoeconomics,
27(11), 903-917.
Shiroiwa, T., Sung, Y.-K., Fukuda, T., Lang, H.-C., Bae, S.-C., & Tsutani, K. (2010).
International survey on willingness-to-pay (WTP) for one additional QALY
gained: What is the threshold of cost effectiveness? Health economics, 19(4),
422-437.
Shui, I. M., Baggs, J., Patel, M., Parashar, U. D., Rett, M., Belongia, E. A., . . .
Weintraub, E. (2012). Risk of intussusception following administration of a
pentavalent rotavirus vaccine in US infants. Jama, 307(6), 598-604.
Siebert, U. (2003). When should decision-analytic modeling be used in the economic
evaluation of health care? The European Journal of Health Economics, 4(3),
143-150.
Singer, C., Stancu, P., Cosoveanu, S., Osiac, L., Grigorie, C., & Botu, A. (2010).
Diarrhea with rotavirus in children. Current Health Sciences Journal, 36(4).
Singer, M. E. (2009). Developing nations special issue. Pharmacoeconomics, 27(11),
887-889.
Slothuus, U. (2000). Economic evaluation: Theory, methods & application (Vol. 5).
Denmark: Faculty of Social Sciences, University of Southern Denmark.
Smith, P. C. (2005). User charges and priority setting in health care: Balancing equity
and efficiency. Journal of health economics, 24(5), 1018-1029.
Smith, P. C. (2013). Incorporating financial protection into decision rules for publicly
financed healthcare treatments. Health economics, 22(2), 180-193.
Univers
ity of
Mala
ya

277
Smith, R. D., & Richardson, J. (2005). Can we estimate the ‘social’value of a QALY?:
Four core issues to resolve. Health Policy, 74(1), 77-84.
Soares-Weiser, K., Maclehose, H., Ben-Aharon, I., Goldberg, E., Pitan, F., & Cunliffe,
N. (2011). Vaccines for preventing rotavirus diarrhoea: Vaccines in use.
Evidence-based Child Health: A Cochrane Review Journal, 6, 567-754.
Soares‐Weiser, K., MacLehose, H., Bergman, H., Ben‐Aharon, I., Nagpal, S., Goldberg,
E., . . . Cunliffe, N. (2012). Vaccines for preventing rotavirus diarrhoea:
Vaccines in use. The Cochrane Database Systematic Reviews(11).
Somkotra, T., & Lagrada, L. P. (2009). Which households are at risk of catastrophic
health spending: Experience in Thailand after universal coverage. Health
affairs, 28(3), w467-w478.
Strategic Advisory Group of Experts. (2009). Meeting of the immunization Strategic
Advisory Group of Experts April 2009, conclusions and recommendations.
Weekly Epidemiological Record, 84(23), 220-236.
Suaya, J. A., Shepard, D. S., Siqueira, J. B., Martelli, C. T., Lum, L. C., Tan, L. H., . . .
Halstead, S. B. (2009). Cost of dengue cases in eight countries in the Americas
and Asia: A prospective study. The American journal of tropical medicine and
hygiene, 80(5), 846-855.
Suleiman, A. B., Lye, M. S., Yon, R., Teoh, S. C., & Alias, M. (1998). Impact of the
East Asian economic crisis on health and health care: Malaysia's response.
Asia-Pacific Journal of Public Health, 10(1), 5-9.
Szucs, T. D. (2005). Health economic research on vaccinations and immunisation
practices—An introductory primer. Vaccine, 23(17), 2095-2103.
Takala, A. K., Koskenniemi, E., Joensuu, J., Mäkelä, M., & Vesikari, T. (1998).
Economic evaluation of rotavirus vaccinations in Finland: Randomized,
double-blind, placebo-controlled trial of tetravalent rhesus rotavirus vaccine.
Clinical infectious diseases, 27(2), 272-282.
Tantivess, S., Teerawattananon, Y., & Mills, A. (2009). Strengthening cost-
effectiveness analysis in Thailand through the establishment of the health
intervention and technology assessment program. Pharmacoeconomics,
27(11), 931-945.
Tate, J. E., Burton, A. H., Boschi-Pinto, C., Steele, A. D., Duque, J., & Parashar, U. D.
(2012). 2008 estimate of worldwide rotavirus-associated mortality in children
younger than 5 years before the introduction of universal rotavirus vaccination
Univers
ity of
Mala
ya

278
programmes: a systematic review and meta-analysis. The Lancet Infectious
Diseases, 12(2), 136-141.
Tate, J. E., Chitambar, S., Esposito, D. H., Sarkar, R., Gladstone, B., Ramani, S., . . .
Kang, G. (2009). Disease and economic burden of rotavirus diarrhoea in India.
Vaccine, 27 (Supplement 5), F18-F24.
Tate, J. E., Mutuc, J. D., Panozzo, C. A., Payne, D. C., Cortese, M. M., Cortes, J. E., . . .
Parashar, U. D. (2011). Sustained decline in rotavirus detections in the United
States following the introduction of rotavirus vaccine in 2006. The Pediatric
infectious disease journal, 30(1), S30-S34.
Tate, J. E., Rheingans, R. D., O’Reilly, C. E., Obonyo, B., Burton, D. C., Tornheim, J.
A., . . . Widdowson, M. A. (2009). Rotavirus disease burden and impact and
cost-effectiveness of a rotavirus vaccination program in Kenya. Journal of
Infectious Diseases, 200(Supplement 1), S76-S84.
Teerawattananon, Y., Tritasavit, N., Suchonwanich, N., & Kingkaew, P. (2014). The
use of economic evaluation for guiding the pharmaceutical reimbursement list
in Thailand. Zeitschrift für Evidenz, Fortbildung und Qualität im
Gesundheitswesen, 108(7), 397-404.
Tilson, L., Jit, M., Schmitz, S., Walsh, C., Garvey, P., McKeown, P., & Barry, M.
(2011). Cost-effectiveness of universal rotavirus vaccination in reducing
rotavirus gastroenteritis in Ireland. Vaccine, 29(43), 7463-7473.
Torrance, G. W., Feeny, D. H., Furlong, W. J., Barr, R. D., Zhang, Y., & Wang, Q.
(1996). Multiattribute utility function for a comprehensive health status
classification system: Health Utilities Index Mark 2. Medical care, 34(7), 702-
722.
Trueman, P., Drummond, M., & Hutton, J. (2001). Developing guidance for budget
impact analysis. Pharmacoeconomics, 19(6), 609-621.
Tu, H. A., Woerdenbag, H. J., Kane, S., Rozenbaum, M. H., Li, S. C., & Postma, M. J.
(2011). Economic evaluations of rotavirus immunization for developing
countries: A review of the literature. Expert review of vaccines, 10(7), 1037-
1051.
Tucker, A. W., Haddix, A. C., Bresee, J. S., Holman, R. C., Parashar, U. D., & Glass, R.
I. (1998). Cost-effectiveness analysis of a rotavirus immunization program for
the United States. Jama, 279(17), 1371-1376.
Ultsch, B., Damm, O., Beutels, P., Bilcke, J., Brüggenjürgen, B., Gerber-Grote, A., . . .
Wichmann, O. (2015). Methods for health economic valuation of vaccines and
Univers
ity of
Mala
ya

279
immunization decision frameworks: A consensus framework from a European
vaccine economics community. Pharmacoeconomics, 34(3), 227-244.
United Nations. (2012). Sixty-seventh session of the United Nation's General Assembly.
Agenda item 123. Global health and foreign policy. Document No. A /67/L.36
New York, NY: United Nations.
United Nations. (2013). World Population Prospects: The 2012 Revision, DVD Edition.
Retrieved 8 February 2015, from United Nations, Department of Economic
and Social Affairs, Population Division
http://databank.worldbank.org/data/views/reports/tableview.aspx
United Nations. (2015). Transforming our World: The 2030 Agenda for Sustainable
Development. Document No. A/RES/70/1. New York, NY: Division for
Sustainable Development, Department of Economics and Social Affairs,
United Nations.
United Nations Children’s Fund. (2005). UNICEF water, sanitation and hygiene
strategies for 2006 - 2015. New York, NY: Economic and Social Council,
United Nations.
United Nations Development Programme. (2007). Malaysia measuring and monitoring
poverty and inequality. Kuala Lumpur, Malaysia: United Nations
Development Programme.
United Nations Development Programme. (2015). Human Development Report 2015:
Human Development Index and its components. Retrieved 6th January 2016,
from United Nations Development Programme
http://hdr.undp.org/en/composite/HDI
Van Doorslaer, E., O'Donnell, O., Rannan-Eliya, R. P., Somanathan, A., Adhikari, S.
R., Garg, C. C., . . . Zhao, Y. (2006). Effect of payments for health care on
poverty estimates in 11 countries in Asia: An analysis of household survey
data. The Lancet, 368(9544), 1357-1364.
Van Doorslaer, E., O'Donnell, O., Rannan‐Eliya, R. P., Somanathan, A., Adhikari, S.
R., Garg, C. C., . . . Y., Z. (2007). Catastrophic payments for health care in
Asia. Health economics, 16(11), 1159-1184.
van Hoek, A. J., Ngama, M., Ismail, A., Chuma, J., Cheburet, S., Mutonga, D., . . .
Nokes, D. J. (2012). A cost effectiveness and capacity analysis for the
introduction of universal rotavirus vaccination in Kenya: Comparison between
Rotarix and RotaTeq vaccines. PLoS One, 7(10), E47511.
Univers
ity of
Mala
ya

280
Velázquez, F. R. (2009). Protective effects of natural rotavirus infection. The Pediatric
infectious disease journal, 28(3), S54-S56.
Velázquez, F. R., Matson, D. O., Calva, J. J., Guerrero, M. L., Morrow, A. L., Carter-
Campbell, S., . . . Ruiz-Palacios, G. M. (1996). Rotavirus infection in infants
as protection against subsequent infections. New England Journal of Medicine,
335(14), 1022-1028.
Verguet, S., Gauvreau, C. L., Mishra, S., MacLennan, M., Murphy, S. M., Brouwer, E.
D., . . . Jamison, D. T. (2015). The consequences of tobacco tax on household
health and finances in rich and poor smokers in China: An extended cost-
effectiveness analysis. The Lancet Global Health, 3(4), e206-e216.
Verguet, S., Laxminarayan, R., & Jamison, D. T. (2015). Universal public finance of
tuberculosis treatment in India: An extended cost-effectiveness analysis.
Health economics, 24(3), 318-332.
Verguet, S., Murphy, S., Anderson, B., Johansson, K. A., Glass, R., & Rheingans, R.
(2013). Public finance of rotavirus vaccination in India and Ethiopia: An
extended cost-effectiveness analysis. Vaccine, 31(42), 4902-4910.
Verguet, S., Olson, Z. D., Babigumira, J. B., Desalegn, D., Johansson, K. A., Kruk, M.
E., . . . Jamison, D. T. (2015). Health gains and financial risk protection
afforded by public financing of selected interventions in Ethiopia: An
extended cost-effectiveness analysis. The Lancet Global Health, 3(5), e288-
e296.
Vesikari, T., Itzler, R., Karvonen, A., Korhonen, T., Van Damme, P., Behre, U., . . .
Goveiab, M. G. (2009). RotaTeq®, a pentavalent rotavirus vaccine: efficacy
and safety among infants in Europe. Vaccine, 28(2), 345-351.
Vesikari, T., Itzler, R., Matson, D. O., Santosham, M., Christie, C. D. C., Coia, M., . . .
Heaton, P. (2007). Efficacy of a pentavalent rotavirus vaccine in reducing
rotavirus-associated health care utilization across three regions (11 countries).
International journal of infectious diseases, 11(Supplement 2), S29-S35.
Vesikari, T., Karvonen, A., Prymula, R., Schuster, V., Tejedor, J. C., Cohen, R., . . .
Bouckenooghe, A. (2007). Efficacy of human rotavirus vaccine against
rotavirus gastroenteritis during the first 2 years of life in European infants:
Randomised, double-blind controlled study. The Lancet, 370(9601), 1757-
1763.
Vesikari, T., Matson, D. O., Dennehy, P., Van Damme, P., Santosham, M., Rodriguez,
Z., . . . Heaton, P. M. (2006). Safety and efficacy of a pentavalent human–
bovine (WC3) reassortant rotavirus vaccine. New England Journal of
Medicine, 354(1), 23-33.
Univers
ity of
Mala
ya

281
Viscusi, W. K., & Aldy, J. E. (2003). The value of a statistical life: a critical review of
market estimates throughout the world. Journal of risk and uncertainty, 27(1),
5-76.
Wagstaff, A. (2008). Measuring financial protection in health Policy Research Working
Paper 4554. Washington DC: World Bank.
Wagstaff, A., Paci, P., & van Doorslaer, E. (1991). On the measurement of inequalities
in health. Social Science in Medicine, 33(5), 545-557.
Wagstaff, A., & Van Doorslaer, E. (2003). Catastrophe and impoverishment in paying
for health care: with applications to Vietnam 1993–1998. Health economics,
12(11), 921-933.
Walker, D. G., Hutubessy, R., & Beutels, P. (2010). WHO Guide for standardisation of
economic evaluations of immunization programmes. Vaccine, 28(11), 2356-
2359.
Ward, R. L., Jiang, X., Farkas, T., & Bass, D. M. (2006). Virology of the
Gastrointestinal Tract. In S. K. Tyring (Ed.), Mucosal Immunology and
Virology (pp. 55-98). London, United Kingdom: Springer
Weycker, D., Sofrygin, O., Kemner, J. E., Pelton, S. I., & Oster, G. (2009). Cost of
routine immunization of young children against rotavirus infection with
Rotarix versus RotaTeq. Vaccine, 27(36), 4930-4937.
Whitehead, M. (1992). The concepts and principles of equity and health. International
journal of health services, 22(3), 429-445.
Woods, B., Revill, P., Sculpher, M., & Claxton, K. (2015). Country-level cost-
effectiveness thresholds: Initial estimates and the need for further research
Centre for Health Economics Research Paper, CHERP 109. York, UK:
University of York.
World Bank. (1993). World Development Report 1993: Investing in health. New York,
NY: Oxford University Press.
World Bank. (2014a). World Development Indicators. Retrieved 14 May 2014, from
the World Bank
http://databank.worldbank.org/data/views/variableselection/selectvariables.asp
x?source=world-development-indicators#c_m
Univers
ity of
Mala
ya

282
World Bank. (2014b). World Development Indicators, Data by Country, Malaysia.
Retrieved 18th September 2014, from the World Bank
http://data.worldbank.org/country/malaysia
World Bank. (2015a). Beyond economic growth student book: Glossary. Retrieved 12
October 2015, from
http://www.worldbank.org/depweb/english/beyond/global/glossary.html
World Bank. (2015b). Global poverty line update. FAQs. Retrieved 19 November
2015, from http://www.worldbank.org/en/topic/poverty/brief/global-poverty-
line-faq
World Health Organization. (1946). Preamble to the Constitution of the World Health
Organization International Health Conference. New York, NY: World Health
Organization.
World Health Organization. (1981). Global Strategy for Health for All by the Year 2000
Health for All Geneva, Switzerland: World Health Organization.
World Health Organization. (2000). The World Health Report 2000: Health Systems:
Improving Performance. Geneva, Switzerland: World Health Organization.
World Health Organization. (2001). Macroeconomics and health: Investing in health for
economic development Report of the Commission on Macroeconomics and
Health. Geneva, Switzerland: World Health Organization.
World Health Organization. (2002a). Generic protocol for (i) hospital-based
surveillance to estimate the burden of rotavirus gastroenteritis in children and
(ii) a community-based survey on utilization of health care services for
gastroenteritis in children. Field test version. Geneva, Switzerland:
Department of Vaccines and Biologicals, World Health Organization.
World Health Organization. (2002b). The World Health Report 2002: Reducing risks,
promoting healthy life. Geneva, Switzerland: World Health Organization.
World Health Organization. (2005a). Resolution WHA58.33. Sustainable health
financing, universal coverage and social health insurance. Geneva,
Switzerland: Fifty-eighth World Health Assembly.
World Health Organization. (2005b). Vaccine introduction guidelines. Adding a vaccine
to a national immunization programme. Decision and implementation.
Geneva, Switzerland: Department of Immunization, Vaccines and Biological,
World Health Organization.
Univers
ity of
Mala
ya

283
World Health Organization. (2007). Rotavirus vaccines WHO position paper. Weekly
Epidemiological Record, 82(32), 285-296.
World Health Organization. (2008). WHO guide for standardization of economic
evaluations of immunization programmes. Geneva, Switzerland: Initiative for
Vaccine Research (IVR) of the Department of Immunization, Vaccines and
Biologicals, World Health Organization.
World Health Organization. (2010). The World Health Report 2010. Health systems
financing: The path to universal coverage. Geneva, Switzerland: World Health
Organization.
World Health Organization. (2011). Note on the methodology used to predict unit costs
for patient services World Health Organization CHOosing Interventions that
are Cost Effective (WHO-CHOICE).
World Health Organization. (2012a). Life Tables. Retrieved 13 March 2015, from
Global Health Observatory Data Repository
World Health Organization. (2012b). Mortality and global health estimates. Retrieved
13 March 2015, from Global Health Observatory Data Repository
World Health Organization. (2013a). Child mortality levels. Probability of dying per
1,000 live births, Data by country, Malaysia Retrieved 8th February 2015,
from Global Health Observatory Data Repository
http://apps.who.int/gho/data/node.main.ChildMort-2?lang=en
World Health Organization. (2013b). Diphteria, tetanus and pertussis (DTP3), Data by
Country, Malaysia. Retrieved 6th April 2015, from Global Health
Observatory Data Repository
World Health Organization. (2013c). The Expanded Programme on Immunization.
Retrieved 9 February 2015, from
http://www.who.int/immunization/programmes_systems/supply_chain/benefit
s_of_immunization/en/
World Health Organization. (2013d). Rotavirus vaccines: WHO position paper January
2013 Weekly Epidemiological Record (Vol. 5, pp. 49–64). Geneva,
Switzerland: World Health Organization,.
World Health Organization. (2013e). The World Health Report 2013. Research for
Universal Health Coverage. Geneva, Switzerland: World Health Organization.
Univers
ity of
Mala
ya

284
World Health Organization. (2013f). World Health Report 2013: Research for Universal
Health Coverage. Geneva, Switzerland: World Health Organization.
World Health Organization. (2014a). Principles and considerations for adding a vaccine
to a national immunization programme: From decision to implementation and
monitoring. Geneva, Switzerland: Department of Immunization, Vaccines and
Biologicals, World Health Organization.
World Health Organization. (2014b). WHO-UNICEF guidelines for comprehensive
multi-year planning for immunization: update September 2013. Geneva,
Switzerland: Department of Immunization, Vaccines and Biologicals, World
Health Organization.
World Health Organization. (2014c). World Health Organization-CHOosing
Interventions which are Cost-Effective (WHO-CHOICE). Retrieved 15
December 2014, from http://www.who.int/choice/en/
World Health Organization. (2015a). Global Vaccine Action Plan 2011-2020. World
Health Organization, Immunization, Vaccines and Biologicals. Retrieved 10
December 2015, from
http://www.who.int/immunization/global_vaccine_action_plan/GVAP_doc_20
11_2020/en/
World Health Organization. (2015b). Recommendations for routine immunization. 7
January 2016, from
http://www.who.int/immunization/policy/immunization_tables/en/
World Health Organization. (2015c). Threshold values for intervention cost-
effectiveness by region. Retrieved 29th September 2015, from Cost
effectiveness and strategic planning (WHO-CHOICE)
http://www.who.int/choice/costs/CER_levels/en/
World Health Organization and UNICEF. (2013). Ending preventable child deaths from
pneumonia and diarrhoea by 2025: The integrated Global Action Plan for
Pneumonia and Diarrhoea (GAPPD). Geneva, Switzerland: World Health
Organization and United Nation's Children's Fund (UNICEF).
Xu, K., Evans, D. B., Carrin, G., Aguilar-Rivera, A. M., Musgrove, P., & Evans, T.
(2007). Protecting households from catastrophic health spending. Health
affairs, 26(4), 972-983.
Xu, K., Evans, D. B., Kadama, P., Nabyonga, J., Ogwal, P. O., Nabukhonzo, P., &
Aguilar, A. M. (2006). Understanding the impact of eliminating user fees:
Utilization and catastrophic health expenditures in Uganda. Social Science &
Medicine, 62(4), 866-876.
Univers
ity of
Mala
ya
285
Xu, K., Evans, D. B., Kawabata, K., Zeramdini, R., Klavus, J., & Murray, C. J. (2003).
Household catastrophic health expenditure: A multicountry analysis. The
Lancet, 362(9378), 111-117.
Xu, K., Saksena, P., Jowett, M., Indikadahena, C., Kutzin, J., & Evans, D. B. (2010).
Exploring the thresholds of health expenditure for protection against financial
risk World Health Report 2010 (pp. 328-333). Geneva, Switzerland: World
Health Organization.
Yap, K. L., Yasmin, A. M., Wong, Y. H., Ooi, Y. E., Tan, S. C., Jegathesan, M., . . .
Low, M. C. (1992). A one year community-based study on the incidence of
diarrhoea and rotavirus infection in urban and suburban Malaysian children.
Medical Journal of Malaysia, 47(4), 303-308.
Yen, C., Tate, J. E., Hyde, T. B., Cortese, M. M., Lopman, B. A., Jiang, B., . . .
Parashar, U. D. (2014). Rotavirus vaccines: Current status and future
considerations. Human vaccines & immunotherapeutics, 10(6), 1-13.
Zahiid, S. J. (2016, 8 January 2016). Najib: Budget 2016 to be revised. Malay Mail
Online. Retrieved from
http://www.themalaymailonline.com/malaysia/article/najib-budget-2016-to-
be-revised
Zaman, K., Dang, D. A., Victor, J. C., Shin, S., Yunus, M., Dallas, M. J., . . . Ciarlet, M.
(2010). Efficacy of pentavalent rotavirus vaccine against severe rotavirus
gastroenteritis in infants in developing countries in Asia: A randomised,
double-blind, placebo-controlled trial. The Lancet, 376(9741), 615-623.
Zin, R. M. (2007). Understanding the formulation of the revised poverty line in
Malaysia. Akademika, 70, 21-39.
Univers
ity of
Mala
ya

286
LIST OF PUBLICATIONS AND PRESENTATIONS
The following are papers published and manuscripts arising from this thesis:
1. Based on Chapter 6:
Loganathan, T., Lee, W.-S., Lee, K.-F., Jit, M., & Ng, C.-W. (2015). Household
Catastrophic Healthcare Expenditure and Impoverishment Due to Rotavirus
Gastroenteritis Requiring Hospitalization in Malaysia. PLoS One, 10(5),
e0125878. doi: 10.1371/journal.pone.0125878
2. Based on Chapter 4:
Loganathan, T., Ng, C.-W., Lee, W.-S., & Jit, M. (2016). The Hidden Health
and Economic Burden of Rotavirus Gastroenteritis in Malaysia: An Estimation
Using Multiple Data Sources. The Pediatric Infectious Disease Journal, 35(6),
601-606.
3. Based on Chapter 7:
Loganathan, T., Jit, M., Hutubessy, R., Ng, C.-W., Lee, W.-S., & Verguet, S.
(2015). Rotavirus vaccines contribute towards universal health coverage in a
mixed public-private healthcare system. Tropical Medicine and International
Health (In acceptance).
4. Based on Chapter 5:
Loganathan, T., Ng, C.-W., Lee, W.-S., Hutubessy, R & Verguet, S, Jit, M.
(2015). Cost-effectiveness analysis of rotavirus vaccines in Malaysia:
Informing thresholds for cost-effectiveness (In preparation).
Univers
ity of
Mala
ya


