
Introducing the Semi-Quantitative Index (SQI) Reporting Tool
Manage NSCLC patients with confidence
SQI Reporting tool not available in the U.S.
Tyrosine kinase inhibitors (TKIs), such as erlotinib and
gefitinib, target the epidermal growth factor receptor
(EGFR) and are effective anti-cancer drugs in patients with
non-small cell lung cancer (NSCLC). Mutations in the ATP-
binding pocket of EGFR enhance the binding of the TKI at
the expense of ATP and confer sensitivity to these agents.1
Subsequent resistance to TKIs develops in 90% of patients.
In many, this is associated with the T790M resistance
mutation in exon 20. Identifying patients with this mutation
is important as this population may benefit from third-
generation TKIs.
Historically, testing patients for mutations has been
conducted with tissue samples. However, biopsy is an
invasive procedure that is not always possible to perform
in severely ill patients. In patients with NSCLC, obtaining
sufficient tissue can be difficult due to the location and size
of the tumour. Plasma from these patients contains cell-free
DNA (cfDNA) from the original tumour, and analysis of the
plasma allows more frequent assessment of disease state.
The cobas® EGFR Mutation Test v2 uses real-time PCR
technology to detect and identify 42 mutations in exons
18, 19, 20 and 21 in the EGFR gene using plasma samples.*
Serial testing of plasma from 23 NSCLC patients with
TKI-sensitizing EGFR mutations found that the amount
of plasma DNA containing these mutations was reduced
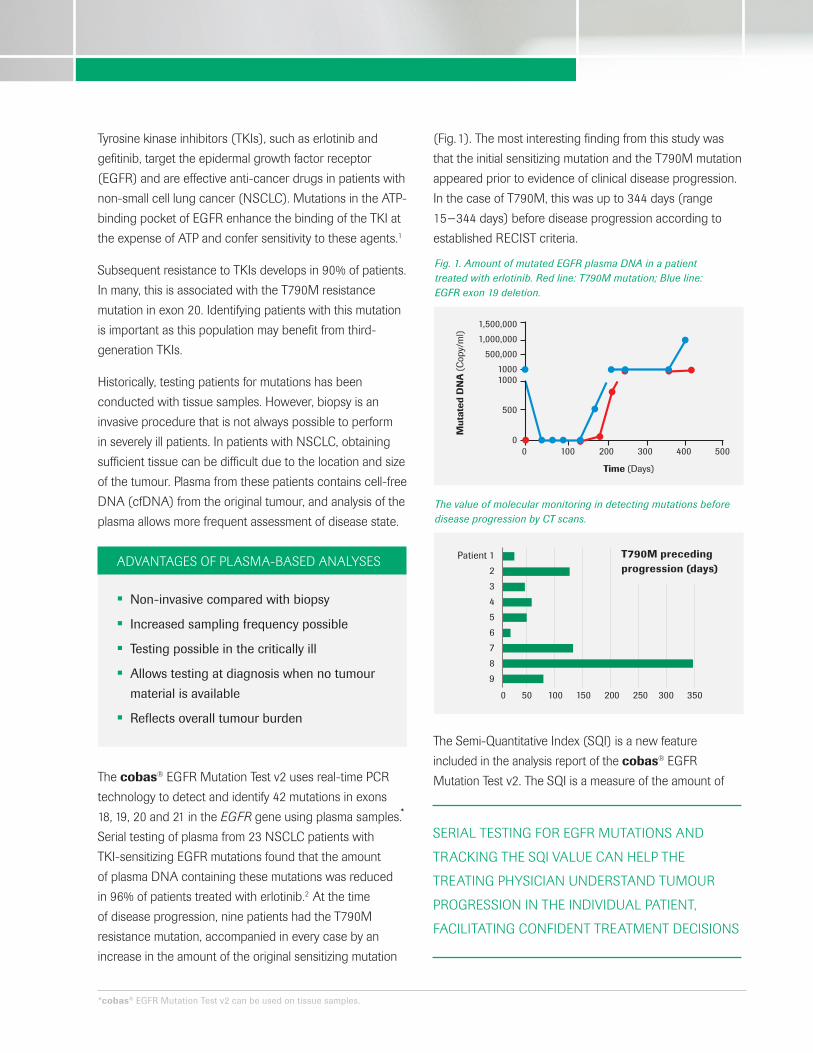
in 96% of patients treated with erlotinib.2 At the time
of disease progression, nine patients had the T790M
resistance mutation, accompanied in every case by an
increase in the amount of the original sensitizing mutation
(Fig. 1). The most interesting finding from this study was
that the initial sensitizing mutation and the T790M mutation
appeared prior to evidence of clinical disease progression.
In the case of T790M, this was up to 344 days (range
15−344 days) before disease progression according to
established RECIST criteria.
The Semi-Quantitative Index (SQI) is a new feature
included in the analysis report of the cobas® EGFR
Mutation Test v2. The SQI is a measure of the amount of
Mut
ated
DN
A (
Cop
y/m
l)Time (Days)
1,500,000
1,000,000
500,000
10001000
500
00 100 200 300 400 500
Patient 1
2
3
4
5
6
7
8
9
0 50 100 150 200 250 300 350
ADVANTAGES OF PLASMA-BASED ANALYSES
• Non-invasive compared with biopsy
• Increased sampling frequency possible
• Testing possible in the critically ill
• Allows testing at diagnosis when no tumour
material is available
• Reflects overall tumour burden
SERIAL TESTING FOR EGFR MUTATIONS AND
TRACKING THE SQI VALUE CAN HELP THE
TREATING PHYSICIAN UNDERSTAND TUMOUR
PROGRESSION IN THE INDIVIDUAL PATIENT,
FACILITATING CONFIDENT TREATMENT DECISIONS
Fig. 1. Amount of mutated EGFR plasma DNA in a patient treated with erlotinib. Red line: T790M mutation; Blue line: EGFR exon 19 deletion.
The value of molecular monitoring in detecting mutations before disease progression by CT scans.
T790M preceding progression (days)
*cobas® EGFR Mutation Test v2 can be used on tissue samples.
mutant cfDNA in a sample and can be used to measure
differences in mutation load over time. An increase or
decrease in the SQI value indicates a respective change
in the amount of corresponding target mutation in an
individual patient.
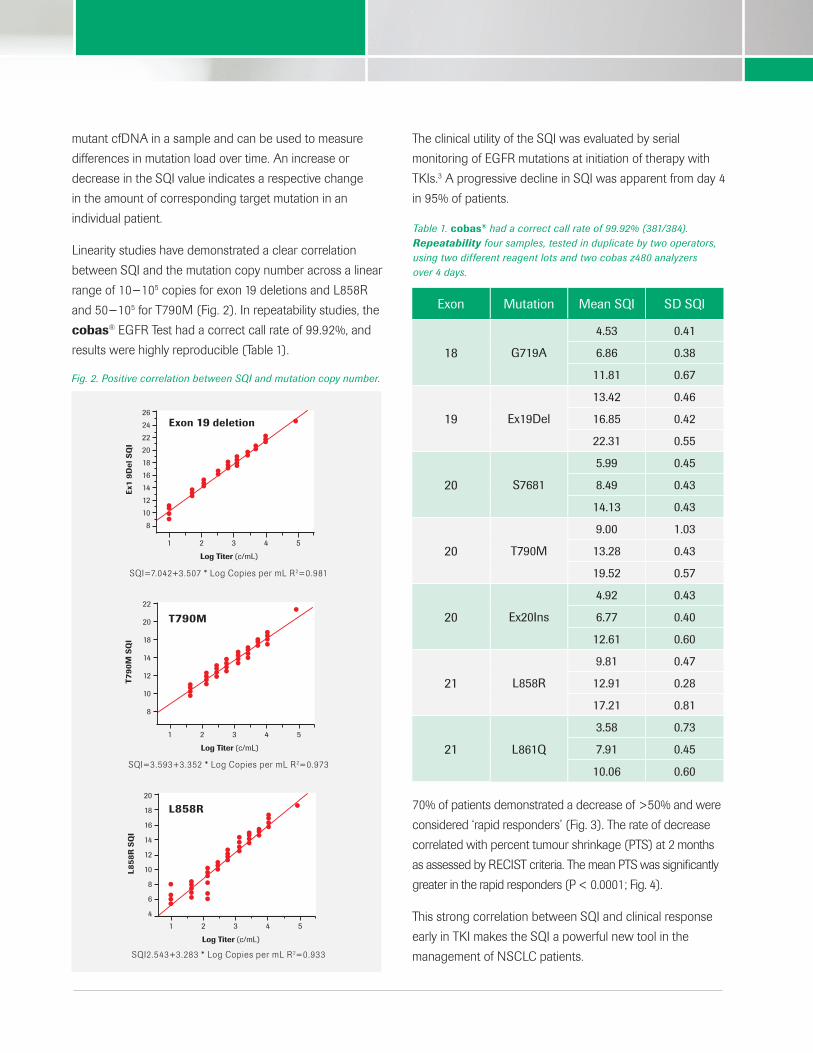
Linearity studies have demonstrated a clear correlation
between SQI and the mutation copy number across a linear
range of 10−105 copies for exon 19 deletions and L858R
and 50−105 for T790M (Fig. 2). In repeatability studies, the
cobas® EGFR Test had a correct call rate of 99.92%, and
results were highly reproducible (Table 1).
The clinical utility of the SQI was evaluated by serial
monitoring of EGFR mutations at initiation of therapy with
TKIs.3 A progressive decline in SQI was apparent from day 4
in 95% of patients.
70% of patients demonstrated a decrease of >50% and were
considered ‘rapid responders’ (Fig. 3). The rate of decrease
correlated with percent tumour shrinkage (PTS) at 2 months
as assessed by RECIST criteria. The mean PTS was significantly
greater in the rapid responders (P < 0.0001; Fig. 4).
This strong correlation between SQI and clinical response
early in TKI makes the SQI a powerful new tool in the
management of NSCLC patients.
Ex1
9D
el S
QI
Log Titer (c/mL)
26
24
22
20
18
16
14
12
10
8
1 2 3 4 5
Log Titer (c/mL)
22
20
18
14
12
10
8
1 2 3 4 5
T79
0M
SQ
I
Log Titer (c/mL)
20
18
16
14
12
10
8
6
4
1 2 3 4 5
L85
8R
SQ
I
Fig. 2. Positive correlation between SQI and mutation copy number.
SQI=7.042+3.507 * Log Copies per mL R2=0.981
SQI=3.593+3.352 * Log Copies per mL R2=0.973
SQI2.543+3.283 * Log Copies per mL R2=0.933
Exon 19 deletion
T790M
L858R
Exon Mutation Mean SQI SD SQI
18 G719A
4.53 0.41
6.86 0.38
11.81 0.67
19 Ex19Del
13.42 0.46
16.85 0.42
22.31 0.55
20 S7681
5.99 0.45
8.49 0.43
14.13 0.43
20 T790M
9.00 1.03
13.28 0.43
19.52 0.57
20 Ex20Ins
4.92 0.43
6.77 0.40
12.61 0.60
21 L858R
9.81 0.47
12.91 0.28
17.21 0.81
21 L861Q
3.58 0.73
7.91 0.45
10.06 0.60
Table 1. cobas® had a correct call rate of 99.92% (381/384). Repeatability four samples, tested in duplicate by two operators, using two different reagent lots and two cobas z480 analyzers over 4 days.

SQI: IMPLICATIONS FOR CLINICAL PRACTICE
• Serial measurements using the SQI can assist
in the management of NSCLC patients based
on EGFR mutation status
• The SQI correlates with clinical disease
progression
• The SQI identifies trends in EGFR mutations
and may:
- Allow early prediction of clinical response
to TKIs
- Identify resistance mutations months before
clinical progression is evident
- Identify patients less likely to respond to
first-generation TKIs
- Allow early triage of patients more likely
to respond to third-generation TKIs early
• The SQI may represent a new tool to facilitate
drug efficacy comparisons in clinical trials
COMPONENTS AND PART NUMBERS
Product/component Quantity Part number
cobas® EGFR Mutation Test v2 (CE-IVD)
24 Tests 07248563190
cobas® cfDNA Sample Preparation Kit (IVD)
24 Isolations 07247737190
cobas® DNA Sample Preparation Kit (IVD)
24 Isolations 05985536190
REFERENCES
1 Pao W, et al. Proc Natl Acad Sci USA 2004;101(36):13306−11.
2 Sorensen BS, et al. Cancer 2014;120:3896−901.
3 Marchetti A, et al. J Thorac Oncol 2015;10:1437−43.
Roche Diagnostics (Schweiz) AGIndustriestrasse 7CH-6343 RotkreuzTel: +41 (0)41 799 61 00www.roche-diagnostics.ch
©2015 Roche Molecular Systems Inc.COBAS and LIFE NEEDS ANSWERS are trademarks of Roche.
Tum
ou
r_sh
rin
kag
e
70.00
60.00
50.00
40.00
30.00
20.00
10.00
Rapid responder (n=14)(>50% decrease in SQI at day 14)
mean PTS: 59.1
P<0.0001
Slow responder (n=14)(<50% decrease in SQI at day 14)
mean PTS: 18.3
Fig. 4. PTS in rapid and slow responders.
14
12
10
8
6
4
2
0
0 5 10 15 20 3025 35 4540 50 60 6555
EGFR
SQ
I
A
days
14
12
10
8
6
4
2
0
0 5 10 15 20 3025 35 4540 50 60 6555
EGFR
SQ
I
B
days
Fig. 3. SQI correlation for Rapid Responders (A) and Slow Responders (B).


