

MANAG ED AQU IF ER RECHARG E – KEY PO IN TS AN D THE W IN DHOEK CASE STU DY
S ADC GRO U NDW ATER M A NA GE MENT IN ST IT UTE GROU NDW ATER A FRI CA
pg 1
TYPES OF MANAGED AQUIFER RECHARGE
Aquifer Storage and Recovery (ASR)
The Injection of Water into a borehole for storage and recovery from the same borehole.
Suitable in both confined and unconfined aquifers.
Aquifer Storage Transfer & Recovery (ASTR)
The Injection of Water into a borehole for storage and recovery from a different borehole, generally to provide additional water treatment.
Suitable in both confined and unconfined aquifers.
Infiltration Pond
Ponds constructed usually off-stream where surface water is diverted and allowed to infiltrate (generally through an unsaturated zone to the underlying unconfined aquifer).
Suitable in unconfined aquifers.
Dune Filtration
The infiltration of water into a sand dune system and extraction from boreholes, wells or ponds at a lower elevation for water quality improvement and to balance supply and demand.
Suitable in unconfined aquifers.
Local Rainwater Harvesting
Surface water runoff from roofs or localised paving is diverted into a borehole, well or a caisson filled with sand or gravel and allowed to percolate to the water table where it is collected by pumping from a well or borehole.
Suitable in unconfined aquifers.
Sand Dam
Built in ephemeral streams in arid areas on low permeability lithology. They trap sediment when flow occurs and following successive floods, the sand dam is raised to create an “aquifer”. Vertical boreholes or horizontal outlets to the face of the dam can be used to extract water in dry seasons

MANAG ED AQU IF ER RECHARG E – KEY PO IN TS AN D THE W IN DHOEK CASE STU DY
S ADC GRO U NDW ATER M A NA GE MENT IN ST IT UTE GROU NDW ATER A FRI CA
pg 2
THE 10 “SUCCESS” CRITERIA
CRITERIA SOME KEY QUESTIONS
1. The need for the scheme Is artificial recharge really necessary? Could you not increase your groundwater yield by expanding
the wellfield or by managing existing wellfields better? 2. The source water What volume of water is available for recharge, and when is it
available? 3. Aquifer hydraulics Will the aquifer receive and store the water? 4. Water quality Is the quality of the source water suitable for artificial recharge? 5. Engineering issues How will the water be transferred into the aquifer? 6. Environmental issues What are the potential environmental benefits, risks and
constraints? 7. Legal and regulatory issues What type of authorisation is required? 8. Economics How much will the scheme cost, how much will it cost to
operate it, and what will the cost of supplied water per m3 be? 9. Management and technical
capacity What skills are required to operate the scheme, and are they
available? 10. Institutional arrangements Who will be responsible for supplying the source water and
ensuring its quality is suitable for recharge? Are there other users of the aquifer? Who will regulate the use of the scheme?
Injection borehole, Adelaide, Australia.
Storm water is diverted to a wetland which was constructed to treat the water. Then it is pumped into an aquifer via injection boreholes.

MANAG ED AQU IF ER RECHARG E – KEY PO IN TS AN D THE W IN DHOEK CASE STU DY
S ADC GRO U NDW ATER M A NA GE MENT IN ST IT UTE GROU NDW ATER A FRI CA
pg 3
PROJECT DEVELOPMENT STAGES
PROJECT STAGE KEY ACTIVITIES
Pre-feasibility Stage
Identify the potential MAR project and describe the information currently available.
Based on existing information, comment on the feasibility of the project.
Describe the work required for the Feasibility Stage and estimate the cost of undertaking the feasibility study.
Establish authorisation requirements from relevant government departments.
Feasibility Stage
If needed, obtain authorization (e.g. a water use license and environmental authorisation) for the recharge tests.
Conduct the Feasibility Study. This should include testing (eg injection tests, infiltration tests, pumping tests, water quality assessments, etc).
Develop a preliminary infrastructure design.
Identify the project implementation phases if a phased approach is necessary (eg starting small and expanding after successive recharge cycles).
Estimate the costs of the project.
Identify funding sources.
Compile a detailed project implementation plan.
Implementation Stage
Obtain the necessary authorization to construct the scheme.
Drill and test new injection and abstraction boreholes, or infiltration basins.
Set up the groundwater and recharge water monitoring system.
Develop a detailed infrastructure design, carry out the tendering processes, and construct the scheme.
Compile monitoring, operation & maintenance procedures.
Operation and Maintenance Stage
Carry out performance monitoring during production.
Modify operation & maintenance procedures based on scheme performance.
Develop final operating, monitoring and reporting system.
Infi ltration basin, Atlantis, Cape Town, South Africa.
Treated municipal waste water and storm water is diverted to infi ltrat ion basins.

MANAG ED AQU IF ER RECHARG E – KEY PO IN TS AN D THE W IN DHOEK CASE STU DY
S ADC GRO U NDW ATER M A NA GE MENT IN ST IT UTE GROU NDW ATER A FRI CA
pg 4
Windhoek: A case study of a large-scale borehole injection scheme that combines Aquifer Storage and Recovery (ASR)
and Aquifer Storage Transfer & Recovery (ASTR)
Introduction
The City of Windhoek lies in the centre of Namibia, the most arid country south of the Sahara Desert. The average annual rainfall in Windhoek is 360 mm, while the average evaporation is 2 170 mm/a There are no perennial rivers within the country’s borders; the nearest perennial river to Windhoek is the Okavango which is 700 km north of the city and constitutes the northern border of the country. The city relies on three dams, the Windhoek Aquifer and direct reclamation to provide for its population of 326 000 (2011 census). By 2050 the population is expected to reach 790 000 and the water demand increase from the current supply of 27 Mm3/a to ~50 Mm3/a. In the 1990s numerous water supply options were considered to augment the city’s future requirements and the most cost effective one was considered to be artificial recharge or Managed Aquifer Recharge (MAR). The concept of using the Windhoek Aquifer as a water bank was keenly received by the City of Windhoek and by 2004 four boreholes were equipped for recharge, and by 2011 an additional two boreholes had been equipped bringing the combined recharge capacity to 420 m3/hr. The concept essentially involved transferring treated surface water to the aquifer for safe storage and use when needed. With the increasing demand and the threat to water supply security posed by droughts and climate change, MAR turned out to be the most favourable augmentation option, and the scheme was expanded. Ten new injection and ten new abstraction boreholes were drilled with combined capacities of 675 m3/hr (injection) and 745 m3/hr (abstraction) and currently new deep boreholes (400 – 500 m depths) are being drilled for abstraction purposes. The aim is to utilize as much of the aquifer’s storage as practically possible, as this will significantly enhance the city’s water supply security.
Geology and hydrogeology
The hydrogeology of the Windhoek Aquifer is dominated by faulted and fractured quartzite and schist rocks. The dominant groundwater flow direction is northwards from the quartzite mountains south of the city towards the city which is underlain by schists. The flow follows preferential pathways along the numerous faults and fracture zones that transect the area. The quartzites can be divided into pure quartzites that from the Auas Mountains south of Windhoek, and impure or micaceous quartzites that lie between the city and the Auas Mountains. Natural recharge is estimated to be on average 1.73 Mm3/a, is highest in the pure quartzites and this is reflected in the salinity of the water which has an electrical conductivity (EC) of 20 – 60 mS/m in comparison to the micaceous quartzites (50 – 80mS/m) and in the schists (100 – 200 mS/m).

MANAG ED AQU IF ER RECHARG E – KEY PO IN TS AN D THE W IN DHOEK CASE STU DY
S ADC GRO U NDW ATER M A NA GE MENT IN ST IT UTE GROU NDW ATER A FRI CA
pg 5
Simplified geology of the Windhoek Aquifer
Historic water levels and the need to augment recharge
Since the onset of large-scale abstraction from the Windhoek Aquifer in the 1950s, and by the time MAR was investigated in the late 1990s, water levels had dropped by about 40 m in the micaceous quartzites which constitute the main wellfield areas, and were steadily declining in the pure quartzite areas. Even after 5 year rest periods (e.g. 1970 – 1975), the water levels never recovered to their original levels. The aquifer had effectively been over-pumped or “mined” and it would take up to a decade for water levels to recover fully.
MANAG ED AQU IF ER RECHARG E – KEY PO IN TS AN D THE W IN DHOEK CASE STU DY
S ADC GRO U NDW ATER M A NA GE MENT IN ST IT UTE GROU NDW ATER A FRI CA
pg 6
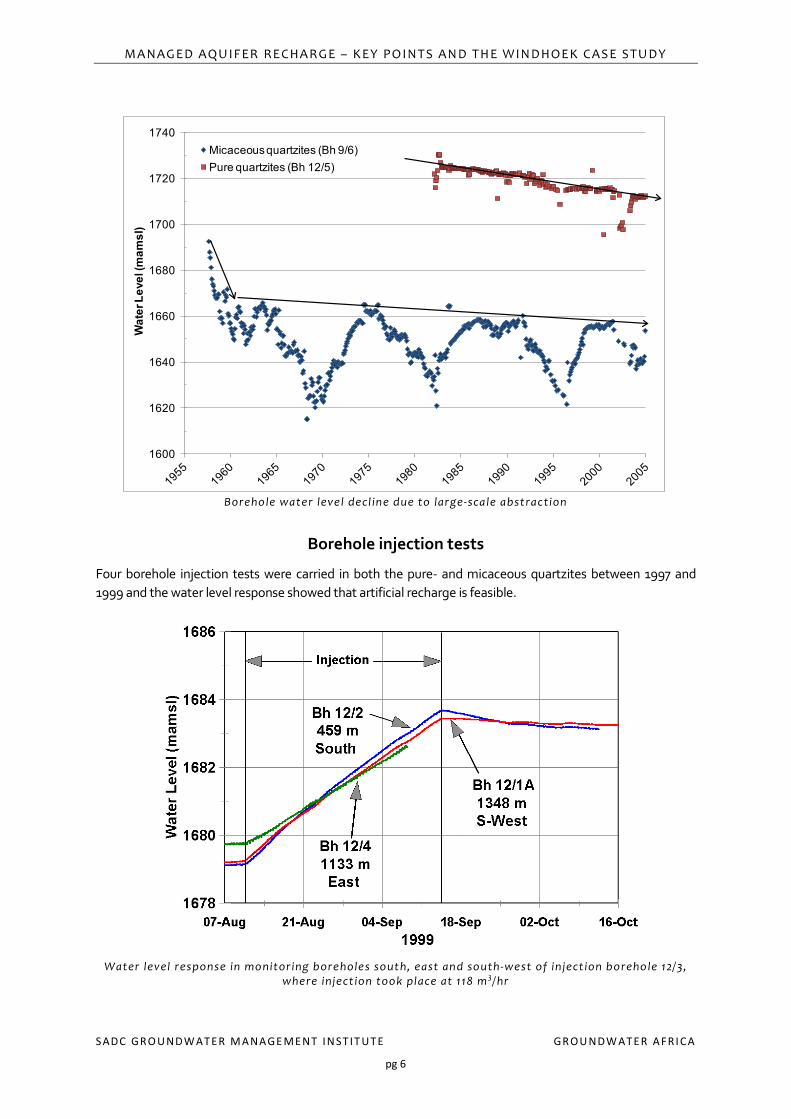
Borehole water level decl ine due to large-scale abstraction
Borehole injection tests
Four borehole injection tests were carried in both the pure- and micaceous quartzites between 1997 and 1999 and the water level response showed that artificial recharge is feasible.
Water level response in monitoring boreholes south, east and south-west of inject ion borehole 12/3, where inject ion took place at 118 m 3/hr
1600
1620
1640
1660
1680
1700
1720
1740W
ater
Lev
el (m
amsl
)Micaceous quartzites (Bh 9/6)Pure quartzites (Bh 12/5)

MANAG ED AQU IF ER RECHARG E – KEY PO IN TS AN D THE W IN DHOEK CASE STU DY
S ADC GRO U NDW ATER M A NA GE MENT IN ST IT UTE GROU NDW ATER A FRI CA
pg 7
Injection borehole site
The plan
The success of the injection tests and the historic water level data showed that artificial recharge should focus both in the existing wellfield areas (the micaceous quartzites) and the main natural recharge and storage area (the pure quartzites).
Schematic representation of the main l ithologies and proposed borehole injection areas
Operation
Injected water volume and water level response Six existing boreholes were converted into injection boreholes and between 2006 and 2012 water was injected into them. A total of 3.3 million m3 was injected and this resulted in some of the wellfield areas being fully replenished. This is about twice the estimated annual natural recharge rate.
(pure quartzites)
(micaceous quartzites)
(gneiss)
(schists)
MANAG ED AQU IF ER RECHARG E – KEY PO IN TS AN D THE W IN DHOEK CASE STU DY
S ADC GRO U NDW ATER M A NA GE MENT IN ST IT UTE GROU NDW ATER A FRI CA
pg 8
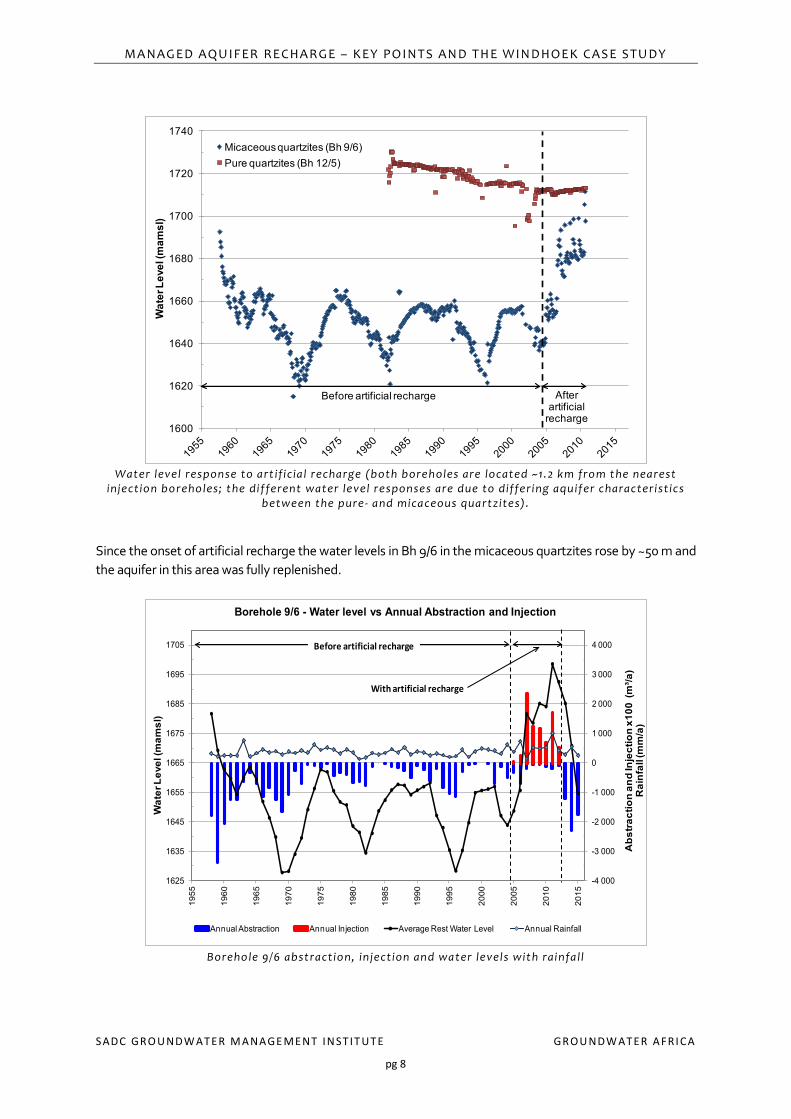
Water level response to art ificia l recharge (both boreholes are located ~1.2 km from the nearest
injection boreholes; the different water level responses are due to differing aquifer characteristics between the pure- and micaceous quartzites).
Since the onset of artificial recharge the water levels in Bh 9/6 in the micaceous quartzites rose by ~50 m and the aquifer in this area was fully replenished.
Borehole 9/6 abstraction, injection and water levels with rainfall
1600
1620
1640
1660
1680
1700
1720
1740
Wat
er L
evel
(mam
sl)
Micaceous quartzites (Bh 9/6)Pure quartzites (Bh 12/5)
Before artificial recharge After artificial
recharge
-4 000
-3 000
-2 000
-1 000
0
1 000
2 000
3 000
4 000
1625
1635
1645
1655
1665
1675
1685
1695
1705
1955
1960
1965
1970
1975
1980
1985
1990
1995
2000
2005
2010
2015
Abs
trac
tion
and
Inje
ctio
n x1
00 (
m³/a
) R
ainf
all (
mm
/a)
Wat
er L
evel
(mam
sl)
Borehole 9/6 - Water level vs Annual Abstraction and Injection
Annual Abstraction Annual Injection Average Rest Water Level Annual Rainfall
Before artificial recharge
With artificial recharge

MANAG ED AQU IF ER RECHARG E – KEY PO IN TS AN D THE W IN DHOEK CASE STU DY
S ADC GRO U NDW ATER M A NA GE MENT IN ST IT UTE GROU NDW ATER A FRI CA
pg 9
Water quality
The injected water is fully treated potable water with very strict water quality guidelines that were developed to prevent the deterioration of groundwater quality and to minimize clogging of the boreholes and aquifer. The injectant is blended at a ratio of 3 to 1 from surface/dam water with reclaimed water. On average, its salinity has been 68 mS/m or 456 mg/L TDS and the Dissolved Organic Carbon (DOC) 4.9 mg/L The water blended with the natural groundwater, and to date, the recovered water has had an average salinity of 91 mS/m or 610 mg/L TDS and an average DOC of 1.1 mg/L.
Institutional Arrangements
The City of Windhoek pays the bulk water supplier, NamWater, the operational cost of the recharge water (i.e. it is stored at cost price). An additional price is paid by the City to NamWater only if more water is withdrawn from the aquifer in a given year than the aquifer’s average natural recharge rate (1.73 Mm3/a). This model benefits both organisations and consumers as it improves the security of supply during extended periods of drought and affords NamWater income during droughts (when normally they would sell less water). Essentially low-value water which would have evaporated from the source dams is now stored in the aquifer for use during droughts, thereby transforming it from low-value water to high-value water at the time of supply to consumers.
Expansion
The best estimate of the potential “water bank” is 90 Mm3 or about 3 times the current annual water use. At this stage the existing boreholes cannot access all this water and new deep boreholes are being drilled. The following goals were set:
1. Increase recharge to 12 Mm3/a by 2019. 2. Equip boreholes for drought abstraction of 19 Mm3/a from 2019. 3. Increase the storage capacity of the water bank from 41 Mm3 to 71 Mm3/a after completion of boreholes
and infrastructure as from 2018/19.
Current status and planned expansion of the scheme
PROJECT STAGE STATUS
Current 6 equipped injection boreholes with a combined capacity of 420 m3/hr. 34 equipped abstraction boreholes with a combined capacity of 954 m3/hr (pump
intake depths of ~150 – 200 m). Year 2011 drilling program
10 injection boreholes drilled with a combined capacity of 675 m3/hr. 10“deep” abstraction boreholes drilled with a combined capacity of 745 m3/hr
(pump intake depths of ~250 – 350 m). Current drilling program (2016/7)
12 “very deep” injection and abstraction boreholes currently being drilled with pump intake depths of ~350 – 450 m (10 completed by March 2017).
Next drilling program (2017, funding dependent)
1st phase geophysical surveys have been completed to identify additional recharge and abstraction sites.
~20 new injection boreholes will be required to meet future injection targets. ~20 “very deep” abstraction boreholes will be required to meet future abstraction
requirements.

MANAG ED AQU IF ER RECHARG E – KEY PO IN TS AN D THE W IN DHOEK CASE STU DY
S ADC GRO U NDW ATER M A NA GE MENT IN ST IT UTE GROU NDW ATER A FRI CA
pg 10
Economics
The cost of the whole scheme (from 2016 onwards), which includes borehole siting, drilling and testing, borehole pump installations, bulk supply pump stations, pipelines and power supply infrastructure, is estimated to be US$ 52.4 million. The City of Windhoek has already spent over US$8.4 million on the scheme, and is looking to fund an additional US$ 9.6 million of the required US$52.4 million – the balance they will have to source externally.
Conclusions
In the recent drought (2015/6) borehole water provided the city’s water security. This was possible because the aquifer had been replenished via borehole injection prior to the drought. When fully developed, it is expected that the city’s water bank will be able to provide security for three-years as the sole water resource during drought conditions. Since 2013 the water demand in the central area of Namibia was well above the 95% safe yield of the available resources, and the water demand for the City of Windhoek alone is expected to nearly double by 2050. To date virtually all of the local and regional water sources considered viable within the Central Area of Namibia have been fully developed except for the Windhoek Managed Aquifer Recharge Scheme (WMARS). Since 2002 several studies identified the WMARS as the best option to improve water supply security to the Central Areas of Namibia. In 2014 an Environmental Impact Assessment was conducted and it acknowledged the positive socio-economic impacts of the project in relation to its significance in creating a sustainable water source for the Central Area of Namibia. This project is therefore considered an essential component for securing the future of the population in the central area and will play a key role in sustaining development and socio-economic health.
MANAG ED AQU IF ER RECHARG E – KEY PO IN TS AN D THE W IN DHOEK CASE STU DY
S ADC GRO U NDW ATER M A NA GE MENT IN ST IT UTE GROU NDW ATER A FRI CA
pg 11
Field Trip
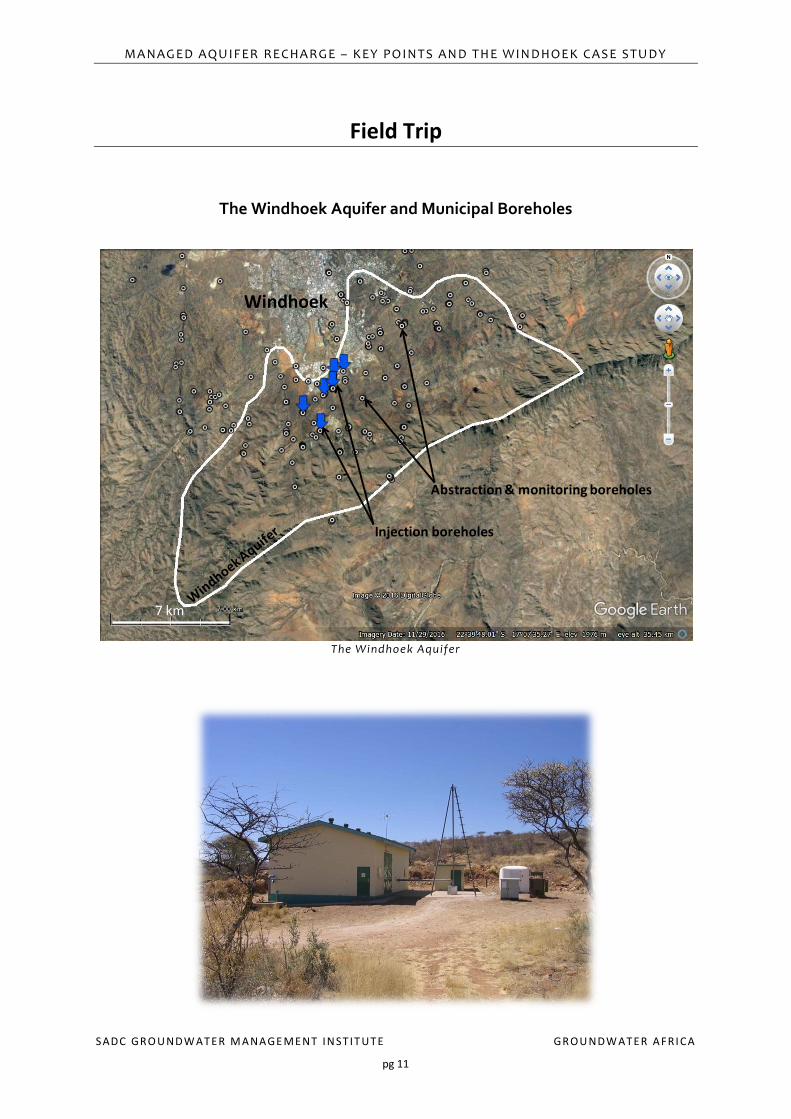
The Windhoek Aquifer and Municipal Boreholes
The Windhoek Aquifer
7 km
Injection boreholes
Abstraction & monitoring boreholes
Windhoek

MANAG ED AQU IF ER RECHARG E – KEY PO IN TS AN D THE W IN DHOEK CASE STU DY
S ADC GRO U NDW ATER M A NA GE MENT IN ST IT UTE GROU NDW ATER A FRI CA
pg 12
Existing injection boreholes (b lue arrows) and new deep abstraction boreholes (yellow squares)
3.5 km
Windhoek
12/3 Inj. & Abs.
9/6 Inj.9/9 Inj. & Abs.
9/8 Inj. & Abs.9/11 Inj.
9/14 Inj. & Abs
2 km
12/3.
9/6 9/9
9/89/11
9/149/20
9/19
12/29/17
12/1 12/12
12/9 12/13 12/5
12/10
MANAG ED AQU IF ER RECHARG E – KEY PO IN TS AN D THE W IN DHOEK CASE STU DY
S ADC GRO U NDW ATER M A NA GE MENT IN ST IT UTE GROU NDW ATER A FRI CA
pg 13
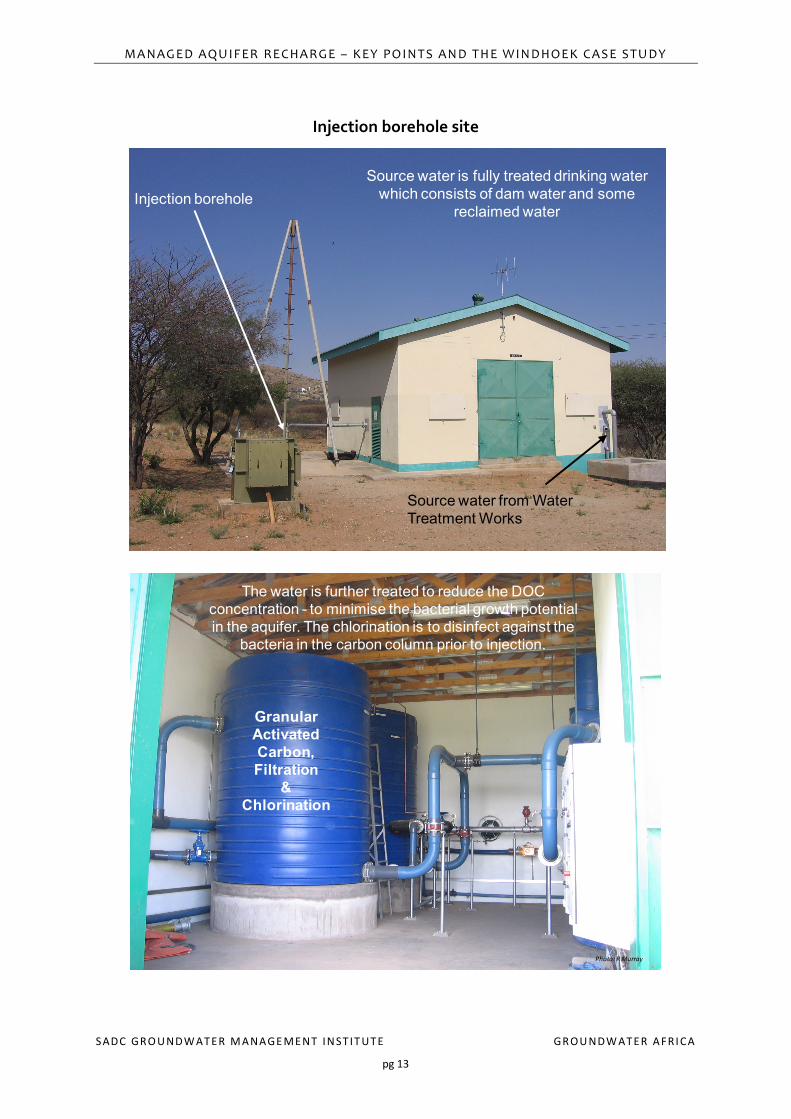
Injection borehole site
Source water from Water Treatment Works
Source water is fully treated drinking water which consists of dam water and some
reclaimed waterInjection borehole
Photo: R Murray
Granular Activated Carbon,Filtration
&Chlorination
The water is further treated to reduce the DOC concentration - to minimise the bacterial growth potential in the aquifer. The chlorination is to disinfect against the
bacteria in the carbon column prior to injection.
MANAG ED AQU IF ER RECHARG E – KEY PO IN TS AN D THE W IN DHOEK CASE STU DY
S ADC GRO U NDW ATER M A NA GE MENT IN ST IT UTE GROU NDW ATER A FRI CA
pg 14
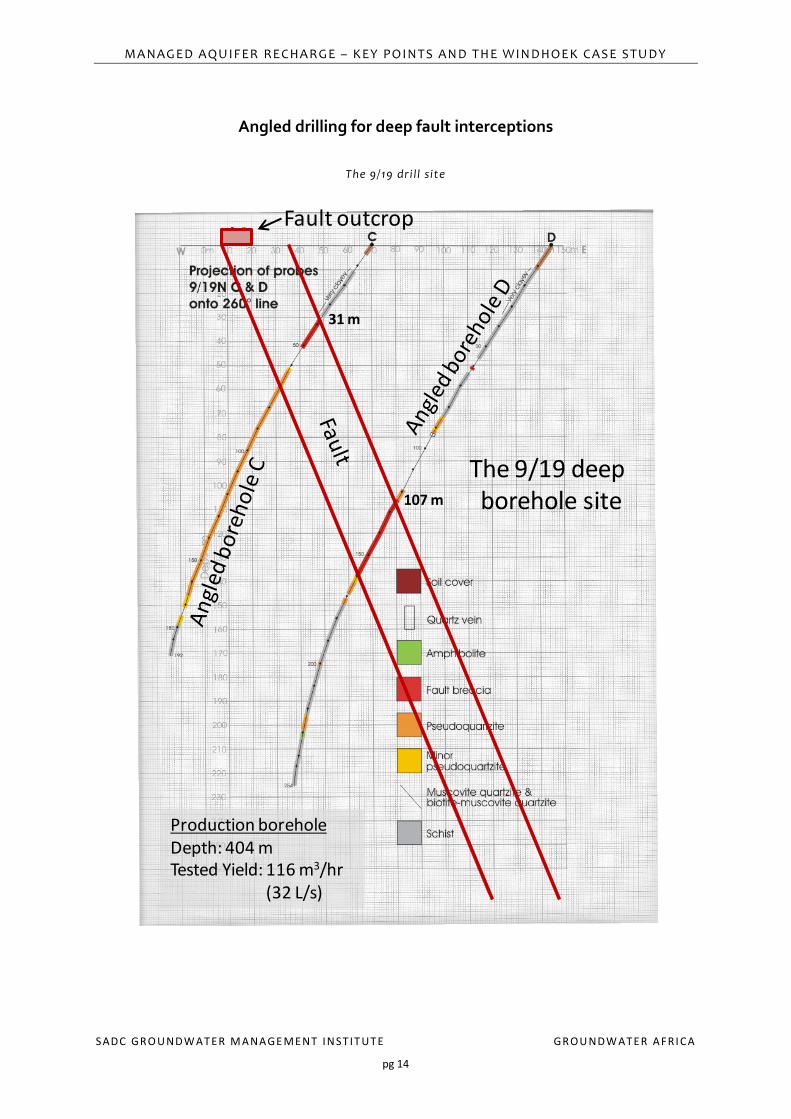
Angled drilling for deep fault interceptions
The 9/19 dri l l site
Fault outcrop
The 9/19 deep borehole site107 m
31 m
Production boreholeDepth: 404 mTested Yield: 116 m3/hr
(32 L/s)

MANAG ED AQU IF ER RECHARG E – KEY PO IN TS AN D THE W IN DHOEK CASE STU DY
S ADC GRO U NDW ATER M A NA GE MENT IN ST IT UTE GROU NDW ATER A FRI CA
pg 15
The 9/9 dril l site
The 9/9 deep borehole site
Production boreholeDepth: 425 mTested Yield:
128 m3/hr (36 L/s)

MANAG ED AQU IF ER RECHARG E – KEY PO IN TS AN D THE W IN DHOEK CASE STU DY
S ADC GRO U NDW ATER M A NA GE MENT IN ST IT UTE GROU NDW ATER A FRI CA
pg 16
Acknowledgements The South African Department of Water and Sanitation for material used from their Artificial Recharge Strategy Roll-out (which was developed by Dr R Murray).
The Windhoek section is summarised from Dr R Murray’s PhD thesis entitled “The feasibility of artificially recharging the Windhoek aquifer”, and the paper presented by Dr R Murray at ISMAR 9 in Mexico, 2016 entitled “Windhoek, Namibia: From conceptualising to operating and expanding a MAR scheme in a fractured quartzite aquifer for the city’s water security” which has also been submitted to the Hydrogeology Journal for publication.
The City of Windhoek, especially Mr J de Vos, Chief Engineer and Mrs Z Scheepers, Engineering Services, Department of Infrastructure Water Technical Services, and Mr D Louw who is the municipality’s hydrogeologist and is responsible for data management.
Mr B van der Merwe who initiated the pilot recharge runs in 1996 while at the City of Windhoek, and has been working on the project ever since. He assessed the technical and financial viability of the project and has been the project engineer for the expansion phases, including the current phase.
Mr I Peters who was responsible for the implementation and continuation of the project until the end of October 2015 when he retired from the Windhoek municipality.
Mr R Carr and Dr R Miller, the geologists on the deep borehole siting project. Dr Miller produced the angled borehole plan and cross section diagrams.
Potential Artificial Recharge Areas in South Africa


