M A N A G E M E N T
I N T E G R AT I O N G OA L
Strengthen management at all levels
389

D E P A R T M E N T A L M A N A G E M E N T
391F Y 2 0 0 3 P E R F O R M A N C E R E P O R T
Departmental Management
Management Integration Goal: Strengthen Management at all Levels
Mission StatementThe Department of Commerce promotes job creation and improved living standards for all Americans by creatingan infrastructure that supports economic growth, technological competitiveness, and sustainable development.
Departmental Management (DM) includes the Immediate Offices of the Secretary and Deputy Secretary, Office of theChief Financial Officer and Assistant Secretary for Administration (CFO/ASA), Office of the Chief InformationOfficer (CIO), and Office of General Counsel as well as other departmental offices. DM supports the management
infrastructure needed to carry out the Department’s mission.
While certain of its activities involve the public, e.g., contract management and small business utilization, DM’s principalinteraction is with entities within the Department. Its activities benefit the public by contributing to the efficiency with whichthe operating units administer their programs and the Department’s overall mission is carried out. DM provides executivedirection and coordination for program activities as well as centralized services to the bureaus. It also oversees promulgationand implementation of departmental and government-wide policies and initiatives.
President’s Management Agenda (PMA)
DM, with its responsibility for implementing Commerce-wide initiatives, exercises day-to-day oversight of these efforts. InFY 2003, DM continued to align plans and activities with the overarching principles reflected in the PMA. In this way, DMexpects to expand initial successes in carrying out these management reforms to long-term accomplishment of the President’sgoals, including those established in his management agenda.
Performance Goal 1, “Ensure Effective Resource Stewardship in Support of the Department’s Programs,” includes measuresthat track DM’s success in improving many administrative functions, including financial management and competitivesourcing under the Federal Activities Inventory Reform (FAIR) Act. Performance Goal 2, “Strategic Management of HumanCapital,” is devoted to enhancing management of the Department’s human capital; and Performance Goal 3, “Acquire andManage the Technology Resources to Support Program Goals,” tracks the Department’s efforts to improve management of itsinformation technology (IT) resources and expand its use of e-government. The development of this FY 2003 Performanceand Accountability Report (PAR) and the FY 2005 Annual Performance Plan (APP), which accompanies the FY 2005 budgetsubmission to Congress, reflects DM’s effort to integrate budget and performance.
A detailed description of the results that Commerce has achieved in implementing the PMA and the status of the President’sfive crosscutting initiatives is provided earlier in this report in the “Management Discussion and Analysis” section.The quantitative results for FY 2003 activities are presented on the following page.

Priorities/Management Challenges
By implementing broad reforms such as those in the PMA, DM works to minimize the burden associated with administrativefunctions that are common to all the Department’s program areas while at the same time maintaining appropriate controls andaccountability.
DM directs particular effort toward improving administrative functions by carrying out the government-wide initiatives underthe PMA, i.e., enhancing financial management, competitive sourcing, and strategic management of human capital; expandinge-government; and integrating budget and performance. Quarterly, the Office of Management and Budget (OMB) assesseseach agency’s progress in achieving the goals of the PMA using a “traffic light” scoring system; two ratings are assigned foreach of the five initiatives.
“Progress” ratings reflect the agency’s adherence to the milestones and deliverables. A green progress ratingmeans that implementation is proceeding as planned; yellow means that there has been some slippage in plannedactivities, and adjustments are needed; and red means that the initiative is in serious jeopardy.
“Status” ratings reflect the extent to which the agency has met the standards for overall success. Green means thatall standards have been met, yellow means mixed results, and red means that serious flaws exist.
In the last quarter of FY 2003, Commerce maintained green progress ratings for strategic management of human capital,improved financial performance, and expanded e-government and budget and performance integration. The Department wasassigned a yellow progress rating in competitive sourcing. During FY 2004, DM will re-emphasize the targets established inthe PMA-related performance measures, especially in the areas where progress was rated yellow, in order to ultimately achievegreen status ratings in all five initiatives.
During fiscal year 2003, the Department successfully completed substantial implementation of a single integrated financialmanagement system, the Commerce Administrative Management System (CAMS) in all participating bureaus except for NIST.With implementation of CAMS completed in the first quarter of FY2004 the Department will be able to meet, for the firsttime, the requirements of the CFO Act, and Office of Management and Budget (OMB) Circular A-127. With implementation,the Department will eliminate lack of an integrated financial system as a material weakness under the Federal Managers’Financial Integrity Act, and will be in compliance with the Federal Financial Management Improvement Act (FFMIA).
Information security remains a reportable condition for financial statement purposes, and continues to be a managementpriority. During FY 2003, the Department and its bureaus assessed all automated systems and undertook corrective actions toimprove IT security, focusing primarily on performing certification and accreditation of systems. For example, the CIOinspected system certification and accreditation packages for 100 percent of the Department’s critical and classified nationalsecurity systems. During FY 2004, the Department will ensure the implementation of effective certification and accreditationpractices for all Department information technology systems, critical and non-critical; will test system management,operational, and technical controls; and will fully implement the departmental IT security policies and minimumimplementation standards that were established in FY 2003.
Because the threat of terrorism is an abiding concern, the Department continues to focus on policy and program initiativesthat enhance our ability to respond to threats to personnel, assets, and operations nationwide. In FY 2003, a comprehensiveinternal review of the organizational structure and overall program effectiveness in the Office of Security (OSY) led to theimplementation of a new structure that fosters closer relationships with and information sharing between OSY headquartersand field personnel. In FY 2004 and 2005, a comprehensive continuity of operations plan (COOP) compliance and oversightprogram will be developed and tested.
D E P A R T M E N T A L M A N A G E M E N T
F Y 2 0 0 3 P E R F O R M A N C E R E P O R T392

The Secretary, as the Department’s chief executive officer; the Deputy Secretary, as the chief operating officer; anddepartmental offices also exercise managerial oversight and provide policy direction for the program activities carried out bythe bureaus. Many of the specific programmatic challenges benefiting from the Secretary and Deputy Secretary’s guidanceare highlighted in the “Management Discussion and Analysis” chapter, which appears earlier in this report, and discussed inthe bureau-specific chapters that follow.
Performance Results
In DM’s FY 2002 PAR submission, 22 measures were reported. Two of those measures have been discontinued and are notaddressed in this report. One measure targeted the use of the Internet to publicize opportunities to contract with theDepartment. As of FY 2002, online procurement was the only option available for publicizing these opportunities, eliminatingthe need to track the measure further. The other discontinued measure was the reduction of energy consumption. In FY 2002,the Department achieved the long-term, government-wide goal of 35 percent reduction in usage and received a Presidentialaward for leadership in energy management. DM believes that energy consumption no longer requires monitoring and will nolonger report on this measure.
In FY 2003, DM met or exceeded the targets for 15 out of the remaining 20 measures, or 75 percent of its objectives. In thefive instances in which targets were not met, DM has examined the causes and identified appropriate action. Details arediscussed under each Performance Goal.
DM met or exceeded targets for five out of the eight measures being tracked under Performance Goal 1. In addition to thesuccess reflected by these quantitative measures, there are qualitative indicators of DM’s progress, which are discussed below.
DM received an unqualified opinion on the Department’s consolidated financial statements for the fifth consecutive year, andis making significant progress in reducing the number of audit findings. With the exception of NIST (completed in the firstquarter of FY2004) implementation of CAMS was completed and specific steps undertaken to correct the IT securityweaknesses that were identified.
The Department’s acquisition reform initiatives have led to greater emphasis on acquisition planning, contracting strategies,and management of resulting contracts. DM has addressed concerns in these areas by expanding overall risk management andoversight provisions early in the acquisition phase. For example, the Department created a formal Acquisition Review Boardto examine all major departmental acquisitions. Increased scrutiny from Congress, OMB, and Office of Inspector General(OIG) regarding the use of purchase cards prompted DM to devise a purchase card improvement plan to insure the ethicaland prudent use of purchase cards by departmental cardholders. Mandatory refresher training is provided for all cardholdersand approving officials, and an inter-departmental team has been formed to evaluate future options for the Department’spurchase, travel, and fleet card programs. DM continues to encourage the professionalism and emphasize the careerdevelopment of the Department’s contracting workforce. Accordingly, Contracting Officer Technical Representative (COTR)certification requirements have been revised to stress accountability, performance measurement, and performancemanagement. A COTR assessment was completed and the results were incorporated into a draft COTR policy revision.A consistent Commerce COTR definition was developed, and COTR performance plans were aligned with assigned contractmanagement duties.
Finally, DM continued to make progress in ensuring the overall security and safety of its workforce, facilities, and programs.The Department-wide COOP was updated and tested, and plans for 16 departmental components were reviewed. Safetyeducation and awareness training activities were implemented, and safety reports, brochures, and a Web site were madeavailable.
D E P A R T M E N T A L M A N A G E M E N T
393F Y 2 0 0 3 P E R F O R M A N C E R E P O R T

Significant progress has been made in the area of strategic human capital management, as tracked under Performance Goal2. Targets for five out of six measures were met. Results of Office of Personnel Management’s (OPM) FY 2002 Federal HumanCapital Survey confirmed that the Department had met many of the conditions necessary to be characterized as a highperforming organization. Commerce met or exceeded the government norms with respect to strategic alignment of missionand objectives, leadership, employee satisfaction, performance culture, and job satisfaction. At various times throughout theyear, the Department was benchmarked by other federal agencies with respect to strategic human capital management,succession planning, and performance management. During FY 2003, the Department’s Senior Executive Service (SES)Candidate Development Program was announced and needs assessments for targeted employee groups were completed. Over1,200 e-learning courses were made available through the Department’s online Learning Management System (LMS), andemployee performance plans were linked with strategic goals and APP measures.
The Department has continued to strengthen acquisition and management of the IT technology resources needed to supportCommerce’s program goals. During FY 2003, operating units continued to improve IT management overall, including thoseactivities covered by Performance Goal 3. Special emphasis was placed on ensuring the confidentiality, availability, andintegrity of the Department’s IT resources. Additionally, Commerce has invested human and capital resources in thee-government initiatives that support the PMA. Overall, five and one-half of the six targets were met and substantial progresswas achieved in the other half of one target area. The targets for FY 2004 have not been changed and remain ambitious; DMwill, as described below in the discussion of Performance Goal 3b, work closely with the bureaus throughout the year to ensurethat the targets are met.
D E P A R T M E N T A L M A N A G E M E N T
F Y 2 0 0 3 P E R F O R M A N C E R E P O R T394

Targets and Performance SummarySee individual Performance Goal section for further description of each measure.
The Department re-examined the performance measures used to monitor its progress in providing policy oversight andadministrative support services, which represent the bulk of DM activity. Changes were made to better reflect DM’s mostsignificant activities and to correspond more precisely with the government-wide management initiatives established in thePMA. The measures summarized below reflect that effort.
Performance Goal 1: Ensure Effective Resource Stewardship in Support of the Commerce
Department’s Programs
FY 2000 FY 2001 FY 2002 FY 2003 FY 2003 FY 2003 FY 2003 Measure Actual Actual Actual Target Actual Met Not Met
Clean audit opinion obtained on 100% 100% Yes Yes Yes XCommerce consolidated financial statements
Deploy Commerce-wide integrated System System System Deploy system System fully X1
financial management system deployed in deployed in deployed in in 13 bureaus; deployed in four bureaus. eight bureaus. 10 bureaus. complete de- 10 bureaus.
partment-wide deployment.
Implement competitive sourcing Inventory Inventory 1% completed Convert or Combined target for Xsubmitted submitted and manage- complete com- FY 2002/2003 was on 6/30/00. on 6/29/01. ment plan in petitions on 1203 FTEs2. Com-
place to ac- 10% of com- pleted 534 FTEs2, complish mercial FTE2 or 6.6% of new target cumulative positions. of 800 FTEs2.goal for FY 2002/2003.
Funds obligated through N/A 25% of total 31% of total 30% of total 24% of $605M Xperformance-based contracting procurement procurement procurement
funds. funds. funds.
Small purchases made using 88% of 92% of 95% of 90% of 97% of Xcredit cards actions actions actions actions actions
below below below below below $25,000 $25,000 $25,000 $25,000 $25,000
Percentage of total obligations 34% 50% 51% 40% 45% as of October Xawarded as contracts to small 2003; final results not businesses available from Federal
Procurement Data System (FPDS) until second quarter FY 2004.
Ensure a secure workplace for all Conducted 10 Conducted 32 Department Conduct 12 Reviewed COOP Plans XCommerce employees studies to studies of clas- continuity of compliance for 16 Commerce com-
verify proper sified compu- operations reviews of ponents including the maintenance ter systems. plan (COOP) security pro- Office of the Secretary of safes for established; grams and (OS), Office of Inspector classified 47 risk assess- classified General (OIG), and U.S. materials. ments com- systems. Patent and Trademark
pleted. Office (USPTO). Also, conducted compliance reviews of more than 450 security containers and 550 sensitive doc-uments. In addition, conducted 40 risk assessment surveys.
D E P A R T M E N T A L M A N A G E M E N T
395F Y 2 0 0 3 P E R F O R M A N C E R E P O R T
(continued)

Performance Goal 1: Ensure Effective Resource Stewardship in Support of the Commerce
Department’s Programs (cont.)
FY 2000 FY 2001 FY 2002 FY 2003 FY 2003 FY 2003 FY 2003 Measure Actual Actual Actual Target Actual Met Not Met
Ensure a safe workplace for all N/A N/A Safety Action Plan devel- Employee Employee education and XCommerce employees oped, reinvigorated the Com- education awareness training activities
merce Safety Council to and aware- were implemented, including communicate safety issues, ness pro- safety awareness training at the appointed a new designated grams are Senior Executive Service (SES) agency safety and health in place. and supervisory levels and official to spearhead safety evacuchair training. Implemented efforts, established perform- safety Web site, published safety ance element for Senior reports, and distributed safety Executives, and developed brochures.Web-based safety aware-ness training program.
G
D E P A R T M E N T A L M A N A G E M E N T
F Y 2 0 0 3 P E R F O R M A N C E R E P O R T396
D E P A R T M E N T A L M A N A G E M E N T
397F Y 2 0 0 3 P E R F O R M A N C E R E P O R T
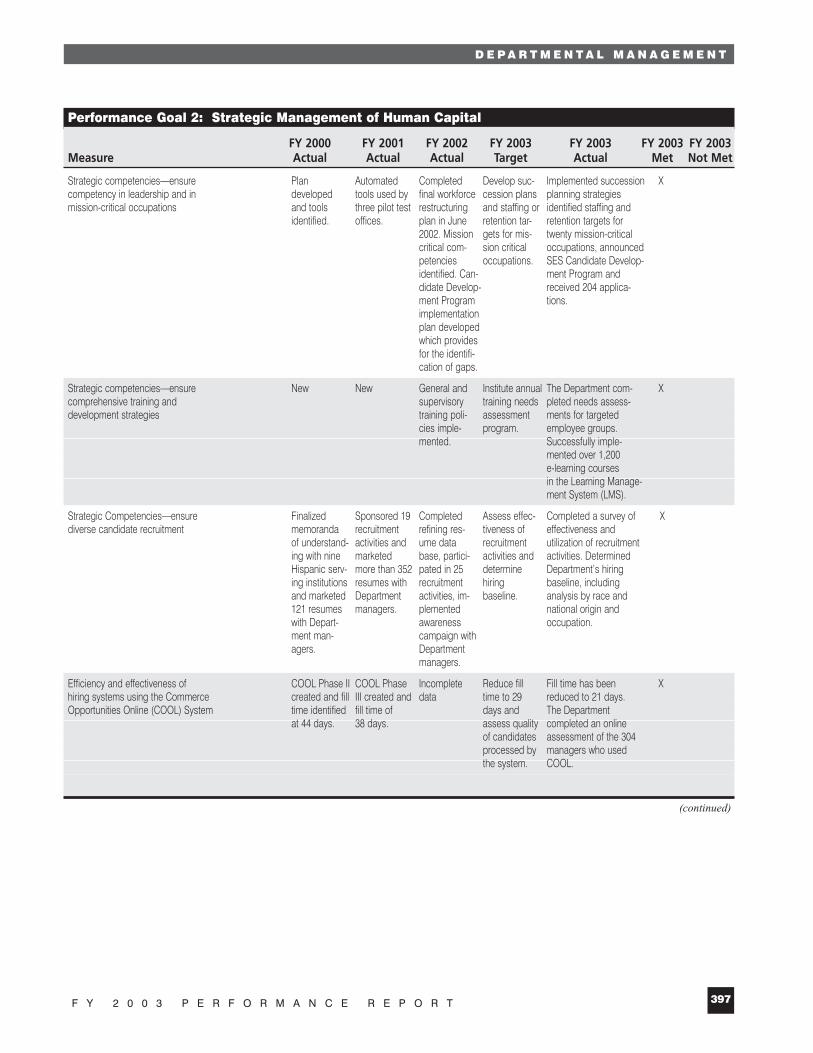
Performance Goal 2: Strategic Management of Human Capital
FY 2000 FY 2001 FY 2002 FY 2003 FY 2003 FY 2003 FY 2003 Measure Actual Actual Actual Target Actual Met Not Met
Strategic competencies—ensure Plan Automated Completed Develop suc- Implemented succession Xcompetency in leadership and in developed tools used by final workforce cession plans planning strategies mission-critical occupations and tools three pilot test restructuring and staffing or identified staffing and
identified. offices. plan in June retention tar- retention targets for 2002. Mission gets for mis- twenty mission-critical critical com- sion critical occupations, announced petencies occupations. SES Candidate Develop-identified. Can- ment Program and didate Develop- received 204 applica-ment Program tions.implementation plan developed which provides for the identifi-cation of gaps.
Strategic competencies—ensure New New General and Institute annual The Department com- Xcomprehensive training and supervisory training needs pleted needs assess-development strategies training poli- assessment ments for targeted
cies imple- program. employee groups. mented. Successfully imple-
mented over 1,200 e-learning courses in the Learning Manage-ment System (LMS).
Strategic Competencies—ensure Finalized Sponsored 19 Completed Assess effec- Completed a survey of Xdiverse candidate recruitment memoranda recruitment refining res- tiveness of effectiveness and
of understand- activities and ume data recruitment utilization of recruitment ing with nine marketed base, partici- activities and activities. Determined Hispanic serv- more than 352 pated in 25 determine Department’s hiring ing institutions resumes with recruitment hiring baseline, including and marketed Department activities, im- baseline. analysis by race and 121 resumes managers. plemented national origin and with Depart- awareness occupation.ment man- campaign with agers. Department
managers.
Efficiency and effectiveness of COOL Phase II COOL Phase Incomplete Reduce fill Fill time has been Xhiring systems using the Commerce created and fill III created and data time to 29 reduced to 21 days. Opportunities Online (COOL) System time identified fill time of days and The Department
at 44 days. 38 days. assess quality completed an online of candidates assessment of the 304 processed by managers who used the system. COOL.
(continued)

Performance Goal 2: Strategic Management of Human Capital (cont.)
FY 2000 FY 2001 FY 2002 FY 2003 FY 2003 FY 2003 FY 2003 Measure Actual Actual Actual Target Actual Met Not Met
Increase the alignment of performance Combined Tracking sys- All SES were For each Commerce GS and Xmanagement with mission performance tem for align- placed on new bureau general equivalent performance accomplishment management ing ratings with performance schedule or management systems
and awards mission ac- management equivalent are linked through the handbook complishment system in June. performance use of performance completed. or overall rec- The system system, ensure metrics tied to the APP.
ognition links manage- each system designed. ment of the explicitly links
President’s employee per-Management formance Agenda (PMA), plans with individual and strategic goals organizational and annual performance performance and results. plan (APP)
measures.
Implement a telecommuting program Three pilot 13.5% of Total 18.9% of total 75% of eligible 38.7% of eligible Xprograms workforce workforce workforce is workforce participated established. currently tele- participates in involved in in regular or episodic
commuting. regular or program. telework as of Q4, episodic FY 2003.teleworking.
D E P A R T M E N T A L M A N A G E M E N T
F Y 2 0 0 3 P E R F O R M A N C E R E P O R T398

D E P A R T M E N T A L M A N A G E M E N T
399F Y 2 0 0 3 P E R F O R M A N C E R E P O R T
Performance Goal 3: Acquire and Manage the Technology Resources to Support Program Goals
FY 2000 FY 2001 FY 2002 FY 2003 FY 2003 FY 2003 FY 2003 Measure Actual Actual Actual Target Actual Met Not Met
Transactions converted to 16 28 67 90 107 Xelectronic format (13% of (23% of (54% of (42% of (50% of
123 total) 123 total) 123 total) 214 total) 214 total)
Information Technology (IT) 1 2 41% at 3 55% at 3 73% at 3 Xplanning and investment or higher or higher or higherreview program maturity 20% at 4 5% at 4 (scale of 0-5)3 or higher or higher
Information Technology (IT) 1 1.5 82% at 2 90% at 2 91% at 2 Xarchitecture program maturity or higher or higher or higher(scale of 0-5)3 59% at 3 66% at 3 77% at 3
or higher or higher or higher
Information Technology (IT) <1 100% at 1 70% at 2 90% at 2 100% at 2 Xsecurity program maturity or higher or higher or higher or higher(scale of 0-5)3 60% at 2 48% at 3 70% at 3 79% at 3
or higher or higher or higher or higher;26% at 4 7% at 4or higher or higher
Percentage of Information 21% 61% 98% 100% 100% XTechnology (IT) system security plans completed
Percentage of unsuccessful N/A 85% 85% 85% Xintrusion attempts (1,380 of (2,678 of (560 of
1,620 3,160 pro- 661 Intrusion jected intrusion Attempts) intrusion attempts)
attempts)
1 The system was fully deployed in 13 bureaus in October 2003.2 Full time equivalent.
3 Maturity models are industry-accepted standards to assess progress toward achieving IT goals. See the description provided below in the discussion of PerformanceGoal 3.
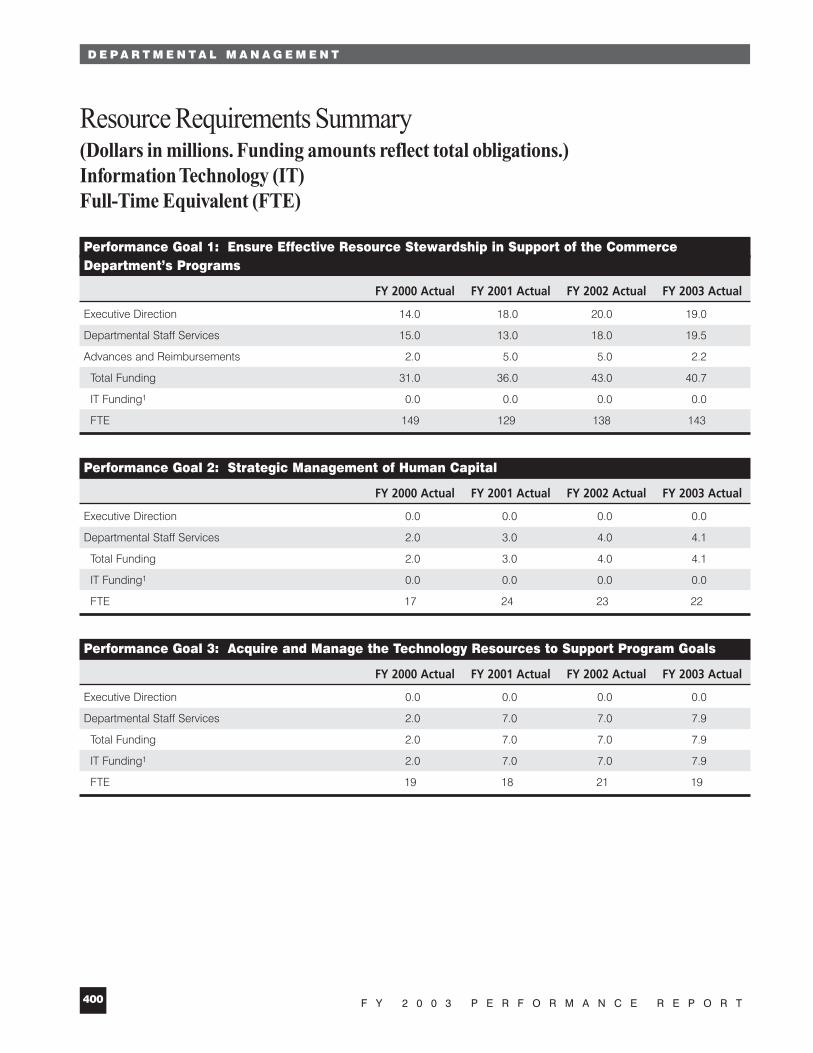
Resource Requirements Summary(Dollars in millions. Funding amounts reflect total obligations.)Information Technology (IT)Full-Time Equivalent (FTE)
Performance Goal 1: Ensure Effective Resource Stewardship in Support of the Commerce Department’s Programs
FY 2000 Actual FY 2001 Actual FY 2002 Actual FY 2003 Actual
Executive Direction 14.0 18.0 20.0 19.0
Departmental Staff Services 15.0 13.0 18.0 19.5
Advances and Reimbursements 2.0 5.0 5.0 2.2
Total Funding 31.0 36.0 43.0 40.7
IT Funding1 0.0 0.0 0.0 0.0
FTE 149 129 138 143
Performance Goal 2: Strategic Management of Human Capital
FY 2000 Actual FY 2001 Actual FY 2002 Actual FY 2003 Actual
Executive Direction 0.0 0.0 0.0 0.0
Departmental Staff Services 2.0 3.0 4.0 4.1
Total Funding 2.0 3.0 4.0 4.1
IT Funding1 0.0 0.0 0.0 0.0
FTE 17 24 23 22
Performance Goal 3: Acquire and Manage the Technology Resources to Support Program Goals
FY 2000 Actual FY 2001 Actual FY 2002 Actual FY 2003 Actual
Executive Direction 0.0 0.0 0.0 0.0
Departmental Staff Services 2.0 7.0 7.0 7.9
Total Funding 2.0 7.0 7.0 7.9
IT Funding1 2.0 7.0 7.0 7.9
FTE 19 18 21 19
D E P A R T M E N T A L M A N A G E M E N T
F Y 2 0 0 3 P E R F O R M A N C E R E P O R T400
D E P A R T M E N T A L M A N A G E M E N T
401F Y 2 0 0 3 P E R F O R M A N C E R E P O R T
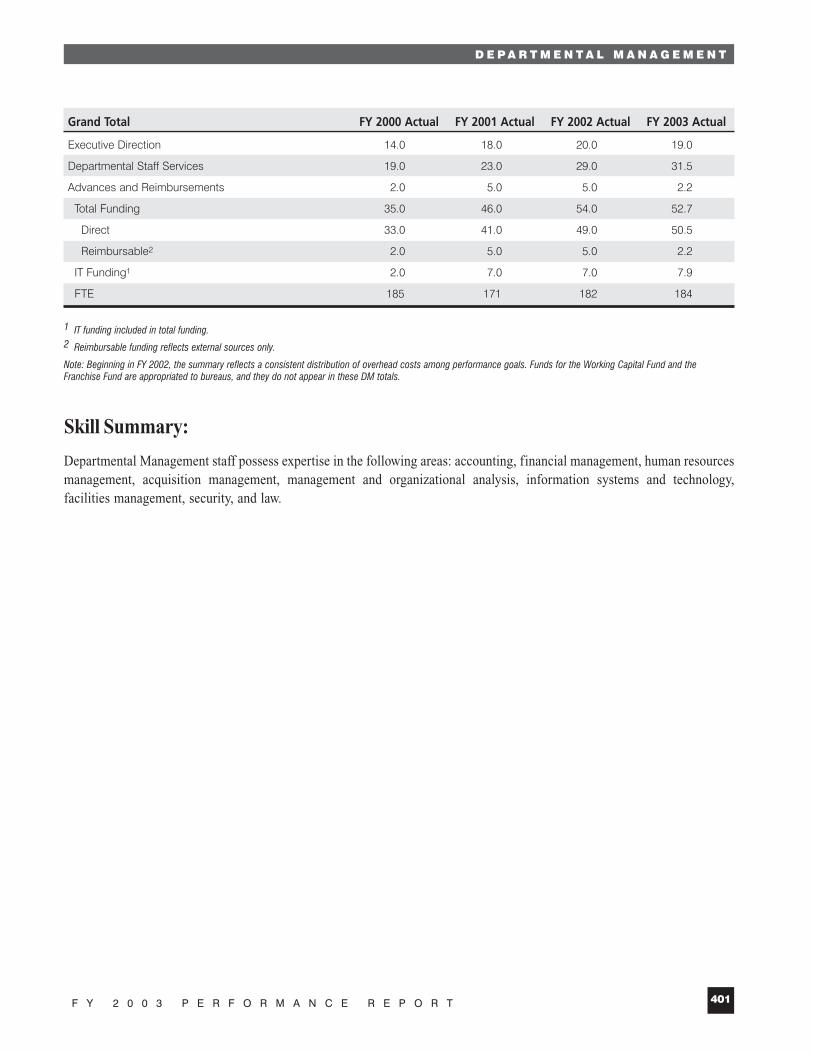
Grand Total FY 2000 Actual FY 2001 Actual FY 2002 Actual FY 2003 Actual
Executive Direction 14.0 18.0 20.0 19.0
Departmental Staff Services 19.0 23.0 29.0 31.5
Advances and Reimbursements 2.0 5.0 5.0 2.2
Total Funding 35.0 46.0 54.0 52.7
Direct 33.0 41.0 49.0 50.5
Reimbursable2 2.0 5.0 5.0 2.2
IT Funding1 2.0 7.0 7.0 7.9
FTE 185 171 182 184
1 IT funding included in total funding.2 Reimbursable funding reflects external sources only.
Note: Beginning in FY 2002, the summary reflects a consistent distribution of overhead costs among performance goals. Funds for the Working Capital Fund and theFranchise Fund are appropriated to bureaus, and they do not appear in these DM totals.
Skill Summary:
Departmental Management staff possess expertise in the following areas: accounting, financial management, human resourcesmanagement, acquisition management, management and organizational analysis, information systems and technology,facilities management, security, and law.
FY 2003 Performance GoalsPerformance Goal 1: Ensure Effective Resource Stewardship inSupport of the Commerce Department’s Programs
Corresponding Strategic Goal
Management Integration Goal: Strengthen management at all levels.
Rationale for Performance Goal
The Department of Commerce must have the capacity to do business as successfully as possible with the public and its partneragencies, both as a $5 billion, worldwide enterprise and as an integrated set of individual programs. This requires that DMidentify, adopt, and maintain the business practices needed to successfully operate any such organization; use its resourceswisely; and effectively implement the laws that affect the Department. Because this performance goal inherently encompassesa wide range of administrative and operational tasks, the measures used to assess DM’s progress are by necessityhighly diverse.
FY 2003 Performance
Under Performance Goal 1, “Ensure Effective Resource Stewardship in Support of the Commerce Department’s Programs,”six out of eight targets were met, indicating significant forward movement in a wide range of administrative areas.
Note: Measure 1b, which tracks deployment of the Commerce-wide integrated financial system, was not included in theFY 2004-2008 APP because the system was substantially deployed by the end of FY 2003 and was discontinued as a goal.However, these results are reported under measure 1b, below. For this reason, the measure numbers under Performance Goal 1in this report do not match those in the APP.
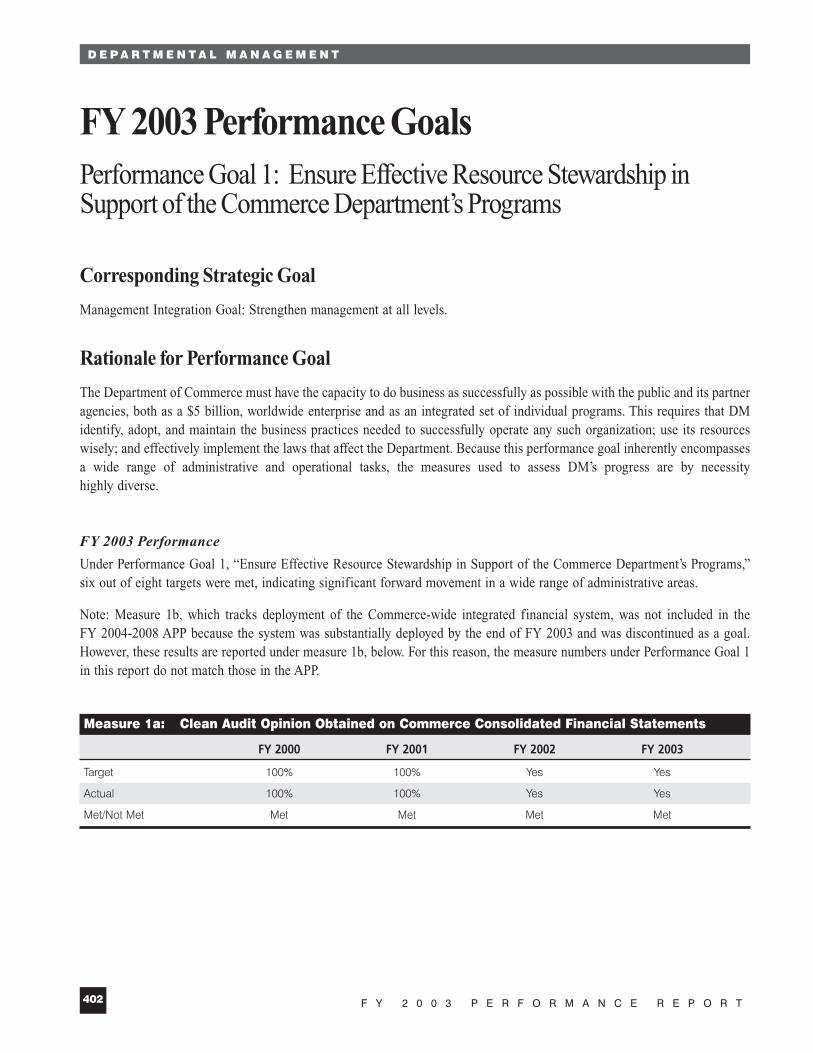
Measure 1a: Clean Audit Opinion Obtained on Commerce Consolidated Financial Statements
FY 2000 FY 2001 FY 2002 FY 2003
Target 100% 100% Yes Yes
Actual 100% 100% Yes Yes
Met/Not Met Met Met Met Met
D E P A R T M E N T A L M A N A G E M E N T
F Y 2 0 0 3 P E R F O R M A N C E R E P O R T402

D E P A R T M E N T A L M A N A G E M E N T
403F Y 2 0 0 3 P E R F O R M A N C E R E P O R T
Explanation of Measure
The Department continues to give high priority to improving financial management by strengthening the integrity of financialoperations and ensuring the accuracy of its financial records. Key laws such as the CFO Act, Government Management ReformAct, FFMIA, and Government Performance and Results Act of 1993 (GPRA) establish the standards for financial operations.Timely and reliable financial information is necessary to give stakeholders and decisionmakers confidence in theway Commerce manages its resources, and it is key to ensuring full accountability to U.S. taxpayers for the expenditure offederal funds.
The method used to measure DM’s success in this effort has been modified slightly but its objective remains the same. Priorto FY 2002, DM measured its progress in this area as the percentage of funding covered by a clean audit. DM is now assessingits ability to manage its financial resources based on whether the Department as a whole receives a clean audit opinion on itsconsolidated financial statements. This all-or-none approach emphasizes the importance of achieving overall success.
FY 2003 Performance
For the fifth consecutive year, the Department of Commerce received an unqualified opinion on its consolidated financialstatements.
Measure 1b: Deploy Commerce-wide Integrated Financial Management System
FY 2000 FY 2001 FY 2002 FY 2003
Target1 4 8 10 13
Actual 4 8 10 10
Met/Not Met Met Met Met Not Met2
1 Office of Computer Services Franchise Fund was previously considered to be, for this purpose, an independent bureau. It is now considered to be a part of the Office of theSecretary (OS). Targets and performance levels have been modified to reflect this adjustment.
2 The system was fully deployed in 13 bureaus in October 2003.
Explanation of Measure
This measure tracks the Department’s progress in implementing the requirements of the CFO Act, the joint financialmanagement improvement program, and other standards for an integrated financial system. A modern, Department-widefinancial management system is essential to strong financial management. Deployment of CAMS ensures fiscal accountabilityand provides program managers with the timely, accurate financial data needed for sound decision-making. Since the systemwas substantially deployed across the Department at the end of FY 2003 and fully deployed in October 2003, this measurewill be discontinued for FY 2004.

FY 2003 Performance
CAMS replaced non-compliant financial systems within the Department. CAMS was implemented at 10 departmental entitiesby the end of FY 2003 and implemented to 13 entities in October 2003 (first quarter, FY 2004). CAMS provides reliable andtimely information within a sophisticated security infrastructure. The system is capable of producing both financial and budgetreports from information generated within the financial management system. CAMS includes a Core Financial Systeminterfaced with administrative systems for small purchases, bankcards, a data warehouse and time reporting/labor costdistribution module, collectively called Core CAMS.
Measure 1c: Implement Competitive Sourcing
FY 2000 FY 2001 FY 2002 FY 2003
Target Complete inventory of Complete inventory Convert or complete Convert or complete commercial FTE1 of commercial FTE1 competitions on 5% competitions on 10% of positions due by positions due by of commercial FTE1 commercial FTE1 positions.6/30/00. 6/30/01. positions.
Actual Inventory submitted Inventory submitted 1% completed and Combined target for on 6/30/00. on 6/29/01. management plan in FY 2002/2003 was
place to accomplish 1203 FTEs1. Completed cumulative goal for 534 FTEs1, or 6.6% of new FY 2002/2003. target of 800 FTEs1.
Met/Not Met Met Met Not Met Not Met
1 FTE – Full-time equivalent.
Explanation of Measure
The FAIR Act requires all federal agencies to provide the OMB with a timely inventory of the activities performed bygovernment employees that could be carried out by commercial sources. The Department has developed an annual reportingprocess that meets this requirement. In FY 2001 and FY 2002, goals were established by OMB for conducting competitionsof these commercial activities between government’s most efficient organizations and private sector providers in order to bestuse the taxpayer’s dollars. In June 2003, OMB worked with Commerce to establish new and more realistic goals based onsupport of the missions of the Department.
FY 2003 Performance
In the OMB-led “Where We Would Be Proud to Be” project of June 2003, Commerce adopted a goal of completing or initiatingcompetitions for 10 percent of the commercial activities on the FY 2000 FAIR Act inventory. This goal is somewhat lowerthan the previous (15 percent) goal; the adjustment was made in response to the experience of the bureaus in pursuing thecompetitive sourcing goals established in FY 2002-2003. Meeting the competitive sourcing goal for FY 2003 has been subjectto a number of unanticipated impediments, including congressional interest in NIST competitive sourcing actions (affecting308 full time equivalent [FTE]), challenges to NOAA’s FAIR Act inventory (affecting 157 FTE), and international legalrestrictions involving International Trade Administration (ITA) actions (affecting 480 FTE).
Commerce is in the process of completing management documents for competitive sourcing based on guidance contained inthe revised OMB Circular No. A-76, “Performance of Commercial Activities,” which was issued in May 2003. The Commerceexecutive briefing for competitive sourcing is being updated prior to presentation to departmental leaders.
D E P A R T M E N T A L M A N A G E M E N T
F Y 2 0 0 3 P E R F O R M A N C E R E P O R T404
D E P A R T M E N T A L M A N A G E M E N T
405F Y 2 0 0 3 P E R F O R M A N C E R E P O R T
The Commerce Plan for meeting the President’s long-term goal of competing 50 percent of the commercial activities in theDepartment is in development and will be provided to OMB by the end of the year.
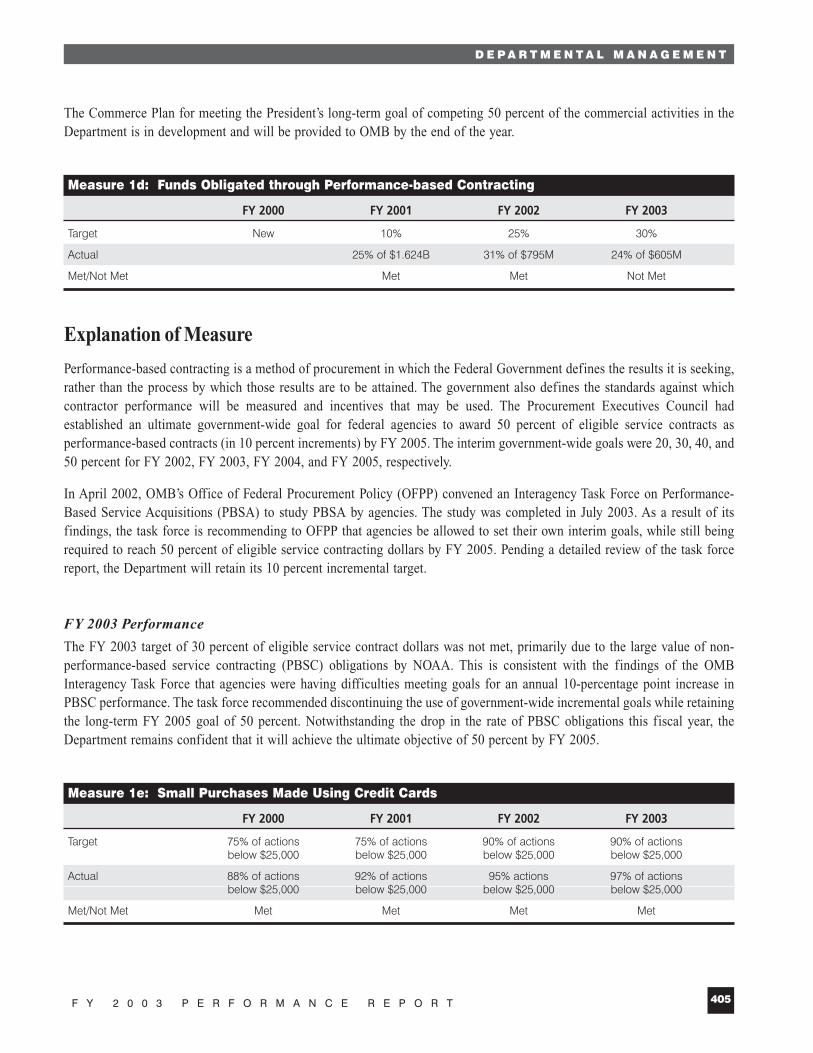
Measure 1d: Funds Obligated through Performance-based Contracting
FY 2000 FY 2001 FY 2002 FY 2003
Target New 10% 25% 30%
Actual 25% of $1.624B 31% of $795M 24% of $605M
Met/Not Met Met Met Not Met
Explanation of Measure
Performance-based contracting is a method of procurement in which the Federal Government defines the results it is seeking,rather than the process by which those results are to be attained. The government also defines the standards against whichcontractor performance will be measured and incentives that may be used. The Procurement Executives Council hadestablished an ultimate government-wide goal for federal agencies to award 50 percent of eligible service contracts asperformance-based contracts (in 10 percent increments) by FY 2005. The interim government-wide goals were 20, 30, 40, and50 percent for FY 2002, FY 2003, FY 2004, and FY 2005, respectively.
In April 2002, OMB’s Office of Federal Procurement Policy (OFPP) convened an Interagency Task Force on Performance-Based Service Acquisitions (PBSA) to study PBSA by agencies. The study was completed in July 2003. As a result of itsfindings, the task force is recommending to OFPP that agencies be allowed to set their own interim goals, while still beingrequired to reach 50 percent of eligible service contracting dollars by FY 2005. Pending a detailed review of the task forcereport, the Department will retain its 10 percent incremental target.
FY 2003 Performance
The FY 2003 target of 30 percent of eligible service contract dollars was not met, primarily due to the large value of non-performance-based service contracting (PBSC) obligations by NOAA. This is consistent with the findings of the OMBInteragency Task Force that agencies were having difficulties meeting goals for an annual 10-percentage point increase inPBSC performance. The task force recommended discontinuing the use of government-wide incremental goals while retainingthe long-term FY 2005 goal of 50 percent. Notwithstanding the drop in the rate of PBSC obligations this fiscal year, theDepartment remains confident that it will achieve the ultimate objective of 50 percent by FY 2005.
Measure 1e: Small Purchases Made Using Credit Cards
FY 2000 FY 2001 FY 2002 FY 2003
Target 75% of actions 75% of actions 90% of actions 90% of actions below $25,000 below $25,000 below $25,000 below $25,000
Actual 88% of actions 92% of actions 95% actions 97% of actions below $25,000 below $25,000 below $25,000 below $25,000
Met/Not Met Met Met Met Met

Explanation of Measure
In FY 2000, the Procurement Executives Council adopted a new government-wide acquisition performance measurementprogram, which included establishing a target for using government-issued credit cards for transactions below the smallpurchase threshold. The government-wide target is 75 percent of all transactions under $25,000. This measure was pilot-testedin FY 2000. The first year of full implementation was FY 2001.
During the last two years, beginning in FY 2002, the government’s use of purchase cards for small purchases has beensubjected to significant scrutiny from Congress and OMB. Recognizing the heightened congressional and public concerns,the Department has implemented more guidelines, controls, and conditions for their use. Notwithstanding these increasedcontrols, we retained our FY 2003, 2004, and 2005 goals of 90 percent of transactions below $25,000.
FY 2003 Performance
During FY 2003, Commerce processed 341,750 acquisitions of $25,000 or less. Of these, the Department processed 330,900transactions, or 97 percent, using purchase cards. Commerce continues to exceed the government target of 75 percent becauseit has found this approach minimizes the lead time involved in obtaining needed products, requires less burdensomeadministrative handling, and reduces the administrative cost of acquiring goods and services.
Measure 1f: Increase Percentage of Total Obligations Awarded as Contracts to Small Businesses
FY 2000 FY 2001 FY 2002 FY 2003
Target 40% 40% 35% 40%
Actual 34% 50% 51% 45% as of October 2003; final results not available from the Federal Procurement Data System (FPDS) until second quarter FY 2004.
Met / Not Met Not Met Met Met Met
Explanation of Measure
This measure monitors the Department’s ability to increase opportunities for small businesses to participate in Commerceacquisitions. Historically, this has included small, small disadvantaged, 8(a), and women-owned businesses. In FY 2001, threenew categories were added. These are HUBZone, veteran-owned, and service-disabled veteran-owned small businesses(a subset of veteran-owned small businesses). Every two years, the Small Business Administration (SBA) negotiatesprocurement goals with each federal agency in an effort to increase contract and subcontract awards to small businesses.
Through FY 2001, DM reported under GPRA on the percent of awards made in three categories: (1) small businesses,(2) women-owned businesses, and (3) minority-owned businesses, which included small disadvantaged and 8(a) businesses.To avoid making this measure overly cumbersome by adding additional categories, beginning with FY 2002, Commercesimplified the method used to track its GPRA progress. It now reports on the percentage of procurement funds awarded tothe umbrella group described as small businesses.
D E P A R T M E N T A L M A N A G E M E N T
F Y 2 0 0 3 P E R F O R M A N C E R E P O R T406
D E P A R T M E N T A L M A N A G E M E N T
407F Y 2 0 0 3 P E R F O R M A N C E R E P O R T
FY 2003 Performance
In FY 2003, SBA established a government-wide small business goal of 23 percent of total contract awards. The Commerce-specific target established by SBA was 35 percent. The time line for producing the PAR precludes the Department fromproviding final FY 2003 results for this measure since complete data are not available. The Department is in the process ofswitching to a new automated system for tracking these data, and final results will be available in mid-to-late second quarter,FY 2004. Therefore, the Department is reporting data as of October 10, 2003. However, because of the Department’s strongcommitment to maximizing small business participation in its procurement program, it anticipates that it will exceed theFY 2003 target, as it has in the two preceding fiscal years. The data available at the time this report was prepared indicatedthat FY 2003 small-business-obligated dollars amount to approximately 45 percent of total contract obligations.
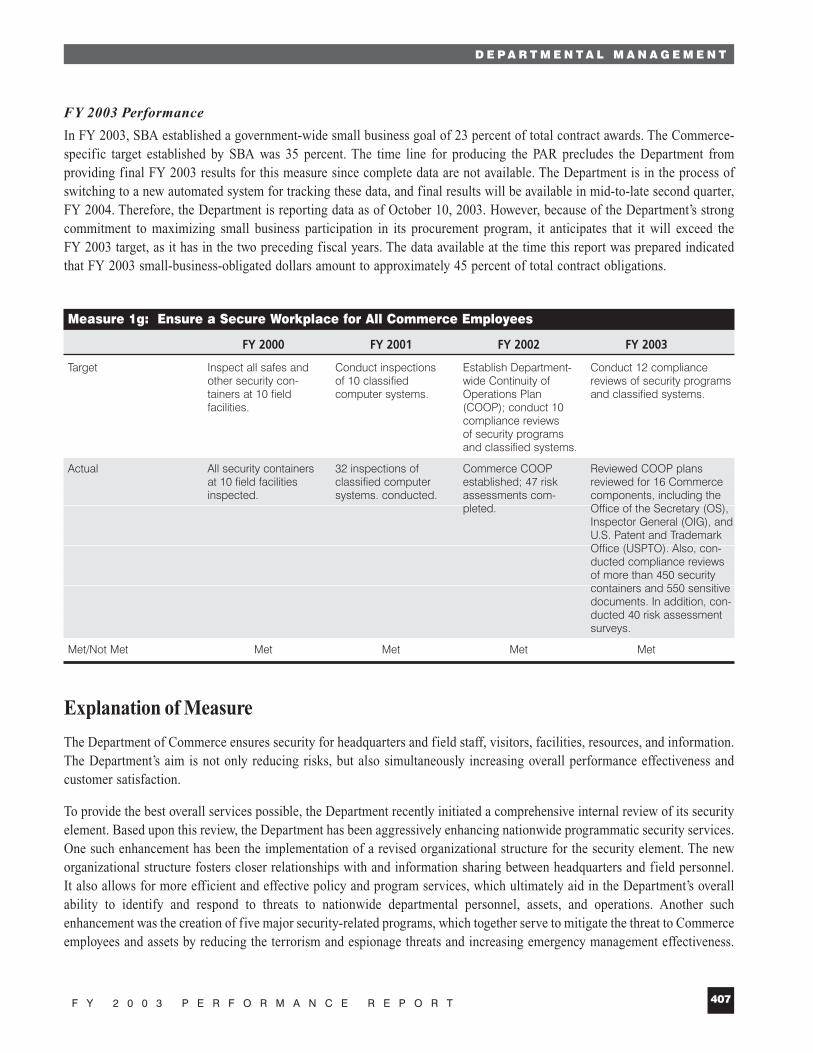
Measure 1g: Ensure a Secure Workplace for All Commerce Employees
FY 2000 FY 2001 FY 2002 FY 2003
Target Inspect all safes and Conduct inspections Establish Department- Conduct 12 compliance other security con- of 10 classified wide Continuity of reviews of security programstainers at 10 field computer systems. Operations Plan and classified systems.facilities. (COOP); conduct 10
compliance reviews of security programs and classified systems.
Actual All security containers 32 inspections of Commerce COOP Reviewed COOP plans at 10 field facilities classified computer established; 47 risk reviewed for 16 Commerceinspected. systems. conducted. assessments com- components, including the
pleted. Office of the Secretary (OS), Inspector General (OIG), and U.S. Patent and Trademark Office (USPTO). Also, con-ducted compliance reviews of more than 450 security containers and 550 sensitive documents. In addition, con-ducted 40 risk assessment surveys.
Met/Not Met Met Met Met Met
Explanation of Measure
The Department of Commerce ensures security for headquarters and field staff, visitors, facilities, resources, and information.The Department’s aim is not only reducing risks, but also simultaneously increasing overall performance effectiveness andcustomer satisfaction.
To provide the best overall services possible, the Department recently initiated a comprehensive internal review of its securityelement. Based upon this review, the Department has been aggressively enhancing nationwide programmatic security services.One such enhancement has been the implementation of a revised organizational structure for the security element. The neworganizational structure fosters closer relationships with and information sharing between headquarters and field personnel.It also allows for more efficient and effective policy and program services, which ultimately aid in the Department’s overallability to identify and respond to threats to nationwide departmental personnel, assets, and operations. Another suchenhancement was the creation of five major security-related programs, which together serve to mitigate the threat to Commerceemployees and assets by reducing the terrorism and espionage threats and increasing emergency management effectiveness.
Additionally, the Department has identified and continues to work on several strategies to improve our performance. Some ofthese strategies include:
Identifying and implementing countermeasures aimed at reducing the vulnerability to high-threat facilities;
Conducting awareness and prevention briefings to increase customer knowledge of general threats; and
Enhancing liaison relationships with other federal, state, and local government entities involved in emergencymanagement capacities.
Over time, these and other departmental efforts will be measured through a GPRA-compliant, outcome-based performancemeasure focused on documenting the nationwide reduction of the threat to Commerce employees and assets. The Departmentis committed to quickly establishing a performance baseline. It is from this baseline that we will measure the effectivenesswith which future programmatic efforts reduce the overall threat risk to the Department.
Originally, it was anticipated that this measure would be revised to show a new baseline and out-year targets beginning withthe FY 2005 APP. However, this information will now be presented in the FY 2006 APP to allow additional time for thecollection and validation of data used in the development of the performance baseline. In the interim, the Department willcontinue to collect data and report on previously identified measures. Accordingly, the Department will maintain itscompliance reviews of security programs and continue performing security risk assessment surveys, completing a minimumof 40 such assessments during the reporting period. Additionally, we will continue to strengthen our COOP planning andemergency preparedness efforts; specifically reporting on progress made in overseeing the testing and evaluation of thedepartmental and bureau-level COOP plans.
During these times of change, the Department will continue to remain attentive to key issues that will help us effectively fulfillour mission and focus our key management personnel on the service offerings necessary to make the Department of Commercea more secure work environment for all.
FY 2003 Performance
As part of the government-wide effort to ensure the security and continuity of operations across government, DM continuedto increase the emphasis on protecting the Commerce workforce, facilities, and classified systems. DM worked with thebureaus to update and test a Commerce-wide COOP plan and reviewed plans for 16 departmental components including theOS, OIG, and the U.S. Patent and Trademark Office (USPTO). Additionally, DM also conducted 40 anti-terrorism riskassessments and reviewed security procedures for more than 450 security containers and 550 sensitive documents to evaluatethe security of Commerce operations. Managers of the affected areas have been advised of the outcome of these reviews andinstructed to take any corrective action determined to be appropriate.
D E P A R T M E N T A L M A N A G E M E N T
F Y 2 0 0 3 P E R F O R M A N C E R E P O R T408

D E P A R T M E N T A L M A N A G E M E N T
409F Y 2 0 0 3 P E R F O R M A N C E R E P O R T
Measure 1h: Ensure a Safe Workplace for All Commerce Employees
FY 2000 FY 2001 FY 2002 FY 2003
Target New New Safety infrastructure, accountability Employee education and awareness systems, and supervisory training programs are in place.programs are in place.
Actual Safety action plan developed, Employee education and awareness reinvigorated the Commerce Safety training activities were implemented, Council to communicate safety issues, including safety awareness training at theappointed a new designated agency Senior Executive Service (SES) and super-safety and health official to spearhead visory levels and evacuchair training. safety efforts, established performance Implemented safety Web site, published element for Senior Executives, and safety reports, and distributed safety developed Web-based safety aware- brochures.ness training program.
Met/Not Met Met Met
Explanation of Measure
The Department is using this measure to highlight its effort to reinvigorate its safety program to ensure that employees havea safe environment in which to carry out their responsibilities.
FY 2003 Performance
The Department met its FY 2003 targets for providing safety education and awareness programs. A special safety-trainingmodule for SES employees was developed, recorded on CD-ROM discs, and disseminated. This training module, whichincludes an introduction by Deputy Secretary Bodman, itemizes critical safety and health responsibilities of the Department’ssenior managers and provides guidance on how to carry out these responsibilities. Extensive safety and health guidance on awide range of topics is provided monthly to all Commerce employees via broadcast e-mails. In addition, the Office of HumanResources Management (OHRM) continues to produce and post material on the Department’s Web site about current safetyissues, such as SARS, handling of irradiated mail, and other such issues. The monthly Safety Report, which is posted on theDepartment’s Intranet, provides accident data, information regarding Department-wide safety issues, new developments insafety and health initiatives, and other important information about the Department’s safety program. Special safety awarenesstraining programs have been developed and are presented on request for managers in the Hoover Building. Additionally,training in cardiopulmonary resuscitation and the use of evacuation chairs for disabled employees was provided for employeesin the Hoover Building.
In FY 2003, the Department instituted an aggressive response procedure to follow up with corrective action for all reportedaccident cases. There has been a notable reduction from FY 2002 to FY 2003 in total case incidence rates in OS, Bureau ofEconomic Analysis (BEA), Bureau of Industry and Security, Economic Development Administration, ITA, NationalTelecommunications and Information Administration, and USPTO. The National Technical Information Service maintained arecord of zero incidents to date in FY 2003.1
1 Safety data reported through July 2003, Department of Commerce Safety Office
Program Evaluation
Commerce uses reviews and reports generated by OIG, OMB, General Accounting Office (GAO), other congressionalorganizations, government-wide task forces, and other objective sources to evaluate Performance Goal 1 activities.For example, DM works closely with OMB to implement the five government-wide management initiatives established in thePMA and is rated quarterly on its success in implementing them. In addition, many of the laws pertaining to these activitieshave separate reporting requirements, which highlight both strengths and weaknesses of Commerce’s administrative functions.The Department uses the results of these efforts, as needed, to assess achievement of performance targets.
D E P A R T M E N T A L M A N A G E M E N T
F Y 2 0 0 3 P E R F O R M A N C E R E P O R T410

D E P A R T M E N T A L M A N A G E M E N T
411F Y 2 0 0 3 P E R F O R M A N C E R E P O R T
Performance Goal 2: Strategic Management of Human Capital
Corresponding Strategic Goal
Management Integration Goal: Strengthen management at all levels.
Rationale for Performance Goal
By 2007, some 71 percent of the Department’s Senior Executive Service and equivalents, and 39 percent of the senior staff(grades 13 through 15) will become eligible for retirement. Separation projections are high among economists, fish biologists,mathematical statisticians, statisticians, patent examiners, and electrical engineers. Should these projections materialize, therewould be a critical drain on our institutional memory, on our capacity to provide mature leadership to the next generation ofemployees, and, thus, on our ability to serve the public. Strategic management of the Department’s human resources will enableus to address these anticipated challenges.
FY 2003 Performance
Considerable progress has been made to address DM’s human capital challenges. Improving from last year, five of the sixtargets were met under Performance Goal 2, Strategic Management of Human Capital. Measure 2f, Implement aTelecommuting Program was not met. However, with the signing of the Department’s telework policy in January 2003,implementation activities such as town hall meetings and training have begun at the bureau level. Thus far, five bureau teleworkprogram plans have been approved. Some 17.7 percent of eligible employees were involved in regular or episodic teleworkfor the first quarter under the new plan. For those organizations currently using WebTA, the Department will modify the systemto track telework participation. All other bureaus will provide manual reporting until they transition to WebTA.
Measure 2a: Strategic Competencies—Ensure Competency in Leadership and in Mission-Critical Occupations
FY 2000 FY 2001 FY 2002 FY 2003
Target Develop workforce Automated tools Complete comprehensive Depart- Develop succession plans and staffinganalysis plan and used by three pilot ment-wide workforce restructuring or retention targets for mission criticalresearch and auto- test office.s plan that addresses competency occupations.mate tools. gaps in all bureaus.
Actual Plan developed Automated tools Completed final workforce Implemented succession planning and tools identified. used by three pilot restructuring plan in June 2002. strategies, identified staffing and
test offices. Mission critical competencies retention targets for twenty mission-identified. Candidate Develop- critical occupations, announced Seniorment Program implementation Executive Service (SES Candidate plan developed which provides Development Program and received for the identification of gaps . 204 applications.
Met/Not Met Met Met Met Met
Explanation of Measure
Previous downsizing efforts, hiring freezes, and curtailed investment in human capital have resulted in a workforce that is not“appropriately constituted to meet the current and emerging needs of government and the nation’s citizens,” according to agovernment-wide GAO report entitled “High-Risk Series: An Update.” President Bush identified the issue of “de-layeringmanagement levels to streamline organizations” as one of his five key government-wide management reforms. Ensuring thatemployees are available at the proper time and with the correct competencies is essential to achieving mission objectives.This measure ensures that the Department conducts a strategic review of workforce needs, identifies appropriate competencies,and implements plans to provide a sufficient number of employees with these competencies.
FY 2003 Performance
In response to the high number of projected SES retirements, Commerce revitalized the Candidate Development Program toaddress succession needs. A new program manager was hired to implement the program. Extensive analysis of mission criticaloccupations was conducted to identify the impact of retirements on key positions, as well as address knowledge managementissues and competency development. Some 204 applications were received for this inaugural class. Additional trainingand management development activities were implemented throughout the year to strengthen and improve the managementpipeline.
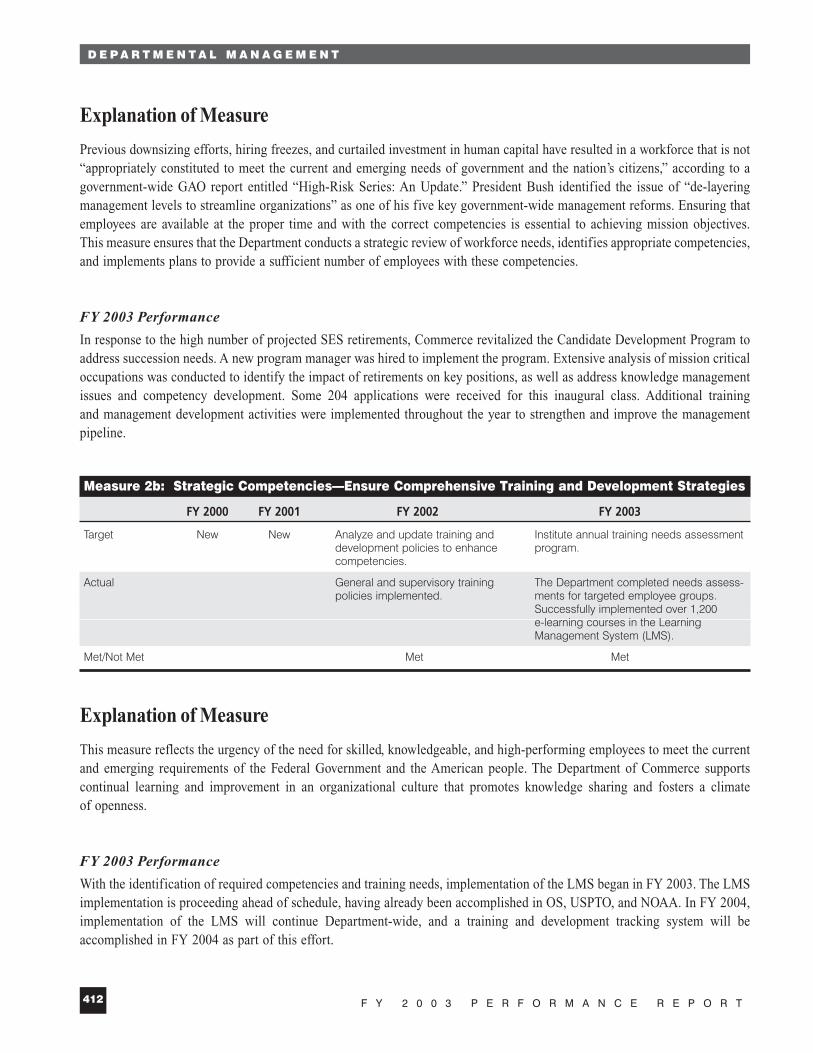
Measure 2b: Strategic Competencies—Ensure Comprehensive Training and Development Strategies
FY 2000 FY 2001 FY 2002 FY 2003
Target New New Analyze and update training and Institute annual training needs assessment development policies to enhance program.competencies.
Actual General and supervisory training The Department completed needs assess-policies implemented. ments for targeted employee groups.
Successfully implemented over 1,200 e-learning courses in the Learning Management System (LMS).
Met/Not Met Met Met
Explanation of Measure
This measure reflects the urgency of the need for skilled, knowledgeable, and high-performing employees to meet the currentand emerging requirements of the Federal Government and the American people. The Department of Commerce supportscontinual learning and improvement in an organizational culture that promotes knowledge sharing and fosters a climateof openness.
FY 2003 Performance
With the identification of required competencies and training needs, implementation of the LMS began in FY 2003. The LMSimplementation is proceeding ahead of schedule, having already been accomplished in OS, USPTO, and NOAA. In FY 2004,implementation of the LMS will continue Department-wide, and a training and development tracking system will beaccomplished in FY 2004 as part of this effort.
D E P A R T M E N T A L M A N A G E M E N T
F Y 2 0 0 3 P E R F O R M A N C E R E P O R T412
D E P A R T M E N T A L M A N A G E M E N T
413F Y 2 0 0 3 P E R F O R M A N C E R E P O R T
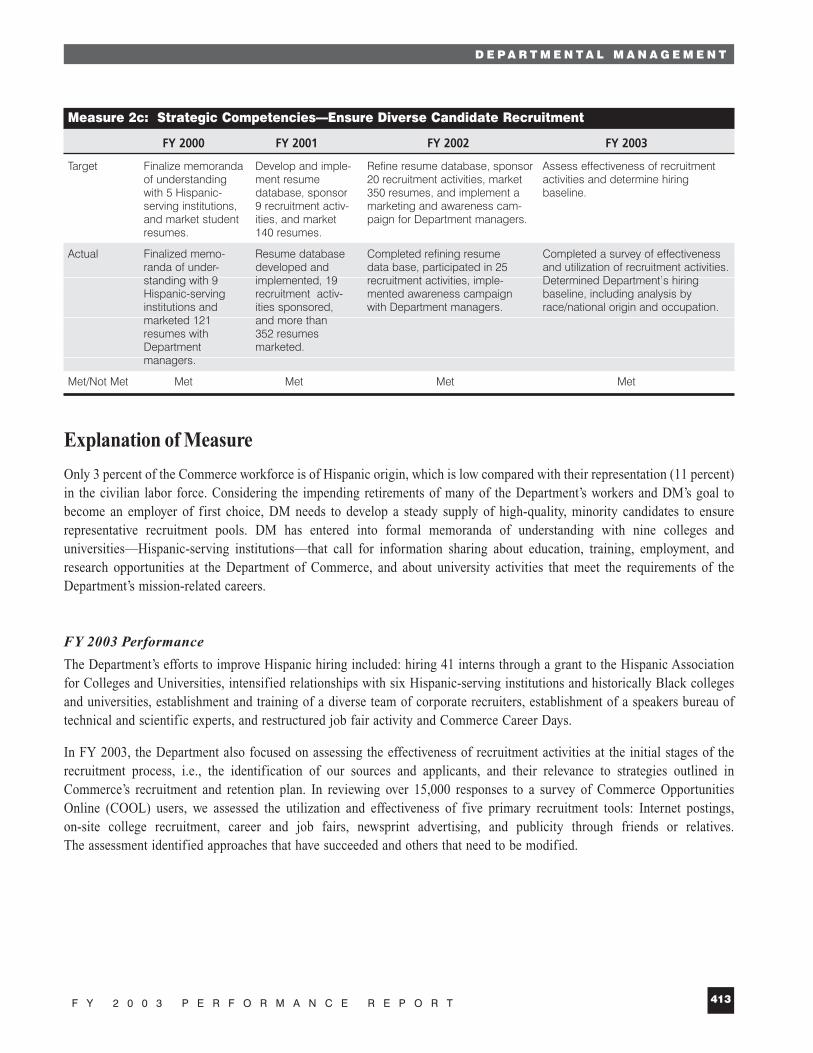
Measure 2c: Strategic Competencies—Ensure Diverse Candidate Recruitment
FY 2000 FY 2001 FY 2002 FY 2003
Target Finalize memoranda Develop and imple- Refine resume database, sponsor Assess effectiveness of recruitment of understanding ment resume 20 recruitment activities, market activities and determine hiring with 5 Hispanic- database, sponsor 350 resumes, and implement a baseline.serving institutions, 9 recruitment activ- marketing and awareness cam-and market student ities, and market paign for Department managers.resumes. 140 resumes.
Actual Finalized memo- Resume database Completed refining resume Completed a survey of effectiveness randa of under- developed and data base, participated in 25 and utilization of recruitment activities.standing with 9 implemented, 19 recruitment activities, imple- Determined Department’s hiring Hispanic-serving recruitment activ- mented awareness campaign baseline, including analysis by institutions and ities sponsored, with Department managers. race/national origin and occupation.marketed 121 and more than resumes with 352 resumes Department marketed.managers.
Met/Not Met Met Met Met Met
Explanation of Measure
Only 3 percent of the Commerce workforce is of Hispanic origin, which is low compared with their representation (11 percent)in the civilian labor force. Considering the impending retirements of many of the Department’s workers and DM’s goal tobecome an employer of first choice, DM needs to develop a steady supply of high-quality, minority candidates to ensurerepresentative recruitment pools. DM has entered into formal memoranda of understanding with nine colleges anduniversities—Hispanic-serving institutions—that call for information sharing about education, training, employment, andresearch opportunities at the Department of Commerce, and about university activities that meet the requirements of theDepartment’s mission-related careers.
FY 2003 Performance
The Department’s efforts to improve Hispanic hiring included: hiring 41 interns through a grant to the Hispanic Associationfor Colleges and Universities, intensified relationships with six Hispanic-serving institutions and historically Black collegesand universities, establishment and training of a diverse team of corporate recruiters, establishment of a speakers bureau oftechnical and scientific experts, and restructured job fair activity and Commerce Career Days.
In FY 2003, the Department also focused on assessing the effectiveness of recruitment activities at the initial stages of therecruitment process, i.e., the identification of our sources and applicants, and their relevance to strategies outlined inCommerce’s recruitment and retention plan. In reviewing over 15,000 responses to a survey of Commerce OpportunitiesOnline (COOL) users, we assessed the utilization and effectiveness of five primary recruitment tools: Internet postings,on-site college recruitment, career and job fairs, newsprint advertising, and publicity through friends or relatives.The assessment identified approaches that have succeeded and others that need to be modified.

Examination of the Department’s hiring baseline indicated that the Department’s total permanent employment declined slightlyfrom 36,428 employees to 35,458 during the period between October 1, 2002, and September 5, 2003. The decline occurredacross all race and national origin groups except Asian employees, who increased slightly in number due to more Asian menbeing employed. The number of women decreased, as did their percentage of workforce; there were fewer White, Hispanic,Asian, and African American women. Minorities, collectively, declined in number but increased as a percentage of employmentbecause of proportionately greater losses of White males and females. Asian men were the only group to increase in numberand percentage of the workforce.
Measure 2d: Efficiency and Effectiveness of Hiring Systems Using the Commerce Opportunities Online (COOL) System
FY 2000 FY 2001 FY 2002 FY 2003
Target Create COOL Phase II Create COOL Phase III Create COOL Phase IV Reduce fill time to 29 days and identify average and reduce fill time to and reduce fill time to and assess quality of fill time. 34 days. 32 days. candidates produced by the
system.
Actual COOL Phase II created COOL Phase III created Incomplete data Fill time has been reduced toand fill time identified and fill time of 38 days. 21 days. The Department at 44 days. completed an online assess-
ment of the 304 managers who used COOL.
Met/Not Met Met Not Met Not Met Met
Explanation of Measure
To ensure that employees with the proper competencies are in place as quickly as possible, the Department has developed andimplemented an automated hiring solution to improve the timeliness of hiring. In the past, Commerce managers expresseddispleasure with the lengthy hiring process, as well as the number and quality of candidates referred for consideration.In 1999, the Department designed and pilot-tested a Web-based recruitment and referral system, COOL Phase I. In April 2000,Commerce replaced the Phase I pilot with an enhanced version COOL Phase II and deployed it within a number of theDepartment’s bureaus. In October 2000, the Department deployed COOL Phase III, which helps with filling vacancies withnonstatus, external candidates. In FY 2002, Commerce deployed COOL Phase IV, with the objective of reducing the vacancyfill time to 32 days.
FY 2003 Performance
DM defines fill-time as the total time it takes to complete the various phases of the hiring process, that is, from the date thehuman resources office receives a recruitment request to the date a list of eligible candidates is referred for the manager’sconsideration. DM relies directly on data that are captured at each of those phases to calculate fill-time. Through fullparticipation of bureaus in inputting data to the Staffing Timeliness Measures system, in FY 2003 DM computed a fill-timeof 21 days, exceeding the target of 29 days. DM also conducted surveys of applicants and managers on the effectiveness ofthe system and quality of applicants.
D E P A R T M E N T A L M A N A G E M E N T
F Y 2 0 0 3 P E R F O R M A N C E R E P O R T414
D E P A R T M E N T A L M A N A G E M E N T
415F Y 2 0 0 3 P E R F O R M A N C E R E P O R T
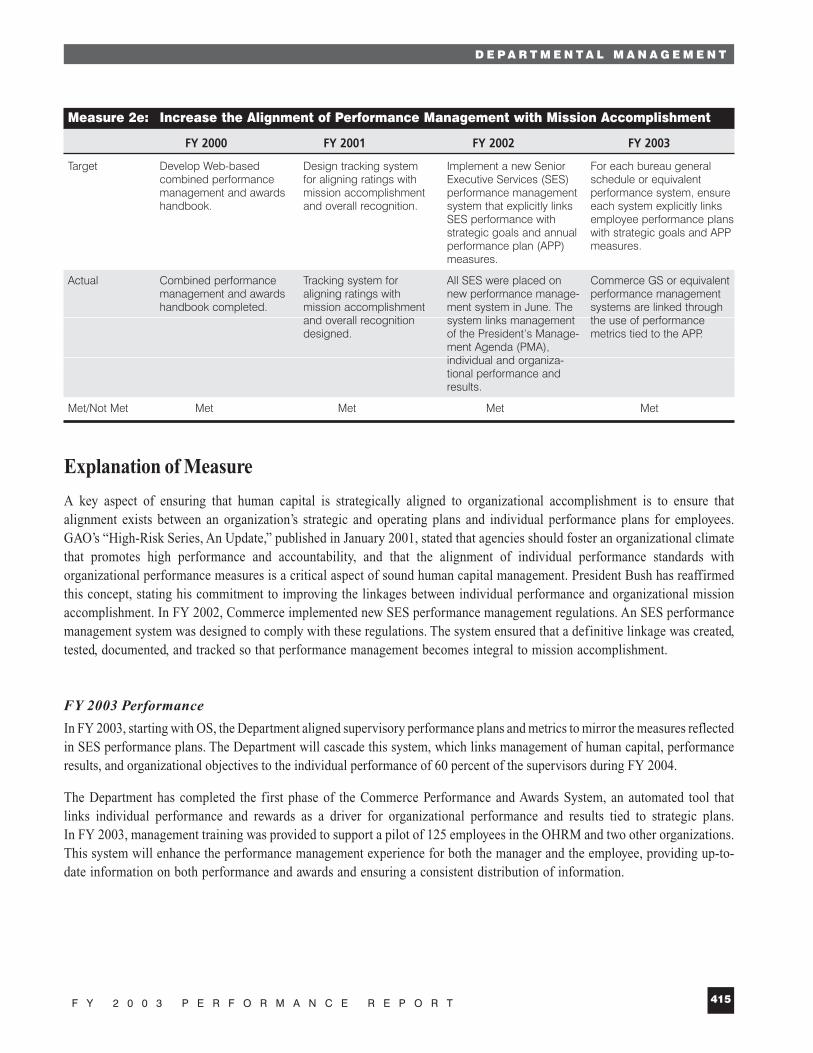
Measure 2e: Increase the Alignment of Performance Management with Mission Accomplishment
FY 2000 FY 2001 FY 2002 FY 2003
Target Develop Web-based Design tracking system Implement a new Senior For each bureau general combined performance for aligning ratings with Executive Services (SES) schedule or equivalent management and awards mission accomplishment performance management performance system, ensure handbook. and overall recognition. system that explicitly links each system explicitly links
SES performance with employee performance plansstrategic goals and annual with strategic goals and APPperformance plan (APP) measures.measures.
Actual Combined performance Tracking system for All SES were placed on Commerce GS or equivalent management and awards aligning ratings with new performance manage- performance management handbook completed. mission accomplishment ment system in June. The systems are linked through
and overall recognition system links management the use of performancedesigned. of the President’s Manage- metrics tied to the APP.
ment Agenda (PMA), individual and organiza-tional performance and results.
Met/Not Met Met Met Met Met
Explanation of Measure
A key aspect of ensuring that human capital is strategically aligned to organizational accomplishment is to ensure thatalignment exists between an organization’s strategic and operating plans and individual performance plans for employees.GAO’s “High-Risk Series, An Update,” published in January 2001, stated that agencies should foster an organizational climatethat promotes high performance and accountability, and that the alignment of individual performance standards withorganizational performance measures is a critical aspect of sound human capital management. President Bush has reaffirmedthis concept, stating his commitment to improving the linkages between individual performance and organizational missionaccomplishment. In FY 2002, Commerce implemented new SES performance management regulations. An SES performancemanagement system was designed to comply with these regulations. The system ensured that a definitive linkage was created,tested, documented, and tracked so that performance management becomes integral to mission accomplishment.
FY 2003 Performance
In FY 2003, starting with OS, the Department aligned supervisory performance plans and metrics to mirror the measures reflectedin SES performance plans. The Department will cascade this system, which links management of human capital, performanceresults, and organizational objectives to the individual performance of 60 percent of the supervisors during FY 2004.
The Department has completed the first phase of the Commerce Performance and Awards System, an automated tool thatlinks individual performance and rewards as a driver for organizational performance and results tied to strategic plans.In FY 2003, management training was provided to support a pilot of 125 employees in the OHRM and two other organizations.This system will enhance the performance management experience for both the manager and the employee, providing up-to-date information on both performance and awards and ensuring a consistent distribution of information.
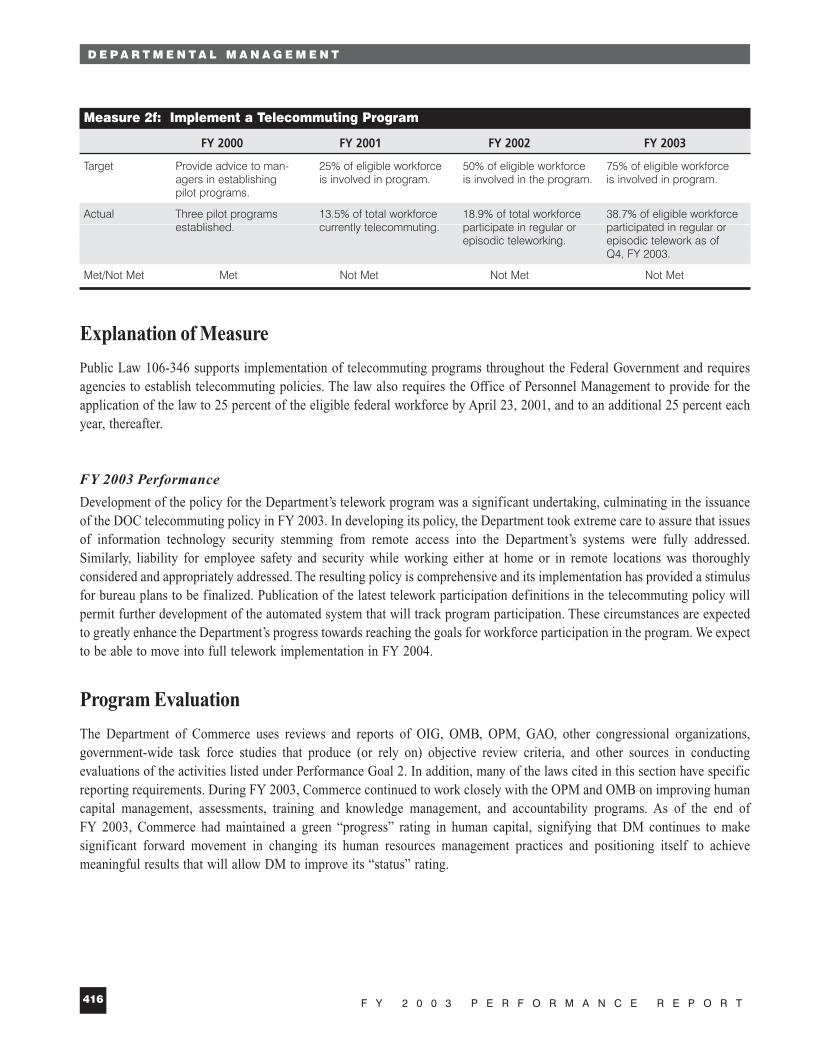
Measure 2f: Implement a Telecommuting Program
FY 2000 FY 2001 FY 2002 FY 2003
Target Provide advice to man- 25% of eligible workforce 50% of eligible workforce 75% of eligible workforce agers in establishing is involved in program. is involved in the program. is involved in program.pilot programs.
Actual Three pilot programs 13.5% of total workforce 18.9% of total workforce 38.7% of eligible workforce established. currently telecommuting. participate in regular or participated in regular or
episodic teleworking. episodic telework as of Q4, FY 2003.
Met/Not Met Met Not Met Not Met Not Met
Explanation of Measure
Public Law 106-346 supports implementation of telecommuting programs throughout the Federal Government and requiresagencies to establish telecommuting policies. The law also requires the Office of Personnel Management to provide for theapplication of the law to 25 percent of the eligible federal workforce by April 23, 2001, and to an additional 25 percent eachyear, thereafter.
FY 2003 Performance
Development of the policy for the Department’s telework program was a significant undertaking, culminating in the issuanceof the DOC telecommuting policy in FY 2003. In developing its policy, the Department took extreme care to assure that issuesof information technology security stemming from remote access into the Department’s systems were fully addressed.Similarly, liability for employee safety and security while working either at home or in remote locations was thoroughlyconsidered and appropriately addressed. The resulting policy is comprehensive and its implementation has provided a stimulusfor bureau plans to be finalized. Publication of the latest telework participation definitions in the telecommuting policy willpermit further development of the automated system that will track program participation. These circumstances are expectedto greatly enhance the Department’s progress towards reaching the goals for workforce participation in the program. We expectto be able to move into full telework implementation in FY 2004.
Program Evaluation
The Department of Commerce uses reviews and reports of OIG, OMB, OPM, GAO, other congressional organizations,government-wide task force studies that produce (or rely on) objective review criteria, and other sources in conductingevaluations of the activities listed under Performance Goal 2. In addition, many of the laws cited in this section have specificreporting requirements. During FY 2003, Commerce continued to work closely with the OPM and OMB on improving humancapital management, assessments, training and knowledge management, and accountability programs. As of the end ofFY 2003, Commerce had maintained a green “progress” rating in human capital, signifying that DM continues to makesignificant forward movement in changing its human resources management practices and positioning itself to achievemeaningful results that will allow DM to improve its “status” rating.
D E P A R T M E N T A L M A N A G E M E N T
F Y 2 0 0 3 P E R F O R M A N C E R E P O R T416
D E P A R T M E N T A L M A N A G E M E N T
417F Y 2 0 0 3 P E R F O R M A N C E R E P O R T
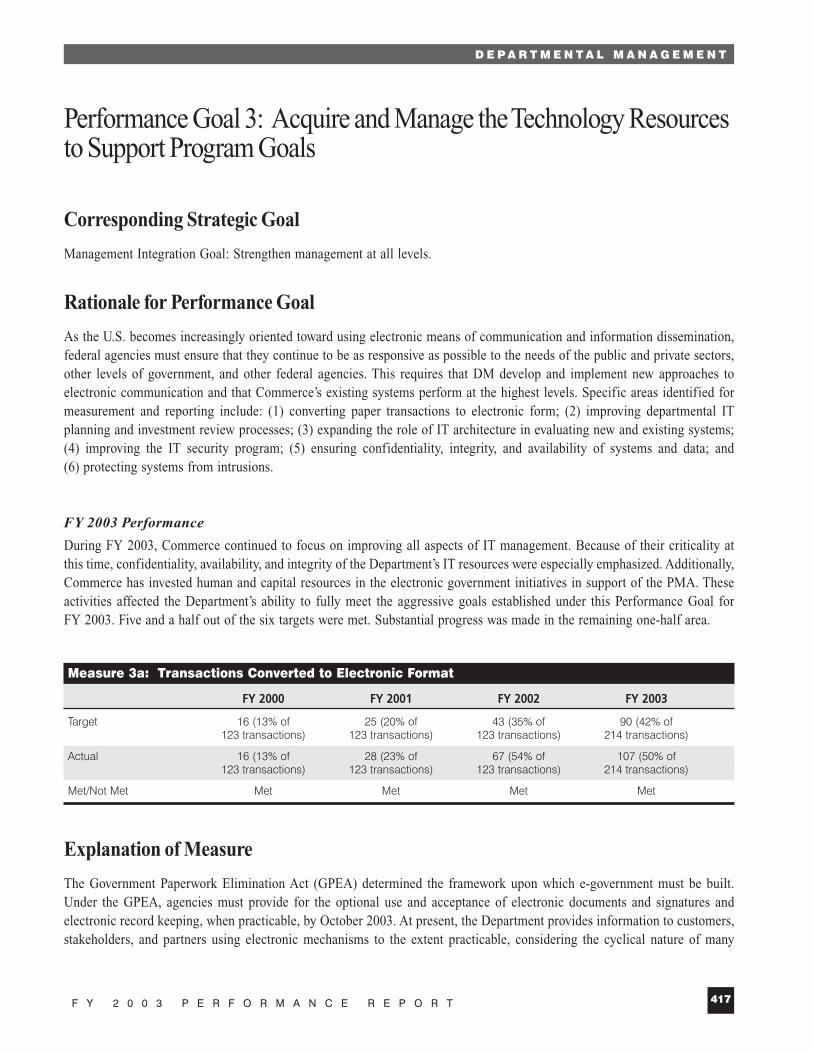
Performance Goal 3: Acquire and Manage the Technology Resourcesto Support Program Goals
Corresponding Strategic Goal
Management Integration Goal: Strengthen management at all levels.
Rationale for Performance Goal
As the U.S. becomes increasingly oriented toward using electronic means of communication and information dissemination,federal agencies must ensure that they continue to be as responsive as possible to the needs of the public and private sectors,other levels of government, and other federal agencies. This requires that DM develop and implement new approaches toelectronic communication and that Commerce’s existing systems perform at the highest levels. Specific areas identified formeasurement and reporting include: (1) converting paper transactions to electronic form; (2) improving departmental ITplanning and investment review processes; (3) expanding the role of IT architecture in evaluating new and existing systems;(4) improving the IT security program; (5) ensuring confidentiality, integrity, and availability of systems and data; and(6) protecting systems from intrusions.
FY 2003 Performance
During FY 2003, Commerce continued to focus on improving all aspects of IT management. Because of their criticality atthis time, confidentiality, availability, and integrity of the Department’s IT resources were especially emphasized. Additionally,Commerce has invested human and capital resources in the electronic government initiatives in support of the PMA. Theseactivities affected the Department’s ability to fully meet the aggressive goals established under this Performance Goal forFY 2003. Five and a half out of the six targets were met. Substantial progress was made in the remaining one-half area.
Measure 3a: Transactions Converted to Electronic Format
FY 2000 FY 2001 FY 2002 FY 2003
Target 16 (13% of 25 (20% of 43 (35% of 90 (42% of 123 transactions) 123 transactions) 123 transactions) 214 transactions)
Actual 16 (13% of 28 (23% of 67 (54% of 107 (50% of 123 transactions) 123 transactions) 123 transactions) 214 transactions)
Met/Not Met Met Met Met Met
Explanation of Measure
The Government Paperwork Elimination Act (GPEA) determined the framework upon which e-government must be built.Under the GPEA, agencies must provide for the optional use and acceptance of electronic documents and signatures andelectronic record keeping, when practicable, by October 2003. At present, the Department provides information to customers,stakeholders, and partners using electronic mechanisms to the extent practicable, considering the cyclical nature of many
Department collections. The first GPEA plan was submitted to OMB in October 2000. At that time, the Department identified235 transactions that were carried out between Department of Commerce offices and operating units, and the public. Of those,123 were appropriate for conversion to an electronic option; this number served as DM’s baseline through 2002. Starting in2003, the new baseline is 214 transactions due to revised instructions from OMB, including a broader set of electronictransactions and focusing on and including transactions related to the Administration’s 25 e-government initiatives. Thoughthe formal GPEA deadline is October 2003, some transactions will be made electronic after 2003 as a particular transactioncomes due, e.g., a survey that is processed only once every five years. Since DM continues to make good progress with itsGPEA efforts, it has increased the goals for FY 2004 and 2005.
As the Department strives to achieve its e-government goals, it is working to make processes, not just forms, electronic.Making processes electronic typically involves business process reengineering and is inherently more complex than makingit possible to fill out a form electronically. The Department CIO is closely monitoring the operating units’ GPEA transactioncompletions in 2003 and beyond through a monthly reporting process and a mid-year review of progress.
FY 2003 Performance
In FY 2003, 40 additional transactions were made available online, making the total to date 107 transactions, which exceedsthe FY 2003 target of 90. Of all Commerce transactions, 34 percent support and advance the 25 e-government initiatives inwhich Commerce participates. Also, 77 percent of all Commerce information collection requests have been affected by GPEA.Examples include the adoption of electronic reporting at the Census Bureau for the Economic Census; development of aWeb-based fish permit capability by NOAA’s National Marine Fisheries Service; and establishment of the Export.gov portal,the Commerce-led government-wide initiative that offers a wide range of information to potential exporters and is beingexpanded to include forms and services.
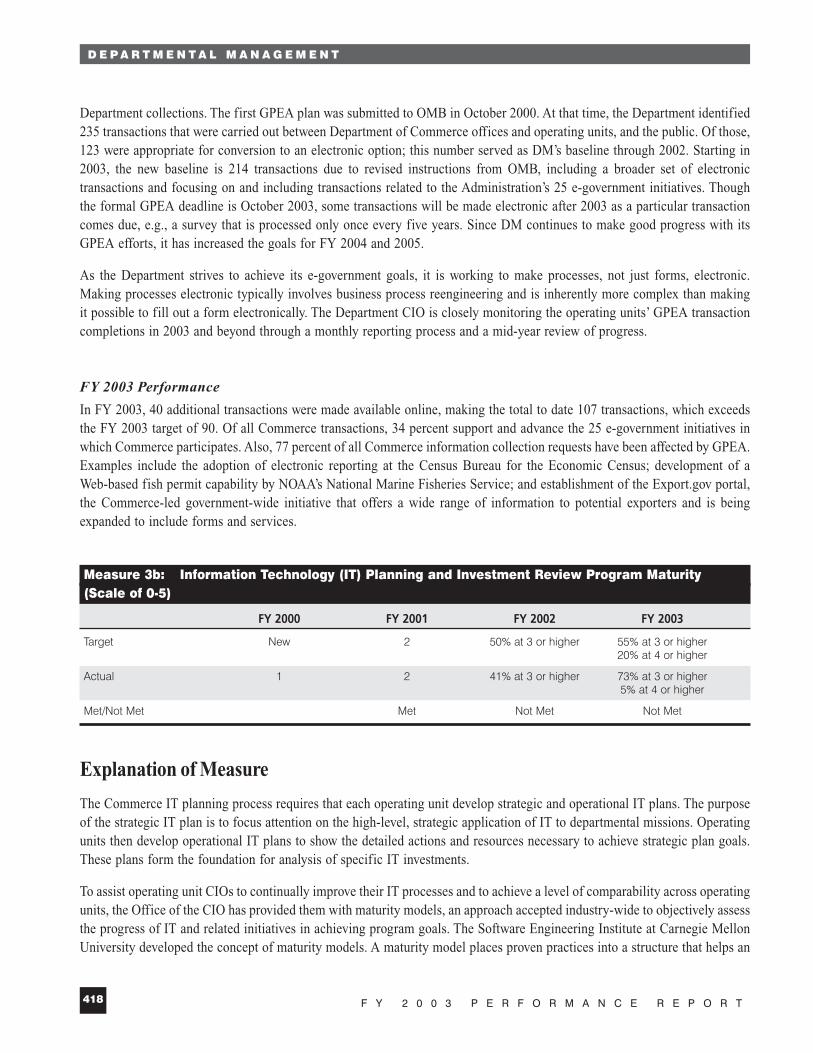
Measure 3b: Information Technology (IT) Planning and Investment Review Program Maturity (Scale of 0-5)
FY 2000 FY 2001 FY 2002 FY 2003
Target New 2 50% at 3 or higher 55% at 3 or higher20% at 4 or higher
Actual 1 2 41% at 3 or higher 73% at 3 or higher5% at 4 or higher
Met/Not Met Met Not Met Not Met
Explanation of Measure
The Commerce IT planning process requires that each operating unit develop strategic and operational IT plans. The purposeof the strategic IT plan is to focus attention on the high-level, strategic application of IT to departmental missions. Operatingunits then develop operational IT plans to show the detailed actions and resources necessary to achieve strategic plan goals.These plans form the foundation for analysis of specific IT investments.
To assist operating unit CIOs to continually improve their IT processes and to achieve a level of comparability across operatingunits, the Office of the CIO has provided them with maturity models, an approach accepted industry-wide to objectively assessthe progress of IT and related initiatives in achieving program goals. The Software Engineering Institute at Carnegie MellonUniversity developed the concept of maturity models. A maturity model places proven practices into a structure that helps an
D E P A R T M E N T A L M A N A G E M E N T
F Y 2 0 0 3 P E R F O R M A N C E R E P O R T418

D E P A R T M E N T A L M A N A G E M E N T
419F Y 2 0 0 3 P E R F O R M A N C E R E P O R T
organization assess its organizational maturity and process capability, establish priorities for improvement, and guide theimplementation of these improvements. The Software Engineering Institute’s software maturity model has become the de factostandard in the IT industry for assessing and improving software processes. An organization’s processes are deemed to be ata specific level when all established criteria for that level have been met. There are no partial or incremental steps betweenthe levels.
Commerce uses maturity models to measure progress in three areas critical to managing IT resources: IT planning andinvestment review, IT architecture, and IT security. Definitions of each level (0-5) of the models are as follows:
Information Technology (IT) Level Planning and Investment Review IT Architecture IT Security
0 No IT planning program. No IT architecture. No IT security program.
1 Initial: informal IT planning program. Initial: informal it architecture Documented policy.process underway.
2 IT planning program in development. IT architecture process in development. Documented procedures.
3 Defined IT planning program. Defined IT architecture including Implemented procedures and controls.detailed written procedures and technical reference model.
4 Managed IT planning program. Managed and measured IT architecture Tested and reviewed procedures and process. controls.
5 Optimizing: continual improvement Optimizing: continual improvement Fully integrated procedures and controls.of the IT planning program. of the IT architecture process.
FY 2003 Performance
The FY 2003 target was recognized as an aggressive goal when it was established. It had two stretch targets: (1) to have55 percent of the bureaus operating at level 3 of the IT Planning and Investment Review maturity model, having a fully definedIT planning program in place, and (2) to challenge at least 20 percent of the operating units to move from level 3 to level 4in the course of one year. The first target was exceeded, with 77 percent of the bureaus operating at level 3. The second targetwas not achieved, but progress was made in pressing the operating units to achieve at this very high level. One bureau, BEA,was able to achieve a level 4, which equates to 5 percent at a level 4. Fully managed planning and investment review programsat the bureau level require that senior management recognize the importance of the contribution of IT to the organization.IT plans and investment reviews must be used actively to conduct business, and the organization’s personnel must understandthe plans and work toward meeting plan goals. To bring this about, significant cultural and procedural changes are requiredthroughout the units’ planning, budgeting, and program execution processes. Because these requirements sometimes extendbeyond the purview of the CIO, this level of maturity can be difficult to achieve. The Department’s CIO, with the help of theDepartment’s CFO, will continue working with each bureau, establishing specific objectives and monitoring their progressthroughout the year, to help ensure that FY 2004 targets are met.

Measure 3c: Information Technology (IT) Architecture Program Maturity (Scale of 0-5)
FY 2000 FY 2001 FY 2002 FY 2003
Target New 2 75% at 2 or higher 90% at 2 or higher50% at 3 or higher 66% at 3 or higher
Actual 1 1.5 82% at 2 or higher 91% at 2 or higher 59% at 3 or higher 77% at 3 or higher
Met/Not Met Not Met Met Met
Explanation of Measure
The IT architecture serves as the blueprint that guides how IT resources work together as a cohesive whole to support theDepartment’s mission. This mechanism helps the Department in efficiently utilizing its IT funding by recognizing the potentialusefulness of IT systems to similar business practices across operating units, which results in eliminating duplication,improving information-sharing abilities, enhancing Commerce’s ability to respond to changing business needs, and reducingcosts because of economies of scale.
An Enterprise IT Architecture Advisory Group, composed of members from across the Department, has established ITarchitecture guidelines, evaluation criteria, and a maturity scale. A high-level enterprise architecture serves as the overarchingdriver for Commerce’s architecture efforts. Each Commerce operating unit has developed its own IT architecture in line withthe departmental architecture, and is following the guidelines and criteria prepared by the Advisory Group. Together, theseplans form Commerce’s Federated Enterprise IT Architecture, which includes linkages to OMB’s Federal EnterpriseArchitecture.
The maturity models:
Information Technology (IT) Level Planning and Investment Review IT Architecture IT Security
0 No IT planning program. No IT architecture. No IT security program.
1 Initial: informal IT planning program. Initial: informal IT architecture process Documented policy.underway.
2 IT planning program in development. IT architecture process in development Documented procedures.
3 Defined IT planning program. Defined IT architecture including Implemented procedures and controls.detailed written procedures and technical reference model.
4 Managed IT planning program. Managed and measured IT architecture Tested and reviewed procedures process. and controls.
5 Optimizing: continual improvement Optimizing: continual improvement Fully integrated procedures and controls.of the IT planning program. of the IT architecture process.
D E P A R T M E N T A L M A N A G E M E N T
F Y 2 0 0 3 P E R F O R M A N C E R E P O R T420

D E P A R T M E N T A L M A N A G E M E N T
421F Y 2 0 0 3 P E R F O R M A N C E R E P O R T
FY 2003 Performance
The FY 2003 performance goal for IT architecture was achieved. During FY 2003, Commerce made significant progress inthe area of IT architecture. By the end of FY 2002, 82 percent of the operating units had achieved level 2, with 59 percentalso achieving level 3. We have increased the performance to 91 percent at level 2 and 77 percent at level 3 in FY 2003. Level3 requires that the operating unit have a defined IT architecture process, detailed written procedures, and a technical referencemodel that lays out the technical components of the architecture. The target was exceeded primarily through the maturing ofthe process and the participation of all operating units in sharing techniques, lessons learned, and standardization of the processthrough the Commerce Enterprise IT Architecture Advisory Group.
Measure 3d: Information Technology (IT) Security Program Maturity (Scale of 0-5)
FY 2000 FY 2001 FY 2002 FY 2003
Target New 50% at 1 or higher 80% at 2 or higher 90% at 2 or higher70% at 3 or higher
Actual More than 1 100% at 1 or higher 70% at 2 or higher 100% at 2 or higher60% at 2 or higher 48% at 3 or higher 79% at 3 or higher
26% at 4 or higher 7% at 4 or higher
Met/Not Met Met Not Met Met
Explanation of Measure
The IT security program implements policies, standards, and procedures to ensure an adequate level of protection for ITsystems, whether maintained in-house or commercially. Commerce’s IT security program includes the preparation of riskassessments, security plans, contingency plans, and certification and accreditation of IT systems to ensure the confidentiality,availability, and integrity of the Department’s IT resources.
The maturity models:
Information Technology (IT) Level Planning and Investment Review IT Architecture IT Security
0 No IT planning program. No IT architecture. No IT security program.
1 Initial: informal IT planning program. Initial: informal IT architecture process Documented policy.underway.
2 IT planning program in development. IT architecture process in development. Documented procedures.
3 Defined IT planning program. Defined IT architecture including Implemented procedures and controls.detailed written procedures and technical reference model.
4 Managed IT planning program. Managed and measured IT Tested and reviewed procedures and architecture process. controls.
5 Optimizing: continual improvement Optimizing: continual improvement Fully integrated procedures and controls.of the IT planning program. of the IT architecture process.
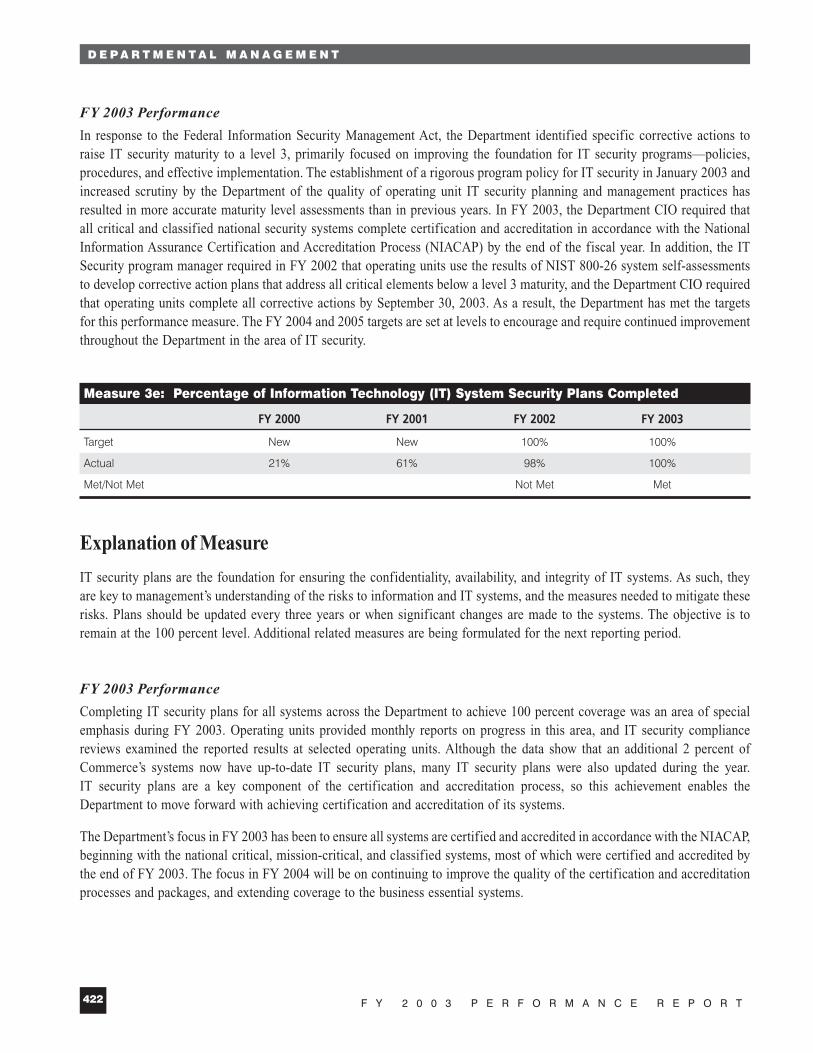
FY 2003 Performance
In response to the Federal Information Security Management Act, the Department identified specific corrective actions toraise IT security maturity to a level 3, primarily focused on improving the foundation for IT security programs—policies,procedures, and effective implementation. The establishment of a rigorous program policy for IT security in January 2003 andincreased scrutiny by the Department of the quality of operating unit IT security planning and management practices hasresulted in more accurate maturity level assessments than in previous years. In FY 2003, the Department CIO required thatall critical and classified national security systems complete certification and accreditation in accordance with the NationalInformation Assurance Certification and Accreditation Process (NIACAP) by the end of the fiscal year. In addition, the ITSecurity program manager required in FY 2002 that operating units use the results of NIST 800-26 system self-assessmentsto develop corrective action plans that address all critical elements below a level 3 maturity, and the Department CIO requiredthat operating units complete all corrective actions by September 30, 2003. As a result, the Department has met the targetsfor this performance measure. The FY 2004 and 2005 targets are set at levels to encourage and require continued improvementthroughout the Department in the area of IT security.
Measure 3e: Percentage of Information Technology (IT) System Security Plans Completed
FY 2000 FY 2001 FY 2002 FY 2003
Target New New 100% 100%
Actual 21% 61% 98% 100%
Met/Not Met Not Met Met
Explanation of Measure
IT security plans are the foundation for ensuring the confidentiality, availability, and integrity of IT systems. As such, theyare key to management’s understanding of the risks to information and IT systems, and the measures needed to mitigate theserisks. Plans should be updated every three years or when significant changes are made to the systems. The objective is toremain at the 100 percent level. Additional related measures are being formulated for the next reporting period.
FY 2003 Performance
Completing IT security plans for all systems across the Department to achieve 100 percent coverage was an area of specialemphasis during FY 2003. Operating units provided monthly reports on progress in this area, and IT security compliancereviews examined the reported results at selected operating units. Although the data show that an additional 2 percent ofCommerce’s systems now have up-to-date IT security plans, many IT security plans were also updated during the year.IT security plans are a key component of the certification and accreditation process, so this achievement enables theDepartment to move forward with achieving certification and accreditation of its systems.
The Department’s focus in FY 2003 has been to ensure all systems are certified and accredited in accordance with the NIACAP,beginning with the national critical, mission-critical, and classified systems, most of which were certified and accredited bythe end of FY 2003. The focus in FY 2004 will be on continuing to improve the quality of the certification and accreditationprocesses and packages, and extending coverage to the business essential systems.
D E P A R T M E N T A L M A N A G E M E N T
F Y 2 0 0 3 P E R F O R M A N C E R E P O R T422
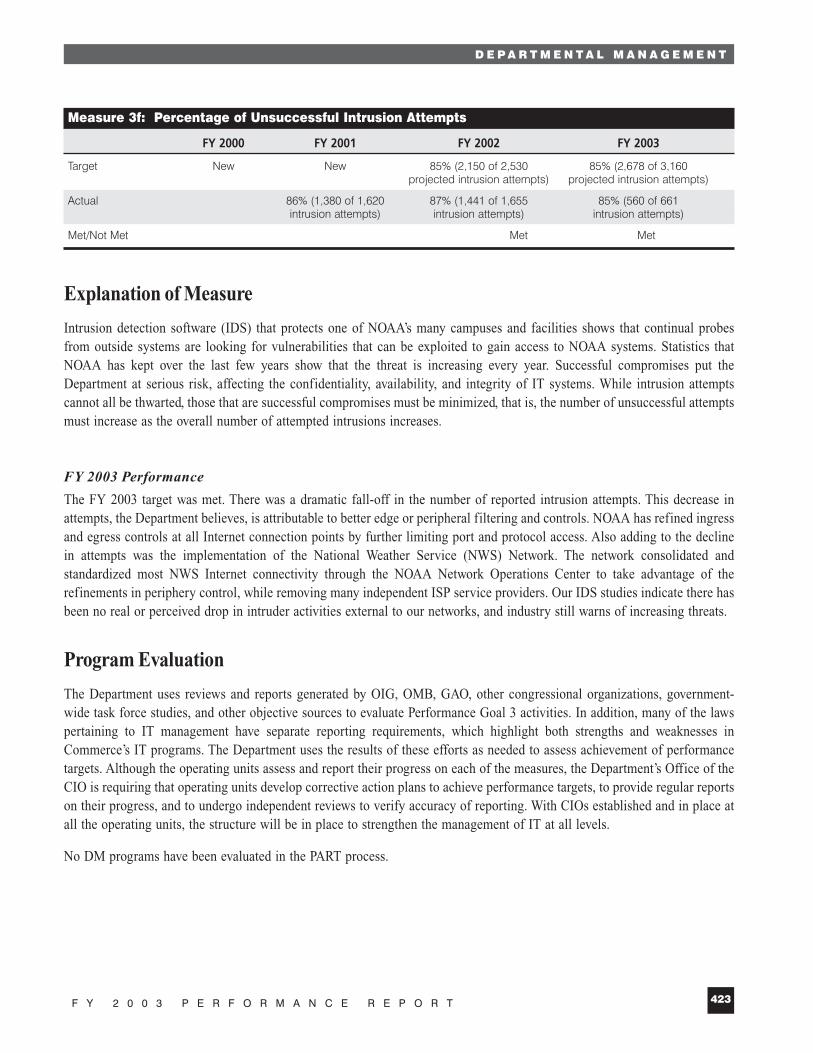
D E P A R T M E N T A L M A N A G E M E N T
423F Y 2 0 0 3 P E R F O R M A N C E R E P O R T
Measure 3f: Percentage of Unsuccessful Intrusion Attempts
FY 2000 FY 2001 FY 2002 FY 2003
Target New New 85% (2,150 of 2,530 85% (2,678 of 3,160 projected intrusion attempts) projected intrusion attempts)
Actual 86% (1,380 of 1,620 87% (1,441 of 1,655 85% (560 of 661 intrusion attempts) intrusion attempts) intrusion attempts)
Met/Not Met Met Met
Explanation of Measure
Intrusion detection software (IDS) that protects one of NOAA’s many campuses and facilities shows that continual probesfrom outside systems are looking for vulnerabilities that can be exploited to gain access to NOAA systems. Statistics thatNOAA has kept over the last few years show that the threat is increasing every year. Successful compromises put theDepartment at serious risk, affecting the confidentiality, availability, and integrity of IT systems. While intrusion attemptscannot all be thwarted, those that are successful compromises must be minimized, that is, the number of unsuccessful attemptsmust increase as the overall number of attempted intrusions increases.
FY 2003 Performance
The FY 2003 target was met. There was a dramatic fall-off in the number of reported intrusion attempts. This decrease inattempts, the Department believes, is attributable to better edge or peripheral filtering and controls. NOAA has refined ingressand egress controls at all Internet connection points by further limiting port and protocol access. Also adding to the declinein attempts was the implementation of the National Weather Service (NWS) Network. The network consolidated andstandardized most NWS Internet connectivity through the NOAA Network Operations Center to take advantage of therefinements in periphery control, while removing many independent ISP service providers. Our IDS studies indicate there hasbeen no real or perceived drop in intruder activities external to our networks, and industry still warns of increasing threats.
Program Evaluation
The Department uses reviews and reports generated by OIG, OMB, GAO, other congressional organizations, government-wide task force studies, and other objective sources to evaluate Performance Goal 3 activities. In addition, many of the lawspertaining to IT management have separate reporting requirements, which highlight both strengths and weaknesses inCommerce’s IT programs. The Department uses the results of these efforts as needed to assess achievement of performancetargets. Although the operating units assess and report their progress on each of the measures, the Department’s Office of theCIO is requiring that operating units develop corrective action plans to achieve performance targets, to provide regular reportson their progress, and to undergo independent reviews to verify accuracy of reporting. With CIOs established and in place atall the operating units, the structure will be in place to strengthen the management of IT at all levels.
No DM programs have been evaluated in the PART process.

DM Data Validation and Verification
To a great extent, DM measures depend on input provided by many sources—typically, Commerce’s bureaus—and acombination of techniques is used to validate and verify the data received.
For example, financial performance at all levels is subject to review by Department auditors. Data input by the bureaus relatingto acquisition activities, e.g., performance-based contracts and small business awards, is screened at the Department levelduring the reporting cycle.
Several of the measures relating to IT management under Performance Goal 3 involve the use of maturity models to evaluatethe adequacy of the programs in place to manage IT planning, architecture, and security. These models represent an industry-wide accepted approach for objectively assessing the IT functions. The Office of the CIO works closely with bureaus to ensurethat the criteria for each level are met as bureaus progress through the five-step models.
As DM moves forward to other, less concrete objectives, e.g., developing competencies in leadership and mission criticaloccupations and improving the effectiveness and efficiency of our hiring systems, it is continuing to refine its reportingstructure.
The DM Data Validation and Verification table can be found starting on the following page.
D E P A R T M E N T A L M A N A G E M E N T
F Y 2 0 0 3 P E R F O R M A N C E R E P O R T424
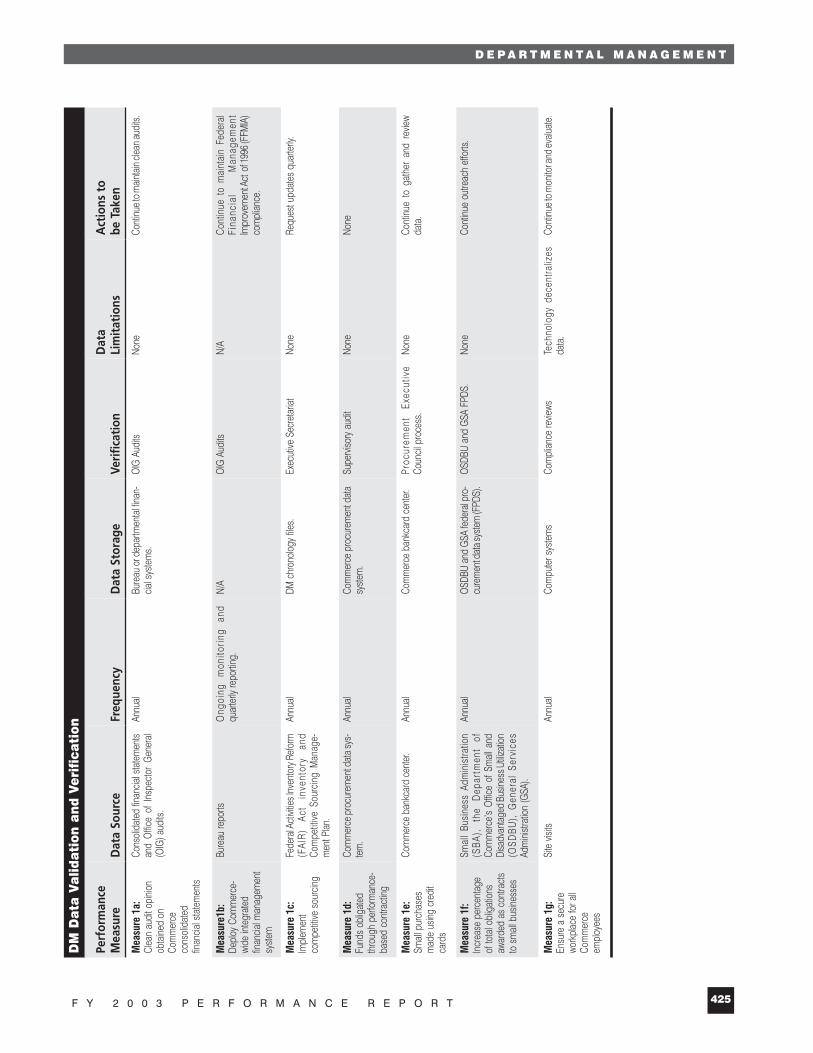
D E P A R T M E N T A L M A N A G E M E N T
425F Y 2 0 0 3 P E R F O R M A N C E R E P O R T
DM
Da
ta V
ali
da
tion
an
d V
erif
ica
tion
Perf
orm
ance
Mea
sure
Dat
a So
urce
Freq
uenc
yD
ata
Stor
age
Veri
fica
tion
Dat
a Li
mit
atio
nsA
ctio
ns t
o be
Tak
en
Mea
sure
1a:
Cl
ean
audi
t opi
nion
obta
ined
onCo
mm
erce
cons
olid
ated
finan
cial s
tate
men
ts
Cons
olid
ated
fina
ncial
sta
tem
ents
and
Offic
e of
Ins
pect
or G
ener
al(O
IG) a
udits
.
Annu
alBu
reau
or d
epar
tmen
tal fi
nan-
cial s
yste
ms.
OIG
Audi
tsNo
neCo
ntinu
e to m
ainta
in cle
an au
dits.
Mea
sure
1b:
Depl
oy C
omm
erce
-wi
de in
tegr
ated
finan
cial m
anag
emen
tsy
stem
Bure
au re
ports
Ong
oing
m
onito
ring
and
quar
terly
repo
rting
.N/
AO
IG A
udits
N/A
Cont
inue
to
mai
ntai
n Fe
dera
lFi
nanc
ial
Man
agem
ent
Impr
ovem
ent A
ct o
f 199
6 (FF
MIA
)co
mpl
iance
.
Mea
sure
1c:
Im
plem
ent
com
petiti
ve s
ourc
ing
Fede
ral A
ctivi
ties I
nven
tory
Ref
orm
(FAI
R)
Act
inve
ntor
y an
dCo
mpe
titive
Sou
rcin
g M
anag
e-m
ent P
lan.
Annu
alDM
chr
onol
ogy
files.
Exec
utive
Sec
reta
riat
None
Requ
est u
pdat
es q
uarte
rly.
Mea
sure
1d:
Fu
nds
oblig
ated
thro
ugh
perfo
rman
ce-
base
d co
ntra
cting
Com
mer
ce p
rocu
rem
ent d
ata s
ys-
tem
.An
nual
Com
mer
ce p
rocu
rem
ent d
ata
syst
em.
Supe
rviso
ry a
udit
None
None
Mea
sure
1e:
Sm
all p
urch
ases
mad
e us
ing c
redi
tca
rds
Com
mer
ce b
ankc
ard
cent
er.An
nual
Com
mer
ce b
ankc
ard
cent
er.Pr
ocur
emen
t Ex
ecut
ive
Coun
cil p
roce
ss.
None
Cont
inue
to
gath
er a
nd r
eview
data
.
Mea
sure
1f:
Incr
ease
per
cent
age
of to
tal o
blig
atio
nsaw
arde
d as
con
tract
sto
sm
all b
usine
sses
Smal
l Bu
sine
ss A
dmin
istra
tion
(SBA
),
the
Dep
artm
ent
ofCo
mm
erce
’s O
ffice
of S
mall
and
Disa
dvan
tage
d Bu
sines
s Utili
zatio
n(O
SDBU
), G
ener
al S
ervi
ces
Adm
inist
ratio
n (G
SA).
Annu
alO
SDBU
and
GSA
fede
ral p
ro-
cure
men
t dat
a sys
tem
(FPD
S).
OSD
BU a
nd G
SA F
PDS.
None
Cont
inue
outre
ach
effo
rts.
Mea
sure
1g:
En
sure
a s
ecur
ewo
rkpl
ace
for a
llCo
mm
erce
empl
oyee
s
Site
visi
tsAn
nual
Com
pute
r sys
tem
sCo
mpl
iance
revie
wsTe
chno
logy
dec
entra
lizes
data
.Co
ntinu
e to m
onito
r and
evalu
ate.

D E P A R T M E N T A L M A N A G E M E N T
F Y 2 0 0 3 P E R F O R M A N C E R E P O R T426
DM
Da
ta V
ali
da
tion
an
d V
erif
ica
tion
(co
nt.)
Perf
orm
ance
Mea
sure
Dat
a So
urce
Freq
uenc
yD
ata
Stor
age
Veri
fica
tion
Dat
a Li
mit
atio
nsA
ctio
ns t
o be
Tak
en
Mea
sure
1h:
En
sure
a s
afe
work
plac
e fo
r all
Com
mer
ceem
ploy
ees
Offi
ce o
f H
uman
Res
ourc
esM
anag
emen
t (O
HRM
).An
nual
OHRM
Repo
rting
to se
nior m
anag
ers.
None
Cont
inue t
o mon
itor a
nd ev
aluat
e.
Mea
sure
2a:
St
rate
gic
com
pe-
tenc
ies—
ensu
reco
mpe
tenc
y in
leade
rship
and
inm
issio
n-cr
itical
occu
patio
ns
Nat
iona
l Fi
nanc
e C
ente
r/D
epar
tmen
t of
Com
mer
ce’s
Hum
an R
esou
rces
Dat
a Sy
stem
(HRD
S),
bure
aus’
wor
kfor
cere
stru
ctur
ing
plan
s, r
ecru
itmen
tan
d re
tent
ion
plan
s th
at fo
cus
onm
issio
n crit
ical c
ompe
tenc
ies, a
ndle
ader
ship
suc
cess
ion
plan
s(r
ecru
itmen
t, re
tent
ion,
and
deve
lopm
ent).
Sem
i-ann
ual
in s
ome
case
s,an
nual
in ot
hers
.O
HRM
pay
roll
and
pers
onne
lsy
stem
and
succ
essio
n plan
s.Av
ailab
ility o
f plan
s, da
ta ac
cu-
racy
as
docu
men
ted
by t
heNa
tiona
l Fina
nce C
ente
r, lea
d-er
ship
recr
uitm
ent a
nd re
ten-
tion r
ates
, turn
over
dat
a, av
ail-
abilit
y an
d qu
ality
of s
ucce
s-si
on p
lans
, an
d re
view
of
bure
au p
rogr
ess
on s
ucce
s-sio
n pl
ans.
HRDS
doe
s no
t pro
vide
his-
toric
al da
ta.
Mea
sure
tre
nds
over
tim
e an
den
sure
that
plan
s are
in p
lace a
ndim
plem
ente
d.
Mea
sure
2b:
St
rate
gic
com
pe-
tenc
ies—
ensu
reco
mpr
ehen
sive
traini
ng a
nd d
evel-
opm
ent s
trate
gies
Depa
rtmen
t pl
an f
or s
trate
gic
emplo
yee t
raini
ng an
d dev
elopm
ent.
Annu
alO
HRM
and
bur
eaus
.Re
view
of m
anua
l reco
rds a
ndav
ailab
ility o
f upd
ated
pol
icies
that
sup
port
miss
ion-
critic
alem
ploy
ee
com
pete
ncy
deve
lopm
ent.
Man
ual r
eview
requ
ired.
Refin
e sy
stem
and
con
tinue
to
mon
itor.
Mea
sure
2c:
St
rate
gic
com
pe-
tenc
ies—
ensu
redi
vers
e ca
ndid
ate
recr
uitm
ent
Inve
ntor
y tra
nsm
ittal le
tters
.An
nual
Offic
e ch
rono
logy
files
.Ex
ecut
ive S
ecre
taria
tNo
neM
easu
re tr
ends
ove
r tim
e.
Mea
sure
2d:
Ef
ficien
cy a
ndef
fect
ivene
ss o
fhir
ing s
yste
ms
using
the
Com
mer
ceO
ppor
tunit
ies O
nline
(CO
OL)
Sys
tem
Staf
fing
timeli
ness
mea
sure
men
tsy
stem
.Se
mi-a
nnua
lSt
affin
g tim
eline
ss m
easu
re-
men
t sys
tem
.St
affin
g tim
eline
ss s
tudi
es.
Som
e m
anua
l so
rtin
gre
quire
d.Re
fine
syst
em,
prov
ide
traini
ng,
and
over
see
issua
nce
of c
ertifi
-ca
tes
to m
anag
ers.
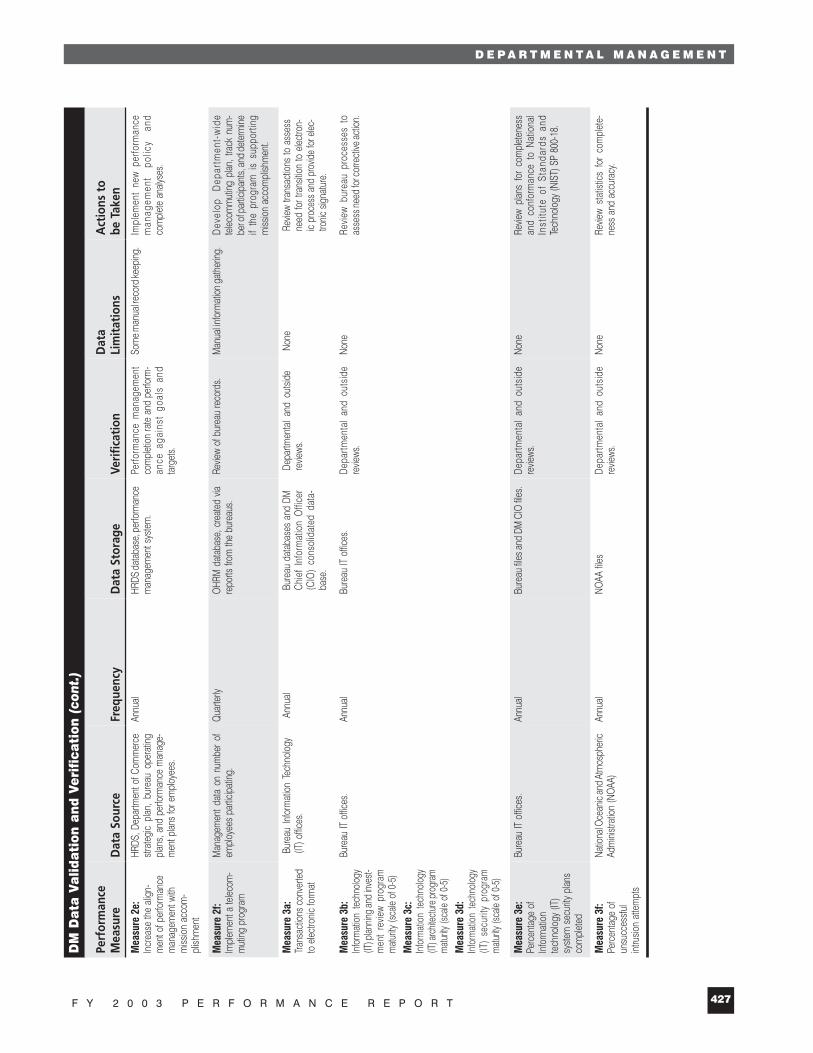
D E P A R T M E N T A L M A N A G E M E N T
427F Y 2 0 0 3 P E R F O R M A N C E R E P O R T
DM
Da
ta V
ali
da
tion
an
d V
erif
ica
tion
(co
nt.)
Perf
orm
ance
Mea
sure
Dat
a So
urce
Freq
uenc
yD
ata
Stor
age
Veri
fica
tion
Dat
a Li
mit
atio
nsA
ctio
ns t
o be
Tak
en
Mea
sure
2e:
In
crea
se th
e ali
gn-
men
t of p
erfo
rman
cem
anag
emen
t with
miss
ion
acco
m-
plish
men
t
HRDS
, Dep
artm
ent o
f Com
mer
cest
rate
gic
plan
, bu
reau
ope
ratin
gpl
ans,
and
perfo
rman
ce m
anag
e-m
ent p
lans
for e
mpl
oyee
s.
Annu
alHR
DS d
atab
ase,
per
form
ance
man
agem
ent s
yste
m.
Perfo
rman
ce m
anag
emen
tco
mpl
etio
n ra
te a
nd p
erfo
rm-
ance
aga
inst
goa
ls a
ndta
rget
s.
Som
e man
ual re
cord
keep
ing.
Impl
emen
t ne
w pe
rform
ance
man
agem
ent
polic
y an
dco
mpl
ete
analy
ses.
Mea
sure
2f:
Impl
emen
t a te
lecom
-m
uting
pro
gram
Man
agem
ent d
ata
on n
umbe
r of
empl
oyee
s pa
rticip
ating
.Q
uarte
rlyO
HRM
dat
abas
e, c
reat
ed v
iare
ports
from
the
bure
aus.
Revie
w of
bur
eau
reco
rds.
Man
ual in
form
atio
n ga
ther
ing.
Dev
elop
D
epar
tmen
t-w
ide
telec
omm
uting
plan
, tra
ck n
um-
ber o
f par
ticip
ants,
and
dete
rmine
if th
e pr
ogra
m i
s su
ppor
ting
miss
ion
acco
mpl
ishm
ent.
Mea
sure
3b:
In
form
ation
tec
hnolo
gy(IT
) plan
ning
and
inves
t-m
ent
revie
w pr
ogra
mm
atur
ity (s
cale
of 0
-5)
Mea
sure
3c:
In
form
ation
tec
hnolo
gy(IT
) arc
hitec
ture
prog
ram
matu
rity (s
cale
of 0
-5)
Mea
sure
3d:
In
form
ation
tec
hnolo
gy(IT
) se
curit
y pr
ogra
mm
aturity
(sca
le of
0-5
)
Bure
au IT
offic
es.
Annu
alBu
reau
IT o
ffices
.De
partm
enta
l an
d ou
tsid
ere
views
.No
neRe
view
bur
eau
proc
esse
s to
asse
ss ne
ed fo
r cor
rect
ive ac
tion.
Mea
sure
3e:
Pe
rcen
tage
of
Info
rmat
ion
tech
nolo
gy (I
T)sy
stem
sec
urity
plan
sco
mpl
eted
Bure
au IT
offic
es.
Annu
alBu
reau
files
and
DM
CIO
files
.De
partm
enta
l an
d ou
tsid
ere
views
.No
neRe
view
plan
s fo
r co
mpl
eten
ess
and
conf
orm
ance
to
Natio
nal
Inst
itute
of
Stan
dard
s an
dTe
chno
logy
(NIS
T) S
P 80
0-18
.
Mea
sure
3f:
Perc
enta
ge o
fun
succ
essf
ulint
rusio
n at
tem
pts
Natio
nal O
cean
ic an
d At
mos
pher
icAd
mini
stra
tion
(NO
AA)
Annu
alNO
AA fi
lesDe
partm
enta
l an
d ou
tsid
ere
views
.No
neRe
view
stat
istics
for
com
plet
e-ne
ss a
nd a
ccur
acy.
Mea
sure
3a:
Tra
nsac
tions
con
verte
dto
elec
tronic
form
at
Bure
au In
form
atio
n Te
chno
logy
(IT) o
ffices
.An
nual
Bure
au d
atab
ases
and
DM
Chie
f In
form
atio
n O
ffice
r(C
IO)
cons
olid
ated
dat
a-ba
se.
Depa
rtmen
tal a
nd o
utsid
ere
views
.No
neRe
view
trans
actio
ns to
ass
ess
need
for t
rans
ition
to e
lectro
n-ic
proc
ess a
nd p
rovid
e fo
r elec
-tro
nic s
igna
ture
.
D E P A R T M E N T A L M A N A G E M E N T
F Y 2 0 0 3 P E R F O R M A N C E R E P O R T428


