
Managing Rosters, Hours of Work and Workplace Fatigue
Australian Sugar Milling Council Safety Conference
21 March 2013


Managing Workplace Fatigue
Key Strategies
► Site Specific Roster Design
► Health, Alertness and Lifestyle Education Training
► Management of Actual Hours of Work

Site Specific Roster Design
Roster

Feedback from Workers
Database Background
► Feedback from 23,183 individual workers
► Information obtained through direct contact with employees in small group
meetings and using confidential questionnaires
► 84 percent average response rate at each site
► Over 200 different sites
► 1,053 257 responses regarding sleep, fatigue, hours of work, time off, etc.
Data by Industry Sector
Manufacturing 9715
Mining 7263
Services 3968
Energy 2237

What are Employees Looking For? (Perspective in 1994)
12%
28%
9%
51%
Predictability
Health & Alertness
Overtime
Days Off
Data from Shiftwork Solutions Shift Worker Database

What are Employees Looking For? (Today’s Perspective)
12%
40%
15%
33%
Predictability
Health & Alertness
Overtime
Days Off
Data from Shiftwork Solutions Shift Worker Database

Age of Workforce
Data from Shiftwork Solutions Shift Worker Database
1
21
30 28
19
1 0
10
20
30
40
Less than20 years
20-29 years
30-39years
40-49years
50-59years
60 yearsor more
Percent
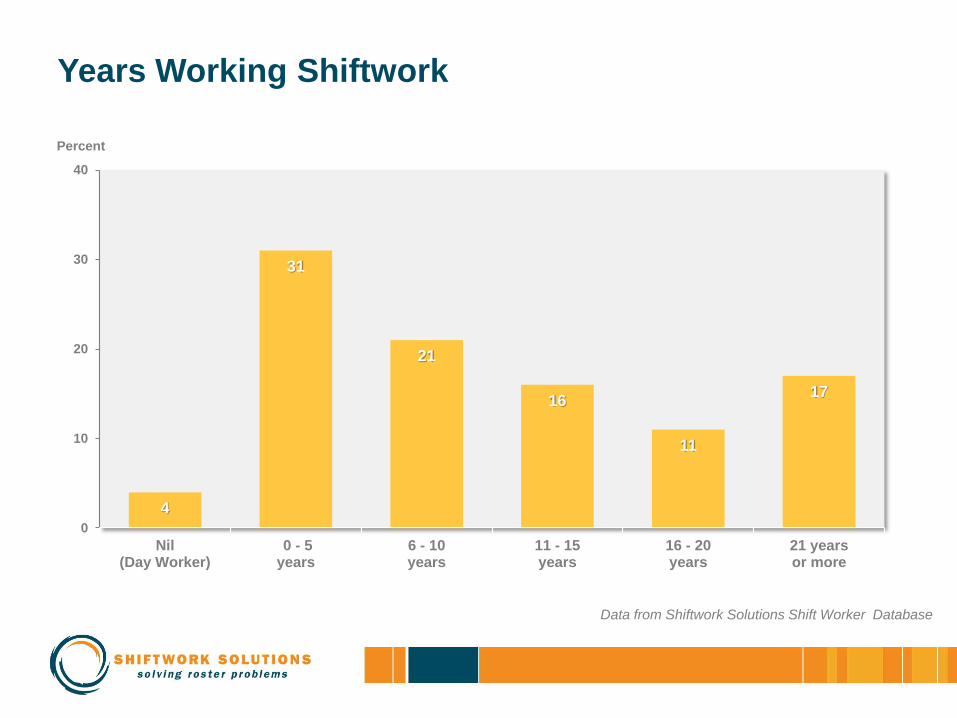
Years Working Shiftwork
Data from Shiftwork Solutions Shift Worker Database
4
31
21
16
11
17
0
10
20
30
40
Nil(Day Worker)
0 - 5years
6 - 10years
11 - 15years
16 - 20years
21 yearsor more
Percent

IDEAL SLEEP RANGE
Employee Sleep Patterns
3.2 3.5 3.7 2.8 Caffeine
(cups per day)
6.7 6.8
5.9
7.8
3
4
5
6
7
8
9
Day Shift Afternoon Shift Night Shift Days Off
Hours of Sleep
Data from Shiftwork Solutions Shift Worker Database

Observed Poor Performance/ Poor Safety Practices
12
5
24 23
36
0
10
20
30
40
Yes, mostlyon Morning shift
Yes, mostly onAfternoon shift
Yes, mostlyon Night shift
Yes, onall shifts
No
Percent
Data from Shiftwork Solutions Shift Worker Database

Preferred Shift Length
28
9
24
3
36
0
10
20
30
40
8 hour shift 9 hour shift 10 hour shift 11 hour shift 12 hour shift
Percent
Data from Shiftwork Solutions Shift Worker Database

Preferred Work Hours per Week Including Overtime
9
5
11
15
12
17 18
5
2
6
0
5
10
15
20
25
30
35 hoursor less
36-37hours
38-39hours
40-41hours
42-43hours
44-45hours
46-50hours
51-55hours
56-59hours
60 ormorehours
Percent
Data from Shiftwork Solutions Shift Worker Database

Preferred Shift Start/Finish Times 8 Hour Shifts
4 6
3
24
14
29
8 9
3 0
10
20
30
40
Earlier than5:00am1:00pm9:00pm
5:00am1:00pm9:00pm
5:30am1:30pm9:30pm
6:00am2:00pm
10:00pm
6:30am2:30pm
10:30pm
7:00am3:00pm
11:00pm
7:30am3:30pm
11:30pm
8:00am4:00pm
Midnight
Later than8:00am4:00pm
Midnight
Percent
Data from Shiftwork Solutions Shift Worker Database

Shift Rotations Example on 8 Hour Shifts
Day Afternoon Night Day
Day Night Afternoon Day
Anti-Clockwise Rotation (Backward)
Clockwise Rotation (Forward)

Continuous Operating Roster Example One: 7 Day, 24 Hours per Day, 8 Hour Shifts, 42 Hour Average Work Week
Crew Week M T W T F S S Roster
Hours
A 1 d d d d - - - 32
B 2 - n n n n n n 48
C 3 n - a a a a a 48
D 4 a a - - d d d 40

Continuous Operating Roster Example Two: 7 Day, 24 Hours per Day, 12 Hour Shifts, 42 Hour Average Work Week
Crew Week M T W T F S S Roster
Hours
A 1 D D - - N N N 60
B 2 - - D D - - - 24
C 3 N N - - D D D 60
D 4 - - N N - - - 24

Managing Workplace Fatigue
Key Strategies
► Site Specific Roster Design
► Health, Alertness and Lifestyle Education Training
► Management of Actual Hours of Work

Developing a Shiftwork Lifestyle & Managing Fatigue
Shiftwork Lifestyle
Body Clock
Sleep Debt
Roster Patterns
Fatigue Management
Lifestyle Choices

Our Biological Clocks
Adapted from:
The Shiftworker’s Handbook
0
25
50
75
100
2400 1200 2400 1200 2400 1200
36
36.5
37
37.5
TIME OF DAY
NIGHT 1
SLEEP
FIRST
NIGHT
SHIFT
DAY 1
AWAKE
DAY 2
AWAKE
DAY 3
SLEEP
Core Body
Temperature
(°C)
Alertness
NIGHT 2
SLEEP

Lifestyle Choices Key Choices For Managing Your Sleep, Alertness and Fatigue
Family &
Friends
Sleep
Environment
Napping
Lighting
Exercise Diet
Nicotine
Sleeping
Pills
Alcohol
Caffeine
Personal Health Habits
STRATEGY

Employee Health Habits
Six health habits positively linked with longevity:
• Proper weight for height, not overweight
• Eat breakfast almost every day
• Sleep 7-8 hours each 24 hour day
• Non-smoker
• Drink less than 2 drinks of alcohol per day
• Regular exercise program
Average number of health habits followed:
Day Worker Benchmark 4.1
Shift Worker Benchmark 3.7

Caffeine Intake
Milligrams of Caffeine
(per typical serving)
COFFEE:
DRIP FILTER 75 – 125 (per cup)
ESPRESSO 40 – 90 (per shot)
INSTANT 45 – 90 (per cup)
ICE 80 (per glass)
DECAFFEINATED 2 – 4 (per cup)
TEA:
BLACK 30 - 70 (per cup)
GREEN 30 - 40 (per cup)
CHOCOLATE:
CHOCOLATE MILK 6 (per cup)
CHOCOLATE BAR 15 - 30 (small bar)
COLAS 50 (per can)
ENERGY DRINKS 80 (per can)
(plus guarana and sugar)
MEDICINES:
PAIN & COLD RELIEF TABS 60 - 130 (2 tablets)
DIET TABLETS 50 - 200 (1 tablet)
STAY AWAKE TABLETS 200 (1 tablet)

Managing Workplace Fatigue
Key Strategies
► Site Specific Roster Design
► Health, Alertness and Lifestyle Education Training
► Management of Actual Hours of Work

• Monitoring actual hours of work and individuals
• Identifying fatigue related risks in the workplace
• Implementing control measures to reduce risks
• Developing policies and guidelines that encourage the management of
fatigue at three different levels
• Self (individual), Peer (team) and Supervisor (manager)
Achieving an Acceptable Level of Risk

Condition Guideline Opportunity for sleep At least 7 hours in any 24 hour period Hours of work (per day) Up to 14 hours in any 24 hour period Hours of work (per week) Up to 60 hours in any 5 to 7 day period Rest break between shifts Minimum 10 hours Rest break between work cycles Minimum 36 to 48 hours or consecutive shifts
Identifying Fatigue Related Risks

Any Questions?

Phone: +61 7 3216 0161
Email: [email protected]
Web: www.shiftworksolutions.com
To download a copy of this presentation
www.shiftworksolutions.com/sugar


