
Managing the “Intangibles”: Business and Entrepreneurship
Perspectives in a Global Context
Coordinators
By
C. Jayachandran, Gian Luca Gregori

Referred of the Society for Global Business and Economic Development
Managing the “Intangibles”: Business and Entrepreneurship Perspectives in a Global Context
Università Politecnica delle Marche, Economics Faculty “Giorgio Fuà”
ISBN 978-88-907795-7-2

User’s attitude to publicity in social webs. A study developed in Mexico
Juan Antonio Vargas-Barraza, [email protected]
Yolanda Araceli Martínez-Padilla, [email protected]
Juan Gaytan-Cortes, [email protected]
Universidad de Guadalajara – CUCEA

User’s attitude to publicity in social webs. A study developed in Mexico
Abstract Being publicity defined as the placing of news and messages to persuade or to inform the members of a specific target market
about products, services and ideas (AMA, 2013). In the later years advertising in electronic media has been rising its numbers
(Nielsen, 2012) and with the users more able to control what they like to watch (Duboff and Wilkerson, 2010), it is important
to determine the attitudes of the users towards advertising in social webs. The attitude has been divided in four components:
trust, information, entertainment and irritability, in order to verify if the advertising has been effective, or positively received
by the users.
Studying several models of attitudes toward the advertising (MacKenzie and Lutz, 1989; Ducoffe, 1996; Brackett and Carr,
2001; Kwek, Tan, and Lau et al., 2010; Hsu-Hsien, 2011; Taylor, 2011), this work came up with a model made of four variables:
trust, information, entertainment and irritability) that help to explains the varying attitudes of users to advertising in social
webs. For the data analysis, we use inferential statistics; we measured the correlations between these variables and the users
(Mexican students). Information of descriptive statistics is also showed to allow a better picture of the results. The study is
focused in the analysis of the students and facebook, because is the main social network used in Mexico (AMIPCI, 2012).
This methodology is innovative because advertising has been studied basically on traditional media, and is proposing a new
model for the study of the attitude toward advertising on line. Also this research made a review of trends and the use of social
webs in Mexico. The outcomes of the research will be helpful for future advertising campaigns, presenting relevant data about
which factors are more positive from the users to the advertising.
Keywords: Social Webs, Advertising, e-marketing, social networks
Introduction
Advertising is defined as “any kind of interpersonal communication paid, in which the known sponsor presents and
promotes ideas, products or services, the ads are then an effective way to disseminate messages, whether to build brand
preference, or to educate consumer” (Kotler and Keller, 2006).
The American Marketing Association (2013) define advertising as “the placement of announcements and
persuasive messages in time or space purchased in any of the media by commercial businesses, non-profits, government
agencies, and individuals seeking to inform and / or persuade members of a particular target market or audience about
their products, services, organizations or ideas”.
For purposes of this study is understood that advertising communication by means other companies, either with
or without profit, in which they seeks to disseminate messages, inform or persuade a particular target market about their
products, services or ideas. In this case the research focuses in the Internet.
Society has evolved rapidly due to the opening in the media such as the Internet; now this is available for a
larger number of users growing so it is important to consider its importance in marketing communication. The electronic
media advertising has increased in recent years and these can be seen in the report presented by Nielsen in 2013, entitled
“2013 Outlook Online Advertising Performance" which surveyed online to a total of 287 companies leading brand, 176
executive agencies and 152 advertising representatives who have participated during the months of January and February
2013. Figure 1 shows the results of the research highlight the importance of social networking in the advertising budget
of the company, whose tendency is to increase spending on online advertising, 70% expressed the intention to increase
its investment in advertising Social Network this year, these being the first medium in which they are willing to invest,
secondly the increase in mobile advertising (69 %) is found, the third place is video advertising (64%) and fourthly Rich
Media advertising is a 23 % increase in advertising spending in the means.
Consumers have adopted new habits and ways of interacting with each other, opening communication
technologies, people can relate to very large distances and immediately. One means to accomplish this communication
in which users can express themselves and talk is social networking. Social media is transforming the way consumers
worldwide make purchase decisions, since they are using social networks to learn about the experiences of other
consumers, to find out more information about brands, products and services, and to find deals and purchase incentives.
(Nielsen, 2012).
834
Advertising in Social Networks
Social networks can be defined as a well-defined set of actors (individuals, groups, organizations, communities, global
partnerships, etc.) Linked to each other through a relationship or a set of social relations" (Lozares, 1996). Social
Networks are classified according to the kind of transfer or exchange that occurs in the network, and can perform basic
functions for the survival of its members, improve the quality of life of its members or maintain a social bond, social
networks serve as an emotional support or instrumental support to provide information, allowing the community to define
in terms of relationships and social ties that exist between the members (Abello Llanos, Madariaga Orozco, and Sierra
García, 1999). Social networks are clearly on the rise compared to other social media such as blogs, who have become
much more specialized than before in their topics, and also within social networks, people are motivated to join
communities brands online to be part of a movement and be aware of the news firsthand related brands they care about.
McCann University proposes that when a marketing project begins in Social Media; consider why people are getting
involved in them and what their motivations are, before trying to understand the platform itself (Hutton and Fosdick,
2011).
Social networks are important for companies because they represent a means of communication that has an
impact on the Internet. According to the study presented by the AMIPCI in 2012 on the Habits of Internet Users, the
main sites that Mexican Internet recalled seeing advertising was search engine (66%) and on social networking sites
(57%).
Social Media sites currently help consumers make purchase decisions by opinions, tastes and preferences of a
much larger set of people who before had driven internet access (Nielsen 2012). Currently Social Media users in that
period, at least 70% listen to the experiences of others, 65% learn about brands, products or services, 53% expressed
positive views of the brands, and 50% also express their complaints or concerns regarding brands or services they have
used, which provides a range information available to a large number of people who might be interested and who value
those opinions. Moreover not all advertising on Facebook ends in a purchase decision because in an article published by
Oreskovic in 2012, emphasizes that four out of five Facebook users have never bought a product or service as a result of
advertising or comment on social networking sites, even when the comments and recommendations made by friends in
Facebook are very important for them. Also, consulting firm McKinsey & Company, believes in the power of word of
mouth recommendations given on the internet, and explains that it is the primary factor affecting between 20 and 50% in
the process of decision making Cart (Duboff & Wilkerson 2010). As for internet, 80% of users seeking information about
brands and products on the Internet and 75% stop to see online advertising according to the study of Mexico Interactive
Advertising Bureau (IAB) in 2012.
Social networks have been a means of communication of important double track between businesses and
consumers and is therefore recommended that companies monitor their brand's reputation and respond appropriately
when (Duboff & Wilkerson, 2010) this is necessary. Companies in Mexico have used social networks as a communication
tool with their market; social networks have served companies to connect with the audience that they wish to connect
with the brand. Through this dialogue have managed to generate brand awareness, for example, Grupo Bimbo has focused
on music as its best tool to connect with younger audiences through social media and Grupo Modelo has created quality
content to the audience by music, sharing videos on YouTube. (Violante, 2012).
Advertising on Social Networks
Advertising in Social Networks can be used to strengthen the brand and position in the minds of consumers, competition,
however traditional advertising remains necessary, online advertising, could be carried out exclusively once the brand
has achieved considerable recognition and value (Pfeiffer & Zinnbauer, 2010).nThe two main benefits are to make social
media marketing include increased exposure and increased traffic. In fact 58% of advertisers had used social networks
for more than three years indicated that had helped them increase their sales. (Stelzner, 2012)
Giamanco & Gregoire (2012) note that more and more people research online before making purchases,
advertising has changed from being sent to be searched by potential buyers because buyers now begin the process of

835
buying, research the company and advance in product research and business, for when they get to the store or contact
the seller carry most advanced process of purchase.
It has become a trend that people investigate by reading blogs, watching videos on YouTube and participate
in forums and using Google to search the offers and promotions and do not look much on advertising that creates a
company in its page, and the information circulating on social networks about the company and the product, direct
information from people is more valuable when seeking references on products that interest them, not participate in
Social Networks puts companies at a competitive disadvantage, it is desirable to train people and create policies
participation in them, because once customers learn to have contact through social networks, it will be impossible to
sell without them (Giamanco & Gregoire 2012) .
Whenever it can be seen that social networks are used by a greater number of companies to advertise, so it is
advisable to know the attitude of social network users to the same, in order to find those factors that are most important
in advertising. The media represent a great opportunity for brands to gain recognition among consumers; savvy
marketers can leverage the growing adoption and influence of social media for business impact (Nielsen 2012).
People who use social networks have seen advertising in them, and companies are increasingly interested in
leveraging this communication platform for people to promote their products or services. It is therefore important to
know the attitude of the consumer in terms of advertising on social networks, for brands that advertise in them enjoy
good acceptance by users.
Now with the ease of communication offered by the Internet, people can interact with organizations. A tool
that provides this facility is a social network, their usage characteristics. Is useful to know which factors considered
important to users that organizations using this platform to offer the best experience to your potential or current
customers, and they are favored with increasing exposure of their brands.
Within social networks, which has the highest number of Internet registry is Facebook, because 90% of
people in a social network are also registered to it. Of the respondents, 90% access social networks daily, and 46% do
so also from your Smartphone (AMIPCI, 2012). By the previous discussion, we can highlight the importance of
considering social media as an important mean.
The social network users now have more control of the brands than few years ago. Have the ability to use
social media to criticize a brand, communicate your experience or opinion, send links to web sites, videos or articles
with information and create content on blogs. (Duboff & Wilkerson 2010).
Due to the fact that in Mexico there is no extensive research regarding advertising on social networks, it is
convenient to open an investigation to study the attitude of the young users of social networks in Mexico. Specifically
this research focuses on young students of the University Center for Economic and Administrative Sciences (CUCEA,
in Spanish), since they have the characteristics of people who represent the majority users of Social Media in our
country. The present investigation, therefore, possible to extend the knowledge we have of internet users in our
country, as there is currently research exploring user attitude toward advertising in social networks but in other
countries.
a. Attitude toward advertising Means attitude, positive or negative evaluations, emotional meaning or tendency to action for a given product or idea,
attitudes lead to consistently behave in similar objects (Kotler and Keller, 2006. P.194). It also can be defined as an
overall assessment as expressing like or dislike an object, issue, person or action, (Hoyer, 2010. P.122), this being
learned and resistant over time, thus reflects the evaluation generally something is done based on the set of associations
linked with it.
The attitude toward advertising is defined as a predisposition to respond favorably or unfavorably to an
advertising stimulus in particular during an exhibition (Lutz, 1985 quoted by MacKenzie, 1989). It is very important
to know the attitude of consumers regarding the marketing strategy of companies, because when they have a strong
negative attitude towards one or more aspects of the marketing practices of the company, they will not only leave to
use the products but create a bad image for the company to share their negative experiences with family and friends.
In selecting the variables used in this investigation it was found that there are factors that are repeated and
that influence consumer attitudes toward advertising. Studies that have measured, have evolved over time, began
836
having models that included a single variable and then the researchers evaluated other variables considered relevant
and included in their models.
Throughout the studies, researchers have included variables that are not statistically significant, so that for
purposes of this research, we used only those found to have consistency across studies. The four variables that have
been studied in this work and that are validated with higher levels of Alpha Chronbach 95%, and that measure attitudes
toward advertising are: trust, information, entertainment and irritation. The models presented here showed statistical
validity which gave them the category of constructs as valid scale for measuring attitude. Presented below, in
chronological order, the main models that were studied and served as the basis for defining the variables used in this
research, the models begin with the study of attitudes toward advertising in general, and then continue climbing
Internet advertising eventually the attitude toward advertising in social networks.
b. Ducoffe model (1996) The models reviewed dealing with attitudes toward advertising in general, Internet advertising, and specifically the
attitude towards advertising on social networks, where the variables considered for statistical methods of analysis were
took from the following: MacKenzie & Lutz’s model (1989), Ducoffe’s model (1996), Brackett & Carr’s model
(2001), Kwek et al. (2010), Hsu-Hsien’s model (2011) and finally Taylor’s model (2011).
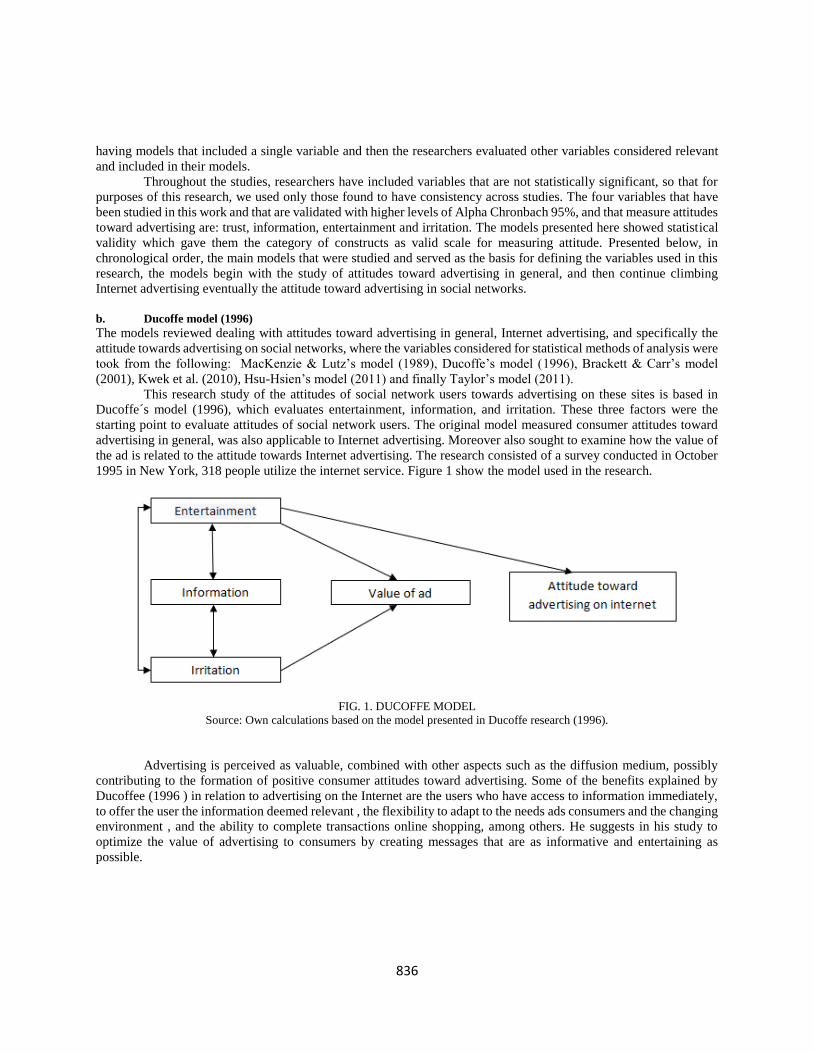
This research study of the attitudes of social network users towards advertising on these sites is based in
Ducoffe´s model (1996), which evaluates entertainment, information, and irritation. These three factors were the
starting point to evaluate attitudes of social network users. The original model measured consumer attitudes toward
advertising in general, was also applicable to Internet advertising. Moreover also sought to examine how the value of
the ad is related to the attitude towards Internet advertising. The research consisted of a survey conducted in October
1995 in New York, 318 people utilize the internet service. Figure 1 show the model used in the research.
FIG. 1. DUCOFFE MODEL
Source: Own calculations based on the model presented in Ducoffe research (1996).
Advertising is perceived as valuable, combined with other aspects such as the diffusion medium, possibly
contributing to the formation of positive consumer attitudes toward advertising. Some of the benefits explained by
Ducoffee (1996 ) in relation to advertising on the Internet are the users who have access to information immediately,
to offer the user the information deemed relevant , the flexibility to adapt to the needs ads consumers and the changing
environment , and the ability to complete transactions online shopping, among others. He suggests in his study to
optimize the value of advertising to consumers by creating messages that are as informative and entertaining as
possible.
837
Later, other authors such as MacKenzie and Lutz (1989) and Eighmey (1997) postulated credibility as a
variable with direct relation to measure the attitudes toward advertising. In addition, a variable with relevant
demographic data was included. Brackett & Carr’s model (2011), includes entertainment, information, irritation,
credibility and relevant demographic variables. Hsu-Hsien (2011) makes a comparative study between interactive
digital advertising and virtual brand communities, studying the motivations and the response toward marketing
activities in social networks. The research presented by Taylor (2011) includes the independent variables
aforementioned and the dependent variable attitude toward advertising in social networks.
Research Hypothesis
Among the main features that are important to evaluate the attitude of users toward advertising, according to studies,
are information, reliability, entertainment and irritation. According to research, information, reliability and
entertainment are positively related to the attitude of Internet users to social networks, and irritation is negatively
related. The reliability, the information you provide, the level of perceived entertainment and advertising irritant
resulting in social networks explain the attitude of users towards such advertising.
H1. Perceived confidence by users regarding advertising in social networks influences the attitude of users towards
it.
H2. The perceived level of information users regarding advertising in social networks influences the attitude of users
towards it.
H3. The entertainment level perceived by users regarding advertising in social networks influences the attitude of
users towards it.
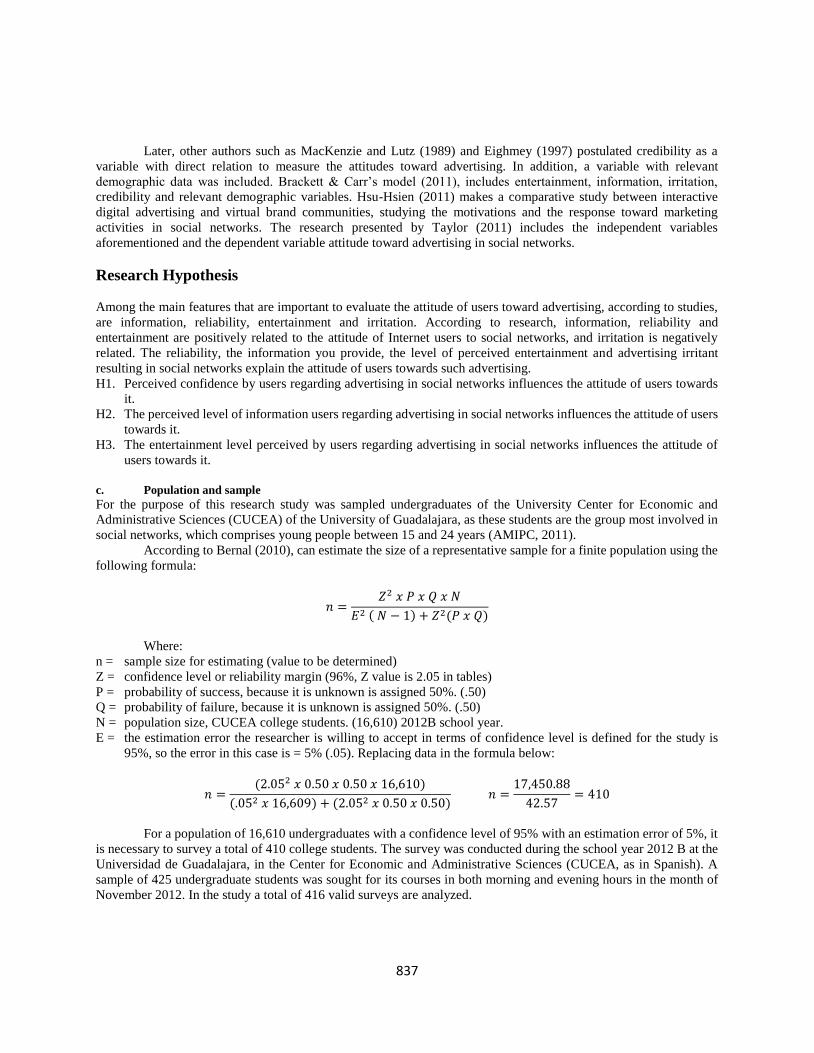
c. Population and sample
For the purpose of this research study was sampled undergraduates of the University Center for Economic and
Administrative Sciences (CUCEA) of the University of Guadalajara, as these students are the group most involved in
social networks, which comprises young people between 15 and 24 years (AMIPC, 2011).
According to Bernal (2010), can estimate the size of a representative sample for a finite population using the
following formula:
𝑛 =𝑍2 𝑥 𝑃 𝑥 𝑄 𝑥 𝑁
𝐸2 ( 𝑁 − 1) + 𝑍2(𝑃 𝑥 𝑄)
Where:
n = sample size for estimating (value to be determined)
Z = confidence level or reliability margin (96%, Z value is 2.05 in tables)
P = probability of success, because it is unknown is assigned 50%. (.50)
Q = probability of failure, because it is unknown is assigned 50%. (.50)
N = population size, CUCEA college students. (16,610) 2012B school year.
E = the estimation error the researcher is willing to accept in terms of confidence level is defined for the study is
95%, so the error in this case is = 5% (.05). Replacing data in the formula below:
𝑛 =(2.052 𝑥 0.50 𝑥 0.50 𝑥 16,610)
(.052 𝑥 16,609) + (2.052 𝑥 0.50 𝑥 0.50) 𝑛 =
17,450.88
42.57= 410
For a population of 16,610 undergraduates with a confidence level of 95% with an estimation error of 5%, it
is necessary to survey a total of 410 college students. The survey was conducted during the school year 2012 B at the
Universidad de Guadalajara, in the Center for Economic and Administrative Sciences (CUCEA, as in Spanish). A
sample of 425 undergraduate students was sought for its courses in both morning and evening hours in the month of
November 2012. In the study a total of 416 valid surveys are analyzed.
838
Validation of hypothesis
To validate hypothesis, a lineal regression process was run in SPSS program to measure each of constructs relative to the
attitude variable. To classify the relationship of each independent variable with the dependent variable is used, the
criterion used by Cortina (1993), in which values of .3 indicate a modest correlation, values of .5 indicate an average
correlation and values of .7 indicate a high correlation. The results obtained from the SPSS system, are used by
introducing all reagents that make each independent variable to measure the relationship with the dependent variable.
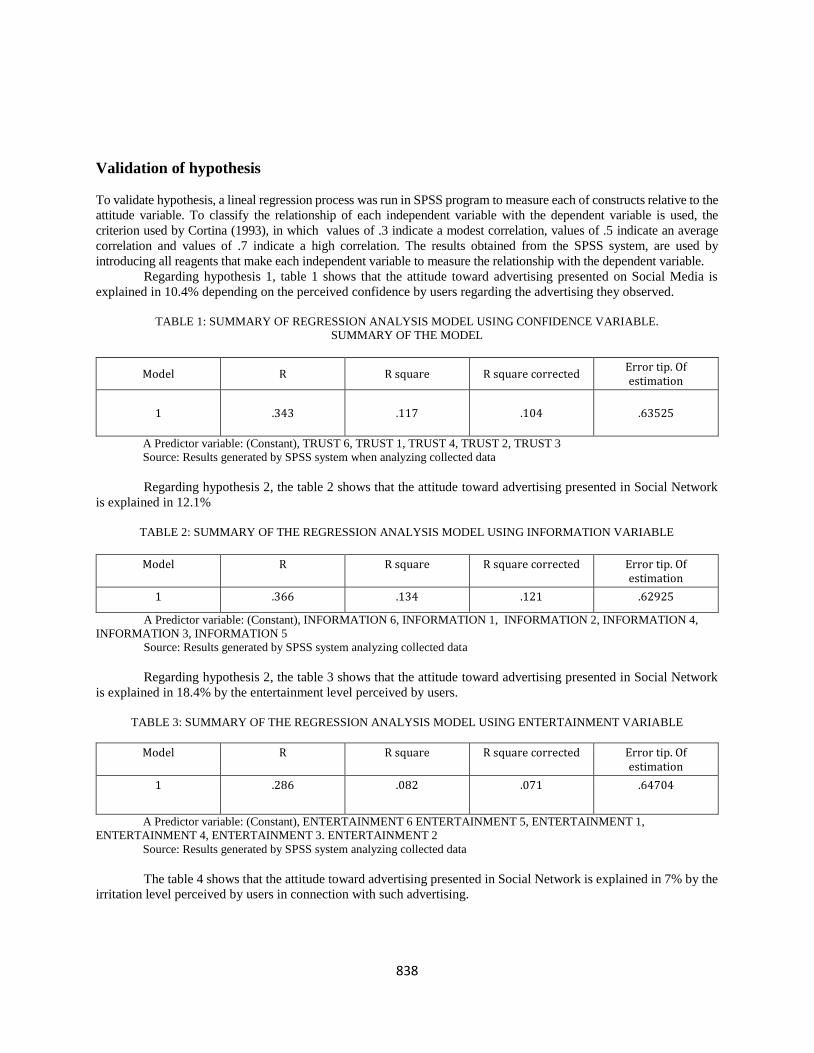
Regarding hypothesis 1, table 1 shows that the attitude toward advertising presented on Social Media is
explained in 10.4% depending on the perceived confidence by users regarding the advertising they observed.
TABLE 1: SUMMARY OF REGRESSION ANALYSIS MODEL USING CONFIDENCE VARIABLE.
SUMMARY OF THE MODEL
A Predictor variable: (Constant), TRUST 6, TRUST 1, TRUST 4, TRUST 2, TRUST 3
Source: Results generated by SPSS system when analyzing collected data
Regarding hypothesis 2, the table 2 shows that the attitude toward advertising presented in Social Network
is explained in 12.1%
TABLE 2: SUMMARY OF THE REGRESSION ANALYSIS MODEL USING INFORMATION VARIABLE
A Predictor variable: (Constant), INFORMATION 6, INFORMATION 1, INFORMATION 2, INFORMATION 4,
INFORMATION 3, INFORMATION 5
Source: Results generated by SPSS system analyzing collected data
Regarding hypothesis 2, the table 3 shows that the attitude toward advertising presented in Social Network
is explained in 18.4% by the entertainment level perceived by users.
TABLE 3: SUMMARY OF THE REGRESSION ANALYSIS MODEL USING ENTERTAINMENT VARIABLE
Model R R square R square corrected Error tip. Of estimation
1 .286 .082 .071 .64704
A Predictor variable: (Constant), ENTERTAINMENT 6 ENTERTAINMENT 5, ENTERTAINMENT 1,
ENTERTAINMENT 4, ENTERTAINMENT 3. ENTERTAINMENT 2
Source: Results generated by SPSS system analyzing collected data
The table 4 shows that the attitude toward advertising presented in Social Network is explained in 7% by the
irritation level perceived by users in connection with such advertising.
Model R R square R square corrected Error tip. Of estimation
1 .343 .117 .104 .63525
Model R R square R square corrected Error tip. Of estimation
1 .366 .134 .121 .62925

839
TABLE 4: SUMMARY OF THE REGRESSION ANALYSIS MODEL USING IRRITANT VARIABLE
Model R R square R square corrected Error tip. Of estimation
1 .286 .082 .071 .64704
A Predictor variable: (Constant), IRRITANT 5, IRRITANT 1, IRRITANT 3, IRRITANT 4, IRRITANT 2
Source: Results generated by SPSS system analyzing collected data
Development Model
To prepare the linear regression model a factor analysis in SPSS system was made by the method of successive steps
to ensure the levels of significance.
It can be seen in Table 5 that the leading variables for the study that have greater relevance are the entertainment
variables, trust and information.
The model generates three variables as more important as the limits for the significance level, which was
determined in 95%, so that the values were not adjusted to this range was automatically discarded.
TABLE 5: ANALYSIS OF THE COMPONENTS BY THE STEPWISE METHOD INTRODUCED VARIABLES/ DELETED
Model Introduced Variable Deleted Variable Method
1 ENTERTAINMENT 6 By steps (criteria: Prob of F to get in <- .050, Prob. Of
F to get out > = .100)
2 TRUST 6 By steps (criteria: Prob of F to get in <- .050, Prob. Of
F to get out > = .100)
3 INFORMATION 6 By steps (criteria: Prob of F to get in <- .050, Prob. Of
F to get out > = .100)
a. dependent variable: ATTITUDE 6
Source: Results generated by SPSS system analyzing collected data
The linear regression analysis by the stepwise method was used to obtain an overview of the model and
observe the changes in R square for each component proposed by the system. It can be seen in table 28.
The first model includes only the entertainment variable and explanatory variable indicates that the attitude
toward advertising in social networks itself in 16.5%.
The second model also includes the trust variable and indicates that the set of these two variables explain the
attitude towards social media in 20.5%.
The third model also includes information variable and indicates that all of these three variables explains the
attitude by 21.3%, with significance greater than 95%.
TABLE 6: QUOTIENTS OF INDEPENDENT VARIABLES USING FOLLOWING STEPS METHOD SUMMARY OF THE
MODEL
Model R R square R square corrected
Error tip. Of estimation
Change in R square
Change in F
gl 1 gl2 Next change in F
1 409a .167 .165 .61338 .167 83.011 1 414 .000 2 457b .209 .205 .59861 .042 21.676 1 413 .000 3 468c .219 .213 .59537 .010 5.512 1 412 .019
840
a predictor variable: (constant), Entertainment construct
b predictor variable: (constant), Entertainment construct, trust construct
c predictor variable: (constant), Entertainment construct, trust construct , Information construct
Source: Results generated by SPSS system analyzing collected data
The value of the square R is the coefficient of determination in the model, and it indicates the proportion of
variance in the dependent variable that is explained by the independent or production variables, the coefficient is
located between 0 and 1, the higher the value of R square, the greater the explanatory power of the regression equation,
and therefore the prediction of the dependent variable. (Hair, 2010. p.193).
In Table 6 the model that includes the three variables that were significant in explaining attitudes toward
advertising in 21.3%, taking into account the adjusted R value and not the value of R because increasing the number
of observed variables in an equation, it will increase the value of R square.
It is therefore necessary to adjust the value of R so that it is representative. The R square value increased with
the increase in the number of variables used, or decrease if a variable that is not statistically significant in the equation
is introduced, that is, it does not affect the dependent variable. To obtain the adjusted R squared value, you can detect
which variables are the ones which explain better the model and in what proportion do. (Hair, 2010).
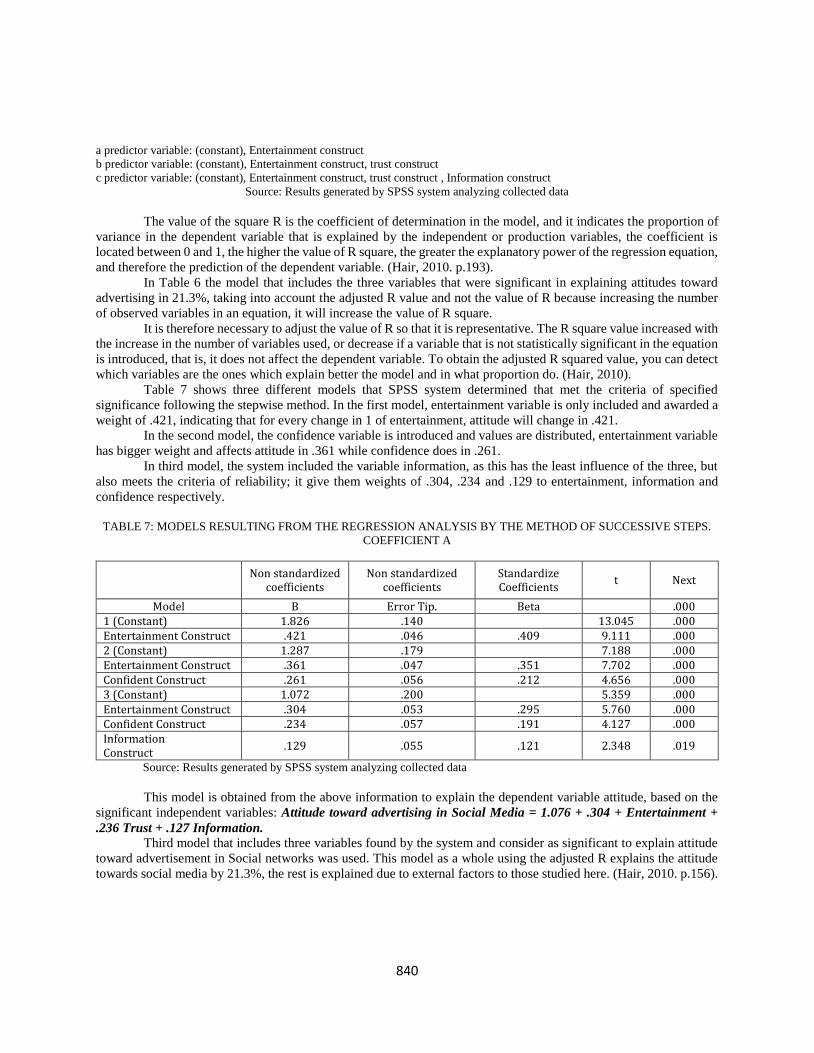
Table 7 shows three different models that SPSS system determined that met the criteria of specified
significance following the stepwise method. In the first model, entertainment variable is only included and awarded a
weight of .421, indicating that for every change in 1 of entertainment, attitude will change in .421.
In the second model, the confidence variable is introduced and values are distributed, entertainment variable
has bigger weight and affects attitude in .361 while confidence does in .261.
In third model, the system included the variable information, as this has the least influence of the three, but
also meets the criteria of reliability; it give them weights of .304, .234 and .129 to entertainment, information and
confidence respectively.
TABLE 7: MODELS RESULTING FROM THE REGRESSION ANALYSIS BY THE METHOD OF SUCCESSIVE STEPS.
COEFFICIENT A
Non standardized coefficients
Non standardized coefficients
Standardize Coefficients
t Next
Model B Error Tip. Beta .000 1 (Constant) 1.826 .140 13.045 .000 Entertainment Construct .421 .046 .409 9.111 .000 2 (Constant) 1.287 .179 7.188 .000 Entertainment Construct .361 .047 .351 7.702 .000 Confident Construct .261 .056 .212 4.656 .000 3 (Constant) 1.072 .200 5.359 .000 Entertainment Construct .304 .053 .295 5.760 .000 Confident Construct .234 .057 .191 4.127 .000 Information Construct
.129 .055 .121 2.348 .019
Source: Results generated by SPSS system analyzing collected data
This model is obtained from the above information to explain the dependent variable attitude, based on the
significant independent variables: Attitude toward advertising in Social Media = 1.076 + .304 + Entertainment +
.236 Trust + .127 Information.
Third model that includes three variables found by the system and consider as significant to explain attitude
toward advertisement in Social networks was used. This model as a whole using the adjusted R explains the attitude
towards social media by 21.3%, the rest is explained due to external factors to those studied here. (Hair, 2010. p.156).
841
Conclusion
Analyzing data using SPSS statistical system shows that entertainment and reliable information are relevant for social
networks users when having a positive attitude toward advertisement presented within them. These findings are
consistent with previous research that found that advertising is considered entertaining (MacKenzie & Lut, 1989;
Kwek, et al. 2010; Hsu-Hsien, 2010; Taylor, 2011), informative (MacKenzie & Lutz, 1989; Brackett & Carr, 2001;
Kwek, et al. 2010; Hsu-Hsien, 2011; Taylor, 2011) and that the credibility is an important factor to evaluate their
attitude towards it (MacKenzie & Lutz, 1989; Backett & Carr, 2001; Kwek, et al. 2010).
Moreover, the irritation factor had no significant relevance when determining the attitude of users toward
advertising presented in social networks, in contrast to the results obtained by Brackett & Carr (2001).
The research results indicate that 38% of respondents have a positive attitude toward advertising presented
on social networking sites. When presenting advertising on social networking sites is important to consider various
features of the ads so that users can have the same positive attitude. When internet users are on social networking sites,
these are not actively looking for ads brands, but they are interested to know the opinions of people who are part of
their social network regarding products or services that have used, and which they can share their experiences. People
value the evaluations made by the people who are part of their social circles, so they are receptive to receiving
information that might be useful.
Advertising that is presented in the Social Networking sites must possess characteristics that make users have
a favorable attitude toward it so it should include features that are valued. It is advisable advertising is attractive,
containing characteristics that make it interesting, entertaining and funny, it is also important to be a reliable source
of information so what is presented in advertisement must be relevant to spectator to adjust advertising to target
audience, finally is important that ads are reliable, it means, advertiser and ads represent a reliable source of
information on which the target audience can takes as real to base their purchase decision.
The relevant advertising allows Internet users who are constantly looking for information on the Internet to
make more informed purchases; an ad which provides clear and honest information will be more attractive to
consumers. Reliable advertising will enjoy acceptance among internet users.
Finally, Internet users will have a better attitude toward advertising in social networks, if it has features that
make it fun and entertaining. Internet users have a positive attitude toward advertising presented in social networks so
they can be used by brand to create brand awareness and loyalty, recommendations spreading the word, favoring the
opportunities to become viral certain advertising content.When a Social Network user has a positive attitude toward
advertisement seen, he tends to share to share it among his network contacts which facilitates the spread of content,
sometimes making them viral.
Limitations
This research focused on students of the Universidad de Guadalajara, in CUCEA, the campus for Economic and
Administrative Sciences, but is not representative of the population, so it is necessary to make wider to deepen
consumer awareness tests. This research is limited by the studied population; it is therefore not representative of
Mexican society, or the population of Jalisco. Therefore, intended to provide a better knowledge of the consumer
regarding to his attitude toward advertising in Social Networks.
It is important to consider that this was not a controlled study and it would be desirable to create a study in
which the variables are managed and can perform other types of statistical analysis that allows obtaining more precise
information.
The study was made considering only advertising showed in Social Networks, and it does not consider pages
created by brands inside the social networks. There are research that show that virtual brand communities within Social
Networks sites are well received by the internet users, since they are part of those communities seeking information,
as well as offering opportunities for brand promotions (Hsu-Hsien, 2011). Investigate about advertising in virtual
brand communities is a future line of research that was not covered in the present study.
842
References
[1] Abello Llanos, R., Madariaga Orozco, C. and Sierra García, O. (1999), Relationship between the social
networks and the family dynamics of low-income working women. J. Community Psychol., 27: 243–255.
doi: 10.1002/(SICI)1520-6629 (199905)27:3
[2] AMA American Marketing Association, (2013). Resource library. Taken on may 10, 2013 from
http://www.marketingpower.com/_layouts/Dictionary.aspx?source=footer
[3] AMIPCI (2012). Hábitos de los usuarios de internet en México.
http://www.amipci.org.mx/?P=editomultimediafile&Multimedia=115&Type=1
[4] Brackett, L. K., Carr Jr., B. N. (2001). Cyberspace Advertising vs. Other Media: Consumer vs. Mature
Student Attitudes. Journal of Advertising Research, 41(5), 23-32.
[5] Duboff, R., Wilkerson, S. (2010). Social Media ROI. Marketing Management, 19(4), 32-37.
[6] Ducoffe, R. H. (1996). Advertising Value and Advertising the Web. Journal of Advertising Research, 36(5),
21-35.
[7] Hutton, G., Fosdick, M. (2011). The globalization of social media: Consumer relationships with brands
evolve in the digital space. Journal of advertising research..
[8] Hsu-Hsien, C. (2011). Interactive digital advertising vs. Virtual brand community: exploratory study of user
motivation and social media marketing responses in Taiwan. Journal of Interactive Advertising, 12(1), 44-
61.
[9] Kotler P. Keller, K. L. (2006). Dirección de marketing. Pearson Educación de México SA de CV.
[10] Kwek Choon, L., Tan Hoi, P., Lau Teck, C. (2010). The Determinants of Consumers' Attitude Towards
Advertising. Canadian Social Science, 6(4), 114-126.
[11] Lozares, C. (1996). La teoría de redes sociales. Revista Papers, 48, 103-126.
[12] MacKenzie, S. B., & Lutz, R. J. (1989). An Empirical Examination of the Structural Antecedents of Attitude
Toward the Ad in an Advertising Pretesting Context. Journal of Marketing, 53(2), 48-65
[13] Nielsen. (2012). State of the Media: The Social Media Report 2012.
[14] Oreskovic, A. (2012). Facebook comments, ads don’t sway most users: pool. Reuters.
http://www.reuters.com/article/2012/06/05/net-us-facebook-survey-idUSBRE85400C20120605 july 5
2012.
[15] Taylor, D. G., Lewin, J. E. & Strutton D. (2011). Friends, Fans, and Followers: Do Ads Work on Social
Networks? Journal of Advertising Research, 51(1), 258-275.
Contact the authors for the full list of references


