Marine Cargo and Waterborne
Commerce in Hawaii’s Economy
Trends and Patterns in Hawaii Marine Cargo
2001 – 2016
May 2019
State of Hawaii Department of Business, Economic Development & Tourism
Table of Contents
I. INTRODUCTION 1
II. HAWAII’S MARINE CARGO SHIPMENT FLOWS AND PATTERNS 3
A. HAWAII’S INBOUND AND OUTBOUND MARINE CARGO SHIPMENTS 3
B. HAWAII’S INBOUND MARINE CARGO SHIPMENTS FROM DOMESTIC AND
INTERNATIONAL ORIGINS 5
C. HAWAII’S OUTBOUND MARINE CARGO SHIPMENTS TO DOMESTIC AND
INTERNATIONAL DESTINATIONS 7
III. HAWAII’S MARINE CARGO SECTOR JOBS 9
IV. HAWAII’S MARINE CARGO SHIPMENTS BY COMMODITY 12
V. HAWAII’S MARINE CARGO SHIPMENTS BY COUNTY 16
REFERENCES 22
APPENDIX 23

This report was produced by the Research and Economic Analysis Division (READ)
of the Department of Business, Economic Development & Tourism (DBEDT) under
the direction of the Dr. Eugene Tian, Economic Research Administrator. The report
was authored by Joseph Roos, Nicholas Borum, and Leonid Bak. Sunny Ajala and
Andrew Wilson assisted with the editing.
iii
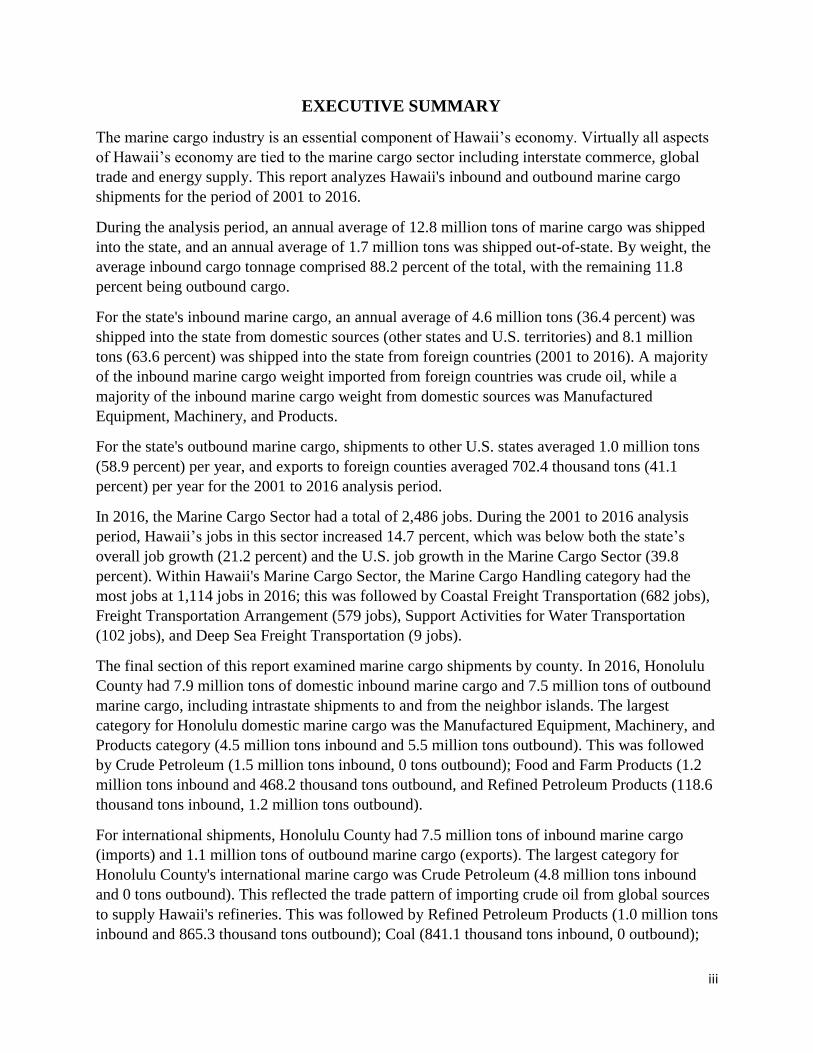
EXECUTIVE SUMMARY
The marine cargo industry is an essential component of Hawaii’s economy. Virtually all aspects
of Hawaii’s economy are tied to the marine cargo sector including interstate commerce, global
trade and energy supply. This report analyzes Hawaii's inbound and outbound marine cargo
shipments for the period of 2001 to 2016.
During the analysis period, an annual average of 12.8 million tons of marine cargo was shipped
into the state, and an annual average of 1.7 million tons was shipped out-of-state. By weight, the
average inbound cargo tonnage comprised 88.2 percent of the total, with the remaining 11.8
percent being outbound cargo.
For the state's inbound marine cargo, an annual average of 4.6 million tons (36.4 percent) was
shipped into the state from domestic sources (other states and U.S. territories) and 8.1 million
tons (63.6 percent) was shipped into the state from foreign countries (2001 to 2016). A majority
of the inbound marine cargo weight imported from foreign countries was crude oil, while a
majority of the inbound marine cargo weight from domestic sources was Manufactured
Equipment, Machinery, and Products.
For the state's outbound marine cargo, shipments to other U.S. states averaged 1.0 million tons
(58.9 percent) per year, and exports to foreign counties averaged 702.4 thousand tons (41.1
percent) per year for the 2001 to 2016 analysis period.
In 2016, the Marine Cargo Sector had a total of 2,486 jobs. During the 2001 to 2016 analysis
period, Hawaii’s jobs in this sector increased 14.7 percent, which was below both the state’s
overall job growth (21.2 percent) and the U.S. job growth in the Marine Cargo Sector (39.8
percent). Within Hawaii's Marine Cargo Sector, the Marine Cargo Handling category had the
most jobs at 1,114 jobs in 2016; this was followed by Coastal Freight Transportation (682 jobs),
Freight Transportation Arrangement (579 jobs), Support Activities for Water Transportation
(102 jobs), and Deep Sea Freight Transportation (9 jobs).
The final section of this report examined marine cargo shipments by county. In 2016, Honolulu
County had 7.9 million tons of domestic inbound marine cargo and 7.5 million tons of outbound
marine cargo, including intrastate shipments to and from the neighbor islands. The largest
category for Honolulu domestic marine cargo was the Manufactured Equipment, Machinery, and
Products category (4.5 million tons inbound and 5.5 million tons outbound). This was followed
by Crude Petroleum (1.5 million tons inbound, 0 tons outbound); Food and Farm Products (1.2
million tons inbound and 468.2 thousand tons outbound, and Refined Petroleum Products (118.6
thousand tons inbound, 1.2 million tons outbound).
For international shipments, Honolulu County had 7.5 million tons of inbound marine cargo
(imports) and 1.1 million tons of outbound marine cargo (exports). The largest category for
Honolulu County's international marine cargo was Crude Petroleum (4.8 million tons inbound
and 0 tons outbound). This reflected the trade pattern of importing crude oil from global sources
to supply Hawaii's refineries. This was followed by Refined Petroleum Products (1.0 million tons
inbound and 865.3 thousand tons outbound); Coal (841.1 thousand tons inbound, 0 outbound);
iv
Primary Manufactured Goods (428.3 thousand tons inbound, 5.2 thousand tons outbound);
Materials (213.7 thousand tons inbound, 153.3 thousand tons outbound), and Manufactured
Equipment, Machinery, and Products (103.0 thousand tons inbound, 15.2 thousand tons
outbound).
For the neighbor island counties, domestic and international categories were combined due to
transshipments making the international data difficult to track. Following Honolulu County,
Hawaii County was second in shipping tonnage, with 2.8 million tons of inbound and 1.4 million
tons of outbound marine cargo shipments in 2016. The largest category was Manufactured
Equipment, Machinery, and Products (2.1 million tons inbound, 1.3 million tons outbound). This
was followed by refined Petroleum Products (420,898 tons inbound, 473 tons outbound),
reflecting the demand for energy and fuel products sourced from Oahu. The Food and Farm
Products category ranked third (94,405 tons inbound, 60,580 tons outbound).
Maui County had 2.4 million tons of inbound and 1.5 million tons of outbound marine cargo in
2016. The largest cargo category was Manufactured Equipment, Machinery, and Products (1.8
million tons inbound, 1.2 million tons outbound). This was followed by refined Petroleum
Products (395,994 tons inbound, 716 tons outbound); Food and Farm Products (112,819 tons
inbound, 199,948 tons outbound), and Primary Manufactured Goods (63,368 tons inbound, 5,128
tons outbound)
Kauai County had 1.4 million tons of inbound and 679,345 tons of outbound marine cargo in
2016. The largest category for Kauai was Manufactured Equipment, Machinery, and Products
(1.1 million tons inbound, 662,915 tons outbound). This was followed by refined Petroleum
Products (190,625 tons inbound, 131 tons outbound); Food and Farm Products (34,722 tons
inbound, 6,283 tons outbound); and Primary Manufactured Goods (24,490 tons inbound, 3,829
tons outbound).
1
I. Introduction
The marine cargo industry is an essential component of Hawaii’s economy. It provides the
infrastructure that allows supply chains to flow in and out of the state. Virtually all aspects of
Hawaii’s economy are tied to the marine cargo industry including energy supply, interstate
commerce, and global trade.
Marine cargo is a highly regulated industry. For much of the twentieth century, the ocean
shipping industry operated as a highly regulated cartel through conference agreements (Buderi,
1986). Generally, this environment continued until the 1980’s era of deregulation. In 1984, The
Shipping Act was enacted to improve the efficiency of ocean transportation through an increased
reliance on market forces (Federal Maritime Commission, 1989). The industry was further
deregulated under The Ocean Shipping Reform Act of 1998, which increased rate competition
for ocean freight (Federal Maritime Commission, 2001).
On a global scale, the marine cargo industry is much larger than the air cargo industry when
measured by the volume of goods transported. In 2016, it was estimated that the world marine
cargo industry shipped approximately 10.3 billion tons of freight. A majority of the marine cargo
was bulk commodities, including oil, metal ores, and grains, that were low value and non-time-
sensitive. By weight, 31 percent was bulk cargo, 29 percent oil and gas, 23 percent dry cargo,
and 17 percent containerized cargo (United Nations, 2017).
In contrast to marine freight, air freight shipments are time-sensitive, high value, and/or
perishable. The shipper is willing to pay the higher cost of air freight to get the goods delivered
within a shorter time frame. Goods that are shipped by air include computers, consumer
electronics, pharmaceuticals, apparel, and produce. In 2017, air freight shipped approximately
68.2 million tons globally (Crabtree et al, 2018). It is estimated that less than 1 percent of world
trade tonnage is carried by air cargo, but because of the high value of these goods, they represent
about 35 percent of the total value of goods shipped globally.
While this report looks at Hawaii's marine freight, a previous report analyzed Hawaii's air freight
industry (DBEDT, 2017). In 2016, Hawaii’s inbound air freight was 377,927 tons and outbound
air freight was 245,853 tons. The analysis showed that the top commodities for inbound air
freight by value were electronics, fashion, jewelry and accessories, instruments and machinery,
and vehicles and transport equipment. In spite of the expansion of air freight alongside e-
commerce growth, a vast majority of Hawaii’s freight still moves by water.
In looking out into the future, biosecurity measures will play an increasing role in the marine
cargo industry. This is especially salient for Hawaii’s agriculture industry due to the potential
transport of invasive species and pests that can harm crops. A survey of Hawaii’s farmers
showed that 72.5 percent of the respondents had concerns over pest transference from
consolidated freight shipments (HADC, 2008). Hawaii is addressing these concerns through an
interagency biosecurity plan that includes a strategy to reduce the transportation of invasive
species through increased monitoring, treatment, education, facilities, and other measures
(HDA/HDLNR, 2016). Another trend for marine shipping is the adoption of larger vessels with
increased freight capacity. A recent example of this is the Daniel K. Inouye containership
2
christened by Matson in 2018 (Gomes, 2018). The vessel has a capacity of 3,600 twenty-foot
containers, making it the largest vessel in the fleet. Finally, while the industry has made
significant gains in adopting technology, the marine cargo industry still relies on inefficient
processes and proprietary systems. Integration of modern technologies such as artificial
intelligence, cloud computing, and digital ledgers will continue to increase efficiencies across
maritime supply chains (Saxon, 2017).

3
II. Hawaii’s Marine Cargo Shipment Flows and Patterns
A. Hawaii’s Inbound and Outbound Marine Cargo Shipments
Figure 1 shows marine freight traffic from 2001 to 2016 by the weight of inbound and outbound
freight including domestic (U.S. mainland) and foreign sources and destinations. It is important
to note that the unit of analysis is short-tons (tons), rather than dollar value. This is a salient
point for interpreting the results, because large swings in the data do not necessarily reflect large
swings in the value of shipments. On the one hand, electronics are a high value-added item that,
generally, are lightweight. On the other hand, construction materials such as steel girders,
cement, and lumber are extremely heavy but of relatively low value compared to other items.
Therefore, data based on weight is more sensitive to industries that use heavy materials, such as
construction materials and crude oil, as opposed to lightweight consumer products that have a
high value such as electronics.
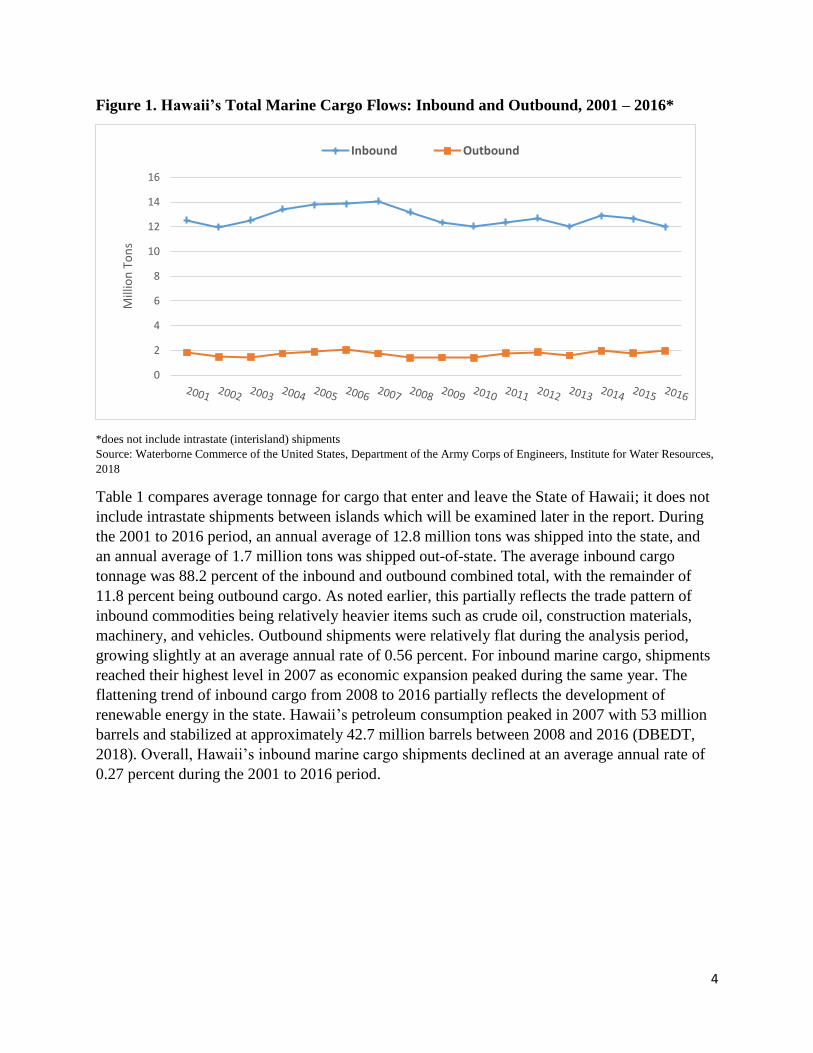
Figure 1 shows inbound and outbound marine cargo to and from the state, excluding intrastate
(interisland) shipments. In looking at the 2001 to 2016 period, the average inbound marine
cargo tonnage was 12.8 million tons per year, with a maximum value of 14.1 million tons in
2007. As the recession took hold in 2008 inbound marine cargo gradually declined, reaching a
post-recession low of 12.0 million tons in 2013. While cargo tonnage grew slightly in 2014, it
again declined to the previous low of 12.0 million tons in 2016. This can partially be explained
by the lower levels of crude petroleum imports into Barbers Point, which declined 5.4 percent
from 2014 to 2016.
The average weight for outbound marine cargo was 1.7 million tons for the 2001 to 2016
period. During the analysis period, the weight of outbound cargo reached a peak of 2.0 million
tons in 2006 and then declined from 2007 to a low of 1.4 million tons in 2010 as shipments
slowed with the recession. The tonnage recovered for 2011 and 2012, dropped in 2013, and then
hovered around 1.9 million tons from 2014 through 2016.
4
Figure 1. Hawaii’s Total Marine Cargo Flows: Inbound and Outbound, 2001 – 2016*
*does not include intrastate (interisland) shipments
Source: Waterborne Commerce of the United States, Department of the Army Corps of Engineers, Institute for Water Resources,
2018
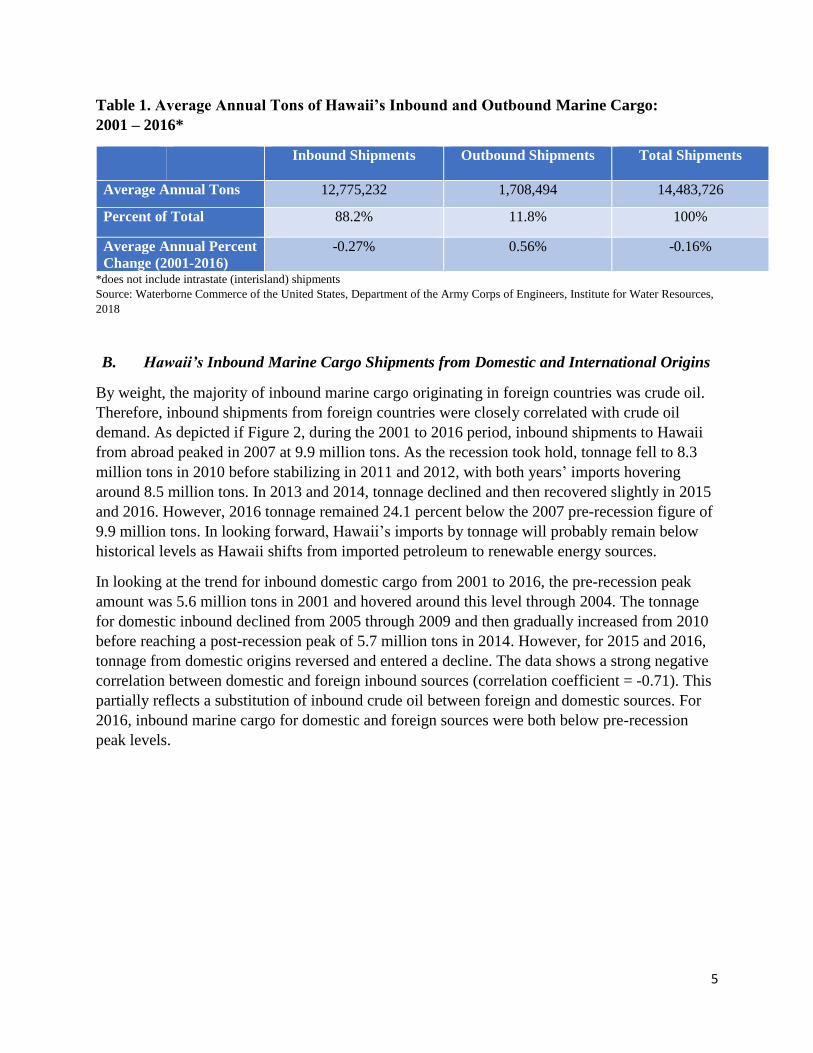
Table 1 compares average tonnage for cargo that enter and leave the State of Hawaii; it does not
include intrastate shipments between islands which will be examined later in the report. During
the 2001 to 2016 period, an annual average of 12.8 million tons was shipped into the state, and
an annual average of 1.7 million tons was shipped out-of-state. The average inbound cargo
tonnage was 88.2 percent of the inbound and outbound combined total, with the remainder of
11.8 percent being outbound cargo. As noted earlier, this partially reflects the trade pattern of
inbound commodities being relatively heavier items such as crude oil, construction materials,
machinery, and vehicles. Outbound shipments were relatively flat during the analysis period,
growing slightly at an average annual rate of 0.56 percent. For inbound marine cargo, shipments
reached their highest level in 2007 as economic expansion peaked during the same year. The
flattening trend of inbound cargo from 2008 to 2016 partially reflects the development of
renewable energy in the state. Hawaii’s petroleum consumption peaked in 2007 with 53 million
barrels and stabilized at approximately 42.7 million barrels between 2008 and 2016 (DBEDT,
2018). Overall, Hawaii’s inbound marine cargo shipments declined at an average annual rate of
0.27 percent during the 2001 to 2016 period.
0
2
4
6
8
10
12
14
16
Mill
ion
To
ns
Inbound Outbound
5
Table 1. Average Annual Tons of Hawaii’s Inbound and Outbound Marine Cargo:
2001 – 2016*
Inbound Shipments
Outbound Shipments Total Shipments
Average Annual Tons 12,775,232 1,708,494 14,483,726
Percent of Total 88.2% 11.8% 100%
Average Annual Percent
Change (2001-2016)
-0.27% 0.56% -0.16%
*does not include intrastate (interisland) shipments
Source: Waterborne Commerce of the United States, Department of the Army Corps of Engineers, Institute for Water Resources,
2018
B. Hawaii’s Inbound Marine Cargo Shipments from Domestic and International Origins
By weight, the majority of inbound marine cargo originating in foreign countries was crude oil.
Therefore, inbound shipments from foreign countries were closely correlated with crude oil
demand. As depicted if Figure 2, during the 2001 to 2016 period, inbound shipments to Hawaii
from abroad peaked in 2007 at 9.9 million tons. As the recession took hold, tonnage fell to 8.3
million tons in 2010 before stabilizing in 2011 and 2012, with both years’ imports hovering
around 8.5 million tons. In 2013 and 2014, tonnage declined and then recovered slightly in 2015
and 2016. However, 2016 tonnage remained 24.1 percent below the 2007 pre-recession figure of
9.9 million tons. In looking forward, Hawaii’s imports by tonnage will probably remain below
historical levels as Hawaii shifts from imported petroleum to renewable energy sources.
In looking at the trend for inbound domestic cargo from 2001 to 2016, the pre-recession peak
amount was 5.6 million tons in 2001 and hovered around this level through 2004. The tonnage
for domestic inbound declined from 2005 through 2009 and then gradually increased from 2010
before reaching a post-recession peak of 5.7 million tons in 2014. However, for 2015 and 2016,
tonnage from domestic origins reversed and entered a decline. The data shows a strong negative
correlation between domestic and foreign inbound sources (correlation coefficient = -0.71). This
partially reflects a substitution of inbound crude oil between foreign and domestic sources. For
2016, inbound marine cargo for domestic and foreign sources were both below pre-recession
peak levels.

6
Figure 2. Hawaii’s Inbound Marine Cargo from Domestic and Foreign Origins,
2001 – 2016*
*does not include intrastate (interisland) shipments
Source: Waterborne Commerce of the United States, Department of the Army Corps of Engineers, Institute for Water Resources,
2018
Table 2 compares inbound cargo by average tonnage brought in from domestic and foreign
sources. During the 2001 to 2016 period, an annual average of 4.6 million tons (36.4 percent)
was shipped into the state from domestic sources (other states and U.S. territories) and 8.1
million tons (63.6 percent) was shipped into the state from foreign countries. In examining the
average annual growth rate for the 2001 to 2016 period, inbound tonnage from domestic sources
decreased at an average annual rate of 1.52 percent, while tonnage from international sources
increased at a rate of 0.60 percent. As noted above, this can partially be explained by the
substitution of crude oil between foreign and domestic sources. Overall, Hawaii’s inbound
marine cargo shipping activity declined at an average annual rate of 0.27 percent.
Table 2. Average Annual Tons of Inbound Marine Cargo to Hawaii: 2001 – 2016*
Domestic Shipments
(from other US states &
territories)
International Shipments
(from foreign-countries)
Total Inbound
Shipments
Average Annual Tons 4,644,988 8,130,243 12,775,231
Percent of Total 36.4% 63.6% 100%
Average Annual Percent
Change (2001-2016)
-1.52% 0.60% -0.27%
*does not include intrastate (interisland) shipments
Source: Waterborne Commerce of the United States, Department of the Army Corps of Engineers, Institute for Water Resources,
2018
0
2
4
6
8
10
12
Mill
ion
To
ns
Domestic Origin (other US states & territories) Foreign-Country Origin

7
C. Hawaii’s Outbound Marine Cargo to Domestic and International Destinations
Figure 3 compares outbound marine cargo to domestic (other states and territories) and foreign-
country destinations. It is important to note that the amounts do not include intrastate shipments
between islands, which will be examined separately. For the analysis period of 2001 to 2016,
marine cargo tonnage shipped from Hawaii to domestic destinations has been fairly volatile.
From 2001 to 2003, the amount shipped declined from 1.1 million tons to a low of 741.1
thousand tons. Marine shipping volumes then recovered and increased to a pre-recession peak of
1.3 million tons in 2006. However, as the recession took hold, tonnage declined to 813.5
thousand tons in 2008. During the recovery period, a new peak was reached in 2012 at 1.5
million tons before eventually declining to 878.9 thousand tons in 2016.
For Hawaii exports to foreign countries, outbound marine cargo volumes hovered around 700
thousand tons between 2001 and 2006. As exports slowed with the recession, outbound tonnage
to foreign countries declined from 752.9 thousand tons in 2006 to 506.4 thousand tons in 2010;
volumes bounced back in 2011 to 618.6 thousand tons and then declined to 403.4 thousand tons
in 2012. In 2014, outbound marine cargo to foreign countries surged to 1.1 million tons,
surpassing cargo to domestic destinations. A closer look at the data by commodity shows that a
majority of this surge was due to increased exports of petroleum-related products. The levels
remained high in 2016 at 1.1 million tons, 45.0 percent above the pre-recession peak level.
Figure 3. Outbound Marine Cargo from Hawaii to Other States and Foreign Countries,
2001-2016*
* does not include intrastate (interisland) shipments
Source: Waterborne Commerce of the United States, Department of the Army Corps of Engineers, Institute for Water Resources,
2018
0
200
400
600
800
1,000
1,200
1,400
1,600
Tho
usa
nd
To
ns
Domestic Destination (other US states & territories) Foreign-Country Destination

8
Table 3 shows outbound annual averages for cargo shipped to domestic and international
destinations. Outbound marine cargo shipments to other U.S. states averaged 1.0 million tons per
year, which was significantly higher than the 702.4 thousand tons average for outbound
shipments to international destinations. Domestic destinations comprised a majority of outbound
shipments, accounting for 58.9 percent of the total with the remaining 41.1 percent being exports
to foreign countries. During the 2001 to 2016 analysis period, domestic outbound shipments
decreased at an average annual rate of 1.29 percent, while international outbound shipments
increased at an average annual rate of 2.57 percent. Overall, Hawaii’s outbound marine cargo
increased at an average annual rate of 0.56 percent during the 2001 to 2016 period.
Table 3. Average Annual Tons of Outbound Marine Cargo from Hawaii: 2001 – 2016*
Domestic
Shipments
(to other US states)
International
Shipments
(to other countries)
Total Outbound
Shipments
Average Annual Tons 1,006,123 702,372 1,708,495
Percent of Total 58.9% 41.1% 100%
Average Annual Percent
Change (2001-2016)
-1.29% 2.57% 0.56%
* does not include intrastate (interisland) shipments
Source: Waterborne Commerce of the United States, Department of the Army Corps of Engineers, Institute for Water Resources,
2018
9
III. Hawaii’s Marine Cargo Sector Jobs
Based on an analysis of Hawaii’s marine cargo activities, five NAICS codes were identified as
related to the marine cargo sector: Marine Cargo Handling (488320), Coastal Freight
Transportation (483113), Deep Sea Freight Transportation (483111), Freight Transportation
Arrangement (488510), and Other Support Activities for Water Transportation (488390). The
definitions of these NAICS codes are included in the appendix section.
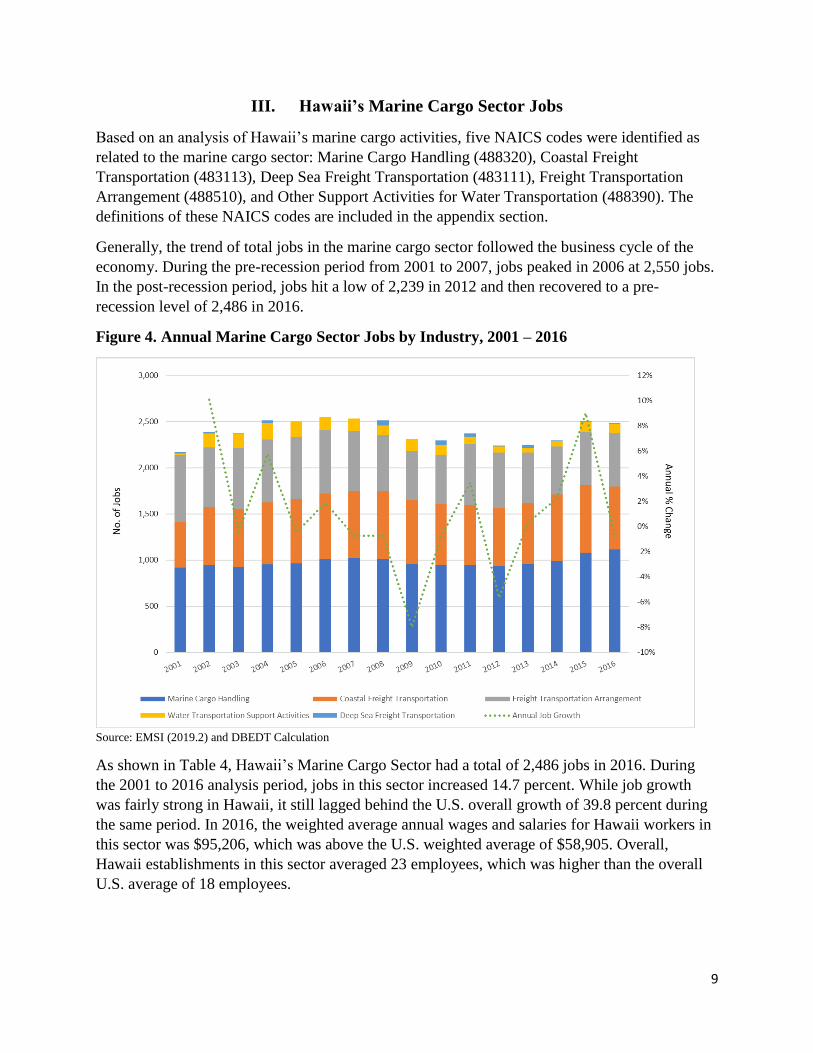
Generally, the trend of total jobs in the marine cargo sector followed the business cycle of the
economy. During the pre-recession period from 2001 to 2007, jobs peaked in 2006 at 2,550 jobs.
In the post-recession period, jobs hit a low of 2,239 in 2012 and then recovered to a pre-
recession level of 2,486 in 2016.
Figure 4. Annual Marine Cargo Sector Jobs by Industry, 2001 – 2016
Source: EMSI (2019.2) and DBEDT Calculation
As shown in Table 4, Hawaii’s Marine Cargo Sector had a total of 2,486 jobs in 2016. During
the 2001 to 2016 analysis period, jobs in this sector increased 14.7 percent. While job growth
was fairly strong in Hawaii, it still lagged behind the U.S. overall growth of 39.8 percent during
the same period. In 2016, the weighted average annual wages and salaries for Hawaii workers in
this sector was $95,206, which was above the U.S. weighted average of $58,905. Overall,
Hawaii establishments in this sector averaged 23 employees, which was higher than the overall
U.S. average of 18 employees.
10
Of all the industries within the Marine Cargo Sector, the Marine Cargo Handling industry had
the highest job count for Hawaii in 2016, with 1,114 jobs or 44.8 percent of the sector total.
Hawaii’s Marine Cargo Handling industry also had the highest annual wages and salaries at
$115,455 in 2016, which was 64.3 percent higher than the U.S. average of $70,265. During the
2001 to 2016 period, the job count in Hawaii grew 21.7 percent, which was lower than the
growth rate of 55.9 percent for the U.S. overall. The average Hawaii establishment for the
Marine Cargo Handling industry had 101 employees, which was higher than the U.S. overall
average of 79 employees.
Marine Cargo Handling was followed by the Coastal Freight Transportation industry with 682
jobs or 27.4 percent of the sector total. The annual average wages and salaries for this industry
was also strong at $108,400 in 2016, which was 19.2 percent higher than the U.S. figure of
$90,957. For the 2001 to 2016 period, the Hawaii job count in this industry grew 38.4 percent
versus 40.0 percent for the U.S. overall. This industry averaged 38 employees per establishment
for Hawaii and 29 employees per establishment for the U.S. overall.
The third largest industry was the Freight Transportation Arrangement industry, with 579 Hawaii
jobs or 23.3 percent of the total sector in 2016. Hawaii’s annual salaries and earnings for this
industry averaged $49,360, which was approximately 7.4 percent below the overall U.S. average
of $53,282. Hawaii jobs in this category declined 20.6 percent, while the U.S. overall increased
44.7 percent for the 2001 to 2016 period. One reason for Hawaii’s decrease could be an increase
in outsourcing to employment agencies, which would show up as a different industry code. The
Freight Transportation Arrangement industry averaged 9 employees per establishment for
Hawaii and 16 employees per establishment for the U.S. overall.
The fourth largest category was Support Activities for Water Transportation, with 102 Hawaii
jobs or 4.1 percent of the total sector. During the analysis period, jobs increased 554.4 percent in
Hawaii, while they declined 13.0 percent for the U.S. overall. While Hawaii’s percentage
increase was significant, the total number of jobs remains relatively small. The annual average
for Hawaii’s wages and salaries was $49,133, which was below the U.S. average of $52,443 for
2016. This industry averaged 8 employees per establishment for Hawaii and 14 employees per
establishment for the U.S. overall.
The last category was Deep Sea Freight Transportation, with an estimated 9 Hawaii jobs or 0.4
percent of the total sector. During the 2001 to 2016 period, U.S. jobs declined 20.6 percent and
Hawaii jobs remained approximately the same. For 2016, the U.S. had average annual earnings
of $104,022 and Hawaii had an estimated $45,423. This industry averaged 9 employees per
establishment for Hawaii and 23 employees per establishment for the U.S. overall. Due to a
small number of jobs for Hawaii (9 jobs), discretion should be used when comparing with the
U.S. overall for this industry.

11
Table 4. Marine Cargo Sector Jobs, Job Growth and Earnings, Hawaii and the U.S.
HI
Jobs
(2016)
Job Growth
(2001-2016)
Jobs per
Establishment
(2016)
Avg. Annual
Wages & Salary
(2016)
HI HI U.S. HI U.S HI U.S.
Marine Cargo Handling 1,114 21.7% 55.9% 101 79 $115,455 $70,265
Coastal Freight Transportation 682 38.4% 40.0% 38 29 $108,400 $90,957
Freight Transportation
Arrangement 579 -20.6% 44.7% 9 16 $49,360 $53,282
Support Activities for Water
Transportation 102 554.4% -13.0% 8 14 $49,133 $52,443
Deep Sea Freight Transportation 9 N/A -20.6% 9 23 $45,423 $104,022
TOTAL 2,486 14.7% 39.8% 23 18 $95,206* $58,905*
*weighted average
Source: EMSI (2019.2) and DBEDT Calculation

12
IV. Hawaii’s Marine Cargo Shipments by Commodity
This section examines Hawaii’s marine cargo shipments by commodity, including intrastate
(interisland) shipments. Generally, the trade pattern for inbound freight is for the freight to arrive
on Oahu (Honolulu or Barbers Point) and then either remain on Oahu or be transshipped to the
neighbor islands. For outbound freight, the goods are shipped from the neighbor islands to Oahu,
consolidated with Oahu freight, and then shipped to out-of-state destinations.
Figure 5 compares interstate and intrastate (interisland) shipments, with inbound and outbound
tonnage combined. Generally, interstate and intrastate shipments followed the same general
trend; shipments peaked before the recession, declined through 2010, entered the recovery phase,
and then leveled off with minor fluctuations between 2013 and 2016. However, the recession had
a greater impact on marine cargo tonnage for intrastate shipments between islands than it did for
interstate shipments. Intrastate shipments had a 63.2 percent drop from the peak of 13.4 million
tons in 2006 to a trough of 4.9 million tons in 2010. In contrast, interstate shipments only
declined 15.4 percent during the same period. In looking at the data, one reason appears to be a
decline in the neighbor island construction activity relative to Oahu. From 2006 to 2011, building
permits dropped substantially on neighbor islands with Maui County down 57.7 percent, Hawaii
County down 46.8 percent, and Kauai County down 66.5 percent (DBEDT Databook, 2018).
During the same period, Honolulu County had a decline of only 11.0 percent. Other industries
that appear to have reduced their intrastate shipments between islands as a result of the recession
were accommodation and food service, retail, and manufacturing.
Figure 5. Hawaii’s Intrastate versus Interstate Marine Cargo Shipments by Weight (2016)
Source: Waterborne Commerce of the United States, Department of the Army Corps of Engineers, Institute for Water Resources,
2018

13
Table 5 shows domestic ocean cargo by commodity to and from locations within the United
States (including Guam and other U.S. territories). It is important to note that a majority of the
tonnage falls into the Unknown or Not Elsewhere Classified category. Generally, Waterborne
Commerce data is classified in this category if the commodity classification is unknown and/or if
there is a need to protect proprietary company information. The categories impacted by this were
Primary Manufactured Goods; Materials, Inedible Except Fuels; Waste Material; and inbound
Food and Farm Products. However, there is more commodity shipment detail in the following
county sections.
Other than the Unknown or Not Elsewhere Classified category, the largest category for Hawaii’s
domestic inbound marine cargo was the Petroleum and Petroleum Products category, with 166.1
thousand tons of inbound cargo. This category also had 107.4 thousand tons outbound cargo.
Crude oil was included within this category, which Hawaii ships into the state, processes into
finished petroleum products (gasoline, jet fuel, and other) and then distributes these finished
petroleum products within Oahu locations and the neighbor islands. There is also a small amount
that is sent out-of-state.
The next largest category for domestic cargo was Food and Farm Products, which included
general food products, alcoholic beverages, fruit and vegetables, combined meat, dairy and fish
items, and rice and grains. This category had 192.4 thousand tons of outbound marine cargo with
the inbound being included in the Unknown or Not Elsewhere Classified category.
Following Food and Farm Products was Chemicals, with 130.8 thousand tons inbound from
other states and the outbound tons being included in the Unknown or Not Elsewhere Classified
category.
Table 5. Domestic Marine Cargo Shipments for the State of Hawaii (2016)*
Commodity Classification
Inbound Tons
(from other states)
Outbound Tons
(to other states)
Petroleum and Petroleum Products 166,115 107,444
Food and Farm Products N/A 192,443
Primary Manufactured Goods N/A N/A
Materials, Inedible Except Fuels N/A N/A
Chemicals Excluding Fertilizers 130,815 N/A
Waste Material (garbage, sewage, sludge, etc.) N/A N/A
Unknown or Not Elsewhere Classified 4,178,700 578,972
TOTAL 4,475,630 878,859 * does not include intrastate (interisland) shipments. N/A denotes not available due to being classified within the unknown or not
elsewhere classified category.
Source: Waterborne Commerce of the United States, State to State Data. Department of the Army Corps of Engineers, Institute
for Water Resources, 2018

14
Table 6 shows inbound and outbound cargo to and from international locations (imports and
exports). It is important to note that the international cargo data included more detail, because
shippers are mandated to declare the shipment commodity and weight, thus reducing the amount
of Unknown or Not Elsewhere Classified shipments. Crude Petroleum was the largest import
category, with 4.8 million tons of inbound cargo. A majority of the inbound tonnage was
comprised of crude oil, imported from Southeast Asia, Africa, and the Middle East to supply
Hawaii’s oil refineries (EIA, 2018). The next largest category was Petroleum Products with 1.1
million tons inbound and 865.3 thousand tons outbound. The following categories were Coal
(841.1 thousand tons inbound, 0 tons outbound), Primary Manufactured Goods (428.3 thousand
tons inbound, 5.2 thousand tons outbound), Materials (227.5 thousand tons inbound, 154.2
thousand tons outbound), and Manufactured Equipment, Machinery and Products (103.0
thousand tons inbound, 15.2 thousand tons outbound). Smaller categories included Food and
Farm Products (57.8 thousand tons inbound, 14.9 thousand tons outbound), Chemicals (12.5
thousand tons inbound, 31.2 thousand tons outbound), and Not Elsewhere Classified (15.8
thousand tons inbound, 5.4 thousand tons outbound). In comparing inbound versus outbound for
international shipments, Hawaii imported approximately seven times more in tonnage than it
exported in 2016.
Table 6. International Marine Cargo Shipments for the State of Hawaii (2016)
Commodity Classification Inbound Tons
(imports)
Outbound Tons
(exports)
Crude Petroleum 4,755,773 0
Petroleum Products (other than crude) 1,099,776 865,317
Coal 841,052 0
Primary Manufactured Goods 428,318 5,186
Manufactured Materials, Inedible Except Fuels 227,502 154,236
Manufactured Equipment, Machinery & Products 103,026 15,227
Food and Farm Products 57,801 14,866
Chemicals Excluding Fertilizers 12,524 31,216
Unknown or Not Elsewhere Classified
15,778 5,433
TOTAL 7,541,550 1,091,481 Source: Waterborne Commerce of the United States, State to State Data. Department of the Army Corps of Engineers, Institute
for Water Resources, 2018
15
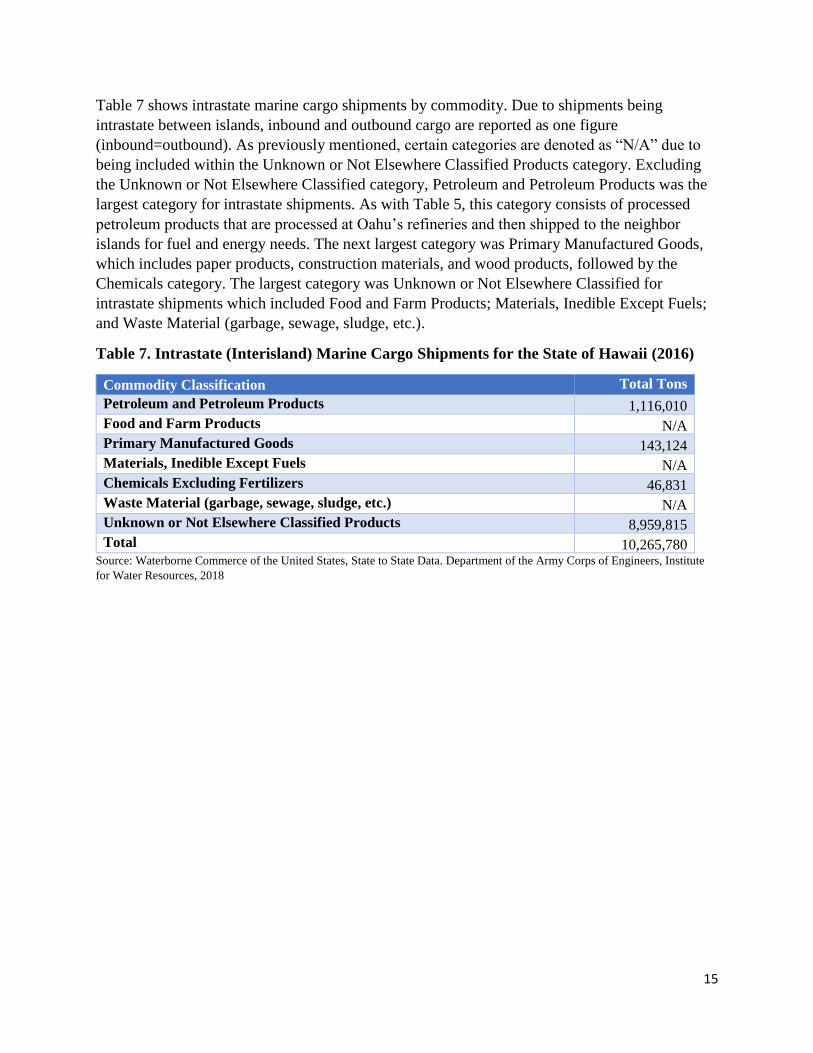
Table 7 shows intrastate marine cargo shipments by commodity. Due to shipments being
intrastate between islands, inbound and outbound cargo are reported as one figure
(inbound=outbound). As previously mentioned, certain categories are denoted as “N/A” due to
being included within the Unknown or Not Elsewhere Classified Products category. Excluding
the Unknown or Not Elsewhere Classified category, Petroleum and Petroleum Products was the
largest category for intrastate shipments. As with Table 5, this category consists of processed
petroleum products that are processed at Oahu’s refineries and then shipped to the neighbor
islands for fuel and energy needs. The next largest category was Primary Manufactured Goods,
which includes paper products, construction materials, and wood products, followed by the
Chemicals category. The largest category was Unknown or Not Elsewhere Classified for
intrastate shipments which included Food and Farm Products; Materials, Inedible Except Fuels;
and Waste Material (garbage, sewage, sludge, etc.).
Table 7. Intrastate (Interisland) Marine Cargo Shipments for the State of Hawaii (2016)
Commodity Classification Total Tons
Petroleum and Petroleum Products 1,116,010
Food and Farm Products N/A
Primary Manufactured Goods 143,124
Materials, Inedible Except Fuels N/A
Chemicals Excluding Fertilizers 46,831
Waste Material (garbage, sewage, sludge, etc.) N/A
Unknown or Not Elsewhere Classified Products 8,959,815
Total 10,265,780 Source: Waterborne Commerce of the United States, State to State Data. Department of the Army Corps of Engineers, Institute
for Water Resources, 2018

16
V. Hawaii’s Marine Cargo Shipments by County
This section explores marine cargo by county and commodity. The data is compiled from port-
level data and then aggregated by county. As noted earlier, the county totals do not sum up to the
state totals due to intrastate shipments between islands being counted multiple times. For
example, a shipment arriving at Honolulu County and then transshipped to Maui County would
be counted as inbound for Honolulu, outbound for Honolulu, and inbound for Maui. In contrast,
the state totals shown in Figures 2 and 3 only include shipments that come into the state and
leave the state, and do not include intrastate shipments between counties.
Honolulu County
The tables for Honolulu County are comprised of the ports of Honolulu and Barbers Point on the
Island of Oahu. As noted above, the figures for Honolulu marine cargo include neighbor island
trans-shipments; therefore, Honolulu totals include both the cargo that is used or consumed
within the county, as well as the freight that passes through Honolulu County to and from the
neighbor islands. With this caveat, Table 8 lists total marine cargo tonnage shipped inbound to
Honolulu County from domestic origins (7.9 million tons total) and outbound to domestic
destinations (7.5 million tons) for 2016.
Manufactured Equipment, Machinery, and Products was the largest cargo category, with 4.5
million tons inbound and 5.5 million tons outbound (including neighbor islands). This category
includes both durable and nondurable goods for consumers and businesses.
The second largest domestic category for inbound was Crude Petroleum (1.5 million tons
inbound, 0 tons outbound), which arrived at Barbers Point and was then refined into finished
petroleum products including gasoline, jet fuel, kerosene and other petroleum products. The
finished petroleum products from Oahu refineries were distributed within Oahu and to neighbor
islands and out-of-state-locations; this is listed under outbound for Petroleum Products (other
than crude), with 118.6 thousand tons inbound and 1.2 million tons outbound.
The third largest category for inbound was Food and Farm Products, with 1.2 million tons
inbound and 468.2 thousand tons outbound, including intrastate shipments between islands. Of
the 1.2 million tons of food and farm products shipped into Honolulu County in 2016, an
estimated 953.8 thousand tons or 78 percent was brought in from out-of-state (subtracting out
neighbor island outbound shipments).
The remaining categories included Primary Manufactured Goods (200.8 thousand tons inbound,
171.9 thousand tons outbound), Chemicals and Related Products (176.0 thousand tons inbound,
67.9 thousand tons outbound), Materials (175.7 thousand tons inbound, 73.3 thousand tons
outbound), and Waste Materials (26 tons inbound, 611 tons outbound).

17
Table 8. Honolulu County’s Domestic Marine Cargo Shipments (2016)*
Commodity Classification Inbound Tons (from HI ports or
other states)
Outbound Tons (to HI ports or
other states)
Manufactured Equipment, Machinery, and Products 4,546,836 5,501,387
Crude Petroleum 1,455,564 0
Food and Farm Products 1,220,655 468,154
Petroleum Products (other than crude) 118,582 1,189,325
Primary Manufactured Goods 200,768 171,887
Chemicals and Related Products 176,038 67,878
Materials, Inedible Except Fuels 175,696 73,322
Unknown or Not Elsewhere Classified 9,137 826
Waste Material (garbage, sewage, sludge, etc.) 26 611
Total 7,903,302 7,473,390 * includes intrastate (interisland) shipments
Source: Waterborne Commerce of the United States, Department of the Army Corps of Engineers, Institute for Water Resources,
2018
As shown in Table 9, Honolulu County’s total international maritime cargo shipments were 7.5
million tons for inbound and 1.1 million tons for outbound in 2016. The largest category for
imports from abroad was Crude Petroleum at 4.8 million tons. As noted earlier, crude oil is
imported from Southeast Asia, Africa, and the Middle East to supply Oahu’s oil refineries.
The next largest category was Petroleum Products with 1.0 million tons for inbound from foreign
origins and 865.3 thousand tons for outbound to foreign destinations. While Hawaii refines crude
oil into petroleum products, the data shows that the state also imports petroleum products from
abroad. Conversely, some of the refined petroleum products produced on Oahu are exported to
foreign countries. Another imported energy related product was coal, with 841.1 thousand tons
imported into Honolulu County in 2016.
The remaining categories for Honolulu County’s international shipments included Primary
Manufactured Goods (428.3 thousand tons inbound, 5.2 thousand tons outbound), Materials
(213.7 thousand tons inbound, 153.3 thousand tons outbound), Manufactured Equipment,
Machinery, and Products (103.0 thousand tons inbound, 15.2 thousand tons outbound), Food and
Farm Products (57.8 thousand tons inbound, 14.9 thousand tons outbound), and Chemicals and
Related Products (12.5 thousand tons inbound, 31.2 thousand tons outbound).

18
Table 9. Honolulu County’s International Marine Cargo Shipments (2016)
Commodity Classification Inbound Tons
(imports)
Outbound Tons
(exports)
Crude Petroleum 4,755,773 0
Petroleum Products (other than crude) 1,035,753 865,317
Coal 841,052 0
Primary Manufactured Goods 428,318 5,186
Materials, Inedible Except Fuels 213,668 153,263
Manufactured Equipment, Machinery, and Products 103,026 15,227
Food and Farm Products 57,801 14,866
Unknown or Not Elsewhere Classified 15,778 5,433
Chemicals and Related Products 12,524 31,216
Waste Material (garbage, sewage, sludge, etc.) 0 0
Total 7,463,693 1,090,508 Source: Waterborne Commerce of the United States, Department of the Army Corps of Engineers, Institute for Water Resources,
2018
The following tables cover marine cargo shipments for each respective neighbor island. Due to a
low volume of international shipments, international and domestic shipments were combined
into one table for the neighbor island counties.

19
Hawaii County
Hawaii County’s maritime cargo sector relies on ports in Hilo and Kawaihae. In 2016, Hawaii
County’s total maritime cargo shipments were 2.8 million tons for inbound and 1.4 million tons
for outbound (Table 10). The largest domestic cargo category was Manufactured Equipment,
Machinery, and Products (2.1 million tons inbound, 1.3 million tons outbound). This was
followed by refined Petroleum Products (420.9 thousand tons inbound, 473 tons outbound),
reflecting the demand for energy and fuel products sourced from Oahu. The Food and Farm
Products category ranked third (94.4 thousand tons inbound, 60.6 thousand tons outbound).
The remaining categories for Hawaii County’s domestic shipments included Primary
Manufactured Goods (72.0 thousand tons inbound, 6.1 thousand tons outbound), Chemicals
(31.4 thousand tons inbound, 1.1 thousand tons outbound), and Materials (24.5 thousand tons
inbound, 23.5 thousand tons outbound).
For international shipments in 2016, Hawaii County imported 31.0 thousand tons of
Hydrocarbon & Petrol Gases by ocean and 13.8 thousand tons of Materials (including wood,
sand, gravel, and iron ore). For outbound, Hawaii County exported 973 tons of Materials by
ocean in 2016. It is important to note that a majority of Hawaii County’s international shipments
(inbound and outbound) were routed through ports within Honolulu County, and these would
show up in the data as “domestic” shipments for Hawaii County, rather than “international”
shipments.
Table 10. Hawaii County’s Marine Cargo Shipments, Domestic and International (2016)*
Commodity Classification Inbound Tons (from HI ports or
other states)
Outbound Tons (to HI ports or
other states)
Domestic
Manufactured Equipment, Machinery, and Products 2,108,682 1,278,445
Petroleum Products (other than crude) 420,898 473
Food and Farm Products 94,405 60,580
Primary Manufactured Goods 72,024 6,054
Chemicals and Related Products 31,389 1,132
Materials, Inedible Except Fuels 24,526 23,496
Waste Material (garbage, sewage, sludge, etc.) 0 15
Unknown or Not Elsewhere Classified 0 0
International
Petroleum (Hydrocarbon & Petrol Gases) 30,971 0
Materials, Inedible Except Fuels 13,834 973
Domestic and International Combined
Total 2,796,729 1,371,168 *includes intrastate (interisland) shipments
Source: Waterborne Commerce of the United States, Department of the Army Corps of Engineers, Institute for Water Resources,
2018

20
Maui County
A majority of Maui County’s ocean cargo is routed through the port at Kahului. Molokai is also
included in Maui County’s data, with the main port there being Kaunakakai. In 2016, Maui
County’s total maritime cargo shipments were 2.4 million tons for inbound and 1.5 million tons
for outbound (Table 11). The largest domestic cargo category was Manufactured Equipment,
Machinery, and Products (1.8 million tons inbound, 1.2 million tons outbound). This was
followed by refined Petroleum Products (396.0 thousand tons inbound, 716 tons outbound); a
majority of which originated from Oahu’s refineries. The next largest category was Food and
Farm Products which ranked third (112.8 thousand tons inbound, 199.9 thousand tons outbound).
Of all the neighbor island counties, Maui County had the largest amount of outgoing Food and
Farm Products. However, with the closing of Maui’s sugar mill in 2016, the Food and Farm
Products category is expected to drop off in the future.
The remaining categories for Maui County’s domestic shipments were Primary Manufactured
Goods (63.4 thousand tons inbound, 5.1 thousand tons outbound), Materials (20.1 thousand tons
inbound, 14.4 thousand tons outbound), and Chemicals (15.3 thousand tons inbound, 485 tons
outbound).
For international shipments in 2016, Maui County imported 20.9 thousand tons of Hydrocarbon
for energy needs with no direct outbound shipments to international locations. However, a
majority of Maui County exports are routed through Honolulu ports and, therefore, are included
in the “domestic” data.
Table 11. Maui County’s Marine Cargo Shipments, Domestic and International (2016)*
Commodity Classification Inbound Tons (from HI ports or
other states)
Outbound Tons (to HI ports or
other states)
Domestic
Manufactured Equipment, Machinery, and Products 1,775,299 1,241,155
Petroleum Products (other than crude) 395,994 716
Food and Farm Products 112,819 199,948
Primary Manufactured Goods 63,368 5,128
Materials, Inedible Except Fuels 20,086 14,430
Chemicals and Related Products 15,320 485
Waste Material (garbage, sewage, sludge, etc.) 0 0
Unknown or Not Elsewhere Classified 0 0
International
Petroleum (Hydrocarbon & Petrol Gases) 20,935 0
Domestic and International Combined
Total 2,403,821 1,461,862 * includes intrastate (interisland) shipments
Source: Waterborne Commerce of the United States, Department of the Army Corps of Engineers, Institute for Water Resources,
2018

21
Kauai County
The majority of Kauai’s marine cargo moves through Nawiliwili Harbor, with the exception of
some gasoline and kerosene which uses Port Allen. In 2016, Kauai County’s total maritime cargo
shipments were 1.4 million tons for inbound and 679.3 thousand tons for outbound (Table 12).
The largest domestic cargo category was Manufactured Equipment, Machinery, and Products
(1.1 million tons inbound, 662.9 thousand tons outbound). This was followed by refined
Petroleum Products (190.6 thousand tons inbound, 131 tons outbound) for energy and fuel needs.
The next largest category was Food and Farm Products which ranked third (34.7 thousand tons
inbound, 6.3 thousand tons outbound).
The remaining categories for Kauai County’s domestic marine cargo included Primary
Manufactured Goods (24.5 thousand tons inbound, 3.8 thousand tons outbound), Chemicals (9.9
thousand tons inbound, 511 tons outbound), and Materials (9.1 thousand tons inbound, 5.7
thousand tons outbound).
For international marine cargo, Kauai County imported 12.1 thousand tons of hydrocarbon and
petrol gases directly in 2016 through the port at Nawiliwili. As with the other counties, a large
portion of the international shipments (outbound and inbound) were routed through Honolulu
and, therefore, are listed in the data as “domestic”.
Table 12. Kauai County’s Marine Cargo Shipments, Domestic and International (2016)*
Commodity Classification Inbound Tons (from HI ports or
other states)
Outbound Tons (to HI ports or
other states)
Domestic
Manufactured Equipment, Machinery, and Products 1,096,116 662,915
Petroleum Products (other than crude) 190,625 131
Food and Farm Products 34,722 6,283
Primary Manufactured Goods 24,490 3,829
Chemicals and Related Products 9,896 511
Materials, Inedible Except Fuels 9,107 5,676
Waste Material (garbage, sewage, sludge, etc.) 0 0
Unknown or Not Elsewhere Classified 0 0
International
Petroleum (Hydrocarbon & Petrol Gases) 12,117 0
Domestic and International Combined
Total 1,377,073 679,345 * includes intrastate (interisland) shipments
Source: Waterborne Commerce of the United States, Department of the Army Corps of Engineers, Institute for Water Resources,
2018
22
References
Buderi, C.L. 1986. Conflict and Compromise: The Shipping Act of 1984. Berkeley Journal of
International Law. Vol. 3, Issue 2.
Crabtree, T., T. Hoang, R. Tom, G. Gildemann. 2018. World Air Cargo Forecast. Boeing
Corporation, October.
Department of Business, Economic Development, & Tourism (DBEDT). 2017. Air Cargo in
Hawaii’s Economy: Developments in Hawaii’s Air Cargo Industry 1990-2016. State of
Hawaii. November.
Department of Business, Economic Development, & Tourism (DBEDT). 2018. Hawaii’s
Petroleum Consumption and Expenditures by Product and by Sector16. State of Hawaii.
December.
Energy Information Administration (EIA). 2018. Hawaii State Profile and Energy Estimates.
November.
Federal Maritime Commission. 2001. The Impact of the Ocean Shipping Reform Act of 1998.
FMC. September.
Federal Trade Commission. 1989. An Analysis of the Maritime Industry and the Effects of the
1984 Shipping Act. FTC. November.
Gomes, Andrew. 2018. ‘Inouye’ Arrives in Honolulu as Newest, Biggest, Fastest Matson Ship.
Honolulu Star Advertiser. November.
Hawaii Agribusiness Development Corporation (HADC). 2008. The Demand for Interisland
Shipping and The Impact of Shipping Costs on Hawaii Agriculture Production. John M.
Knox & Associates, Inc. and Markrich Research in Conjunction with HTDC
Manufacturing Extension Partnership Program. March.
Hawaii Department of Agriculture (HDA), Hawaii Department of Land and Natural Resources
(HDLNR), H. T. Harvey & Associates, Kuiwalu, LLC, and Richard Hill & Associates.
2016. Hawaii Interagency Biosecurity Plan 2017-2027. December.
IHS Markit. 2016. Five Trends Shaping the Global Maritime Industry. Maritime.
Saxon, S. M. Stone. 2017. Container shipping: the next 50 years. McKinsey and Company.
Travel Transport and Logistics. October.
United Nations Conference on Trade and Development. 2018. Review of Maritime Transport
2017. United Nations Publication, UNCTAT/RMT/2017.
US Army Corps of Engineers. 2018. Waterborne Commerce Statistics Center.
https://usace.contentdm.oclc.org/digital/collection/p16021coll2/id/2971

23
Appendix A. Definition of NAICS Codes
This report used the following NAICS codes related to ocean freight transportation and related
services:
4830 Water Transportation
Industries in the Water Transportation subsector provide water transportation of passengers and
cargo using watercraft, such as ships, barges, and boats. At the detailed level, two NAICS codes
were used related to water transportation:
483111 Deep Sea Freight Transportation
This U.S. industry comprises establishments primarily engaged in providing deep sea
transportation of cargo to or from foreign ports.
483113 Coastal and Great Lakes Freight Transportation
This U.S. industry comprises establishments primarily engaged in providing water
transportation of cargo in coastal waters, on the Great Lakes System, or deep seas between
ports of the United States, Puerto Rico, and United States island possessions or protectorates.
Marine transportation establishments using the facilities of the St. Lawrence Seaway
Authority Commission are considered to be using the Great Lakes Water Transportation
System. Establishments primarily engaged in providing coastal and/or Great Lakes barge
transportation services are included in this industry.
4883 Support Activities for Water Transportation
This industry group comprises establishments primarily engaged in one of the following: (1)
operating ports, harbors (including docking and pier facilities), or canals; (2) providing
stevedoring and other marine cargo handling services (except warehousing); (3) providing
navigational services to shipping; or (4) providing other services to water transportation. At the
detailed level, two NAICS codes were used related to support activities for water transportation:
488320 Marine Cargo Handling
This industry comprises establishments primarily engaged in providing stevedoring and other
marine cargo handling services (except warehousing).
488390 Other Support Activities for Water Transportation
This industry comprises establishments primarily engaged in providing services to water
transportation (except port and harbor operations; marine cargo handling services; and
navigational services to shipping).
488510 Freight Transportation Arrangement
This industry comprises establishments primarily engaged in arranging transportation of freight
between shippers and carriers. These establishments are usually known as freight forwarders,
marine shipping agents, or customs brokers and offer a combination of services spanning
transportation modes.


