
commadv.com
Memphis, TNIndustrial Q4 2017
MARKETBEAT
Economic Indicators
Market Indicators (Direct, All Classes)
Overall Net Absorption/Overall Asking Rent4-QTR TRAILING AVERAGE
Overall Vacancy
Q4 16 Q4 17 12-Month Forecast
Memphis Employment 631k 634k
Memphis Unemployment 5.3% 3.9%
U.S. Unemployment 4.7% 4.1%
Q4 16 Q4 17 12-Month Forecast
Vacancy 7.8% 6.6%
Net Absorption (sf) 2.6m 665,896
Under Construction (sf) 2.6m 6.9m
Average Asking Rent* $2.54 $2.73
*Rental rates reflect net asking $psf/year
EconomyThe Federal Reserve Bank of St. Louis reported the Memphis MSA economic conditions improved at a modest pace as the year ended. The labor market remains tight and hiring has slowed. Unemployment in the MSA is now at 4.1%, only a slight increase from the previous quarter. Manufacturing activity across the region has increased as companies reported new capital expenditure and facility expansions, specifically for firms that manufacture food and beverage products, chemical products, and transportation equipment. Conditions for the manufacturing market in 2018 are expected to be similar to 2017.
Market OverviewThe Memphis MSA Industrial market closed fourth quarter 2017 with 665,896 square feet (sf) of net absorption. Cumulative net absorption for 2017 totaled 4.8 million sf, which is about 2 million sf less than 2016; however, Class A leasing activity for 2017 surpassed 2016 with 6.4 million sf and 5.8 million sf of new Class A leasing activity, respectively.
Year-over-year total market direct vacancy fell 1.2 percentage points to 6.6% at year-end, the lowest rate on record. Total direct average asking rental rates increased to $2.73 per square foot (psf) in fourth quarter 2017. Average direct rates for Southeast submarket properties increased from $2.85 psf to $2.94 psf year-over-year, and rates in the Desoto submarket increased from $3.29 psf to $3.52 psf year-over-year.
Speculative construction, in addition to a recent flurry of build-to-suit activity, continues to drive the industrial market. While new development continued in Desoto and Fayette Counties, construction was announced in Shelby County – a welcome addition to an area that has seen no new construction since 2007. During fourth quarter, Certifit Inc. announced plans for a 604,800 sf build-to-suit distribution facility in the Northeast submarket. In the Southeast submarket, Amazon announced a 615,000 sf build-to-suit distribution center and DHL announced a 500,000 sf build-to-suit distribution center. These announcements provided much-needed viability to the Tennessee side of the market, specifically within the Southeast submarket.
MEMPHIS INDUSTRIAL
$1.00
$2.00
$3.00
$4.00
0
500,000
1,000,000
1,500,000
2,000,000
2,500,000
2011 2012 2013 2014 2015 2016 2017
Net Absorption, SF Asking Rent, $ PSF
6%
10%
14%
18%
2011 2012 2013 2014 2015 2016 2017
Historic Average = 12.3%

commadv.com I 2
MARKETBEAT
Memphis, TNIndustrial Q4 2017
OutlookThrough mid-year 2018, more than 5 million sf of speculative space will deliver across the market. Increased development and leasing activity also is forecasted in the Marshall County submarket with the construction of I-269 nearing completion in 2018.
Another predicted trend in 2018 is the amount of remnant spaces anticipated to become available in the speculative Bulk buildings above 800,000 sf. Class A availabilities in the 250,000 – 350,000 sf range are plentiful, with more options to come available as new speculative construction is divided to accommodate tenants seeking space in the 400,000-600,000 sf range.
While the Memphis industrial market continues to deliver robust speculative construction, going forward, some industrial tenants will continue to have specialized requirements driving build-to-suit activity. Multi-site consolidations are also predicted to occur with the Memphis MSA.
Busy Quarter for Investment ActivityThe market posted record-high pricing for sales transactions in 2017, topping more than $51 million. These transactions brought several new ownership groups to the Memphis MSA. The Memphis MSA continues to be an active investment sales market, driven in 2017 by large multimarket portfolio sales. One example in the fourth quarter of 2017 was the sale of the DCT portfolio, which consisted of four properties within Memphis, Charlotte and Orlando. Two of the four properties were in Memphis and totaled 1,385,000 sf of the 2,049,877 sf portfolio sale.
Groups were attracted to the region because of opportunistic cap rates and high building availability. Investors cannot as easily permeate the saturated top markets, and thus have turned to secondary and tertiary markets like Memphis. The cap rates are so low in other markets that secondary and tertiary markets are opportunities for a larger return. These new ownership groups bring national and international perspectives to the market, the effects of which it is too soon to forecast.
-500,000
0
500,000
1,000,000
1,500,000
2,000,000
2,500,000
3,000,000
Northeast Southeast Northwest DesotoCounty
MarshallCounty
FayetteCounty
Q4 2017 Absorption 2017 Y-T-D Absorption
$4.00
$4.50
$5.00
$5.50
$6.00
$6.50
$7.00
$1.50
$1.75
$2.00
$2.25
$2.50
$2.75
$3.00
2011 2012 2013 2014 2015 2016 2017
Flex
War
ehou
se
Warehouse Flex, $ PSF
Warehouse/Flex Asking RentsASKING RENT INCREASE FOR FLEX/R&D
Absorption Activity Q4 2017 vs. 2017 Y-T-D
SF
Exeter continued its investment in the Memphis MSA with a 1.7 million sf acquisition totaling $48.3 million. Exeter now owns more than 16 million sf in the Memphis market and is planning a two-building speculative project, totaling another 1.6 million sf.
Leasing of numerous speculative buildings will continue to bolster strong investment sales in 2018. Current owners who are looking to expand their holdings will compete with new cash-laden buyers who will seek higher returns than can be found in coastal and tier I markets.
commadv.com I 3
MARKETBEAT
Memphis, TNIndustrial Q4 2017
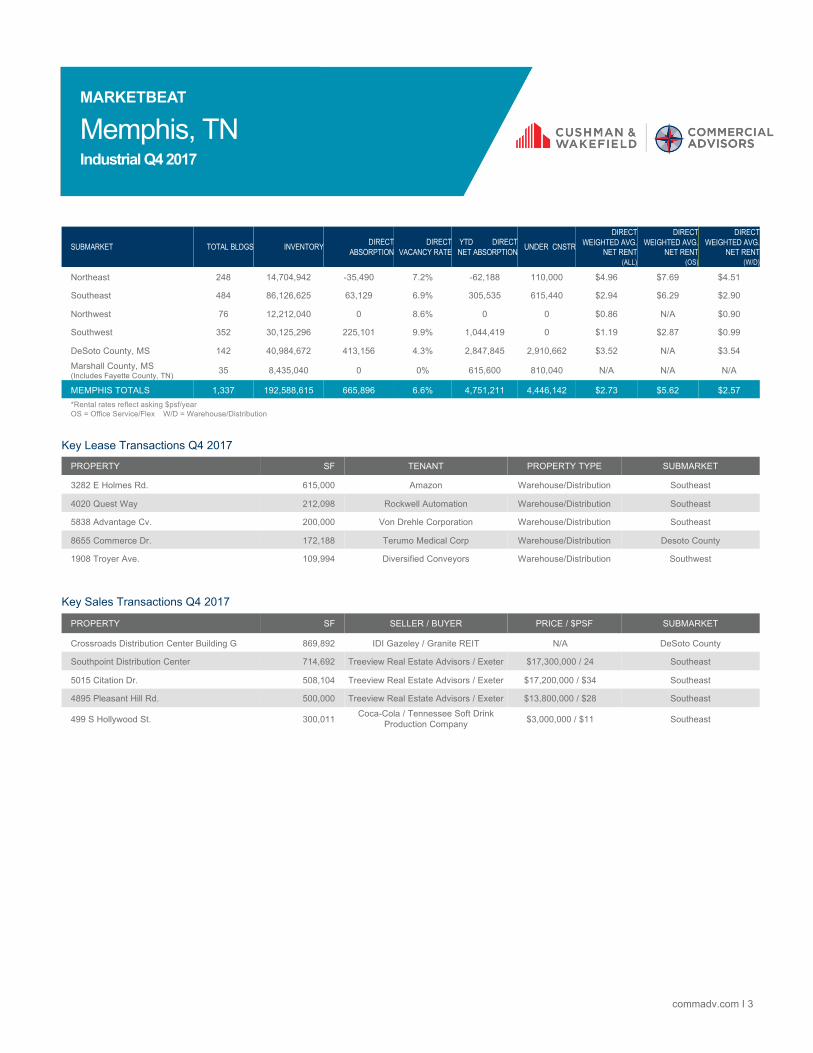
Key Lease Transactions Q4 2017
PROPERTY SF TENANT PROPERTY TYPE SUBMARKET
3282 E Holmes Rd. 615,000 Amazon Warehouse/Distribution Southeast
4020 Quest Way 212,098 Rockwell Automation Warehouse/Distribution Southeast
5838 Advantage Cv. 200,000 Von Drehle Corporation Warehouse/Distribution Southeast
8655 Commerce Dr. 172,188 Terumo Medical Corp Warehouse/Distribution Desoto County
1908 Troyer Ave. 109,994 Diversified Conveyors Warehouse/Distribution Southwest
Key Sales Transactions Q4 2017
PROPERTY SF SELLER / BUYER PRICE / $PSF SUBMARKET
Crossroads Distribution Center Building G 869,892 IDI Gazeley / Granite REIT N/A DeSoto County
Southpoint Distribution Center 714,692 Treeview Real Estate Advisors / Exeter $17,300,000 / 24 Southeast
5015 Citation Dr. 508,104 Treeview Real Estate Advisors / Exeter $17,200,000 / $34 Southeast
4895 Pleasant Hill Rd. 500,000 Treeview Real Estate Advisors / Exeter $13,800,000 / $28 Southeast
499 S Hollywood St. 300,011Coca-Cola / Tennessee Soft Drink
Production Company $3,000,000 / $11 Southeast
SUBMARKET TOTAL BLDGS INVENTORY DIRECT ABSORPTION
DIRECTVACANCY RATE
YTD DIRECT NET ABSORPTION UNDER CNSTR
DIRECT WEIGHTED AVG.
NET RENT(ALL)
DIRECT WEIGHTED AVG.
NET RENT(OS)
DIRECT WEIGHTED AVG.
NET RENT(W/D)
Northeast 248 14,704,942 -35,490 7.2% -62,188 110,000 $4.96 $7.69 $4.51
Southeast 484 86,126,625 63,129 6.9% 305,535 615,440 $2.94 $6.29 $2.90
Northwest 76 12,212,040 0 8.6% 0 0 $0.86 N/A $0.90
Southwest 352 30,125,296 225,101 9.9% 1,044,419 0 $1.19 $2.87 $0.99
DeSoto County, MS 142 40,984,672 413,156 4.3% 2,847,845 2,910,662 $3.52 N/A $3.54
Marshall County, MS(Includes Fayette County, TN)
35 8,435,040 0 0% 615,600 810,040 N/A N/A N/A
MEMPHIS TOTALS 1,337 192,588,615 665,896 6.6% 4,751,211 4,446,142 $2.73 $5.62 $2.57
*Rental rates reflect asking $psf/year OS = Office Service/Flex W/D = Warehouse/Distribution

MARKETBEAT
commadv.com I 4
About Cushman & WakefieldCushman & Wakefield is a leading global real estate services firm that helps clients transform the way people work, shop, and live. Our 43,000employees in more than 60 countries help investors and occupiers optimize the value of their real estate by combining our globalperspective and deep local knowledge with an impressive platform of real estate solutions. Cushman & Wakefield is among the largest commercialreal estate services firms with revenue of $5 billion across core services of agency leasing, asset services, capital markets, facility services (C&WServices), global occupier services, investment & asset management (DTZ Investors), project & development services, tenant representation, andvaluation & advisory. To learn more, visit www.cushmanwakefield.com or follow @CushWake on Twitter. Alliance firms are independently ownedand operated. Copyright © 2017 Cushman & Wakefield. All rights reserved. The information contained within this report is gathered from multiplesources considered to be reliable. The information may contain errors or omissions and is presented without any warranty or representations as toits accuracy.
Memphis, TNIndustrial Q4 2017
INDUSTRIAL SUBMARKETSMEMPHIS, TN
Cushman & WakefieldCommercial Advisors5101 Wheelis Dr, Ste 300Memphis, TN 38117
For more information, contact:Laura FentonDirector of Marketing & ResearchTel: +1 901 252 [email protected]
NORTHWEST NORTHEAST
SOUTHEAST
MARSHALL
DESOTO
SOUTHWEST

![2014 Q1 Marketbeat [RUS]/[ENG]](https://cdn.vdocument.in/doc/165x107/54bcd04f4a795971678b4569/2014-q1-marketbeat-ruseng.jpg)


![Q2 2012 MARKETBEAT REPORT | ОТЧЕТ II КВАРТАЛ [eng/rus]](https://cdn.vdocument.in/doc/165x107/54702995b4af9fae0a8b4645/q2-2012-marketbeat-report-ii-engrus.jpg)