Marketing, Cooperatives and Price Heterogeneity:
Evidence from the CIS Dairy Sector
Johannes Sauer
University of Manchester, Manchester, Oxford Road, M13 9PL, UK
Matthew Gorton
University of Newcastle, UK
John White
University of Plymouth, UK
2011
Copyright 2011 by the authors. All rights reserved. Readers may make verbatim copies
of this document for non-commercial purposes by any means, provided that this
copyright notice appears on all such copies.
Vortrag anlässlich der 51. Jahrestagung der GEWISOLA
"Unternehmerische Landwirtschaft zwischen Marktanforderungen
und gesellschaftlichen Erwartungen"
Halle/Saale, 28.09. – 30.09.2011

Marketing, Kooperative und Preisheterogenität:
Der Milchsektor in den CIS Staaten
Abstrakt
Basierend auf Umfragedaten identifiziert diese Studie Faktoren für eine Variation im Rohmilchpreis für
verschiedene CIS Staaten (Armenien, Moldawien und die Ukraine). Es wird ein multi-level
Modellierungsansatz verwandt in der Form eines mixed-effects Regressionsmodells unter Berücksichtigung
eines möglichen Sampleselektionsfehlers (sample selection bias). The Analyse zeigt die folgenden Strategien
für eine mögliche Realisierung eines höheren Rohmilchpreises auf: Konsolidierung, Kooperation und stabile
Supply Chain Beziehungen. Während der Verkauf über Marketingkooperative einen signifikanten und positiven
Effekt auf den Rohmilchpreis aufweist, ist die Mehrheit der Nichtmitglieder nicht zu einem Beitritt bereit. Die
Betriebsgrösse, Vertrauen sowie vertragliche Bindungen zeigen ebenso einen positiven Einfluss auf den vom
Milchbauern erzielten Absatzpreis. Entsprechende Politikimplikationen werden formuliert.
Schlüsselworte: Preisheterogenität, Milch, Kooperative, Armenien, Moldawien, Ukraine
Marketing, Cooperatives and Price Heterogeneity:
Evidence from the CIS Dairy Sector
Abstract
Drawing on survey data, this paper identifies the determinants of variations in farm gate milk prices for three
CIS countries (Armenia, Moldova and Ukraine). We apply a multi-level modeling approach, specifically a
bootstrapped and selectivity bias corrected mixed-effects linear regression model. The analysis suggests three
main strategies for farmers to improve the price received for their output: consolidation, cooperation and stable
supply chain relationships. While selling through a marketing cooperative has a significant and positive effect
on farm gate milk prices, the majority of non-members are reluctant to join. The size of dairy operations, trust
and contracting also impact positively on the prices received by farmers. Policy implications are drawn.
Keywords: Price Heterogeneity, Milk, Cooperatives, Armenia, Moldova, Ukraine
JEL - O13, P32, Q13
1. Introduction
Farmers’ welfare will depend mostly on the price received for their output in environments of
minimal agricultural policy support, the absence of social safety nets, and a weak non-farm rural
economy which limits agricultural diversification. These features characterize much of the
Commonwealth of Independent States (CIS)1, where rural poverty is widespread. The price
received by farmers for their output is thus of considerable concern. Yet evidence to date for the
CIS indicates that since the break-up of the USSR farm gate prices have often been significantly
below international prices (Striewe, 1999; von Cramon-Taubadel et al. 2001; World Bank,
2005; von Cramon-Taubadel et al. 2007; Liefert and Liefert, 2007) and vary considerably
between producers (Keyser, 2004). The latter has been attributed to uneven competition
(Kazmer and Konrad, 2004) caused by weak physical and commercial infrastructure. Poor
physical and commercial / institutional infrastructure raise transport and transaction costs
1 The CIS comprises countries that were formerly Soviet Republics, excluding Estonia, Georgia, Latvia and Lithuania. Ukraine is regarded as
only a de facto CIS state, as despite being one of the founding states it did not ratify the CIS charter.
(Striewe, 1999; Gow and Swinnen, 2001) and increase the likelihood of incomplete price
information (Swinnen, 2005; Liefert and Liefert, 2007). Where physical and commercial
infrastructure is weak, farmers are less likely to be aware of the prices received by others, and
processors / other purchasers may act as local monoponsies (Cochrane, 2007). Erratic / rent
seeking government intervention may reinforce these problems (von Cramon-Taubadel et al.
2007). While case studies (Striewe, 1999; Cocks et al. 2005; Gorton et al. 2006) and aggregate
market analysis (von Cramon-Taubadel et al. 2007; Liefert and Liefert, 2007) identify these
difficulties in the CIS, there is an absence of cross-sectional data analysis on the prices received
by farmers in CIS markets.
This paper analyses data for three CIS countries (Armenia, Moldova and Ukraine), seeking to
identify the determinants of variations in farm gate milk prices. Several studies identify severe
problems affecting milk marketing in the CIS (Cocks et al. 2005; Engels and Sardaryan, 2006;
Gorton et al. 2006). Some of the problems faced are common to other branches of agriculture –
a fragmented and typically poorly capitalized production base, with weak rural infrastructure
and high levels of opportunistic behavior. However the perishable nature of milk coupled with
its production pattern (milking twice a day) and the counter cyclical nature of supply and
demand between summer and winter aggravate marketing difficulties (Engels and Sardayan,
2006). In the immediate post-Soviet period many dairy supply chains collapsed and rebuilding
the sector has proved more difficult than some initially envisaged (Cochrane, 2007). Low farm
gate prices, substantially below international / border prices, limit the viability of private
investment and encourage a deeper consideration of price determination. In doing so the paper
contributes to a wider literature on price heterogeneity in developing and transitional economies.
We specifically investigate whether marketing cooperatives raise farm gate prices for their
members. The latter is of substantial policy interest given a desire to assist small-scale farmers
to improve value added (Reardon et al. 2009) and the dependence of rural areas in the CIS on
agriculture (World Bank, 2005).
A wide array of farms, ranging from rural households with 1 or 2 cows up to large corporate
enterprises with herds of 10,000 milking cows, characterizes the CIS dairy sector. Small-scale
dairy farming is prevalent in much of the rural CIS. For example, Dumitrashko (2003) estimated
that more than 40 per cent of rural Moldovan households kept at least one cow and the majority
of one cow units sold at least some of their output. Such small-scale production is often
discounted, but in an environment of low incomes and weak social safety nets, it may have a
significant effect on rural welfare. To illustrate, Keyser (2004) calculated that a two cow herd in
2003, produced an average profit of €90 per annum in Moldova. While this may appear modest,
compared against an average monthly salary in agriculture and pension of €32 and €15
respectively for the same year (Biroul Naţional de Statistică al Republicii Moldova, 2007) it is
apparent that dairy farming can represent an important source of rural income. In this context,
fairly small changes in agricultural output prices, even for those marketing small quantities, may
impact significantly on welfare. Hence the factors that determine price heterogeneity are worthy
of study.2
2 No government in any the countries studied, during the period of data analysis (2005-6), imposed a minimum or set price for milk.
The paper consists of six sections. The next section reviews the literature on price heterogeneity.
This is followed by a presentation of the econometric analysis and dataset. Results relate to the
determinants of the marketing channel utilized and the price received by farmers for their milk.
Drawing on the analysis, the conclusion details three strategies for dairy farmers to improve the
prices received for their output: consolidation, cooperation and stable supply chain relationships.
2. Price Heterogeneity
In keeping with Varian’s (2000, p.187) oft quoted remark that the law of one price is ‘no law at
all’, several empirical studies uncover significant price dispersion even after controlling for
product heterogeneity (Lewis, 2008; Sorensen, 2000). In other words, firms in the same market
sell ‘identical goods for different prices (at the same time)’ (Lewis, 2008, p.654). To explain
price dispersion, economists tend to assume that some form of heterogeneity holds (Besancenot
and Vranceanu, 2004). These assumptions can be grouped into three categories, relating to
imperfect information, transaction costs and spatially uneven competition.
Imperfect information
Search models posit that price dispersion can arise as a stable equilibrium outcome where
consumers possess imperfect information and the search costs of price shopping are positive.
Consumers vary in terms of the information they possess and search costs. A firm may be able
to charge a higher price for the same good as a competitor, if there is some probability that a
randomly arriving consumer is unaware of the competitor’s lower price and chooses to purchase
rather than incur the cost of seeking additional price quotations (Sorensen, 2000). Similarly a
producer may sell at a lower price if s/he is unaware of other actors willing to pay more. A mass
of small-scale, often isolated, producers characterize most markets in developing and
transitional economies, particularly in rural areas (IFAD, 2001). As small-scale rural market
systems lack publically announced prices or detailed market information systems, imperfect
information on prices is likely to be severe (Brooks, 2010).
Transaction Costs
Transaction costs refer to the ‘pecuniary and non-pecuniary costs associated with arranging and
carrying out an exchange of goods or services’ (Holloway et al. 2000, p. 281). The main forms
are search, bargaining, monitoring, enforcement, maladaptation and transport costs (Williamson,
1985). The poor state of rural infrastructure in the CIS raises transaction costs considerably,
particularly for a perishable product such as milk. This problem is compounded by the sparsely
populated and remote nature, and low local purchasing power, of most rural areas in the region.
Unofficial fees and shipping hazards (damaged or stolen goods during transit) are also relatively
high in the CIS (Porto, 2005). Goetz (1992) demonstrates that transaction costs lower the prices
received by farmers as sellers of agricultural output and raise their input prices. In general for a
buyer the transaction costs of sourcing a given quality of raw materials from a small number of
larger suppliers will be less than procuring from a mass of small-scale producers. Transaction
costs therefore tend to favor larger farms (Swinnen, 2005) and a buyer may pass on some of the
saved costs to larger producers, in the form of a higher relative price, in an attempt to secure
their output, particularly in a market characterized by growing demand.
Transaction costs may be reduced by cutting the number of exchange relationships through the
creation of cooperative / intermediary institutions (Sykuta and Cook, 2001). For example a milk
marketing cooperative may provide a bulking and bargaining service so that a processor need
not deal directly with small farms (Holloway et al. 2000). A marketing cooperative /
intermediary may also improve the flow of information to farmers, so that production better
meets the requirements of a market, and increase the bargaining power of members. This
bargaining power may lead to members receiving higher prices relative to non-members
(Morgan, 2008). Staatz (1987) argues that establishing such countervailing power is critical as
individually farmers are weak compared to concentrated input and processing industries. A
marketing cooperative may also decrease the likelihood of opportunism by buyers, as losing the
supply of a collective of farmers would be more damaging than terminating a relationship with a
single, small-scale producer. Reducing opportunism may encourage investment and hence
increase productivity (Gow et al. 2000). However while the theoretical arguments in favor of
marketing cooperatives are well known, in practice their performance in developing countries
has been patchy (Glover, 1987). In Eastern Europe, farmers have been reluctant to join such
arrangements, a tendency often linked to a legacy of distrust of collective arrangements
stemming from experiences under communist regimes (Gardner and Lerman, 2006).
An important characteristic of CIS markets, particularly in the early years of transition, was a
high level of opportunistic behavior on the part of buyers, sellers and regulatory agencies
(Safavian et al. 2001). Weak and ineffective systems of legal redress compounded this problem
so that firms turned to internal or purely private enforcement mechanisms based on constructed
mutual dependence or trust (Hendley et al. 2000). This included attempts to establish self-
enforcing contracts (Gow et al. 2000) and rewarding loyal buyers / suppliers. As Hendley et al.
(2000, p.649) remark ‘in the chaotic world of the transition, strategies that use trust - both
personal and calculative - emerge as critical.’ Interviews with food processors revealed that
while larger suppliers are preferred in general, trust, stable relationships and willingness to learn
were as, if not more, important (Gorton and White, 2007).
Spatially uneven competition
Models of monopolistic competition suggest that increased competition is associated with lower
average output prices and a lower level of price dispersion (Barron et al. 2004). In supply
chains, more competition should lead to more equal rent sharing, evidenced by higher producer
prices and more services for farmers (Swinnen and Maertens, 2006). There is empirical evidence
to support these notions. Data for retail gasoline markets consistently indicate that average
prices and price dispersion are negatively related to the number of stations within a particular
geographic market area (Barron et al. 2004; Eckert and West, 2006). Evidence for the Bulgarian
(Noev et al. 2009) and Polish (Dries and Swinnen, 2004) dairy sector reveals that competition
encourages processors to match or offer enhanced supplier assistance programs in order to
protect their supply base. Case study evidence suggests that farmers are worst placed when
faced with a privately owned or government controlled monopsony (Gorton and White, 2007;
Sadler, 2006). Wegren (1996) argues that local monopsonies are common in the CIS as Soviet
planners built food processing plants (mills, dairies etc.) on a one for each oblast (region) basis,
with no direct competition between them for raw materials. During the early years of transition
these local monopsonies often remained in place because of transport and logistical difficulties
and the political connections of established firms, which ‘insulated lone buyers within each
region from competition with buyers outside the region’ (Kazmer and Konrad, 2004, p.54).
3. Econometric Analysis
The econometric analysis consisted of two stages. First, a probit model is estimated to assess the
factors which determine the marketing channel utilized, specifically whether farmers sell only to
a commercial buyer or sell to final consumers. For an analysis of price heterogeneity it is
important to separate out those farmers that sell also to final consumers from those that supply
only commercial buyers. In the second stage we investigate the determinants of farm gate milk
prices focusing on those that sell only to commercial buyers.
The analysis is linked in that it is likely that the characteristics of farmers that sell only to
commercial buyers differ from those that sell also to final consumers. Unobservable
characteristics affecting the decision to sell only to commercial buyers will be correlated with
the milk price received by the farmer. Selectivity bias would be present, therefore, if we were to
draw inferences about the determinants of milk prices for all farmers based on the observed milk
prices of the subset of farmers that sell only to commercial buyers. Heckman’s (1979) two-stage
sample selection model copes with such a selection problem and is based on two latent
dependent variable models, where the level of the milk price received by the farmer is modeled
in a second stage as a mixed-effects linear regression model. The estimates obtained in the first
stage are used to generate the inverse Mill’s ratio (MR). This ratio is required to account for
possible sample selection bias in the second stage of the model (Heckman 1979; Greene 2003).
While the paper presents the results of both stages the principal focus of the analysis lies with
the second step. The remainder of this section outlines the two stages in greater detail.
Probit Model of Determinants of Marketing Channel Utilized
It is expected that a farmer’s decision to use a commercial marketing channel or not is
influenced by a multitude of factors, related to farm characteristics (fc), collaboration with other
farmers (cb), herd characteristics (h) and locational information (s = {Armenia, Ukraine}, where
Moldova is used as the reference category). Previous research on farming in Central and Eastern
Europe (Lerman, 2001; Mathijs and Noev, 2004) and developing countries (Barrett, 2008)
identify these factors as important determinants of the marketing channel utilized. To capture
farm characteristics the following variables are included: total land owned, total land rented,
pasture land used, common pasture land used, and the number of full- and part-time employees.
Collaboration behavior records if farmers cooperate with others in the processing of milk,
purchasing of inputs, lobbying, milk storage or in any other manner (e.g. machinery ring). Herd
characteristics cover the number of milking cows, number of heifers, number of calves and
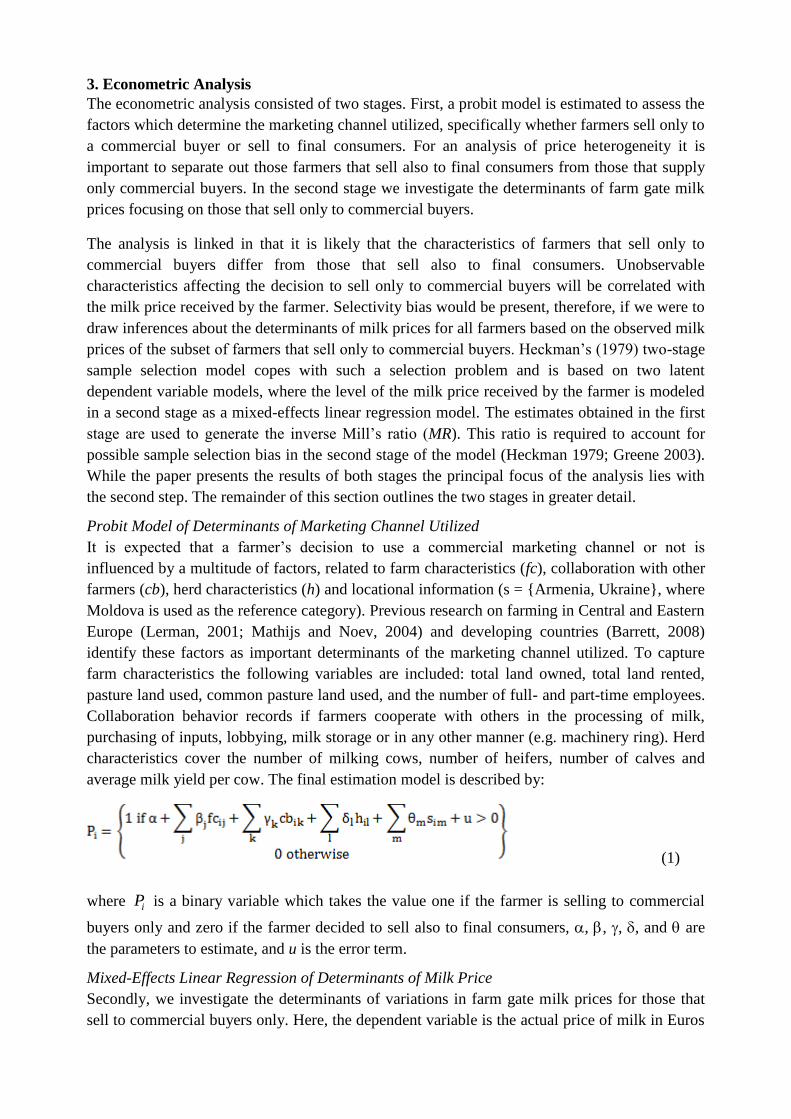
average milk yield per cow. The final estimation model is described by:
(1)
where iP is a binary variable which takes the value one if the farmer is selling to commercial
buyers only and zero if the farmer decided to sell also to final consumers, , , , , and are
the parameters to estimate, and u is the error term.
Mixed-Effects Linear Regression of Determinants of Milk Price
Secondly, we investigate the determinants of variations in farm gate milk prices for those that
sell to commercial buyers only. Here, the dependent variable is the actual price of milk in Euros
per liter received by farmers. Data were collected in national currencies and converted to Euros
using average exchange rates for the period in question. Milk price data covered three periods,
with respondents providing an average price received in winter 2005/6, summer 2005 and the
2004/5 winter season.
As some of the covariates are grouped according to one or more characteristics (i.e. representing
clustered, and therefore dependent data with respect to space and other characteristics) we apply
a multi-level modeling approach commonly referred to as mixed-effects or hierarchical model
(Fox, 2002; Bryk and Raudenbush, 2002). Such a mixed model is characterized as containing
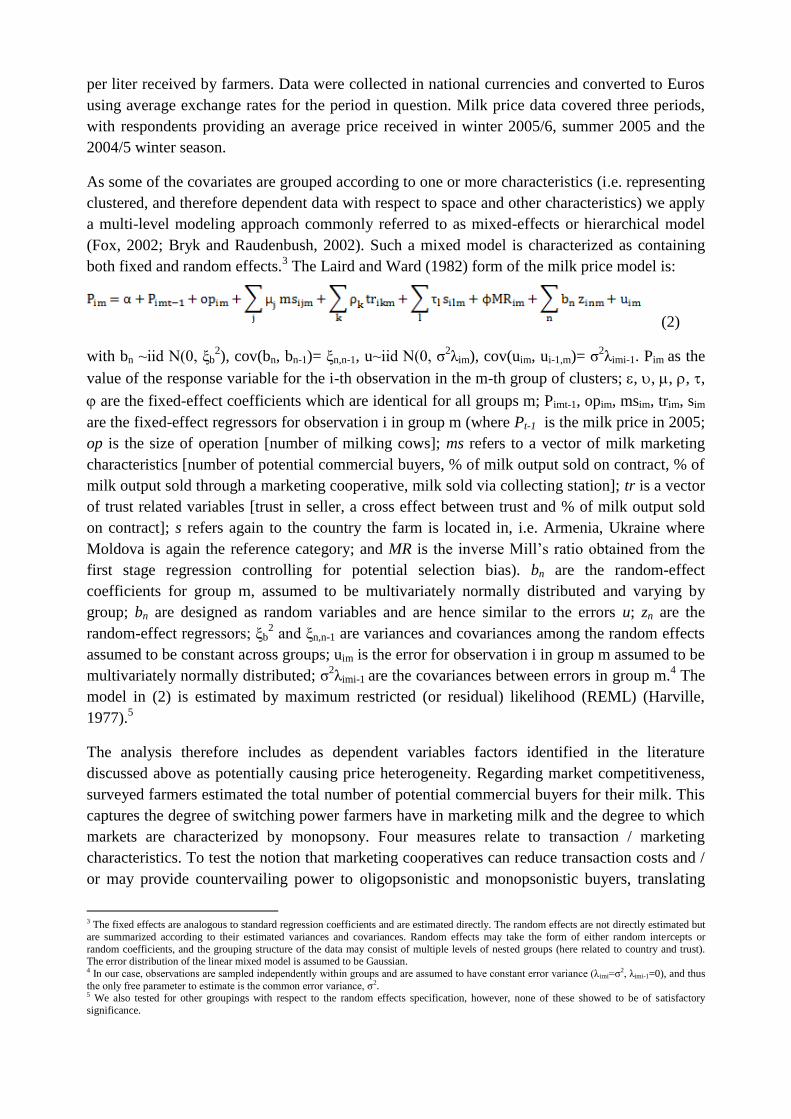
both fixed and random effects.3 The Laird and Ward (1982) form of the milk price model is:
(2)
with bn ~iid N(0, ξb2), cov(bn, bn-1)= ξn,n-1, u~iid N(0, σ
2λim), cov(uim, ui-1,m)= σ
2λimi-1. Pim as the
value of the response variable for the i-th observation in the m-th group of clusters; , , , , ,
are the fixed-effect coefficients which are identical for all groups m; Pimt-1, opim, msim, trim, sim
are the fixed-effect regressors for observation i in group m (where Pt-1 is the milk price in 2005;
op is the size of operation [number of milking cows]; ms refers to a vector of milk marketing
characteristics [number of potential commercial buyers, % of milk output sold on contract, % of
milk output sold through a marketing cooperative, milk sold via collecting station]; tr is a vector
of trust related variables [trust in seller, a cross effect between trust and % of milk output sold
on contract]; s refers again to the country the farm is located in, i.e. Armenia, Ukraine where
Moldova is again the reference category; and MR is the inverse Mill’s ratio obtained from the
first stage regression controlling for potential selection bias). bn are the random-effect
coefficients for group m, assumed to be multivariately normally distributed and varying by
group; bn are designed as random variables and are hence similar to the errors u; zn are the
random-effect regressors; ξb2 and ξn,n-1 are variances and covariances among the random effects
assumed to be constant across groups; uim is the error for observation i in group m assumed to be
multivariately normally distributed; σ2λimi-1 are the covariances between errors in group m.
4 The
model in (2) is estimated by maximum restricted (or residual) likelihood (REML) (Harville,
1977).5
The analysis therefore includes as dependent variables factors identified in the literature
discussed above as potentially causing price heterogeneity. Regarding market competitiveness,
surveyed farmers estimated the total number of potential commercial buyers for their milk. This
captures the degree of switching power farmers have in marketing milk and the degree to which
markets are characterized by monopsony. Four measures relate to transaction / marketing
characteristics. To test the notion that marketing cooperatives can reduce transaction costs and /
or may provide countervailing power to oligopsonistic and monopsonistic buyers, translating
3 The fixed effects are analogous to standard regression coefficients and are estimated directly. The random effects are not directly estimated but
are summarized according to their estimated variances and covariances. Random effects may take the form of either random intercepts or
random coefficients, and the grouping structure of the data may consist of multiple levels of nested groups (here related to country and trust). The error distribution of the linear mixed model is assumed to be Gaussian. 4 In our case, observations are sampled independently within groups and are assumed to have constant error variance (λimi=σ2, λimi-1=0), and thus
the only free parameter to estimate is the common error variance, σ2. 5 We also tested for other groupings with respect to the random effects specification, however, none of these showed to be of satisfactory
significance.

into higher prices for members, the analysis includes as a variable the percentage of a farm’s
total output that is sold via a marketing cooperative. Farmers may sell their output on contract
rather than via spot markets. Contracts should provide a greater degree of certainty for buyers
regarding the availability of supply, for which a buyer may pay a premium (Gow et al. 2000).
The study therefore includes the percentage of a farm’s total output sold on contract as an
independent variable. To capture the reliability of buyers, a measure of trust was included:
farmers responded to a 5 point Likert scale to the statement “My main buyer keeps the promises
it makes to us” where 1 = strongly disagree, 5 = strongly agree. Doney and Cannon (1997)
developed this measure of trust and it has been successfully incorporated into several subsequent
studies on supply chain relationships (Johnston et al. 2004). Finally regarding marketing
characteristics, a dummy variable captures whether the farm sells via a village collecting station.
Village milk collecting stations are common in the CIS, but quality testing has often been
rudimentary (Gorton et al. 2006). Where quality testing is weak, asymmetric information may
lead, following Akerlof’s (1970) market for lemons, to good milk being crowded out and prices
depressed.
We investigate the robustness of our estimates obtained by (1), and (2) by applying a simple
stochastic re-sampling procedure based on bootstrapping techniques (Efron and Tibshirani,
1993).
4. Data Set
Given the objective of identifying the determinants of variations in farm-gate prices, the
population of interest was defined as primary producers who sell cows’ milk to another supply
chain actor. Therefore farmers without dairy cows, those who did not sell any of the milk
produced or who processed all milk themselves (i.e. did not sell any raw milk) were excluded
from the study. While given the focus of this research these restrictions are justified, it means
that our sample cannot be directly compared to official data on the structure of milk production.
For data collection, a quota of 300 responses was set per country with the intention of including
a representative cross-section of commercial dairy farms, including both household producers
that sold milk and agricultural companies.
From the 3 countries in total 916 responses were obtained, 300 each from Armenia and Moldova
and 316 from Ukraine. In Ukraine, data collection concentrated on the Dnepropetrovsk region.6
Dnepropetrovsk, the country’s third largest city is the administrative centre of the region. The
region’s mean wage and standard of living is close to the Ukrainian average. Within this region,
sampling was weighted to five districts (rayons) that have significant commercial dairy
production. The Armenian sample comprises farms from all regions (marzes) that have
significant commercial milk production. The weighting given to each region was in accordance
with that area’s contribution to Armenia’s total milk production. National statistical agencies,
local and regional authorities, village majors, local livestock experts and agricultural agencies
aided the identification of individual farms. A single source could not be used as most 1-2 cow
farm units are unregistered.
The sample is divided into two groups: (i) those who sell directly to final consumers via local
markets and informal sales and (ii) those that only sell milk to a commercial buyer (milk
6 As Ukraine is geographically the largest country solely within Europe, it was not possible to survey all regions within the framework of this
project.

processor, logistics firm or other intermediary actor). Table 1 outlines the characteristics of the
two sub-samples.
Overall, the median herd size is low (2 milking cows). The mean is higher (17.2) due to a small
number of much larger operations in Ukraine with 1,000-1,500 milking cows. In the entire
sample there are only six farms with 500 or more cows. In contrast, 219 operators only possess
one milking cow (23.9% of the sample) and 290 farmers own two cows (31.7% of the sample).
The majority of farmers surveyed therefore possess two or fewer cows and this is in line with
other studies for the CIS (Dumitrashko, 2003; Keyser, 2004). There are however significant
differences in the distribution of farms across countries. Ukraine has a bi-modal distribution
with a large number of very small units (1-2 cows) but also a group of relatively large corporate
farms, each with 200 cows or more. Many of the corporate dairy farms in Ukraine originate
from the state and collective farms of the Soviet era. However their management style is now, in
general, radically different and many received significant investment from entrepreneurs and
business groups that accumulated wealth in other sectors of the economy. In Moldova, 2 cow
units predominate, with only a handful of farms with 50 or more cows. This extreme
fragmentation follows Moldova’s radical decollectivization where the assets and land of former
state and collective farms were divided up between members (Lerman et al. 2004). A unimodal
distribution characterizes Armenia, with the mode being between 6 and 9 cows. Only 1 farm in
the sample with 20 or more cows sells to final consumers, the vast majority of relatively large
operators therefore deal only with commercial buyers. Considering the micro-producers,
approximately 15% and 20% of one and two cow units sell to final consumers respectively.
Selling to final consumers is most common amongst the farms with 3 and 4 cows.
5. Results
Table 2 presents summary statistics on milk prices for those farms selling solely to commercial
buyers. In 2006, the average price actually received by farms was €0.1754 per liter. The
respective figures for Armenia, Moldova and Ukraine were €0.175, €0.153 and €0.193. These
farm gate prices are low by international standards and in line with earlier estimates (Venema,
2002; Perekhozhuk, 2007). The order of farm gate prices across countries, however, varies over
time. In 2005, the average farm gate prices in Armenia, Moldova and Ukraine were €0.131,
€0.151 and €0.140 respectively. In 2004, prices were higher in Ukraine (€0.1740) relative to
Armenia (€0.133) and Moldova ((€0.132).
Tables 3 and 4 summarize the results for the estimated models. According to the different
diagnosis tests performed all estimated model specifications show a statistical significance at a
satisfactory level and no severe signs of misspecification (see model quality measures). These
conclusions are supported by the bootstrapped bias-corrected standard errors. The linear
hypotheses tests conducted with respect to the significance of groups of explanatory variables
indicate the relevance of the final specifications. We further tested for potential endogeneity of
some of the explanatory variables as well as collinearity between different regressors.
Table 3 presents the bootstrapped probit model for determinants of marketing channel utilized.
Overall, farmers that sell only to commercial buyers operate on a larger scale. This is evident
from the significant positive relationships with total land owned, number of full time employees
and number of milking cows.
The partial productivity (average yield per cow) of those farms that sell only to commercial
buyers is higher. Those selling only to commercial buyers are significantly more likely to have
used extension services and cooperate with other farmers in the marketing of milk and milk
storage. These findings on scale, use of extension services and cooperation are consistent with
previous findings on factors affecting market participation and involvement in formal supply
chains (Mathijs and Noev, 2004; Barrett, 2008). Those supplying commercial buyers only are
significantly less likely to cooperate with farmers on ‘other matters’, which largely relates to the
use of common pasture land by small-scale farmers in Moldova. 91 per cent of the Moldovan
farmers surveyed utilized common pasture land in 2005. Farmers in Armenia and Ukraine are
significantly more likely to sell only to commercial buyers (Moldova is the reference category).
Table 4 presents the bootstrapped mixed-effects linear regression model for the determinants of
farm-gate milk prices. Even after other factors are controlled for, farmers operating on a larger
scale receive a better price for their milk. This is in accordance with the theory that transaction
costs for buyers will be lower when procuring from fewer, larger dairy farms (Reardon et al.
2009) and that in general transaction costs favor larger suppliers (Swinnen, 2005). Processors
are willing to share with larger farms some of the benefits of lower transaction costs to secure
their output.
Selling through a marketing cooperative also has a significant and positive effect on farm gate
milk prices. This suggests, in accordance with cooperative theory, that farmers can improve the
price received for their output by selling via marketing cooperatives. Given that farm gate prices
are often substantially below international prices in the CIS, this result gives credence to the
notion that marketing cooperatives can usefully ‘fill a gap in the economic institutions’ of the
rural CIS (Gardner and Lerman, 2006, p.1). Of those sampled that sell only to commercial
buyers, 24.6 per cent currently cooperate with other farmers in the marketing of raw milk. Of
those that do not currently cooperate in marketing raw milk, only 16 per cent are willing to
collaborate with other farmers in future. Thus the majority of farmers do not wish to collaborate
with other farmers despite the potentially useful role that marketing cooperatives can play.
Collaboration in other regards is also fairly low: in 2006 1.5, 0.6, 10.6, 3.5 and 19.2 per cent of
those selling exclusively to commercial buyers reported that they collaborated with other
farmers regarding milk processing, marketing processed dairy products, input purchasing,
lobbying and milk storage respectively. In each case, the majority of those not collaborating
were not willing to do so in future. The first step in expanding the role of marketing
cooperatives should therefore be persuading farmers of their merits and addressing directly their
reservations.
The use of contracting is also significant. Contracts give buyers greater certainty in supply and
they are willing to pay a premium for this, particularly during a period of growing demand as
witnessed at the time of study. Those farmers that sell via marketing cooperatives sell almost
exclusively on contract but for other buyers (processors, intermediaries) the picture is more
mixed. For those farmers that have signed a contract, a major motivating factor was the prospect
of a higher milk price - only 7.8 per cent reported that a higher milk price was of no importance
in influencing them to sign a contract.
Trust in supply relationships is also positively related to the milk price actually received by
farmers. Again buyers appear willing to pay a premium to farmers that they trust and forsake
opportunistic behavior. The interaction effect of trust and contracting suggest that these are
mutually reinforcing, with buyers valuing certainty in supply. This is particularly important in
the CIS where supply chain disruption and high levels of opportunistic behavior hindered the
viability of the whole supply chain (Gorton et al. 2006). After controlling for other factors, farm
gate milk prices are significantly higher in Armenia. Armenia is a landlocked, relatively remote
and modestly populated country which limits the transmission of international prices on to the
domestic market.
The sign for the competition coefficient is negative, suggesting, given the rest of the
independent variables that farm gate milk prices fall as the number of potential buyers increases.
This is not consistent with the notion that greater competition should lead to more equal rent
sharing. However, the number of potential buyers may not be an effective measure of
competition if there is collusion between processors as has been reported in Ukraine
(Perekhozhuk, 2007). Capturing collusion is however very difficult in survey research and
further work on the relationship between farm gate prices and competition is required. Just over
one quarter of those selling only to commercial buyers report that they realistically have only
one buyer for their milk, implying that local monopsonies persist in the CIS.
6. Conclusion
A weak non-farm economy, the absence of effective social safety nets and a dependence on
agriculture characterize rural areas in the CIS. The welfare of farmers therefore depends greatly
on the prices received by farmers for their output. This justifies the examination of the
determinants of variations in farm gate prices and we examine milk prices in Armenia, Moldova
and Ukraine for a sample of 918 operators.
The analysis suggests three main strategies for dairy farmers to improve the prices received for
their output: consolidation, cooperation and stable supply chain relationships. Farmers with
larger operations secure higher prices for their output. The transaction costs of dealing with a
smaller number of larger suppliers are less and the analysis presents empirical evidence which
confirms larger scale producers are favored by buyers. Selling via marketing cooperatives
improves the price received by farmers and pooling output in this manner can overcome some of
the size disadvantages of small-scale producers. The empirical evidence thus supports strategies
to encourage farmers’ involvement in marketing cooperatives. However, the majority of
nonmembers are currently unwilling to join. Marketing cooperatives will play a limited role
until these farmers are convinced of their merits. Nevertheless, developing intermediary
institutions such as marketing cooperatives are critical to avoid small-scale farms being further
marginalized or excluded from formal supply chains. Finally, buyers value the security in supply
which comes from trusted relationships and contracts. Establishing such relationships is in the
long-term interest of farmers.
References
AKERLOF, G.A. (1970). The market for “lemons”: quality uncertainty and the market mechanism,
Quarterly Journal of Economics, 84, 488-500.
BARRETT, C.B. (2008). Smallholder market participation: Concepts and evidence from eastern and
southern Africa. Food Policy, 33, 299-317.
BARRON, J., TAYLOR, B. & UMBECK, J. (2004). Number of Sellers, Average Prices, and Price Dispersion,
International Journal of Industrial Organization, 22, 1041–1066.
BESANCENOT, D. & VRANCEANU, R. (2004). Quality and price dispersion in an equilibrium search
model, Journal of Economics and Business, 56, 99-116.
BIROUL NAŢIONAL DE STATISTICĂ AL REPUBLICII MOLDOVA (2007). Statistical Yearbook of the
Republic of Moldova. Chişinău.
BROOKS, S.E., KEBEDE, B., ALLISON, E. & REYNOLDS, J.D. (2010). The Balance of Power in Rural
Marketing Networks: A Case Study of Snake Trading in Cambodia, Journal of Development Studies,
46, 1003 – 1025.
BRYK, A. S. & RAUDENBUSH, S. W. (2002). Hierarchical Linear Models: Applications and Data
Analysis Methods. Thousand Oaks: Sage Publications.
COCHRANE, N. (2007). Promoting sustainable market institutions in the transitional economies: the role
of international assistance. Paper presented at the Joint IAAE – 104th EAAE Seminar on Agricultural
Economics in Transition, Budapest, Hungary, 6th-8
th September.
COCKS, J., GOW, H.R. & WESTGREN, R. (2005). Public facilitation of small farmer access to international
food marketing channels: an empirical analysis of the USDA market assistance program in Armenia.
Paper presented at the AAEA Annual Meeting, Providence, Rhode Island.
VON CRAMON-TAUBADEL S., ZORYA S. & STRIEWE L. (2001). Price determination and government
policy on Ukrainian grain markets. In: von Cramon-Taubadel S., Zorya S. & Striewe L. (eds.),
Policies and Agricultural Development in Ukraine, Aachen: Shaker Verlag. 20–31.
VON CRAMON-TAUBADEL, S., NIVYEVSKIY, O., VON DER MALSBURG, E. & MOVCHAN, V. (2007).
Distortions to Agricultural Incentives in Ukraine, Agricultural Distortions Working Paper
06. Washington D.C.: The World Bank. DAVIS, P. (2005). The Effect of Local Competition on Admission Prices in the U.S. Motion Picture
Exhibition Market, Journal of Law and Economics, 48, 677-707.
DONEY, P.M. & CANNON, J.P. (1997). An examination of the nature of trust in buyer–seller relationships,
Journal of Marketing, 61, 35–61.
DRIES, L. & SWINNEN, J. F. M. (2004). Foreign Direct Investment, Vertical Integration, and Local
Suppliers: Evidence from the Polish Dairy Sector, World Development, 32, 1525-1544.
DUMITRASHKO, M. (2003). Survey of rural households. Institute of Management and Advanced Training
in Agribusiness (IMATA), Chişinău, mimeo.
ECKERT, A. & WEST, D.S. (2006). Exit and upgrading in response to entry: the case of gasoline retailing,
International Journal of the Economics of Business, 13, 351-372.
EFRON, B. & TIBSHIRANI, R. J. (1993). An Introduction to the Bootstrap. London: Chapman & Hall.
ENGELS, J.E. & SARDARYAN, G. (2006). Developing the food supply chain in Armenia. Paper presented
at the 98th EAAE Seminar on Marketing Dynamics with the Global Trading System: New
Perspectives, Chania, Crete, Greece, 29th June – 2
nd July.
FOX, J. (2002). Linear Mixed Models - Appendix to An R and S-PLUS Companion to Applied Regression.
(http://cran.r-project.org/doc/contrib/Fox-Companion).
GARDNER, B. & LERMAN, Z. (2006). Agricultural cooperative enterprise in transition from socialist
collective farming, Journal of Rural Cooperation, 34, 1-18.
GLOVER, D. J., (1987). Increasing the benefits to smallholders from contract farming: Problems for
farmers' organizations and policy makers, World Development, 15, 441-448.
GOETZ, S. J. (1992). A Selectivity Model of Household Food Marketing Behavior in Sub-Saharan Africa,
American Journal of Agricultural Economics, 74, 444-452.
GORTON, M., DUMITRASHKO, M. & WHITE, J. (2006). Overcoming supply chain failure in the agri-food
sector: A case study from Moldova, Food Policy, 31, 90-103.
GORTON. M. & WHITE J. (2007). Transformation and contracting in the supply chains of the former
Soviet Union. In J. F. M. Swinnen (ed.), Global supply chains standards and the poor: how the
globalisation of food system and the standards affects rural development and poverty. Wallingford:
CABI, 175-187.
GOW, H., STREETER, D. & SWINNEN, J. F. M. (2000). How private contract enforcement
mechanisms can succeed where public institutions fail: The case of Juhocukor a.s.
Agricultural Economics, 23, 253-265.
GOW, H.R. & SWINNEN, J.F.M. (2001). Private enforcement capital and contract enforcement in
transitional economies, American Journal of Agricultural Economics, 83, 686-690.
GREENE, W. (2003). Econometric Analysis 5th ed. Upper Saddle River, NJ: Prentice Hall.
HARVILLE, D. A. (1977). Maximum Likelihood Approaches to Variance Component Estimation and to
Related Problems, Journal of the American Statistical Association, 72, 320–338.
HECKMAN, J. J. (1979). Sample Selection Bias as a Specification Error, Econometrica, 47, 153-161.
HENDLEY, K., MURRELL, P. & RYTERMAN, R. (2000). Law, Relationships and Private Enforcement:
Transactional Strategies of Russian Enterprises, Europe-Asia Studies, 52, 627-656
HOLLOWAY, G., NICHOLSON, C., DELGADO, C., STAAL, S., & EHUI, S. (2000). Agro-industrialization
Through Institutional Innovation: Transactions Costs, Cooperatives, and Milk Market Development
in the Ethiopian Highlands. Agricultural Economics, 23, 279-288.
HOROWITZ, J. L. (2001). The Bootstrap. In: Heckman, J. J. & E. Leamer (eds.). Handbook of
Econometrics 5. Amsterdam: North-Holland, 3159-3228.
IFAD (2001). Rural Poverty Report 2001 – The Challenge of Ending Rural Poverty. Oxford: Oxford
University Press.
JOHNSTON, D. A., MCCUTCHEON, D. M., STUART, F. I. & KERWOOD, H. (2004). Effects of supplier trust
on performance of cooperative supplier relationships, Journal of Operations Management, 22, 23-
38.
KAZMER, D.R. & KONRAD M. (2004). Economic Lessons from the Transition: The Basic Theory Re-
Examined. Armonk: ME Sharpe.
KEYSER, J. C. (2004). Thematic Study on Comparative Advantage and Agricultural Marketing:
Phase 1 Synthesis Report, Rome: International Fund for Agriculture Development (IFAD). LAIRD, M., WARE, J. H. (1982). Random-Effects Models for Longitudinal Data, Biometrics, 38, 963-974.
LERMAN, Z. (2001). Institutions and Technologies for Subsistence Agriculture: How to Increase
Commercialization”, paper presented at the IAMO-Seminar Subsistence Agriculture in Central and
Eastern Europe: How to Break the Vicious Circle? Halle, Germany, May 6-8th.
LERMAN, Z., CSAKI, C. & FEDER G. (2004). Agriculture in Transition: Land Policies and
Evolving Farm Structures in Post-Soviet Countries. Lanham, MD: Lexington Books.
LEWIS, M. (2008). Price Dispersion and Competition with Differentiated Sellers, Journal of
Industrial Economics, 56, 654-678.
LIEFERT, W. & LIEFERT, O. (2007). Distortions to Agricultural Incentives in Russia. Agricultural
Distortions Working Paper 08, Washington D.C.: The World Bank. MADDALA, G. S. (1998). Limited-Dependent and Qualitative Variables in Econometrics. Cambridge:
Cambridge University Press.
MATHIJS, E. & NOEV, N., (2004). Subsistence Farming in Central and Eastern Europe: Empirical
Evidence from Albania, Bulgaria, Hungary, and Romania, Eastern European Economics, 42, 72–89.
MORGAN, S. B. (2008). Do Cooperatives Benefit Small Guatemalan Coffee Farmers? The Competitive
Role of Guatemalan Coffee Cooperatives on Farm-Gate Coffee Prices, University of San Francisco,
mimeo.
NOEV, N., DRIES, L. & SWINNEN, J. F. M. (2009). Institutional change, contracts and quality in transition
agriculture: evidence from the Bulgarian dairy sector, Eastern European Economics, 47, 62-85.
PEREKHOZHUK, O. (2007). Marktstruktur und Preisbildung auf dem ukrainischen Markt für Rohmilch,
Studies on the Agricultural and Food Sector in Central and Eastern Europe No.41, Leibniz Institute
of Agricultural Development in Central and Eastern Europe.
PORTO, G. (2005). Informal export barriers and poverty. Journal of International Economics, 66, 447-
470.
REARDON, T., BARRETT, C.B., BERDEGUE, J.A. & SWINNEN, J. F. M. (2009). Agrifood Industry
Transformation and Farmers in Developing Countries, World Development, 37, 1717-1727.
SADLER, M. (2006). Comparative Analysis of Cotton Supply Chains in Central Asia. In: J. F. M Swinnen
(ed.), Case Studies on Vertical Co-ordination in Agro-food Chains in Europe and Central Asia,
ECSSD, Washington DC: World Bank.
SAFAVIAN, M.S., GRAHAM, D. & GONZALEZ-VEGA, C. (2001). Corruption and microenterprises in
Russia, World Development, 29, 1215-1224.
SORENSEN, A. (2000). Equilibrium price dispersion in retail markets for prescription drugs, Journal
Political Economy, 108, 833–850.

STAATZ, J. M. (1987). Farmers’ Incentives to Take Collective Action via Cooperatives: A Transaction
Cost Approach, In: J. S. Royer (ed.), Cooperative Management Division, Agricultural Cooperative
Service, Report 18. U.S. Department of Agriculture, 87-107.
STRIEWE, L. (1999). Grain and Oilseed Marketing in Ukraine. Kiev: Iowa State University
Ukraine Agricultural Policy Project (UAPP).
SWINNEN, J.F.M. (2005). When the market comes to you or not. The Dynamics of Vertical
Coordination in Agri-food Chains in Transition. Washington D.C.: The World Bank. SWINNEN, J.F.M. & MAERTENS, M. (2007). Globalization, privatization, and vertical coordination in
food value chains in developing and transition countries, Agricultural Economics, 37, 89-102.
SYKUTA, M. E., & COOK., M. L. (2001). A New Institutional Economics Approach to Contracts and
Cooperatives. American Journal of Agricultural Economics, 83, 1273-1279.
VARIAN, H. R. (2000). Variants in Economic Theory: Selected Works of Hal R. Varian.
Cheltenham: Edward Elgar
VENEMA, J. (2002). Die Struktur und die Wettbewerbsfähigkeit der ukrainischen
Milchwirtschaft. Georg-August-Universität Göttingen, Fakultät für Agrarwissenschaft. WEGREN, S.K. (1996). From farm to table: the food system in post-communist Russia. Communist
Economies & Economic Transformation, 8, 149–183.
WILLIAMSON, O. E. (1985). The Economic Institutions of Capitalism. New York: Free Press.
WORLD BANK. (2005). Moldova: opportunities for accelerated growth. A country economic
memorandum for the Republic of Moldova, Washington D.C., Report No. 32876-MD.
Table 1: Number of milking cows per farm unit sampled by type of marketing channel
Number of milking
cows
Sell only to
commercial
buyer(s)
Sell to final
consumers as well
as commercial
buyer(s) Total
1 187 32 219
2 232 58 290
3 30 13 43
4 23 6 29
5 50 7 57
6 to 9 105 13 118
10 to 19 76 4 80
20 to 49 34 0 34
50 to 99 11 0 11
100 to 199 15 1 16
200 to 499 13 0 13
500+ 6 0 6
Total 780 136 916
Source: survey data
Table 2: Summary Statistics for milk prices, farms selling solely to commercial buyers
Mean (Euros per liter) Std. Deviation
All countries
Average milk price actually received (2006) 0.1754 .03890
Average milk price actually received (2005)s 0.1397 .03115
Average milk price actually received (2004) 0.1472 .03903
By country (2006)
Average milk price actually received (Armenia) 0.1750 .04122
Average milk price actually received (Moldova) 0.1532 .04624
Average milk price actually received (Ukraine) 0.1929 .01280
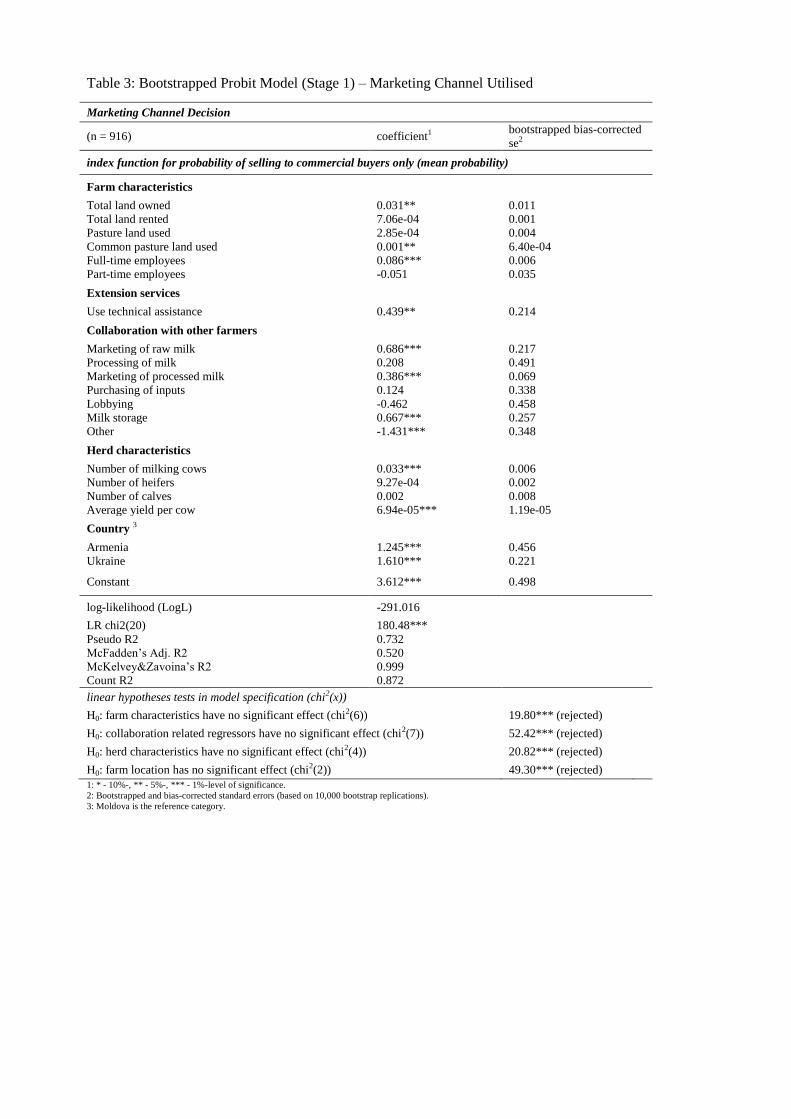
Table 3: Bootstrapped Probit Model (Stage 1) – Marketing Channel Utilised
Marketing Channel Decision
(n = 916) coefficient1 bootstrapped bias-corrected
se2
index function for probability of selling to commercial buyers only (mean probability)
Farm characteristics
Total land owned 0.031** 0.011
Total land rented 7.06e-04 0.001
Pasture land used 2.85e-04 0.004
Common pasture land used 0.001** 6.40e-04
Full-time employees 0.086*** 0.006
Part-time employees -0.051 0.035
Extension services
Use technical assistance 0.439** 0.214
Collaboration with other farmers
Marketing of raw milk 0.686*** 0.217
Processing of milk 0.208 0.491
Marketing of processed milk 0.386*** 0.069
Purchasing of inputs 0.124 0.338
Lobbying -0.462 0.458
Milk storage 0.667*** 0.257
Other -1.431*** 0.348
Herd characteristics
Number of milking cows 0.033*** 0.006
Number of heifers 9.27e-04 0.002
Number of calves 0.002 0.008
Average yield per cow 6.94e-05*** 1.19e-05
Country 3
Armenia 1.245*** 0.456
Ukraine 1.610*** 0.221
Constant 3.612*** 0.498
log-likelihood (LogL) -291.016
LR chi2(20) 180.48***
Pseudo R2 0.732
McFadden’s Adj. R2 0.520
McKelvey&Zavoina’s R2 0.999
Count R2 0.872
linear hypotheses tests in model specification (chi2(x))
H0: farm characteristics have no significant effect (chi2(6)) 19.80*** (rejected)
H0: collaboration related regressors have no significant effect (chi2(7)) 52.42*** (rejected)
H0: herd characteristics have no significant effect (chi2(4)) 20.82*** (rejected)
H0: farm location has no significant effect (chi2(2)) 49.30*** (rejected)
1: * - 10%-, ** - 5%-, *** - 1%-level of significance.
2: Bootstrapped and bias-corrected standard errors (based on 10,000 bootstrap replications).
3: Moldova is the reference category.
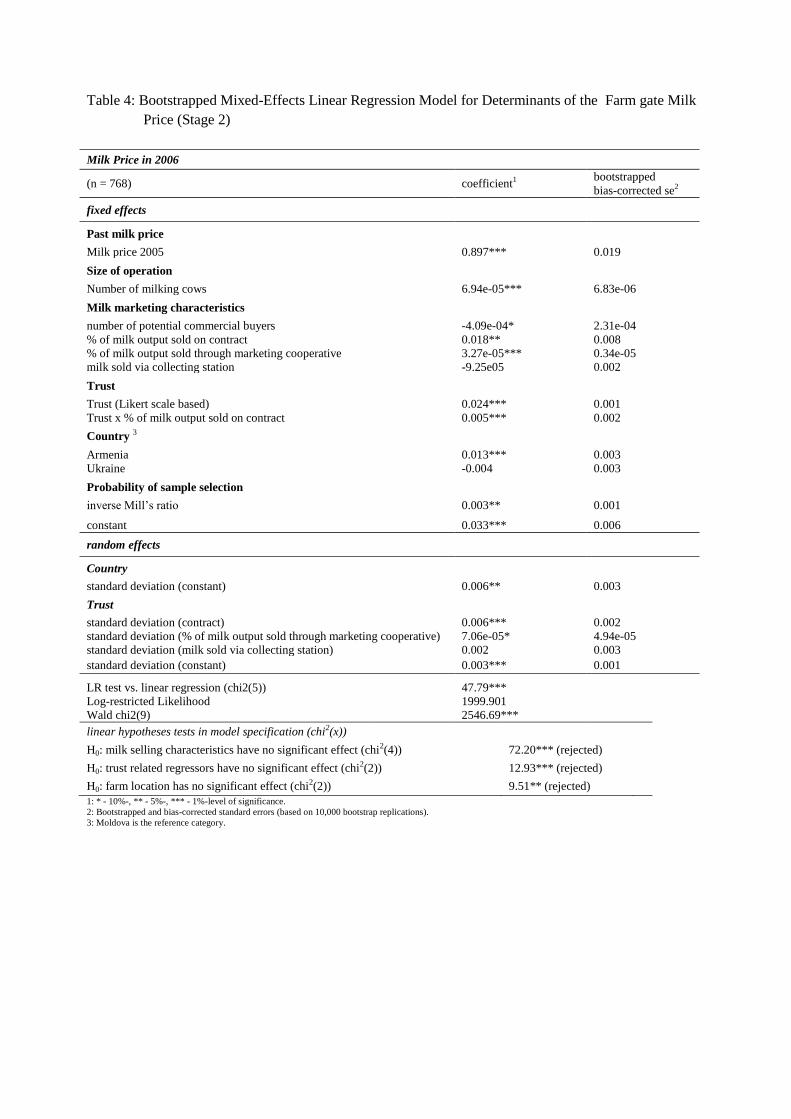
Table 4: Bootstrapped Mixed-Effects Linear Regression Model for Determinants of the Farm gate Milk
Price (Stage 2)
Milk Price in 2006
(n = 768) coefficient1 bootstrapped
bias-corrected se2
fixed effects
Past milk price
Milk price 2005 0.897*** 0.019
Size of operation
Number of milking cows 6.94e-05*** 6.83e-06
Milk marketing characteristics
number of potential commercial buyers -4.09e-04* 2.31e-04
% of milk output sold on contract 0.018** 0.008
% of milk output sold through marketing cooperative 3.27e-05*** 0.34e-05
milk sold via collecting station -9.25e05 0.002
Trust
Trust (Likert scale based) 0.024*** 0.001
Trust x % of milk output sold on contract 0.005*** 0.002
Country 3
Armenia 0.013*** 0.003
Ukraine -0.004 0.003
Probability of sample selection
inverse Mill’s ratio 0.003** 0.001
constant 0.033*** 0.006
random effects
Country
standard deviation (constant) 0.006** 0.003
Trust
standard deviation (contract) 0.006*** 0.002
standard deviation (% of milk output sold through marketing cooperative) 7.06e-05* 4.94e-05
standard deviation (milk sold via collecting station) 0.002 0.003
standard deviation (constant) 0.003*** 0.001
LR test vs. linear regression (chi2(5)) 47.79***
Log-restricted Likelihood 1999.901
Wald chi2(9) 2546.69***
linear hypotheses tests in model specification (chi2(x))
H0: milk selling characteristics have no significant effect (chi2(4)) 72.20*** (rejected)
H0: trust related regressors have no significant effect (chi2(2)) 12.93*** (rejected)
H0: farm location has no significant effect (chi2(2)) 9.51** (rejected)
1: * - 10%-, ** - 5%-, *** - 1%-level of significance.
2: Bootstrapped and bias-corrected standard errors (based on 10,000 bootstrap replications).
3: Moldova is the reference category.


