
Mary Bartelme Park
LPS Methodology Page 1 of 32
Submittal 8/7/15
Mary Bartelme Park Methods Document
Prepared by:
Research Fellow: M. Elen Deming, Professor, University of Illinois, Urbana-Champaign
Research Assistant: D. Scott Douglas, University of Illinois, Urbana-Champaign
Firm Liaison: Hana Ishikawa, Design Principal, Site Design Group, Ltd.
Overview of CSI: This investigation was conducted as part of the Landscape
Architecture Foundation’s 2015 Case Study Investigation (CSI) program. CSI matches
faculty-student research teams with design practitioners to document the benefits of
exemplary high-performing landscape projects. Teams develop methods to quantify
environmental, economic and social benefits and produce Case Study Briefs for LAF’s
Landscape Performance Series.

Mary Bartelme Park
LPS Methodology Page 2 of 32
Landscape Performance Benefits
ENVIRONMENTAL BENEFITS
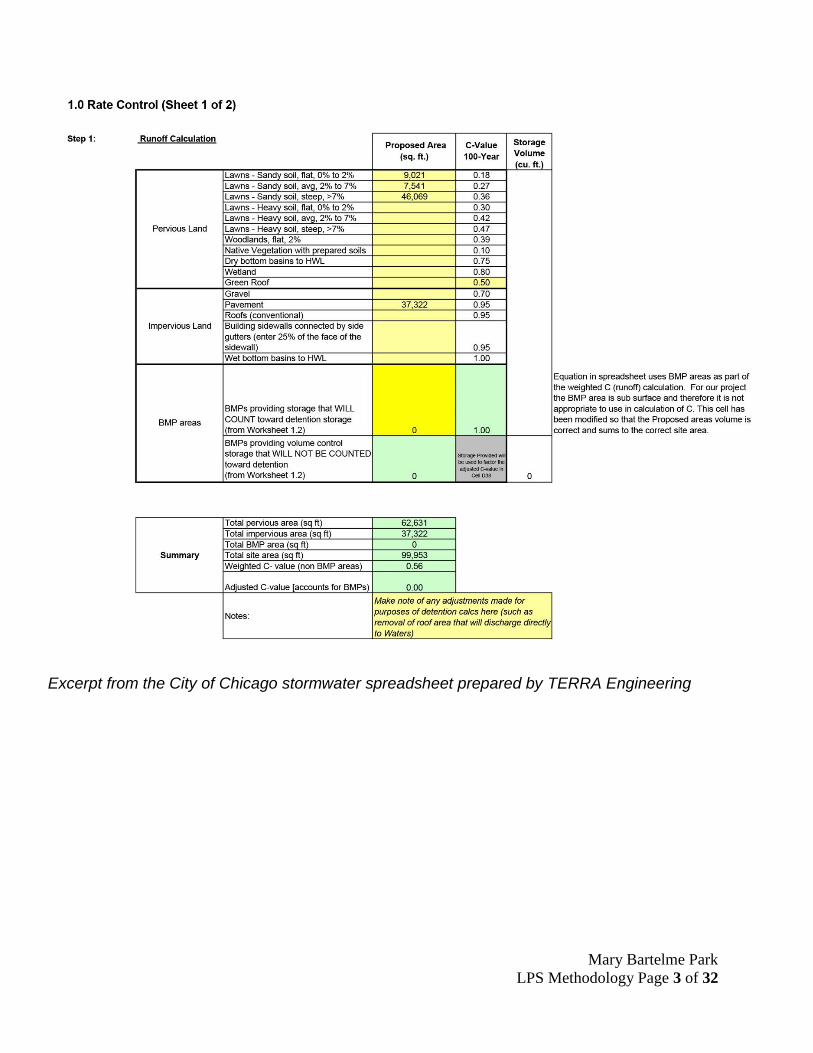
1. Captures and infiltrates all runoff from up to a 100-yr, 24-hr rain event.
Method
The stormwater management system for the 2.3-acre park was designed to contain all
stormwater runoff from a 100-year storm event. At the time of the permitting of this
project, the design 100-year storm in the Chicago area is a 24-hour storm that produces
5.712 inches of precipitation. All run-off from the entire park footprint is directed to a
subsurface stormwater management containment system via a network of surface
drains and underground pipes.
The central element of the containment system is a 14,700 sf underground
infiltration bed that is a minimum of 1.5 feet thick. This area is filled with CA-7 stone,
which averages ¾”-1” in size and is clean so it does not include any fines (smaller
stones and/or dust). The water storage capacity in this type of system is provided by
the void space between the pieces of aggregate. This containment system is located
above native soils that allow 1.9”/hr. of water to percolate down into the soil to recharge
the groundwater. The infiltration bed provides 64,500 gallons of storage capacity (0.198
acre feet), which, combined with the infiltration into the soil is able to contain the runoff
from a 100-year storm event for the site.
While the drainage system is connected to the city’s combined sewer system, the
system does not typically release water into the sewer during smaller storm events
when the soil percolation rate of 1.9”/hr. exceeds the amount of rainfall.
Mary Bartelme Park
LPS Methodology Page 3 of 32
Excerpt from the City of Chicago stormwater spreadsheet prepared by TERRA Engineering

Mary Bartelme Park
LPS Methodology Page 4 of 32
Excerpt from the City of Chicago stormwater spreadsheet prepared by TERRA Engineering
Infiltration bed dimensions:
Area: 14,700 sf
Depth: 1.5 ft. minimum thickness
Provided storage volume: 0.198 acre feet
1 acre foot = 325,851.429 gallons
0.198 x 325,851.429 gallons = 64,518.58 gallons
Required detention volume (100 year storm): 8637 cf
8637cf / 43,560 (cf in an acre foot) = 0.198 acre feet (64,518.58 gallons) required

Mary Bartelme Park
LPS Methodology Page 5 of 32
Sources:
1. Emails and stormwater calculation spreadsheets provided by TERRA Engineering,
Ltd.
2. Sheet C208 “Utility Plan” from the Bid Set dated 6/29/2009.
Note: The city of Chicago updated its stormwater calculation spreadsheet in 2014, after
this project was completed. The project engineer stated that the using the new
spreadsheet for this project would result in a 25% increase in storage requirements.
2. Saves 1,126,712 gallons of water per year with the park’s low flow spray feature
compared to the city’s standard interactive feature. This saves over $4,200
annually in water usage fees.
Method
The water feature design provides significant cost savings through the use of misting
heads and a series of activation bollards that allow visitors to trigger the water feature.
Groups of 15 misting heads are mounted inside 5 stainless steel sculptural frames.
When a user activates the water feature at one of the two bollards, it runs through a 3-
minute preprogramed misting sequence and shuts down. This sequence alternates the
mist between the 5 different frames, with a maximum of 2 frames active at any one time.
The use of activation bollards means that the water feature only runs when it has been
activated by a visitor; this saves water since the feature is not running when there aren’t
any visitors.
Water feature water consumption:
15 Nozzles per frame X 2 frames max = 30 nozzles active at any one time
30 nozzles X 0.0158 gallons per minute (gpm) = 0.474 gpm water consumption
If the fountain is activate for 30 minutes per hour over a 12 hour period (8 AM to
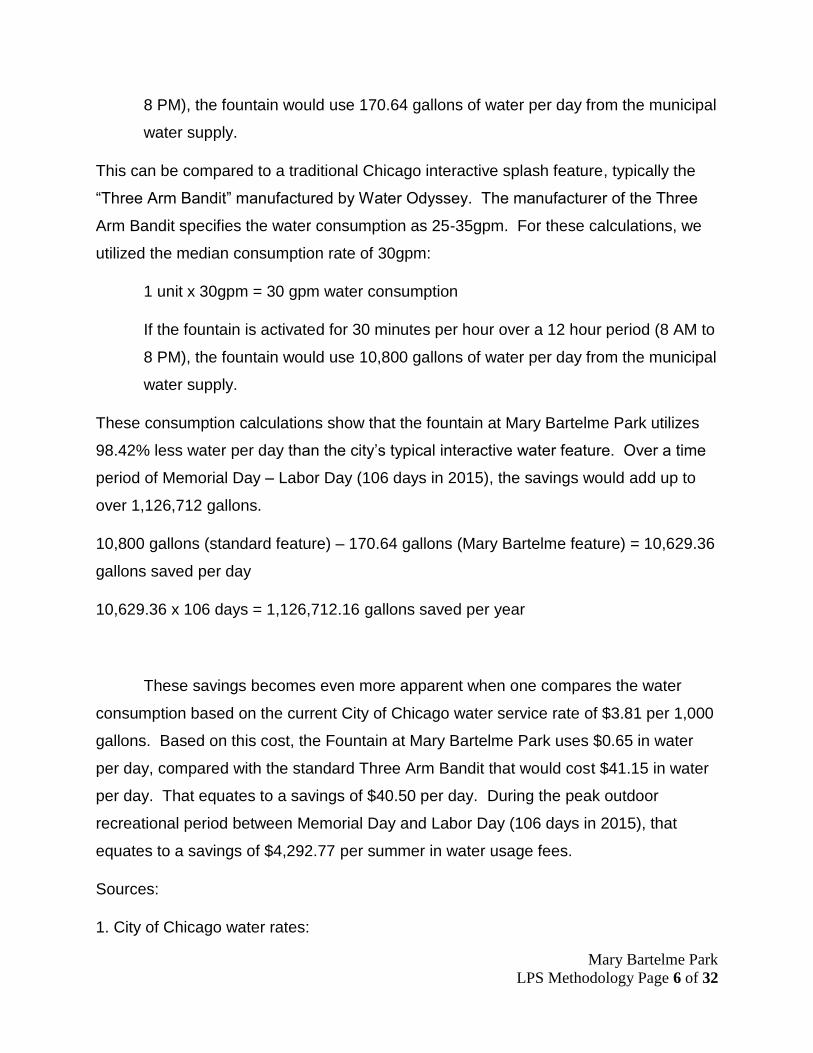
Mary Bartelme Park
LPS Methodology Page 6 of 32
8 PM), the fountain would use 170.64 gallons of water per day from the municipal
water supply.
This can be compared to a traditional Chicago interactive splash feature, typically the
“Three Arm Bandit” manufactured by Water Odyssey. The manufacturer of the Three
Arm Bandit specifies the water consumption as 25-35gpm. For these calculations, we
utilized the median consumption rate of 30gpm:
1 unit x 30gpm = 30 gpm water consumption
If the fountain is activated for 30 minutes per hour over a 12 hour period (8 AM to
8 PM), the fountain would use 10,800 gallons of water per day from the municipal
water supply.
These consumption calculations show that the fountain at Mary Bartelme Park utilizes
98.42% less water per day than the city’s typical interactive water feature. Over a time
period of Memorial Day – Labor Day (106 days in 2015), the savings would add up to
over 1,126,712 gallons.
10,800 gallons (standard feature) – 170.64 gallons (Mary Bartelme feature) = 10,629.36
gallons saved per day
10,629.36 x 106 days = 1,126,712.16 gallons saved per year
These savings becomes even more apparent when one compares the water
consumption based on the current City of Chicago water service rate of $3.81 per 1,000
gallons. Based on this cost, the Fountain at Mary Bartelme Park uses $0.65 in water
per day, compared with the standard Three Arm Bandit that would cost $41.15 in water
per day. That equates to a savings of $40.50 per day. During the peak outdoor
recreational period between Memorial Day and Labor Day (106 days in 2015), that
equates to a savings of $4,292.77 per summer in water usage fees.
Sources:
1. City of Chicago water rates:

Mary Bartelme Park
LPS Methodology Page 7 of 32
http://www.cityofchicago.org/city/en/depts/water/provdrs/cust_serv/svcs/know_my_wate
r_sewerrates.html
2. Water Odyssey Three Arm Bandit: http://waterodyssey.com/products/three-arm-
bandit/
3. Reduced local surface temperatures by over 25 degrees Fahrenheit through
the conversion of 48,460 sf of dark colored hardscape/rooftop areas into turf and
perennial plantings.
The previous condition of the project site included 2 large buildings (25,006 sf)
surrounded by large asphalt parking lots (64,276 sf). The buildings and the parking lots
covered 89.3% of the 2.3-acre site. The remaining 10,671 sf were turf and landscape
areas. Construction of the park included the conversion of 48,460 sf (1.11 acres) of
asphalt and black-roofed building surface into lawn and perennial planting areas.
Aerial photo of the previous conditions on the site in 2008 (left) and the park in 2015
(right). Aerial photos from Google Earth.

Mary Bartelme Park
LPS Methodology Page 8 of 32
Method
In order to measure the temperature impact of this change, the CSI team
compared surface temperatures of the new surfaces installed in the park and an
existing parking lot located due east of the park. The existing parking lot provided a
sampling point representative of the previous site conditions. Surface temperatures
were measured in degrees Fahrenheit with a Ryobi IR002 hand held infrared
thermometer on 06/28/2015 and 06/29/2015 during the peak afternoon temperatures.
Measurements were taken at 2:30PM, 3:30PM, and 4:30PM and can be viewed in the
chart below.
Field
Measurements
Difference compared to
asphalt
Units: Degrees
Fahrenheit
Units: Degrees
Fahrenheit
6/28/2015
2:30
PM
3:30
PM
4:30
PM
2:30
PM
3:30
PM
4:30
PM
Weather conditions: Partly cloudy
Air temperature 78.5 79.0 79.5
Adjacent asphalt (previous
condition) 97.5 98.7 99.1
Daily
Avg.
White pavers 103.4 104.5 104.7 5.9 5.8 5.6 5.8
Medium pavers 108.5 109.8 110.1 11.0 11.1 11.0 11.0
Dark pavers 108.7 109.9 110.2 11.2 11.2 11.1 11.2
Plain concrete sidewalks 94.4 95.6 97.1 -3.1 -3.1 -2.0 -2.7
Lawn areas 68.1 68.7 75.8 -29.4 -30.0 -23.3 -27.6
6/29/2015
2:30
PM
3:30
PM
4:30
PM
2:30
PM
3:30
PM
4:30
PM
Weather conditions: Partly cloudy
Air temperature 71.5 73.0 74.5
Adjacent asphalt (previous
condition) 104.5 105.1 105.5
Daily
Avg.

Mary Bartelme Park
LPS Methodology Page 9 of 32
White pavers 102.6 103.4 103.7 -1.9 -1.7 -1.8 -1.8
Medium pavers 111.4 112.5 112.9 6.9 7.4 7.4 7.2
Dark pavers 110.5 110.9 112.1 6.0 5.8 6.6 6.1
Plain concrete sidewalks 103.7 104.4 105.0 -0.8 -0.7 -0.5 -0.7
Lawn areas 80.6 81.1 82.2 -23.9 -24.0 -23.3 -23.7
Upon comparison of the temperatures of the new surfaces with the temperatures
of the parking lot (representing the previous conditions), some surprising revelations
appeared. On average, the surface temperatures of the lawn areas were substantially
less than the temperature of the adjacent asphalt (by 25.3%). The average temperature
difference between the asphalt and the lawn was 25.65 degrees, with a maximum
recorded difference of 30.0 degrees. This shows that green space has helped lower
surface temperatures in this urban setting.
One result that stood out to the CSI team was that surface temperatures of
colored concrete pavers, even those in lighter shades, averaged higher temperatures
than those of the asphalt parking lot. Most assume that a lighter colored paving reflects
more heat than darker pavements. In fact, the plain concrete measured at a lower
temperature than the concrete pavers and the asphalt. The team identified several
research teams that have found similar results and who are investigating further into the
albedo (reflected and retained heat) of various materials.
Links to studies of effects of Albedo on temperatures:
https://ncesmart.asu.edu/docs/smart/unintended-consequences-1013.pdf
http://fullcircle.asu.edu/faculty/paving-the-way-to-a-cooler-future/
http://www.asphaltfacts.com/news/industry-news/research-findings-concrete-
pavements-make-urban-heat-islands-worse-not-better/

Mary Bartelme Park
LPS Methodology Page 10 of 32
Limitations: The quantity of data points is the most apparent limitation, weekly sampling
over a one-year time period would provide a more extensive data set that could also
evaluate the potential effects of seasonal variations in air temperature.
SOCIAL
1. Attracts over 2,000 people per year for 10 major programmed events.
Mary Bartelme Park is utilized for numerous events throughout the year, some
coordinated on the city level and others organized by the Park Advisory Committee.
Yearly major organized activities include:
“The Big Find” Easter Egg Hunt, 350-400 attendees, Sponsor: Soul City Church
Clean & Green Volunteer Events (a park beautification event), 2 per year,
averaging 20-30 attendees, Sponsor: Park Advisory Council
Movie Night, 2 per year, averaging 250-300 attendees, Sponsor: West Loop
Community Organization
DJ in the Park, 75-100 attendees, Sponsor: Chicago Park District
Party for the Park Fundraising Event, 500-600 attendees, Sponsor: West Loop
Community Organization
‘Howl-o-ween’ Pet Event, 50-100 attendees, Sponsor: West Loop Veterinary
Care
West Loop Families Halloween Parade, 200-250 attendees, Sponsor: West Loop
Families
Holiday Tree and Menorah Lighting Ceremony, 250-300 attendees, Sponsor:
West Loop Community Organization
Weekly events during the summer months:
Saturday mornings in the summer: Yoga in the Park
Weekdays in the summer: Fit4Mom morning exercise classes

Mary Bartelme Park
LPS Methodology Page 11 of 32
In addition to these formal events, the park plays host for many informal events and
activities. While observing the park and taking surveys, the CSI team witnessed several
business meetings taking place in the park. Groups of 2-4 business professionals
would “walk and talk” around the park or claim a section of seating to hold their
meetings.
2015 Event calendar:
Sources:
1. Correspondence with the Mary Bartelme Park Advisory Council
2. Advisory Council website: http://www.westlooppark.com/#!events/c16ck
3. Data provided by the Chicago Parks Department

Mary Bartelme Park
LPS Methodology Page 12 of 32
2. Supports alternative modes of transportation, only 10% of weekday and 18% of
weekend users arrived at the park via automobiles. 82% of weekday park users
travel less than 10 minutes to get to the park.
Method
In order to gain a better understanding of the impact of the Mary B Park on proximate
neighbors, as well as the wider extent of that impact, we created a survey that was
administered on site for two consecutive days: June 28-29, 2015. The objectives of the
instrument (see Appendix A & B) were 1) to learn how far visitors to the park would
travel and what modes of transit they used; 2) what attractions did they find most
notable at the park; and 3) what impact (if any) their experiences at the park might have
had on their connections and perception toward the neighborhood.
First, a survey instrument and protocols were developed for the purpose of
securing a waiver from Internal Review Board. Once this was secured (6/17/15), the
team was free to begin approaching residents. All data collected was anonymous; after
checking an informed consent clause, numbered surveys were issued to visitors; this
technique permitted the verification of consent, but also preserved the anonymity of
data we collected.
Day Date 8:30 AM 10:30 AM 12:30 PM 2:30 PM 4:30 PM
Sunday 6/28/2015 --- --- XX XX XX
Monday 6/29/2015 XX XX XX XX XX
Note: XX indicates times when the survey was administered on site
Findings
Through on-site interviews of visitors, we determined that half (50%) of the park
users who filled out a survey (n=44) lived within the park’s zip code (60607). However,

Mary Bartelme Park
LPS Methodology Page 13 of 32
the impact of the park extends well beyond the proximate streets. Mary Bartelme Park
draws visitors from all over Chicago, attracting local visitors from 12 additional Chicago
area zip codes. In addition to Chicago-area visitors, 4 interviewees lived outside the
state of Illinois, including Ohio, Indiana, New York, and Texas.
During the week, 82% of those people surveyed (n=17) traveled less than 10
minutes to get to the park. That percentage dropped on the weekend, with only 68% of
surveyed visitors travelling less than 10 minutes to get to the park. Only 10% of
weekday users and 18% of weekend users arrive at the park via automobile. This is
most likely influenced by the limited amount of on street parking near the park. 78% of
the weekend visitors and 75% of the weekday visitors travelled to the park on foot. On
the weekday, other modes of travel included bicycle (5%) and public transit (10%). On
the weekend, other modes of travel included bicycle (4%).

Mary Bartelme Park
LPS Methodology Page 14 of 32
Map of surrounding zip codes and the number of survey takers per zip code.

Mary Bartelme Park
LPS Methodology Page 15 of 32
Based on the survey data, we were also able to determine that the playground
and the dog park were the top two attractions for visitors, totaling over 58% of
interviewees. Those two features split that 56% evenly at 28% each. Other park
features that attracted visitors were the wild flowers (12%), city views (12%), water
feature (8%), and other (12%), which included people walking through the park on their
way to a different destination.

Mary Bartelme Park
LPS Methodology Page 16 of 32
Source:
In-person survey, see appendix for copies of the survey form. The park features
entrances at all 4 corners, so the surveyor rotated to a different entrance every 15
minutes for a total of 1 hour. In order to make the surveyor appear more official, a sign
that stated “Park Impact Study” with the logos for the University of Illinois and the
Landscape Architecture Foundation was attached to the fencing/railing adjacent to
where he stood. A name tag was also created to make the surveyor appear more
approachable.
Note: On Sunday afternoon, park visitors were far more willing to stop and fill out
a survey than they were on Monday. On Monday, most park visitors—even those that
were there with dogs and/or children—stated that they were in a hurry and were not
willing to stop and fill out the survey.

Mary Bartelme Park
LPS Methodology Page 17 of 32
ECONOMIC
1. Generates $5,660 per year in event permit fees.
All parks in the Chicago Park District may be rented for public and private events. While
the specific amount of revenue from fees was not available from the park district, the
CSI team was able to use the park district’s 2015 special event permit application form
to estimate the fees for the scheduled events at the park. Fees are based on number of
attendees and the type of activities that will be occurring during the event.
Mary Bartelme Park Event Fees
Event # People Fee
Easter egg hunt 350-400 $ 685.00
Movie night 1 250-300 $ 685.00
Movie night 2 250-300 $ 685.00
DJ in the park 75-100 $ 145.00
Fundraiser 500-600 $ 1,540.00
Howl-o-ween 50-100 $ 145.00
Halloween 200-250 $ 685.00
Holiday tree 250-300 $ 685.00
Exercise group yearly fee $ 405.00
Total: $ 5,660.00
Source:
2015 Chicago Park District special event permit application.
2. Provides a setting for numerous small businesses to operate, including: fitness
classes that generate over $7,500 per year, food vendors, and professional
photographers.
The park grounds provide an area for small businesses to capitalize on the large open
spaces, unique city views, and interesting site elements. The park hosts a variety of

Mary Bartelme Park
LPS Methodology Page 18 of 32
professionally lead fitness training groups for moms (weekday mornings) and yoga
classes (Saturday mornings) during the summer season. If a company is going to host
events that participants pay to attend, they have to acquire a $405/year permit from the
parks department.
CLASSES: The weekday exercise groups for moms focus on stroller based
exercises for mothers and they cost a minimum of $15 per visit. Attendance numbers
for these group events range from 1-10 participants. Based on an average attendance
of 5 people, each class generates $75. With 101 days listed on their calendar for 2015,
these classes generate an estimated $7,575 per year. 2015 is the second year that the
company has hosted these classes at the park, so it generated enough profits in 2014
to justify reacquiring the yearly permit to operate in the park.
FOOD VENDORS: In addition to these fitness classes, the park has also
attracted a smoothie and hotdog vendor to the area. That vendor has received a permit
from the parks department to locate the stand on the northwest corner of the park,
adjacent to the water feature. A company representative stated that this location for the
business (its fourth location) has created several part time jobs, pays permit fees to the
parks department, and is a needed source for food and drink right at the outside edge of
the park. Specific revenue numbers were not made available to the CSI team. In
addition to this food vendor, the city of Chicago has created a food truck parking area
with space for two trucks on W. Adams Street at the park. This addition of a food truck
location increases the number of businesses that can benefit from the quantity of people
that the park attracts. Since food trucks follow an irregular schedule, notifying patrons
of their location via social media, the CSI team was unable to identify how many trucks
visit the park, how often they are there, or how much revenue is generated at the park.
PHOTO OPPORTUNITES: Local professional photographers have also found
the park to be a location where they can capitalize on the visual interest of the sculptural
fountain and the skyline views by using the park as a setting for photo shoots. A
resident of a condo that overlooks the park stated that photographers can been seen
taking portraits in the park every weekend when the weather is nice. One person who
filled out a survey on the weekend was there for a family photography session.

Mary Bartelme Park
LPS Methodology Page 19 of 32
Photography sessions typically cost between $200-375, depending on the time frame,
which can range between 30-90 minutes.
PETS: In addition to these businesses that depend on the park to provide a
physical setting for their business, a pet store that is located across the street from the
park also benefits from the foot traffic that is generated by the park. While the owner
stated that the park itself was not a determining factor in the selection of their corner
store front, she did state that over 50% of her clientele utilize the park and the dog park
within the park.
Sources:
In person, phone, and email interviews with business owners and review of business
websites for events at the park.
Food truck: http://chicago.suntimes.com/politics/7/71/171226/chicago-to-add-nine-
more-dedicated-stands-for-mobile-food-trucks
https://fit4mom-chicagoloop.frontdeskhq.com/locations/bartelme-mary-park-west-
loop#/month?dt=2015-07-13<=staff
3. Provides a location for free yoga classes for the general public, worth over
$8,910 per year.
Attendance at the Saturday morning yoga classes, which are held June through
August, averages 35 people per week and had 75 participants at their special 4th of July
morning session. While a typical yoga class with this local yoga studio costs $18 per
session to participate, these park sessions are provided for free. This is a total cost
savings of over $630 per week ($8,910 per year) for users. The yoga studio
representative stated that these free outdoor sessions are a great recruitment tool for
their studio, which is located 1 block west of the park. While they would not offer any
detailed numbers on revenue generated by the Saturday park sessions, the
representative stated that it has “been great to spread the word about our studio.”

Mary Bartelme Park
LPS Methodology Page 20 of 32
Yoga in the park event. Photo by Robin French, Bare Feet Power Yoga.
Email interviews with business owners and review of the company website:
http://barefeetpoweryoga.com/events/4th-of-july-class-at-the-park/
4. Would motivate 82% of park users interviewed to consider relocating to the
area.
To further evaluate what impact (if any) their experiences at the park might have
had on visitors’ perception toward the neighborhood, the CSI survey included this
question: “If you were thinking about relocating your home or business, would this park
motivate you to move into the surrounding area?” 82% of the weekday park visitors
who participated in our survey answered ‘yes,’ showing that the park is seen as positive
motivator for relocating homes and businesses to the surrounding neighborhood. When

Mary Bartelme Park
LPS Methodology Page 21 of 32
asked “to what extent it would motivate,” 71% of those who answered yes rated the
park’s influence as “definitely motivating” or “motivating.”
Source:
In person survey, see appendix for copies of the survey form.
5. Helps to increase property values within a 2 block radius by 49.88% over the
average property value within the park’s zip code.
The park is located in what many describe as a “trendy” and “prime” location to live.
What were once dilapidated warehouse and industrial buildings now contain offices,
businesses and residential condominiums and lofts. The redevelopment of the west
loop area began in 1990 when Oprah Winfrey located her Harpo Studios on Washington
Street, just 2 blocks north and 2 blocks west of Mary Bartelme Park.
The CSI team collected and reviewed available sales data on sold properties that
were located within a two-block radius of Mary Bartelme Park. Pro block area sold for
an average price of $376,954.55 in 2014 and 2015. When sale prices of those
properties are compared to the average home price within the park’s zip code (60607)
Yes 82%
No 18%
Would the park motivate you to relocate to the area?

Mary Bartelme Park
LPS Methodology Page 22 of 32
of $251,500.00, the properties within two blocks of the park had average price increases
of 49.88% over the zip code average. When compared to the average home price for
the Chicago metro area ($188,000.00) that percent increase climbed to 100.51%.
The CSI team also located 2 properties with sales pending (July 2015) and those
properties showed an average price increase of 87.87% over the zip code average and
151.33% increase over the Chicago metro average. When the team compared the
prices of properties that are currently listed for sale, the differences increased even
further. The 7 properties currently listed for sale averaged an increase of 105.84% over
the zip code average and a 175.36% increase over the Chicago metro average.
Based on the price increases from those properties sold in 2014/2015 to the
properties that are sale pending or currently listed for sale, the property values around
the park are continuing to increase. An area real estate agent verified this and also
stated that “buyers will pay more to be close to the park,” and that “the park is
mentioned in almost all listings for properties close to the park.”
Comparison of property values within a 2 block radius
of the park to the average price within the park's zip
code (60607) and the average price in the Chicago
metro area
Average home price in zip
code (60607)
Average home price in the
City of Chicago
Average
price:
$
251,500.00 Average price:
$
188,000.00
Difference
from average
price
Percent
increase
Difference
from average
price
Percent
increase Currently listed for sale
Sale
year Price
100 S Sangamon St 4s --- $ 899,000.00 $ 647,500.00 257.46% $ 711,000.00 378.19%
850 W Adams Apt 4b --- $ 700,000.00 $ 448,500.00 178.33% $ 512,000.00 272.34%
842 W Adams St FL2 --- $ 310,000.00 $ 58,500.00 23.26% $ 122,000.00 64.89%
950 W Monroe St Apt 916 --- $ 685,000.00 $ 433,500.00 172.37% $ 497,000.00 264.36%
949 W Madison St Apt
404 --- $ 245,000.00 $ (6,500.00) -2.58% $ 57,000.00 30.32%

Mary Bartelme Park
LPS Methodology Page 23 of 32
111 S Morgan St Apt 307 --- $ 384,900.00 $ 133,400.00 53.04% $ 196,900.00 104.73%
949 W Madison St Apt
401 --- $ 399,900.00 $ 148,400.00 59.01% $ 211,900.00 112.71%
Average: $ 517,685.71 Average: 105.84% Average: 175.36%
Sale pending
111 S Morgan St Apt 523 2015 $ 390,000.00 $ 138,500.00 55.07% $ 202,000.00 107.45%
1025 W Monroe St 2015 $ 555,000.00 $ 303,500.00 120.68% $ 367,000.00 195.21%
Average: $ 472,500.00 Average: 87.87% Average: 151.33%
Sold
950 W Monroe St 803 2015 $ 400,000.00 $ 148,500.00 59.05% $ 212,000.00 112.77%
939 W Madison St Apt
405 2015 $ 368,000.00 $ 116,500.00 46.32% $ 180,000.00 95.74%
901 W Madison St Unit
712 2014 $ 368,500.00 $ 117,000.00 46.52% $ 180,500.00 96.01%
1040 W Adams St Unit
321 2014 $ 372,000.00 $ 120,500.00 47.91% $ 184,000.00 97.87%
950 W Monroe St Unit
701 2014 $ 375,000.00 $ 123,500.00 49.11% $ 187,000.00 99.47%
1040 W Adams St Unit
248 2014 $ 380,000.00 $ 128,500.00 51.09% $ 192,000.00 102.13%
939 W Madison St Apt
410 2015 $ 380,000.00 $ 128,500.00 51.09% $ 192,000.00 102.13%
1040 W Adams St Unit
327 2014 $ 382,000.00 $ 130,500.00 51.89% $ 194,000.00 103.19%
949 W Madison St Apt
201 2015 $ 390,500.00 $ 139,000.00 55.27% $ 202,500.00 107.71%
933 W Van Buren St Apt
501 2015 $ 435,000.00 $ 183,500.00 72.96% $ 247,000.00 131.38%
843 W Adams St Apt 506 2015 $ 295,500.00 $ 44,000.00 17.50% $ 107,500.00 57.18%
Mary Bartelme Park
LPS Methodology Page 24 of 32
Average: $ 376,954.55 Average: 49.88% Average: 100.51%
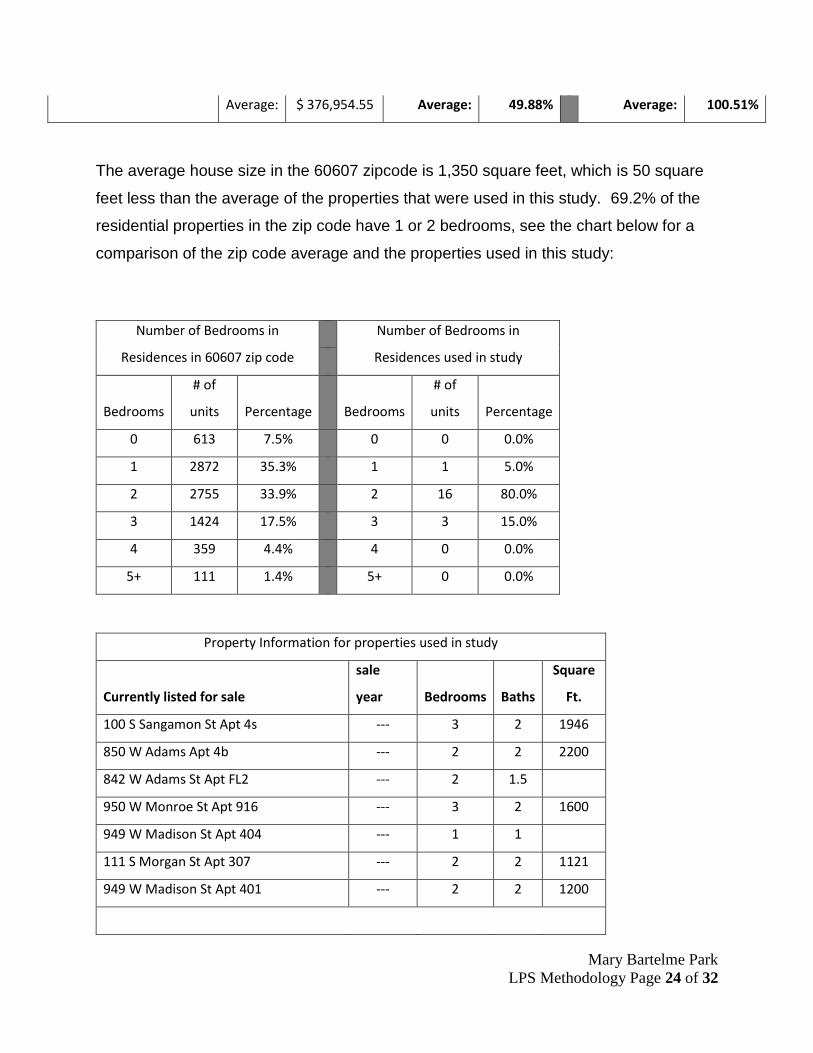
The average house size in the 60607 zipcode is 1,350 square feet, which is 50 square
feet less than the average of the properties that were used in this study. 69.2% of the
residential properties in the zip code have 1 or 2 bedrooms, see the chart below for a
comparison of the zip code average and the properties used in this study:
Number of Bedrooms in
Residences in 60607 zip code
Number of Bedrooms in
Residences used in study
Bedrooms
# of
units Percentage Bedrooms
# of
units Percentage
0 613 7.5% 0 0 0.0%
1 2872 35.3% 1 1 5.0%
2 2755 33.9% 2 16 80.0%
3 1424 17.5% 3 3 15.0%
4 359 4.4% 4 0 0.0%
5+ 111 1.4% 5+ 0 0.0%
Property Information for properties used in study
Currently listed for sale
sale
year Bedrooms Baths
Square
Ft.
100 S Sangamon St Apt 4s --- 3 2 1946
850 W Adams Apt 4b --- 2 2 2200
842 W Adams St Apt FL2 --- 2 1.5
950 W Monroe St Apt 916 --- 3 2 1600
949 W Madison St Apt 404 --- 1 1
111 S Morgan St Apt 307 --- 2 2 1121
949 W Madison St Apt 401 --- 2 2 1200

Mary Bartelme Park
LPS Methodology Page 25 of 32
Sale pending
111 S Morgan St Apt 523 2015 2 2 1121
1025 W Monroe St Apt 3E 2015 2 2 1600
Sold
950 W Monroe St Apt 803 2015 2 2
939 W Madison St Apt 405 2015 2 2 1300
901 W Madison St Unit 712 2014 2 2
1040 W Adams St Unit 321 2014 2 2 1200
950 W Monroe St Unit 701 2014 2 2 1572
1040 W Adams St Unit 248 2014 2 2 1250
939 W Madison St Apt 410 2015 2 2 1300
1040 W Adams St Unit 327 2014 2 2 1265
949 W Madison St Apt 201 2015 2 2 1300
933 W Van Buren St Apt 501 2015 3 2 1464
843 W Adams St Apt 506 2015 1 1 970
Average: 2.1 1.9 1400.6
Zillow was the source for all property
data
In an attempt to offset the 50 square foot difference between the zip code average and
the survey property average, the prices were also compared on a per square foot basis.
The average price per square foot for all of the survey properties showed an increase of
74.85% over the average price per square foot for the zip code, with a minimum
increase of 51.95%.
Comparison of property values within a 2 block radius of the park to the average price
within the park's zip code (60607) and the average price in the Chicago metro area
Average home price in zip code
(60607)
Average sf: 1350

Mary Bartelme Park
LPS Methodology Page 26 of 32
Average price:
$
251,500.00
Average sf price:
$
186.30
Difference from
average sf price
Percent
increase Currently listed for sale
Sale
year Price Square ft.
Cost per
sf
100 S Sangamon St Apt 4s --- $ 899,000.00 1946 $ 461.97 $ 275.68 147.98%
850 W Adams Apt 4b --- $ 700,000.00 2200 $ 318.18 $ 131.89 70.79%
842 W Adams St Apt FL2 --- $ 310,000.00 --- --- --- ---
950 W Monroe St Apt 916 --- $ 685,000.00 1600 $ 428.13 $ 241.83 129.81%
949 W Madison St Apt 404 --- $ 245,000.00 --- --- --- ---
111 S Morgan St Apt 307 --- $ 384,900.00 1121 $ 343.35 $ 157.06 84.31%
949 W Madison St Apt 401 --- $ 399,900.00 1200 $ 333.25 $ 146.95 78.88%
Average: $ 517,685.71 Average: 102.35%
Sale pending
111 S Morgan St Apt 523 2015 $ 390,000.00 1121 $ 347.90 $ 161.61 86.75%
1025 W Monroe St Apt 3E 2015 $ 555,000.00 1600 $ 346.88 $ 160.58 86.20%
Average: $ 472,500.00 Average: 86.47%
Sold
950 W Monroe St Apt 803 2015 $ 400,000.00 --- --- --- ---
939 W Madison St Apt 405 2015 $ 368,000.00 1300 $ 283.08 $ 96.78 51.95%
901 W Madison St Unit 712 2014 $ 368,500.00 --- --- --- ---
1040 W Adams St Unit 321 2014 $ 372,000.00 1200 $ 310.00 $ 123.70 66.40%
950 W Monroe St Unit 701 2014 $ 375,000.00 1572 $ 238.55 $ 52.25 28.05%
1040 W Adams St Unit 248 2014 $ 380,000.00 1250 $ 304.00 $ 117.70 63.18%
939 W Madison St Apt 410 2015 $ 380,000.00 1300 $ 292.31 $ 106.01 56.90%
1040 W Adams St Unit 327 2014 $ 382,000.00 1265 $ 301.98 $ 115.68 62.09%
949 W Madison St Apt 201 2015 $ 390,500.00 1300 $ 300.38 $ 114.09 61.24%

Mary Bartelme Park
LPS Methodology Page 27 of 32
933 W Van Buren St Apt 501 2015 $ 435,000.00 1464 $ 297.13 $ 110.83 59.49%
843 W Adams St Apt 506 2015 $ 295,500.00 970 $ 304.64 $ 118.34 63.52%
Average: $ 376,954.55 Average: 56.98%
Zillow was the source for all
property data
The location of Mary Bartelme Park in relation to the boundary for the 60607 zip code.
Map from Google Maps.
Source:
All real estate data was collected from Zillow.com
Zip code demographic information retrieved from: http://www.movoto.com/chicagoil/
60607/demographics/
Email correspondence with local real estate agent Armando Chacon, Principal of The
Armando Chacon Group

Mary Bartelme Park
LPS Methodology Page 28 of 32
http://www.wbez.org/news/uber-gentrification-force-chicagos-west-loop-111257
Cost Comparison
Installation cost estimates for an irrigation system for the turf areas were
calculated with a low and high estimate per square foot, $0.70 and $1.00 respectively.
At these estimated costs, installation of an irrigation system for the turf areas (52,370 sf)
were estimated at between $36,659.00 and $52,370.00. This results in a median
estimated construction cost of $44,514.50.
In addition to the initial installation costs, the irrigation system would have
incurred yearly costs including spring start up ($500.00), fall shut down ($500.00), back
flow preventer testing ($100.00), and other miscellaneous repairs due to damage from
lawn mowers and park users ($1,000.00). Those yearly costs total up to $2,100.00 in
yearly expenditures, before taking into account water usage.
Water usage was estimated based on the system being operational from May 1
through October 31, a span of 30 weeks. If the system provides the required 1.5” of
water every other week, it would apply 1.5” of water 15 different times per season.
Each application would require approximately 48,690 gallons of water to provide the
required amount of water. At the city of Chicago’s current water rate of $3.81 per 1000
gallons, each application would cost $185.51 in water consumption fees. 15
applications would result in a water bill of $2,782.70 per year.
In total the decision to exclude an irrigation system from the project saved an
estimated $44,514.50 in construction costs and an addition $4,882.70 per year in
maintenance and water fees.
Appendix
Mary Bartelme Survey Questions
Mary Bartelme Park Benefit Impact Study: Regular Park Users

Mary Bartelme Park
LPS Methodology Page 29 of 32
Survey #____
Geographic Radius of Users/Visitors 1. How did you get to the park? (check one or more) ☐ Foot (incl. skateboard)
☐ Bicycle
☐ Automobile (incl. motorbike)
☐Taxi
☐Public Transit (incl. local bus or train)
2. How long was your trip to the park today?
☐ Less than 5 mins.
☐ 5-10 mins.
☐ 10-20 mins.
☐ 20-30 mins.
☐ 30+ mins.
What is your zip code? _______________(see attached map) Frequency/Appeal 3. Prior to this visit, how often do you visit Mary Bartelme Park?
☐ Daily
☐ Weekly
☐ Seasonally
☐ Special events
☐ This is my first visit
4. What feature(s) do you come to the park for?
☐ Water feature
☐ Dog park
☐ Playground
☐ Wild flower plantings
☐ City views
☐ Other_______________
5. If you were thinking about relocating your home or business, would this park have motivated you to move into the surrounding area?
☐ Yes
☐ No
To what extent? Definitely would motivate Definitely would not motivate
Mary Bartelme Park
LPS Methodology Page 30 of 32
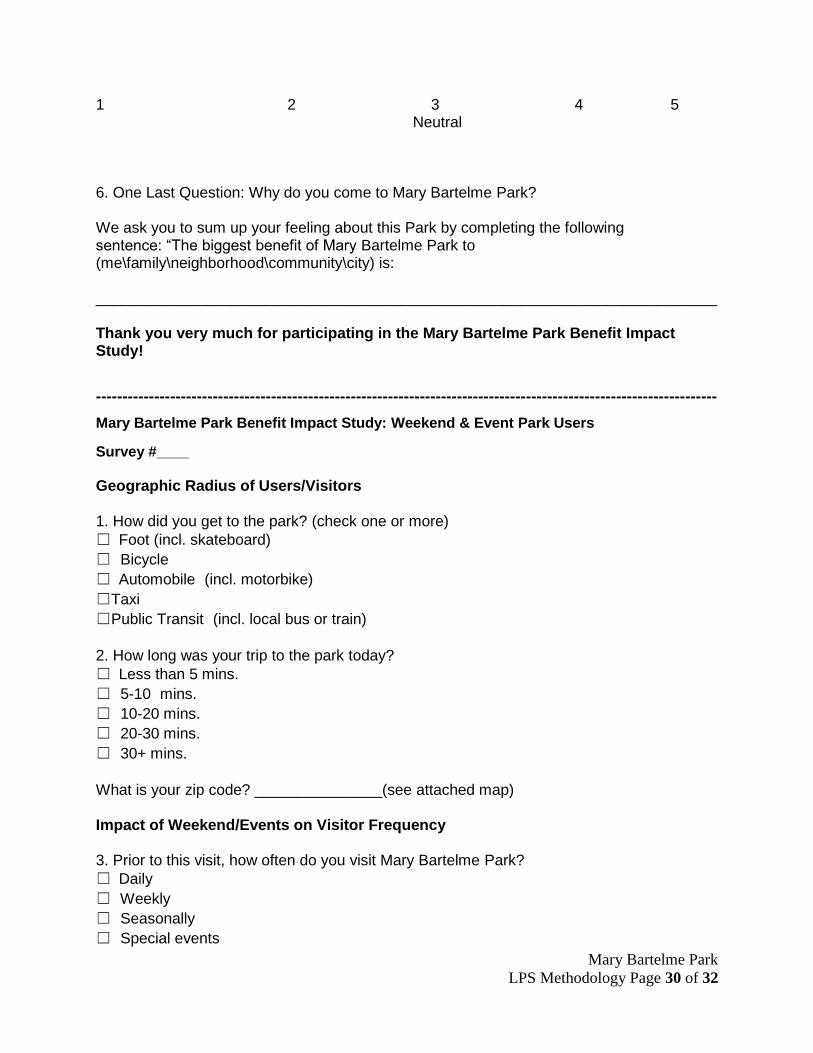
1 2 3 4 5 Neutral
6. One Last Question: Why do you come to Mary Bartelme Park? We ask you to sum up your feeling about this Park by completing the following sentence: “The biggest benefit of Mary Bartelme Park to (me\family\neighborhood\community\city) is: _________________________________________________________________________ Thank you very much for participating in the Mary Bartelme Park Benefit Impact Study!
---------------------------------------------------------------------------------------------------------------------
Mary Bartelme Park Benefit Impact Study: Weekend & Event Park Users
Survey #____
Geographic Radius of Users/Visitors 1. How did you get to the park? (check one or more) ☐ Foot (incl. skateboard)
☐ Bicycle
☐ Automobile (incl. motorbike)
☐Taxi
☐Public Transit (incl. local bus or train)
2. How long was your trip to the park today?
☐ Less than 5 mins.
☐ 5-10 mins.
☐ 10-20 mins.
☐ 20-30 mins.
☐ 30+ mins.
What is your zip code? _______________(see attached map) Impact of Weekend/Events on Visitor Frequency 3. Prior to this visit, how often do you visit Mary Bartelme Park?
☐ Daily
☐ Weekly
☐ Seasonally
☐ Special events

Mary Bartelme Park
LPS Methodology Page 31 of 32
☐ This is my first visit
4. (OPTION #1) Has attending the Park this weekend influenced the likelihood that you might revisit this park during a regular weekday (M/T/W/Th/F)?
☐ Yes
☐ No
To what extent? Strongly wish to visit again Definitely will not revisit 1 2 3 4 5
Neutral
4. (OPTION #2) Has attending this park event influenced the likelihood of you revisiting this park during a regular weekday (M/T/W/Th/F)?
☐ Yes
☐ No
To what extent? Strongly wish to visit again Definitely will not revisit 1 2 3 4 5
Neutral
5. One Last Question: Why do you come to Mary Bartelme Park? We ask you to sum up your feeling about this Park by completing the following sentence: “The biggest benefit of Mary Bartelme Park to (me\family\neighborhood\community\city) is: _________________________________________________________________________ Thank you very much for participating in the Mary Bartelme Park Benefit Impact Study!
---------------------------------------------------------------------------------------------------------------------
Additional Information
A couple of the construction details that were developed for the rubber play surface at Mary
Bartelme Park are now being used as standard details at other Chicago area parks. For reference,
those details can be found below:

Mary Bartelme Park
LPS Methodology Page 32 of 32


