
1 Copyright 2011. All rights reserved. Copyright 2011. All rights reserved.
INTERNET TRENDS – Web 2.0 Summit San Francisco, CA Mary Meeker – October 18, 2011
www.kpcb.com/internettrends2011
2 Copyright 2011. All rights reserved.
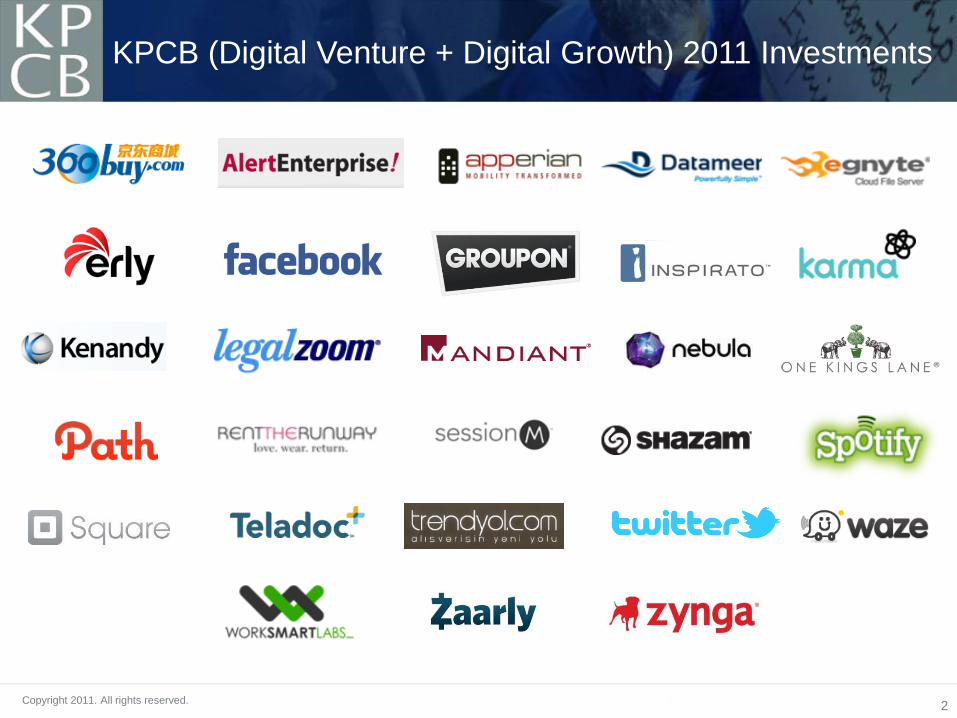
KPCB (Digital Venture + Digital Growth) 2011 Investments

3 Copyright 2011. All rights reserved.
Internet Trends
1. Globality – We Aren‟t In Kansas Anymore…
2. Mobile – Early Innings Growth, Still…
3. User Interface – Text Graphical Touch / Sound / Move
4. Commerce – Fast / Easy / Fun / Savings = More Important Than Ever…
5. Advertising – Lookin‟ Good…
6. Content Creation – Changed Forever
7. Technology / Mobile Leadership – Americans Should Be Proud
8. Mega-Trend of 21st Century = Empowerment of People via Connected
Mobile Devices
9. Authentic Identity – The Good / Bad / Ugly. But Mostly Good?
10. Economy – Lots of Uncertainty
11. USA Inc. – Pay Attention!
12. Closing Thoughts

Copyright 2011. All rights reserved.
GLOBALITY –
WE AREN’T IN KANSAS
ANYMORE…
5 Copyright 2011. All rights reserved.
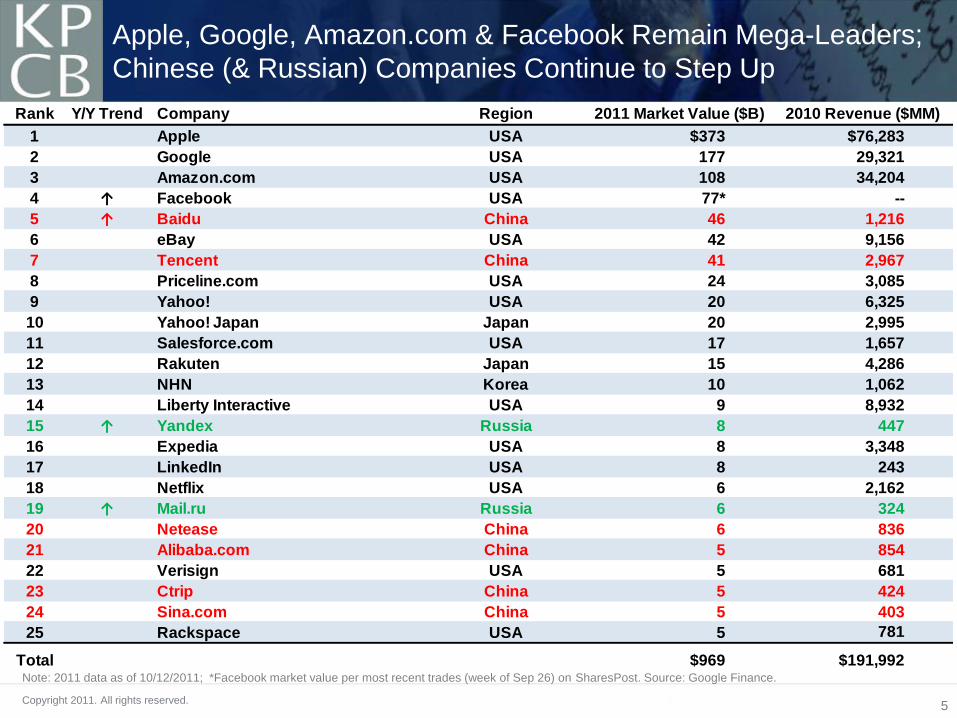
Apple, Google, Amazon.com & Facebook Remain Mega-Leaders;
Chinese (& Russian) Companies Continue to Step Up
Note: 2011 data as of 10/12/2011; *Facebook market value per most recent trades (week of Sep 26) on SharesPost. Source: Google Finance.
Rank Y/Y Trend Company Region 2011 Market Value ($B) 2010 Revenue ($MM)
1 Apple USA $373 $76,283
2 Google USA 177 29,321
3 Amazon.com USA 108 34,204
4 ↑ Facebook USA 77* --
5 ↑ Baidu China 46 1,216
6 eBay USA 42 9,156
7 Tencent China 41 2,967
8 Priceline.com USA 24 3,085
9 Yahoo! USA 20 6,325
10 Yahoo! Japan Japan 20 2,995
11 Salesforce.com USA 17 1,657
12 Rakuten Japan 15 4,286
13 NHN Korea 10 1,062
14 Liberty Interactive USA 9 8,932
15 ↑ Yandex Russia 8 447
16 Expedia USA 8 3,348
17 LinkedIn USA 8 243
18 Netflix USA 6 2,162
19 ↑ Mail.ru Russia 6 324
20 Netease China 6 836
21 Alibaba.com China 5 854
22 Verisign USA 5 681
23 Ctrip China 5 424
24 Sina.com China 5 403
25 Rackspace USA 5 781
Total $969 $191,992

6 Copyright 2011. All rights reserved.
81% of Users of Top Global Internet Properties =
Outside USA
0 200 400 600 800 1,000 1,200
Baidu
VEVO
Tencent
Apple
Amazon.com
Wikipedia
Yahoo!
Microsoft
Monthly Unique Visitors (MM)
USA Users
International Users
Top 10 Internet Properties by Global Monthly Unique Visitors, 8/11
Source: comScore Global, 8/11.

7 Copyright 2011. All rights reserved.
In 3 Years, China Added More Internet Users than Exist in USA…
China / India / Nigeria / Russia / Iran = Biggest Adders
Note: *Russia data as of 6/10; all other data as of 12/10. Source: United Nations / International Telecommunications Union.
Rank Country
07-10 Internet
User Additions
(MMs)
2010 Internet
Users (MMs) Y/Y Growth
Population
Penetration
1 China 246 459 20% 34%
2 India 42 88 43 8
3 Nigeria 35 45 2 28
4 Russia 25 60 0 42
5 Iran 24 37 31 49
6 USA 22 244 2 79
7 Brazil 21 79 4 41
8 Philippines 18 23 292 25
9 Mexico 13 35 24 31
10 Pakistan 12 29 43 17
Top 10 457 1,099 16% 29%
World 693 2,054 13% 30%

8 Copyright 2011. All rights reserved.
6.8
7.2
7.4
7.4
8.5
8.9
9.0
9.7
10.2
10.3
10.8
11.1
0 2 4 6 8 10 12
USA
Peru
Mexico
Canada
Colombia
Venezuela
Philippines
Russia
Chile
Turkey
Argentina
Israel
Hours Spent on Social Networking Sites per User per Month (8/11)
Social Networkers (October, 2011) Exceed Internet Users
(December, 2006) & 70% of Them (800MM) Use Facebook
Source: Social Networking users & time spent data per comScore, Internet users data per ITU, Facebook data per Facebook.
9 Copyright 2011. All rights reserved.
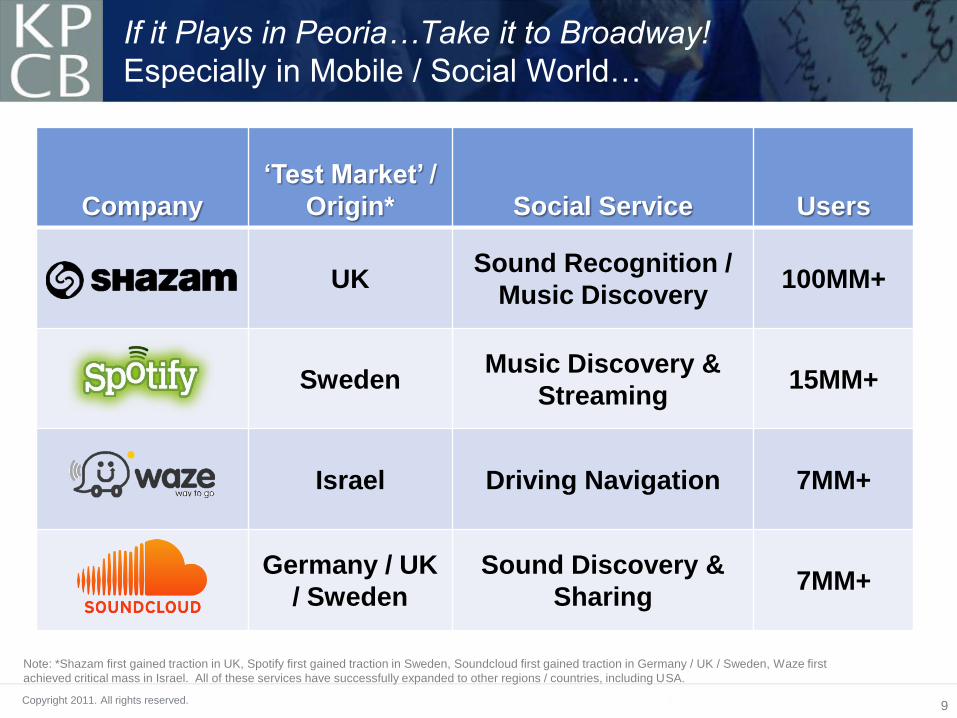
Company
‘Test Market’ /
Origin* Social Service Users
UK Sound Recognition /
Music Discovery 100MM+
Sweden Music Discovery &
Streaming 15MM+
Israel Driving Navigation 7MM+
Germany / UK
/ Sweden
Sound Discovery &
Sharing 7MM+
If it Plays in Peoria…Take it to Broadway!
Especially in Mobile / Social World…
Note: *Shazam first gained traction in UK, Spotify first gained traction in Sweden, Soundcloud first gained traction in Germany / UK / Sweden, Waze first
achieved critical mass in Israel. All of these services have successfully expanded to other regions / countries, including USA.

Copyright 2011. All rights reserved.
MOBILE –
EARLY INNINGS GROWTH, STILL
11 Copyright 2011. All rights reserved.
0%
20%
40%
60%
80%
100%
1920 1925 1930 1935 1940 1945 1950 1955 1960 1965 1970 1975 1980 1985 1990 1995 2000 2005 2010
Po
pu
lati
on
Pe
ne
tra
tio
n (
%)
AM Radio
TV
Internet
Mobile Internet (Smartphone)
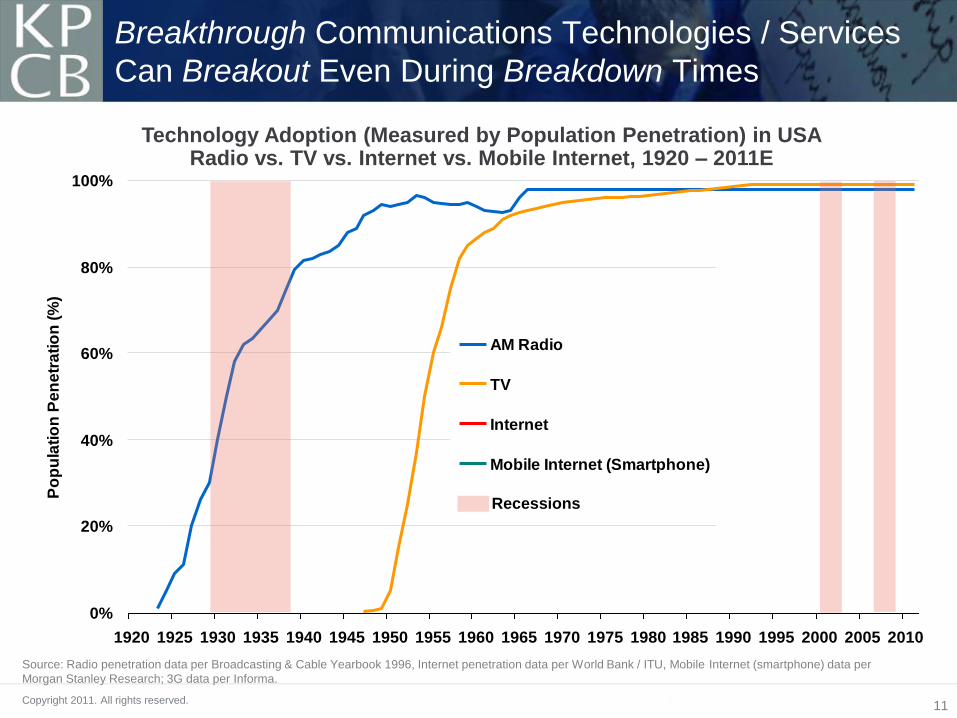
Breakthrough Communications Technologies / Services
Can Breakout Even During Breakdown Times
Technology Adoption (Measured by Population Penetration) in USA Radio vs. TV vs. Internet vs. Mobile Internet, 1920 – 2011E
Source: Radio penetration data per Broadcasting & Cable Yearbook 1996, Internet penetration data per World Bank / ITU, Mobile Internet (smartphone) data per
Morgan Stanley Research; 3G data per Informa.
Recessions

12 Copyright 2011. All rights reserved.
Note: *3G includes CDMA 1x EV-DO and Rev. A/B, WCDMA, HSPA; One user may have multiple mobile subscriptions and may be counted as multiple
subscriber. Source: Informa WCIS+.
Global 3G Stats: Subscribers = 936MM Penetration = 17% Growth = 35%
35% Y/Y Global Mobile 3G Subscriber Growth
to 936MM (17% of all Mobile Subscribers), Q2:11
Rank Country
Q2:11 3G
Subs
(MM)
3G
Penetra-
tion
3G Sub
Y/Y
Growth Rank Country
Q2:11 3G
Subs
(MM)
3G
Penetra-
tion
3G Sub
Y/Y
Growth
1 USA 179 56% 26% 16 Canada 15 58% 47%
2 Japan 117 97 10 17 Taiwan 14 48 28
3 Korea 43 82 10 18 Portugal 12 73 21
4 China 40 4 172 19 Turkey 11 17 104
5 Italy 40 47 22 20 Malaysia 10 28 22
6 UK 39 51 35 21 South Africa 9 16 34
7 Germany 33 32 24 22 Sweden 9 69 35
8 Spain 30 53 23 23 Mexico 9 9 85
9 Brazil 28 13 79 24 Philippines 9 10 87
10 Indonesia 27 12 40 25 Saudi Arabia 9 18 18
11 Poland 26 54 24 26 Netherlands 8 40 41
12 France 25 39 29 27 Austria 7 54 29
13 India 23 3 1,050 28 Vietnam 6 6 103
14 Australia 20 71 22 29 Israel 6 58 16
15 Russia 15 7 59 30 Argentina 5 10 102

13 Copyright 2011. All rights reserved.
Smartphones Surpassed Feature Phone Shipments in
W. Europe (Q2:10) / USA (Q1:11); ROW to Follow
0%
20%
40%
60%
80%
100%
Q1:08 Q3:08 Q1:09 Q3:09 Q1:10 Q3:10 Q1:11
% o
f Q
ua
rte
rly
Mo
bile
Ph
on
e S
hip
me
nts
North America
Western Europe
Rest of World (ex. Japan)
Smartphone Shipments as % of Total Mobile Phone Shipments by Region, Q1:08 – Q2:11
Source: Data per Ehud Gelblum, Morgan Stanley Research. Note: In Japan, smartphone exceeded feature phone in Q4:08.
50%
Smartphone > Feature
Phone Shipments

14 Copyright 2011. All rights reserved.
Despite Tremendous Ramp So Far,
Smartphone Usage Still Has Huge Upside
0
1,000
2,000
3,000
4,000
5,000
6,000
Smartphone Users Mobile Phone Users
Glo
ba
l U
se
rs (
MM
)
Global Smartphone vs. Mobile Phone Subscribers, 2011E
Source: Smartphone subscriber estimates per Morgan Stanley Research; Mobile phone subscribers per Informa (as of Q2:11).
Note: While there are 936MM global 3G subscribers as of Q2:11, not all of them were smartphone users. One user may have multiple mobile subscriptions,
therefore actual user #s may be lower than subscriber #s.
835MM
Smartphone
Subscribers
5.6B Mobile
Phone Subscribers
15 Copyright 2011. All rights reserved.
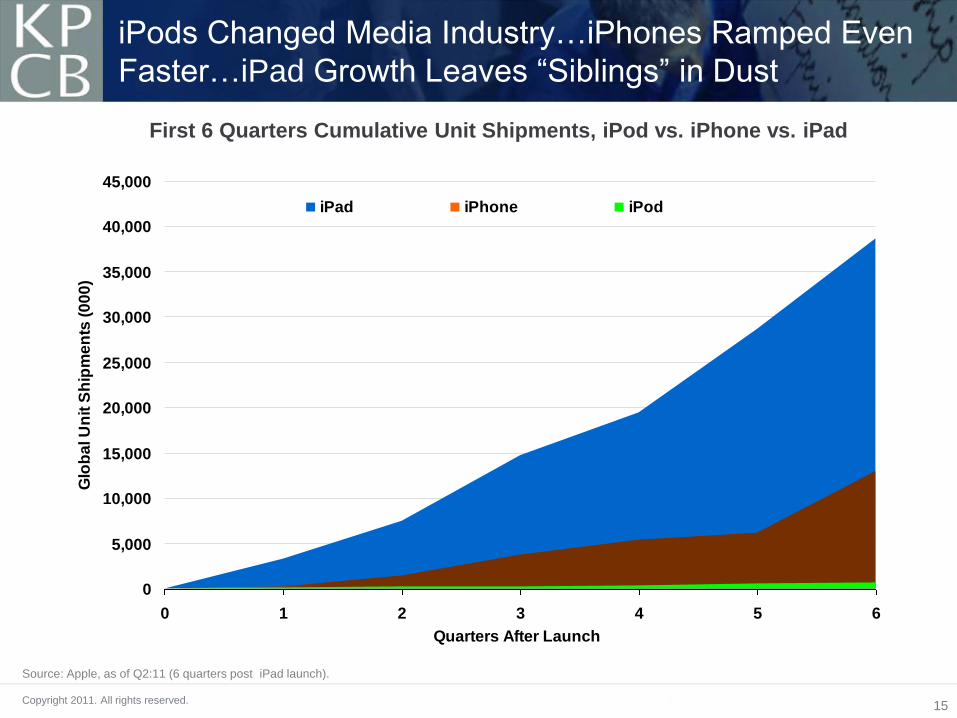
First 6 Quarters Cumulative Unit Shipments, iPod vs. iPhone vs. iPad
Source: Apple, as of Q2:11 (6 quarters post iPad launch).
iPods Changed Media Industry…iPhones Ramped Even
Faster…iPad Growth Leaves “Siblings” in Dust
0
100
200
300
400
500
600
700
0 1 2 3 4 5 6
Quarters After Launch
Glo
ba
l U
nit
Sh
ipm
en
ts (
00
0)
iPad iPhone iPod
-1,000
1,000
3,000
5,000
7,000
9,000
11,000
13,000
15,000
0 1 2 3 4 5 6
Quarters After Launch
Glo
ba
l U
nit
Sh
ipm
en
ts (
00
0)
iPad iPhone iPod
0
5,000
10,000
15,000
20,000
25,000
30,000
35,000
40,000
45,000
0 1 2 3 4 5 6
Quarters After Launch
Glo
ba
l U
nit
Sh
ipm
en
ts (
00
0)
iPad iPhone iPod
16 Copyright 2011. All rights reserved.
0
20
40
60
80
100
120
140
160
180
0 1 2 3 4 5 6 7 8 9 10 11
Quarters After Launch
Glo
ba
l C
um
ula
tiv
e U
nit
Sh
ipm
en
ts (
MM
)
Android Global Units Shipped iPhone
0
20
40
60
80
100
120
140
160
180
0 1 2 3 4 5 6 7 8 9 10 11
Quarters After Launch
Glo
ba
l C
um
ula
tiv
e U
nit
Sh
ipm
en
ts (
MM
)
Android iPhone
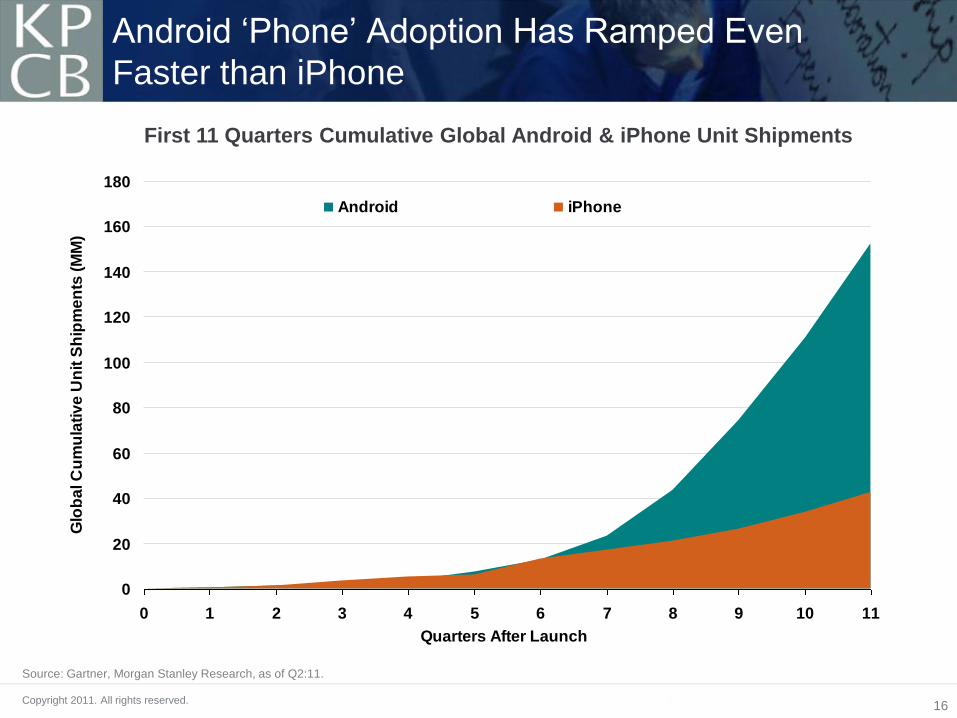
Android „Phone‟ Adoption Has Ramped Even
Faster than iPhone
First 11 Quarters Cumulative Global Android & iPhone Unit Shipments
Source: Gartner, Morgan Stanley Research, as of Q2:11.

17 Copyright 2011. All rights reserved.
Two Horse Races in Smartphones & Tablets, So Far
Apple
iPhone
Android
Apple
iPad
Amazon
Kindle
Cumulative Shipments
as of Q2:10 129MM 152MM 29MM 16MMa
ASP** $606 <$600 $650 <$200
Launch Date Q2:07 Q4:08 Q2:10 Q4:07
Smartphones Tablets
Note: a) Kindle shipment estimates per Scott Devitt, Morgan Stanley Research. ** ASP is average selling price, data are estimates for Android and Kindle.
Source: Apple, Morgan Stanley Research.

18 Copyright 2011. All rights reserved.
5%
60%
55%
1%
33%
%
25%
50%
75%
2008 2009 2010 2011
% o
f T
raff
ic f
rom
Mo
bil
e
Pandora
Mobile Usage –
Big & Ramping Fast
% of Traffic From Mobile Devices, Pandora, Twitter & Facebook, 2008 – 2011
Source: Pandora S1, Twitter, Facebook.

19 Copyright 2011. All rights reserved.
Mobile Search –
Growing Rapidly
19
Google US Mobile Queries (Indexed), 2007 – 2011
120
100
80
60
40
20
0
2007 2008 2009 2010 2011
4x Growth in past years
Source: Google.

20 Copyright 2011. All rights reserved.
Mobile Advertising –
Ramping Quickly in all Geographies
InMobi – # of Fortune 1000 Companies Launching Mobile Ad Campaigns &
Quarterly Smartphone Ad Impressions, 10/09-9/11
3 4 8
25 37
62
138
203
250
0
50
100
150
200
250
0
5
10
15
20
25
10/09 1/10 4/10 7/10 10/10 1/11 4/11 7/11 9/11
# o
f G
lob
al F
ort
un
e 1
00
0 A
dve
rtis
ers
Qu
art
erl
y S
ma
rtp
ho
ne
Mo
bil
e A
d
Imp
res
sio
ns
(B
)
Africa
South America
Middle East
Europe
North America
Asia
# of Global Fortune 1000 Advertisers
Source: InMobi.

21 Copyright 2011. All rights reserved.
Global Mobile App + Advertising Revenue =
$12B in 2011E Revenue, Up 17x in 3 Years
Source: Gartner. CAGR is compound annual growth rate.
Note: Apple has paid >$3B $‟s to developers as of 9/11, implying gross app market revenue of $4B in 3 years; Google indicated during CQ3 earnings call that it expects
$2.5B mobile ad revenue in 2011E
$0
$5
$10
$15
2008 2009 2010 2011E
Mo
bile A
d +
Ap
ps S
pen
din
g (
$B
) Mobile Apps
Mobile Advertising
Global Mobile App + Advertising Revenue, 2008 vs. 2011E
$12B
$0.7B

22 Copyright 2011. All rights reserved.
„Hierarchy of Needs‟ Revisited?
Esteem
Belonging
Safety
Physiological
Self-
Actualization
Internet / Mobile Phone
Shelter
Food / Water
Note: Created for discussion purposes and a bit of humor. Not intended to discredit Maslow's hierarchy, which we believe to be accurate.
Originally presented in Morgan Stanley‟s “The Age of Engagement” presentation, dated April 2005
1943 – Maslow 2011 – ? ;)

Copyright 2011. All rights reserved.
USER INTERFACE –
TEXT GRAPHICAL
TOUCH / SOUND / MOVE

24 Copyright 2011. All rights reserved.
What Has One Insanely Great Designer / Entertainer /
Leader / Businessman Wrought?
Before Steve Jobs…
computers were utilitarian tools for
computation.
After Steve…
computers became beautiful objects we could
use in thousands of ways to aim to make life
better.
Steve’s design aesthetic was second to none.

25 Copyright 2011. All rights reserved.
Text Touch / Sound / Move Graphical
Natural User Interface Revolution – Now in Touch / Sound / Move Era
1980s 1990s 2000s

26 Copyright 2011. All rights reserved.
ONLINE AUDIO
4B+ Bluetooth
Enabled Devices
Noise Cancellation /
Better Audio Quality
Headsets
High Quality / Compact
Wireless Speakers
Connected
Car Audio
Sound Recognition +
Understanding
Sound Creation +
Sharing
Source: Bluetooth enabled devices shipment per iSuppli and Instat, assumes a 2.5 year replacement cycle.
The Next Big Thing(s)? Those Two Big Things on the Sides of Your Head…

27 Copyright 2011. All rights reserved.
Sound is going to be bigger than video…
‘Record’ is the new QWERTY.
- Alexander Ljung, Founder & CEO, SoundCloud
Perhaps its Time to Hear About the Ear

Copyright 2011. All rights reserved.
COMMERCE –
FAST / EASY / FUN / SAVINGS =
MORE IMPORTANT THAN EVER…

29 Copyright 2011. All rights reserved.
USA Retail Sales & eCommerce Y/Y Growth Rates, Q1:03 –Q2:11
Note: eCommerce sales excludes travel, auto and auctions. Source: U.S. Census Bureau, comScore.
-10%
0%
10%
20%
30%
Q1:03 Q1:04 Q1:05 Q1:06 Q1:07 Q1:08 Q1:09 Q1:10 Q1:11
US
A R
eta
il S
ale
s &
eC
om
me
rce
Y/Y
Gro
wth
Ra
tes
U.S. Retail E-Commerce Sales
U.S. Total Retail Sales
eCommerce = Four Quarters of Accelerating Growth

30 Copyright 2011. All rights reserved.
USA eCommerce % Share(1) of Total Retail Sales, Q1:04 – Q4:13E
0%
2%
4%
6%
8%
10%
12%
Q1:04 Q1:05 Q1:06 Q1:07 Q1:08 Q1:09 Q1:10 Q1:11 Q1:12
eC
om
me
rce
as
% o
f To
tal
Re
tail
Sa
les
eCommerce Penetration Linear Trendline (y=0.1443x + 4.0428, R^2=0.8512)
eCommerce
Penetration
8% in Q2:11
eCommerce Continues to Gain Share from Offline…
at 8% Share of USA Commerce with Lots of Headroom
Note: (1) : e-Commerce share is shown as a percent of DOC‟s Total Retail Sales excluding Food Service &
Drinking, Food & Bev. Stores, Motor Vehicles & Parts, Gasoline Stations and Health & Personal Care Stores
Source: US Dept. of Commerce, comScore.
31 Copyright 2011. All rights reserved.
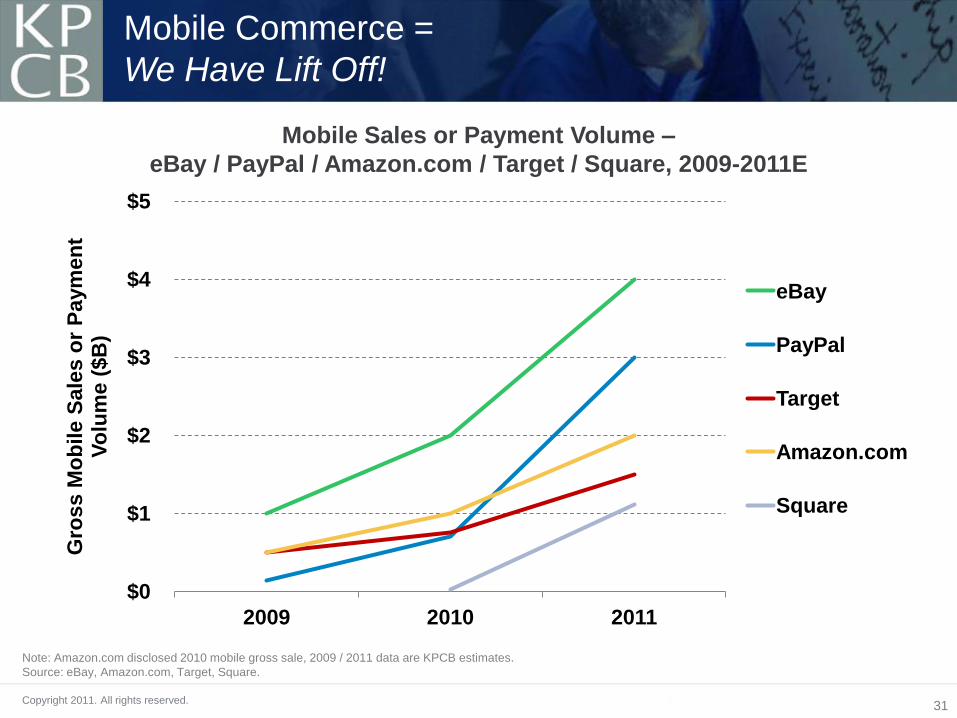
Mobile Commerce =
We Have Lift Off!
$0
$1
$2
$3
$4
$5
2009 2010 2011
Gro
ss M
ob
ile S
ale
s o
r P
aym
en
t V
olu
me (
$B
)
eBay
PayPal
Target
Amazon.com
Square
Mobile Sales or Payment Volume –
eBay / PayPal / Amazon.com / Target / Square, 2009-2011E
Note: Amazon.com disclosed 2010 mobile gross sale, 2009 / 2011 data are KPCB estimates.
Source: eBay, Amazon.com, Target, Square.

32 Copyright 2011. All rights reserved.
Old Magazine Paradigm Finally Comes Alive = It’s a Bird, It’s a Plane? It‟s Click & Buy (on Mobile Device)…

33 Copyright 2011. All rights reserved.
In a Mobile-ized / Transparent World = Pricing Matters A LOT!
Source: comScore US smartphone user survey, 7/11.
Note: the same survey also indicated that 50% of USA smartphone users have used their smartphones to find a nearby store. So while mobile Internet is helping
drive foot traffic to local stores, it is also helping make pricing info more transparent for the consumers.
52%
51%
34%
21%
17%
7%
1%
Found it online for a better price
Found it at another store for a better price
Saw a negative review about the item
I bought a similar item instead
It was not available in-store
No longer needed the item
None of the above
% of Respondents
Reasons for In-Store Purchase Abandonment Among USA Smartphone Users, 7/11

34 Copyright 2011. All rights reserved.
Local Commerce = Rejuvenated by Mobile
LOCAL
COMMERCE
Payments + Inventory
Management
Reviews + Business
Information / Leads Check Ins + Driving
Foot Traffic
Coupons + Demand
Generation
20MM+ Users* 40MM+ Users* 15MM+ Users* 2MM+ Users*
Note: *Users are comScore USA‟s aggregate
monthly unique visitor data for companies listed
under each category.
Total USA local advertising for 2011E is $68B, per
Morgan Stanley Research.

Copyright 2011. All rights reserved.
ADVERTISING –
LOOKIN’ GOOD…

36 Copyright 2011. All rights reserved.
8%
16%
43%
25%
8%
27%
11%
43%
19%
0.5% 0%
10%
20%
30%
40%
50%
Print Radio TV Internet Mobile
% o
f To
tal M
ed
ia C
on
su
mp
tio
n T
ime
o
r A
dve
rtis
ing
Sp
en
din
g
Time Spent Ad Spend
% of Time Spent in Media vs. % of Advertising Spending, USA 2010
~$20B Opportunity
in USA
Media Time Spent vs. Ad Spend Still Out of Whack Internet / Mobile (upside…) vs. Print (downside…)
Note: Print includes newspaper and magazine. $20B opportunity calculated assuming Internet and Mobile ad spend
share equal their respective time spent share. Source: eMarketer, 3/11.
37 Copyright 2011. All rights reserved.
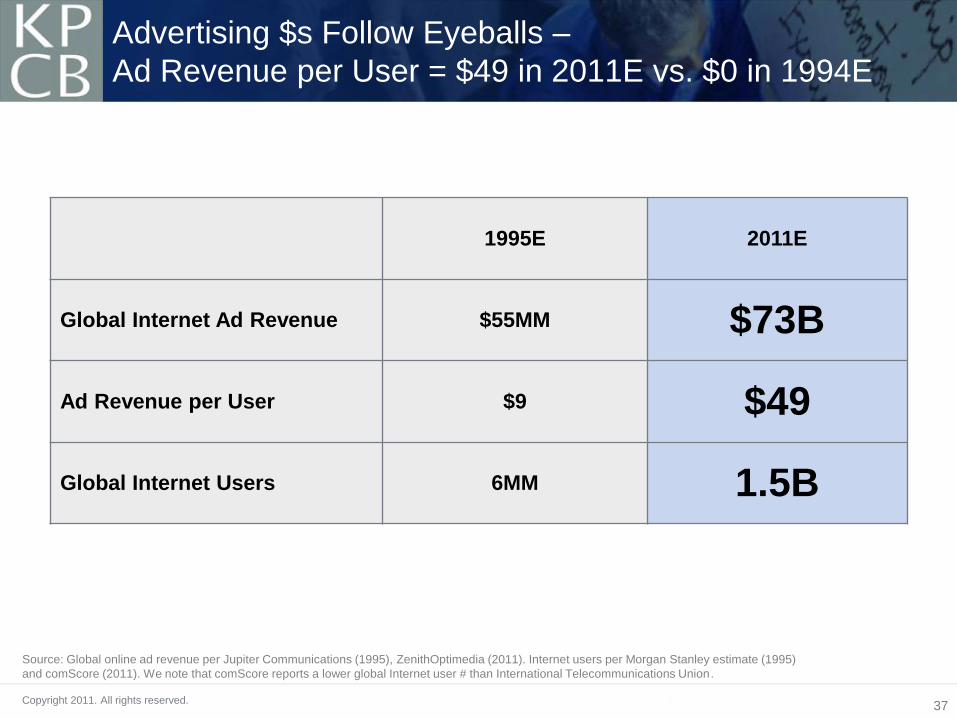
Advertising $s Follow Eyeballs –
Ad Revenue per User = $49 in 2011E vs. $0 in 1994E
1995E 2011E
Global Internet Ad Revenue $55MM $73B
Ad Revenue per User $9 $49
Global Internet Users 6MM 1.5B
Source: Global online ad revenue per Jupiter Communications (1995), ZenithOptimedia (2011). Internet users per Morgan Stanley estimate (1995)
and comScore (2011). We note that comScore reports a lower global Internet user # than International Telecommunications Union.

38 Copyright 2011. All rights reserved.
Google Paid Clicks & Cost-Per-Click Continue to Grow Rapidly;
Mobile Helping
Q2:10 Q3:10 Q4:10 Q1:11 Q2:11 Q3:11
Gross Advertising
Revenue ($MM) $6,562 $7,032 $8,167 $8,306 $8,716 $9,335
Y/Y Growth 23% 22% 26% 28% 33% 33%
Aggregate Paid Clicks
(MM) 12,651 13,157 14,669 15,245 15,004 16,876
Y/Y Growth 15% 16% 18% 17% 18% 28%
Cost per Click (CPC - $) $0.52 $0.53 $0.56 $0.54 $0.58 $0.55
Y/Y Growth 7% 6% 7% 10% 12% 4%
Source: Google, Morgan Stanley Research.
39 Copyright 2011. All rights reserved.
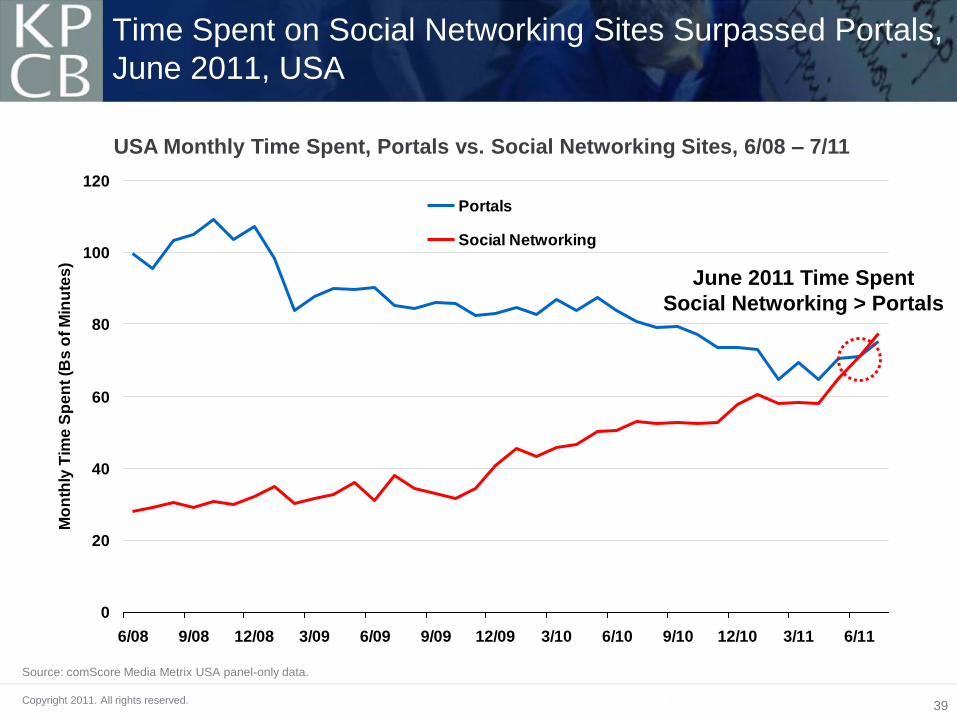
Time Spent on Social Networking Sites Surpassed Portals,
June 2011, USA
USA Monthly Time Spent, Portals vs. Social Networking Sites, 6/08 – 7/11
Source: comScore Media Metrix USA panel-only data.
0
20
40
60
80
100
120
6/08 9/08 12/08 3/09 6/09 9/09 12/09 3/10 6/10 9/10 12/10 3/11 6/11
Mo
nth
ly T
ime
Sp
en
t (B
s o
f M
inu
tes
)
Portals
Social Networking
Sites
June 2011 Time Spent
Social Networking > Portals

40 Copyright 2011. All rights reserved.
30%
21%
14%
11%
10%
5%
3%
2%
2%
0% 10% 20% 30% 40%
Social Networking
Portals
Entertainment
News / Information
Sports
Online Gaming
Directories
Business / Finance
Share of Total US Online Display Ad Units
$3.80
$2.45
$4.25
$5.30
$0.89
$6.00
$2.70
$9.90
$0 $5 $10 $15
CPM ($)
Share of Total USA Online Display Ad Units (as of 8/11) + CPM (as of Q3:11), by Top Publisher Categories
Social Networking CPMs =
Have Begun to Punch Closer to Their Weight
Source: comScore, Display ad unit share as of 8/11, CPM data per Vivaki, as of Q3:11.

Copyright 2011. All rights reserved.
CONTENT CREATION –
CHANGED FOREVER…
42 Copyright 2011. All rights reserved.
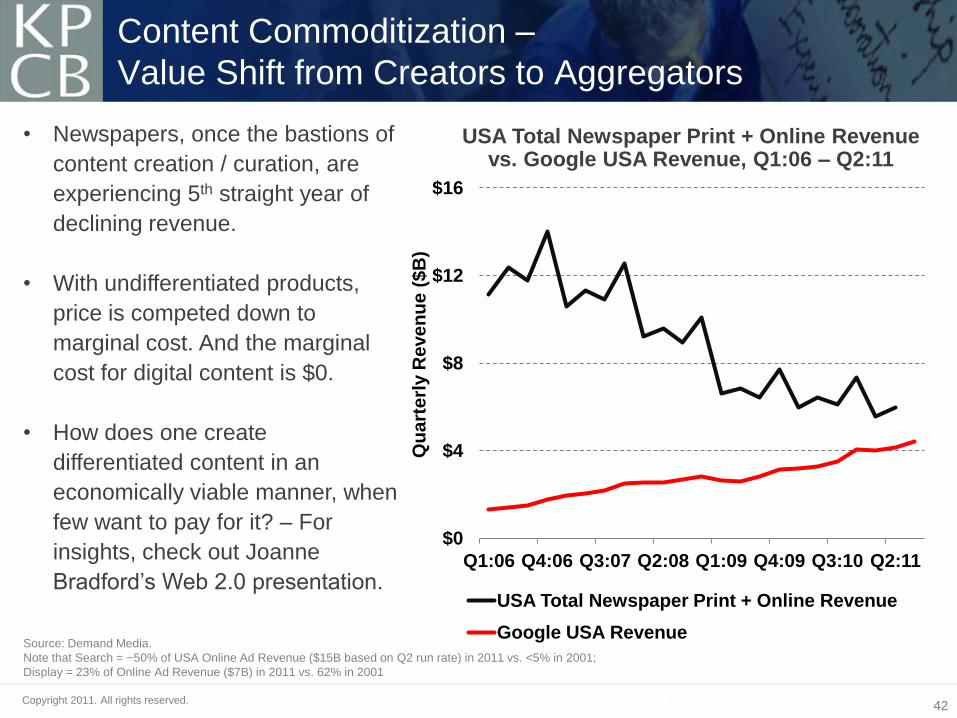
Content Commoditization –
Value Shift from Creators to Aggregators
• Newspapers, once the bastions of
content creation / curation, are
experiencing 5th straight year of
declining revenue.
• With undifferentiated products,
price is competed down to
marginal cost. And the marginal
cost for digital content is $0.
• How does one create
differentiated content in an
economically viable manner, when
few want to pay for it? – For
insights, check out Joanne
Bradford‟s Web 2.0 presentation.
Source: Demand Media.
Note that Search = ~50% of USA Online Ad Revenue ($15B based on Q2 run rate) in 2011 vs. <5% in 2001;
Display = 23% of Online Ad Revenue ($7B) in 2011 vs. 62% in 2001
$0
$4
$8
$12
$16
Q1:06 Q4:06 Q3:07 Q2:08 Q1:09 Q4:09 Q3:10 Q2:11
Qu
art
erl
y R
eve
nu
e (
$B
)
USA Total Newspaper Print + Online Revenue
Google USA Revenue
USA Total Newspaper Print + Online Revenue vs. Google USA Revenue, Q1:06 – Q2:11

Copyright 2011. All rights reserved.
TECHNOLOGY / MOBILE
LEADERSHIP –
AMERICANS SHOULD BE PROUD

44 Copyright 2011. All rights reserved.
• Smartphones + tablets outshipped PCs
(notebooks + desktops) in Q4:10.
• Windows operating system fell to
installation on <50% of Internet-enabled
devices in Q2:10.
We are Living Through a Once Every 10-20 Years
Technology Evolution – The Mobile Computing Cycle…
Source: Morgan Stanley Research, Gartner.

45 Copyright 2011. All rights reserved.
„Made in USA‟ Smartphone Operating Systems =
64% Share from 5% Five Years Ago
2005 2011E
0%
20%
40%
60%
80%
100%
Ma
rke
t S
ha
re o
f S
ma
rtp
ho
ne
OS
Other OS
iOS
Android
Windows Mobile
BlackBerry OS
Linux
Nokia Symbian
Smartphone Operating System Market Share, 2005 vs. 2011E
Source: Morgan Stanley Research, Gartner.
46 Copyright 2011. All rights reserved.
• Pace of innovation in Silicon Valley may be
unprecedented.
• Intensity / focus / leadership of USA-based
companies (Apple / Google / Amazon.com /
Facebook) may be unprecedented.
• Combination of technology improvements and
elegant design may be unprecedented.
Still Early-Innings Era of Smart-Phones to Smarter-Phones
Copyright 2011. All rights reserved.
MEGA-TREND OF 21ST
CENTURY = EMPOWERMENT OF PEOPLE VIA
CONNECTED MOBILE DEVICES

48 Copyright 2011. All rights reserved.
16 Minutes Before / After Japan Earthquake on 3/11/11 Snapshots of @replies From & To Twitter Users in Japan
2:30pm Japan Time
Before Earthquake / Tsunami 2:46pm Japan Time
After Earthquake / Tsunami
Note: Yellow lines indicate tweets coming out of Japan; Pink lines indicate tweets coming into Japan. Source: Twitter.
Global Information Flow -
Real-Time + Fast + Broad
In 140-character bites, the story unfolded: the shock and terror; the sense of human
frailty mixed with lifesaving information; the messages of those seeking comfort and
those seeing some kind of divine retribution, all mixing at hyper-speed.
– LATimes, 3/11/11

49 Copyright 2011. All rights reserved.
• 85% of world‟s population covered by
commercial wireless signals, providing
greater reach vs. electrical grid (80%).*
• 200MM+ farmers in India receiving
government payments / subsidies via mobile
devices.**
Global Information Flow –
Remote Locations Getting Connected
Source: *GSM Association, United Nations. **There are 90MM Kisan credit card users and 118MM job card users, both of which do not require bank
accounts but utilize mobile phones as identity verification / payment confirmation, per Ministry of Rural Development, Government of India.
50 Copyright 2011. All rights reserved.
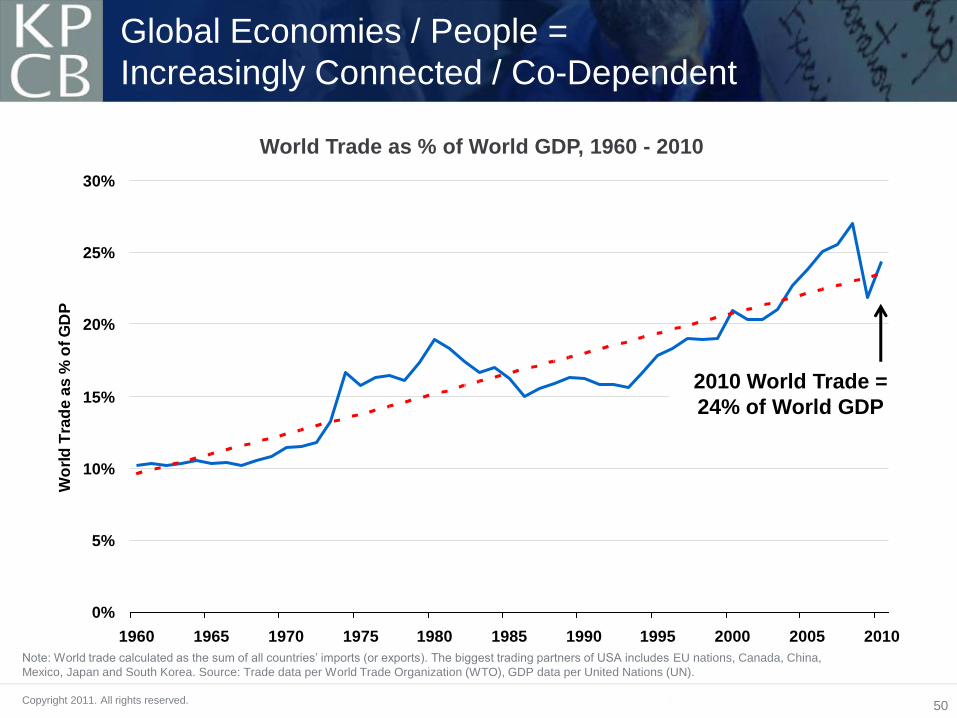
Global Economies / People =
Increasingly Connected / Co-Dependent
World Trade as % of World GDP, 1960 - 2010
Note: World trade calculated as the sum of all countries‟ imports (or exports). The biggest trading partners of USA includes EU nations, Canada, China,
Mexico, Japan and South Korea. Source: Trade data per World Trade Organization (WTO), GDP data per United Nations (UN).
0%
5%
10%
15%
20%
25%
30%
1960 1965 1970 1975 1980 1985 1990 1995 2000 2005 2010
Wo
rld
Tra
de
as
% o
f G
DP
2010 World Trade =
24% of World GDP

Copyright 2011. All rights reserved.
AUTHENTIC IDENTITY –
THE GOOD / BAD / UGLY.
BUT MOSTLY GOOD?
52 Copyright 2011. All rights reserved.
Authentic Identity – The Good / Bad / Ugly.
But Mostly Good?
With 800MM global active Facebook users…50% that log on in any given
day…with an average of 130 friends…and an average of 80 community
pages / groups / events…and more than 250MM photos uploaded per day
and 350MM active mobile users…*
And 835MM smartphone users (likely ramping to 1.4B within two years)…
It’s hard to hide. The ‘truth’ is often just a photo/click–send away.
‘Clean, well-lighted place to do business?’ ‘People are basically good?’
In a world with tremendous uncertainty – owing to the rapid ramp in
always-on, connected citizens of the world, perhaps, the world is on the
cusp of being safer than ever?
There are lots of sacrifices. This is new terrain.
Only time will tell how all this plays out…
Source: Facebook, 10/11.

Copyright 2011. All rights reserved.
ECONOMY –
LOTS OF UNCERTAINTY

54 Copyright 2011. All rights reserved.
Stock Market Volatility =
2x Historical Average, Illustrating Uncertainty
0%
20%
40%
60%
80%
100%
1990 1992 1994 1996 1998 2000 2002 2004 2006 2008 2010
VIX
In
de
x V
alu
e (
%)
Chicago Board Options Exchange (CBOE) Volatility Index (VIX), 1990 – 2011 YTD
Note: Data as of 10/11. VIX is a measure of implied volatility of S&P 500 index options.
Source: CBOE, Morgan Stanley Research.
1990-2011
Average = 20%
Current (10/11)
Level = 40%

55 Copyright 2011. All rights reserved.
Consumer Confidence =
Well Below Historical Average, Illustrating Uncertainty
0
20
40
60
80
100
120
140
160
1978 1980 1982 1984 1986 1988 1990 1992 1994 1996 1998 2000 2002 2004 2006 2008 2010
Co
ns
um
er
Co
nfi
de
nc
e I
nd
ex
(19
85
=1
00
)
The Conference Board Consumer Confidence Index, 1978 – 2011 YTD
Note: Index started in 1967 / benchmarked to 1985=100. The Index is calculated each month on the basis of a household survey of consumers'
opinions on current conditions and future expectations of the economy. Source: The Conference Board, 10/11.
30 Year Average
CCI = 92.7
2/09 Trough
CCI = 25.3
10/11
CCI = 45.4
56 Copyright 2011. All rights reserved.
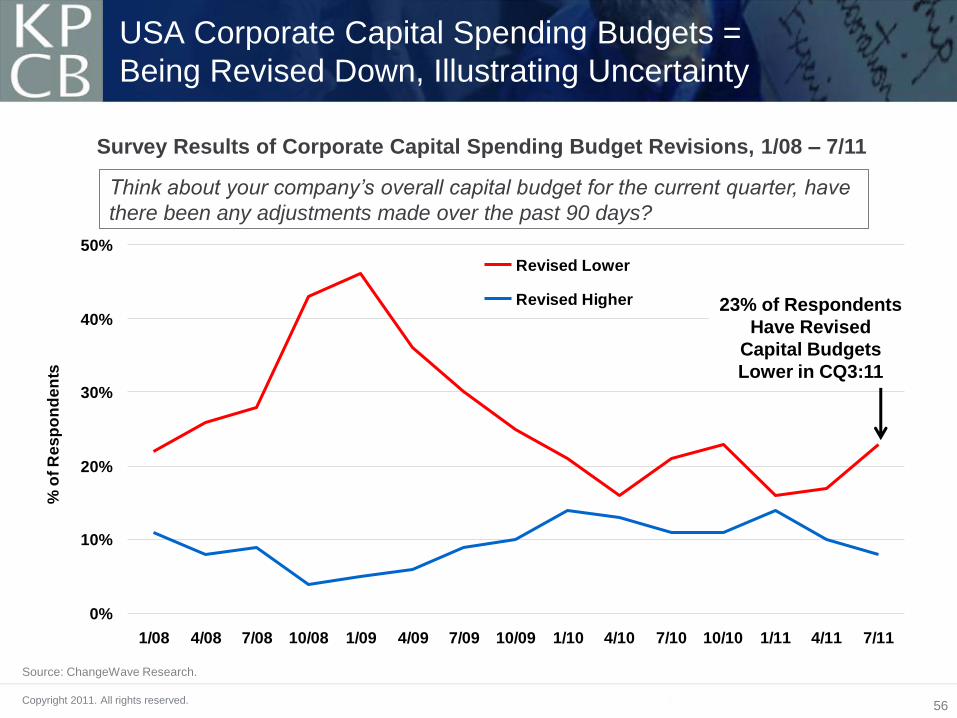
USA Corporate Capital Spending Budgets =
Being Revised Down, Illustrating Uncertainty
Survey Results of Corporate Capital Spending Budget Revisions, 1/08 – 7/11
Source: ChangeWave Research.
0%
10%
20%
30%
40%
50%
1/08 4/08 7/08 10/08 1/09 4/09 7/09 10/09 1/10 4/10 7/10 10/10 1/11 4/11 7/11
% o
f R
es
po
nd
en
ts
Revised Lower
Revised Higher 23% of Respondents
Have Revised
Capital Budgets
Lower in CQ3:11
Think about your company’s overall capital budget for the current quarter, have
there been any adjustments made over the past 90 days?

57 Copyright 2011. All rights reserved.
GDP Growth Forecasts =
Being Revised Down, Illustrating Uncertainty
Country / Region 2009 2010 2011E 2012E 2011E 2012E
USA -3.5% 3.0% 1.5% 1.8% -1.0% -0.9%
Euro Zone -4.3 1.8 1.6 1.1 -0.4 -0.6
UK -4.9 1.4 1.1 1.6 -0.4 -0.7
Japan -6.3 4.0 -0.5 2.3 0.2 -0.6
China 9.2 10.3 9.5 9.0 -0.1 -0.5
India 6.8 10.1 7.8 7.5 -0.4 -0.3
Russia -7.8 4.0 4.3 4.1 -0.5 -0.4
Brazil -0.6 7.5 3.8 3.6 -0.3 0.0
Developed Markets -3.7 3.1 1.6 1.9 -0.6 -0.7
Emerging Markets 2.8 7.3 6.4 6.1 -0.2 -0.3
World -0.7 5.1 4.0 4.0 -0.3 -0.5
IMF Forecasts, 9/11
Difference from 6/11
IMF Forecasts
Note: Data is annual GDP percent change. Source: IMF World Economic Outlook, 9/11.

58 Copyright 2011. All rights reserved.
Stock Markets = Often Leading Indicators of Economic Activity Russia -33% from 52-Week High; Oil (-24%) / China (-23%) / Europe (-23%) / S&P500
(-12%) / Nasdaq (-9%)
60%
80%
100%
120%
140%
160%
180%
1/10 3/10 5/10 7/10 9/10 11/10 1/11 3/11 5/11 7/11 9/11
Ind
ex
Va
lue
(1
/1/2
01
0 =
10
0%
)
S&P500 NASDAQ China Shanghai Composite MSCI Europe Russia RTS Oil Gold
Stock / Commodity Markets Performance (% Change From 1/10), 1/10 – 10/11
Note: All values are indexed to 1 (100%) on Jan 1, 2010. Data as of 10/17/11.
Source: Morgan Stanley Research, Yahoo! Finance.
New 2-Week Trendline?

Copyright 2011. All rights reserved.
USA INC. –
PAY ATTENTION!

60 Copyright 2011. All rights reserved.
$0
$2
$4
$6
$8
$10
$12
$14
$16
0%
10%
20%
30%
40%
50%
1901 1911 1921 1931 1941 1951 1961 1971 1981 1991 2001 2011E
Rea
l G
DP
(in
Tri
llio
ns o
f 2
00
5 D
olla
rs)
Reve
nu
e &
Ex
pen
se
s a
s %
of
GD
P
Revenue as % of GDP (Left Axis)
Expenses as % of GDP (Left Axis)
Real GDP (Right Axis)
America‟s Revenue & Expenses as % of GDP Over 110 Years;
Current State = Revenue Problem? Spending Problem?
USA Inc. Revenue & Expenses as % of GDP, 1901 – 2011E
Source: 1910 – 1930 per Census Bureau, 1940-2010 per White House OMB. Real GDP adjusted for inflation, in 2005 dollars.
Biggest Peace Time Gap
Between Revenue &
Expenses in USA History
61 Copyright 2011. All rights reserved.
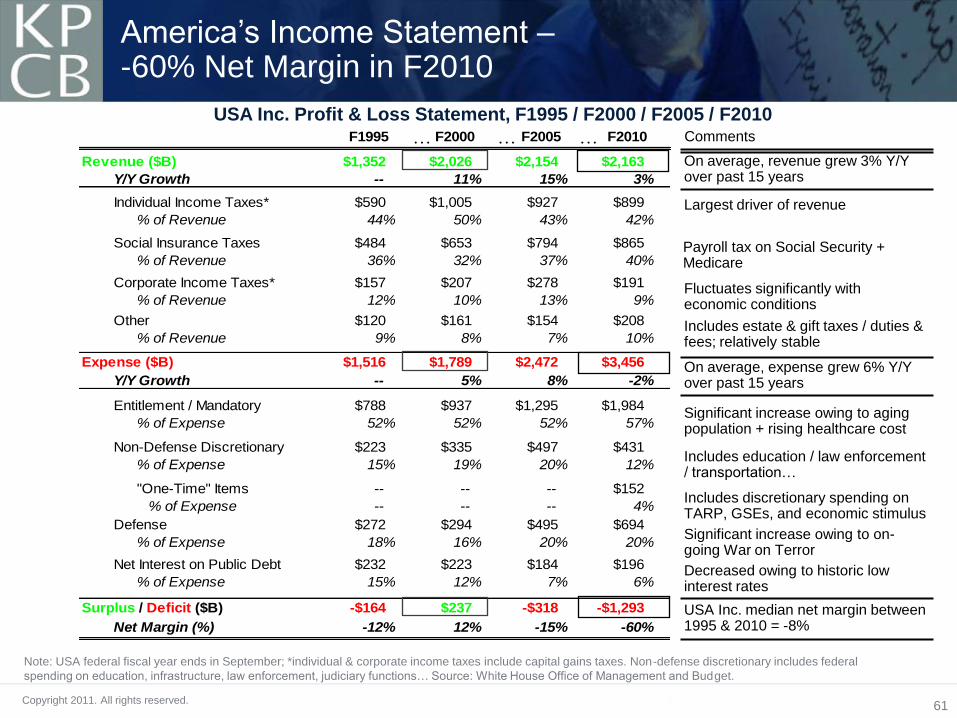
F1995 F2000 F2005 F2010
Revenue ($B) $1,352 $2,026 $2,154 $2,163
Y/Y Growth -- 11% 15% 3%
Individual Income Taxes* $590 $1,005 $927 $899
% of Revenue 44% 50% 43% 42%
Social Insurance Taxes $484 $653 $794 $865
% of Revenue 36% 32% 37% 40%
Corporate Income Taxes* $157 $207 $278 $191
% of Revenue 12% 10% 13% 9%
Other $120 $161 $154 $208
% of Revenue 9% 8% 7% 10%
Expense ($B) $1,516 $1,789 $2,472 $3,456
Y/Y Growth -- 5% 8% -2%
Entitlement / Mandatory $788 $937 $1,295 $1,984
% of Expense 52% 52% 52% 57%
Non-Defense Discretionary $223 $335 $497 $431
% of Expense 15% 19% 20% 12%
"One-Time" Items -- -- -- $152
% of Expense -- -- -- 4%
Defense $272 $294 $495 $694
% of Expense 18% 16% 20% 20%
Net Interest on Public Debt $232 $223 $184 $196
% of Expense 15% 12% 7% 6%
Surplus / Deficit ($B) -$164 $237 -$318 -$1,293
Net Margin (%) -12% 12% -15% -60%
USA Inc. Profit & Loss Statement, F1995 / F2000 / F2005 / F2010
Note: USA federal fiscal year ends in September; *individual & corporate income taxes include capital gains taxes. Non-defense discretionary includes federal
spending on education, infrastructure, law enforcement, judiciary functions… Source: White House Office of Management and Budget.
… … … Comments
On average, revenue grew 3% Y/Y over past 15 years
Largest driver of revenue
Fluctuates significantly with economic conditions
Includes estate & gift taxes / duties & fees; relatively stable
Includes education / law enforcement / transportation…
Significant increase owing to on-going War on Terror
USA Inc. median net margin between 1995 & 2010 = -8%
Decreased owing to historic low interest rates
America‟s Income Statement – -60% Net Margin in F2010
Payroll tax on Social Security + Medicare
Significant increase owing to aging population + rising healthcare cost
Includes discretionary spending on TARP, GSEs, and economic stimulus
On average, expense grew 6% Y/Y over past 15 years

62 Copyright 2011. All rights reserved.
America‟s Debt Level Relative to Other Countries –
You Do the Math…
Note: Ranking excludes countries with gross government debt less than $10MM in 2010. Gross government debt includes
intragovernment obligations (such as Treasuries held by the Social Security Trust Fund in US‟ case).
Source: The International Monetary Fund (IMF).
Rank Country
2010 Gross
Government Debt
($MM) % of GDP Rank Country
2010 Gross
Government Debt
($MM) % of GDP
1 Japan $12,009 220% 16 Hungary $105 80%
2 Jamaica 19 143 17 Israel 168 77
3 Greece 436 143 18 UK 1,699 76
4 Lebanon 53 134 19 Egypt 161 74
5 Iraq 97 120 20 Austria 272 72
6 Italy 2,445 119 21 Sudan 47 72
7 Belgium 452 97 22 Brazil 1,397 67
8 Singapore 214 96 23 Jordan 18 67
9 Ireland 196 95 24 Côte d'Ivoire 15 67
10 USA 13,707 94 25 India 1,046 64
11 Portugal 213 93 26 Netherlands 497 64
12 Iceland 12 92 27 Cyprus 14 61
13 Germany 2,759 84 28 Spain 848 60
14 Canada 1,324 84 29 Uruguay 23 57
15 France 2,110 82 30 Pakistan 100 57
63 Copyright 2011. All rights reserved.
USA Inc. @ kpcb.com / youtube.com / amazon.com
90K+ Total Views 14K+ YouTube Views 7K+ Facebook Likes 2K+ Retweets

Copyright 2011. All rights reserved.
CLOSING THOUGHTS

65 Copyright 2011. All rights reserved.
Economy – Often darkest before dawn. At least
we know what the problems are. Now we need
the resolve to fix them. Across-the-board
sacrifice needed.
Tech Industry – Wow! Unprecedented times! If
you can keep your head when all about you
are losing theirs…*
*Rudyard Kipling - ‘If’

66 Copyright 2011. All rights reserved.
The information offered in this presentation speaks to industry trends in general,
and should not be construed as providing any particular recommendations or
analysis for any specific company that is mentioned in this presentation. KPCB is
a venture capital firm that owns significant equity positions in certain of the
companies referenced in this presentation.
Disclosure


